Report on Erta Ale (Ethiopia) — May 2020
Bulletin of the Global Volcanism Network, vol. 45, no. 5 (May 2020)
Managing Editor: Edward Venzke.
Edited by Kadie L. Bennis.
Erta Ale (Ethiopia) Continued lava flow outbreaks and thermal anomalies during November 2019 to early April 2020
Please cite this report as:
Global Volcanism Program, 2020. Report on Erta Ale (Ethiopia) (Bennis, K.L., and Venzke, E., eds.). Bulletin of the Global Volcanism Network, 45:5. Smithsonian Institution. https://doi.org/10.5479/si.GVP.BGVN202005-221080
Erta Ale
Ethiopia
13.601°N, 40.666°E; summit elev. 585 m
All times are local (unless otherwise noted)
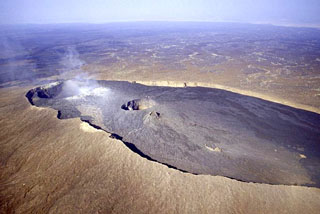
Erta Ale is a shield volcano located in Ethiopia and contains multiple active pit craters in the summit and southeastern caldera. Volcanism has been characterized by lava flows and large lava flow fields since 2017. Surficial lava flow activity continued within the southeastern caldera during November 2019 until early April 2020; source information was primarily from various satellite data.
The number of days that thermal anomalies were detected using MODIS data in MODVOLC and NASA VIIRS satellite data was notably higher in November and December 2019 (figure 96); the number of thermal anomalies in the Sentinel-2 thermal imagery was substantially lower due to the presence of cloud cover. Across all satellite data, thermal anomalies were identified for 29 days in November, followed by 30 days in December. After December 2019, the number of days thermal anomalies were detected decreased; hotspots were detected for 17 days in January 2020 and 20 days in February. By March, these thermal anomalies became rare until activity ceased. Thermal anomalies were identified during 1-4 March, with weak anomalies seen again during 26 March-8 April 2020.
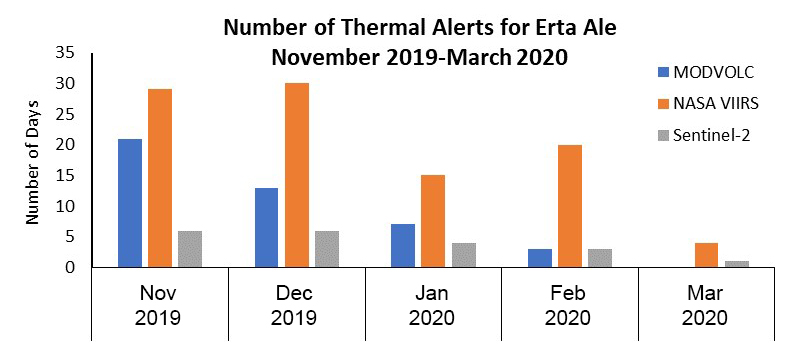 |
Figure 96. Graph comparing the number of thermal alerts using calendar dates using MODVOLC, NASA VIIRS, and Sentinel-2 satellite data for Erta Ale during November 2019-March 2020. Data courtesy of HIGP - MODVOLC Thermal Alerts System, NASA Worldview using the “Fire and Thermal Anomalies” layer, and Sentinel Hub Playground. |
MIROVA (Middle Infrared Observation of Volcanic Activity) analysis of MODIS satellite data showed frequent strong thermal anomalies from 18 April through December 2019 (figure 97). Between early August 2019 and March 2020, these thermal signatures were detected at distances less than 5 km from the summit. In late December the thermal intensity dropped slightly before again increasing, while at the same time moving slightly closer to the summit. Thermal anomalies then became more intermittent and steadily decreased in power over the next two months.
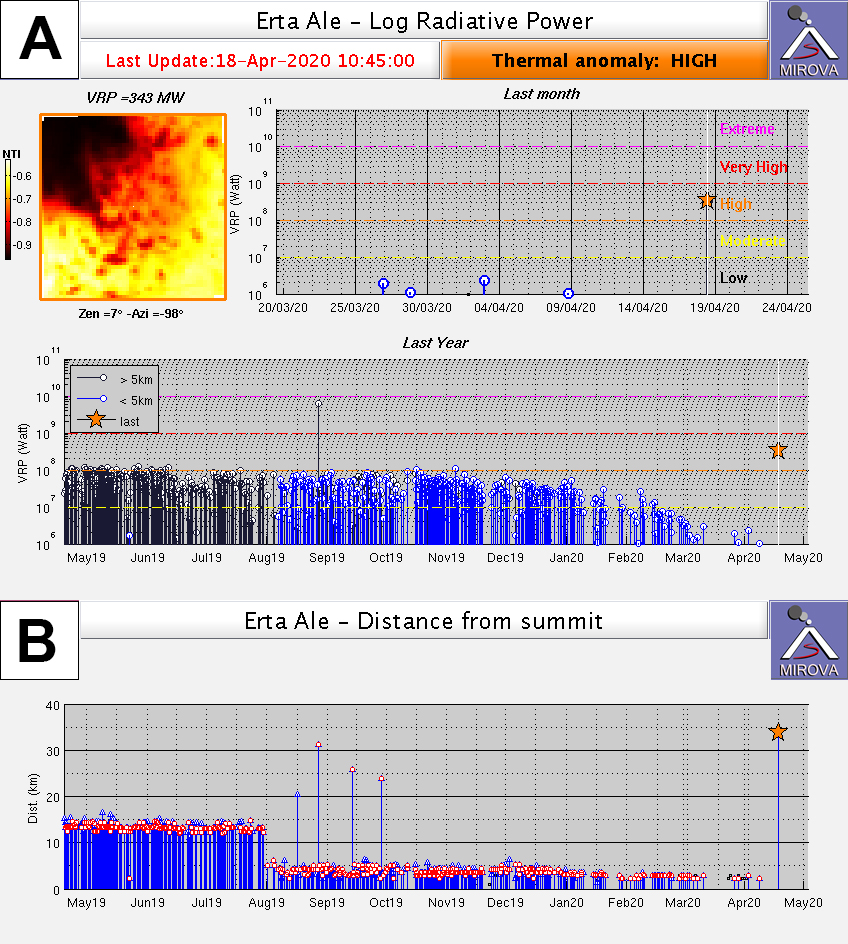 |
Figure 97. Two time-series plots of thermal anomalies from Erta Ale from 18 April 2019 through 18 April 2020 as recorded by the MIROVA system. The top plot (A) shows that the thermal anomalies were consistently strong (measured in log radiative power) and occurred frequently until early January 2020 when both the power and frequency visibly declined. The lower plot (B) shows these anomalies as a function of distance from the summit, including a sudden decrease in distance (measured in kilometers) in early August 2019, reflecting a change in the location of the lava flow outbreak. A smaller distance change can be identified at the end of December 2019. Courtesy of MIROVA. |
Unlike the obvious distal breakouts to the NE seen previously (BGVN 44:04 and 44:11), infrared satellite imagery during November-December 2019 showed only a small area with a thermal anomaly near the NE edge of the Southeast Caldera (figure 98). A thermal alert was seen at that location using the MODVOLC system on 28 December, but the next day it had been replaced by an anomaly about 1.5 km WSW near the N edge of the Southeast Caldera where the recent flank eruption episode had been centered between January 2017 and January 2018 (BGVN 43:04). The thermal anomaly that was detected in the summit caldera was no longer visible after 9 January 2020, based on Sentinel-2 imagery. The exact location of lava flows shifted within the same general area during January and February 2020 and was last detected by Sentinel-2 on 4 March. After about two weeks without detectable thermal activity, weak unlocated anomalies were seen in VIIRS data on 26 March and in MODIS data on the MIROVA system four times between 26 March and 8 April. No further anomalies were noted through the rest of April 2020.
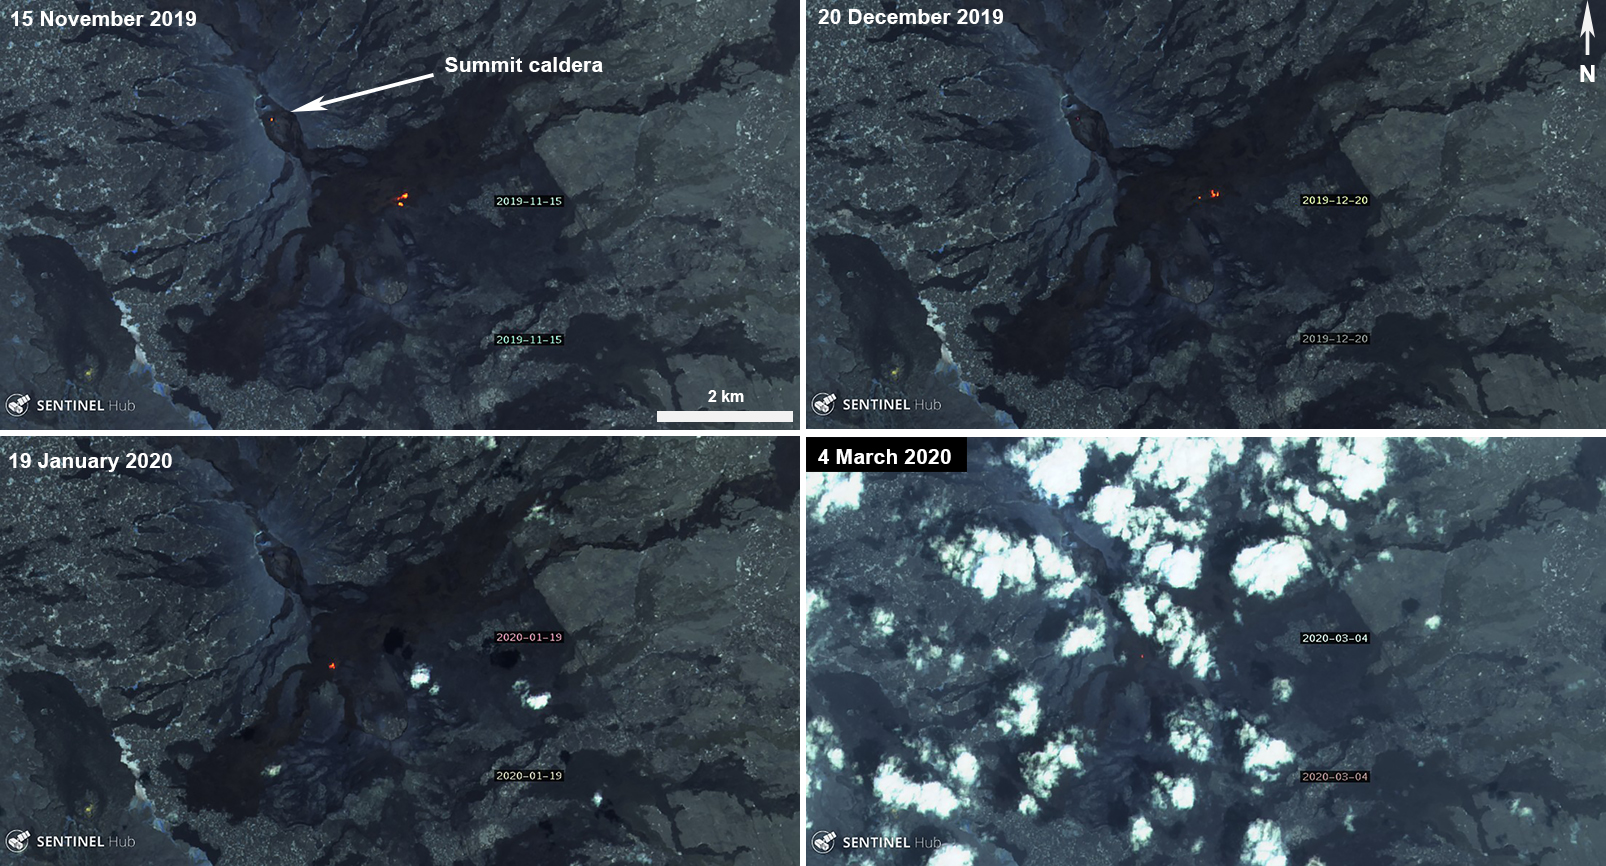 |
Figure 98. Sentinel-2 thermal satellite imagery of Erta Ale volcanism between November 2019 and March 2020 showing small lava flow outbreaks (bright yellow-orange) just NE of the southeastern calderas. A thermal anomaly can be seen in the summit crater on 15 November and very faintly on 20 December 2019. Imagery on 19 January 2020 showed a small thermal anomaly near the N edge of the Southeast Caldera where the recent flank eruption episode had been centered between January 2017 and January 2018. The last weak thermal hotspot was detected on 4 March (bottom right). Sentinel-2 satellite images with “Atmospheric penetration” (bands 12, 11, 8A) rendering; courtesy of Sentinel Hub Playground. |
Geological Summary. The Erta Ale basaltic shield volcano in Ethiopia has a 50-km-wide edifice that rises more than 600 m from below sea level in the Danakil depression. The volcano includes a 0.7 x 1.6 km summit crater hosting steep-sided pit craters. Another larger 1.8 x 3.1 km wide depression elongated parallel to the trend of the Erta Ale range is located SE of the summit and is bounded by curvilinear fault scarps on the SE side. Basaltic lava flows from these fissures have poured into the caldera and locally overflowed its rim. The summit caldera usually also holds at least one long-term lava lake that has been active since at least 1967, and possibly since 1906. Recent fissure eruptions have occurred on the N flank.
Information Contacts: MIROVA (Middle InfraRed Observation of Volcanic Activity), a collaborative project between the Universities of Turin and Florence (Italy) supported by the Centre for Volcanic Risk of the Italian Civil Protection Department (URL: http://www.mirovaweb.it/); Hawai'i Institute of Geophysics and Planetology (HIGP) - MODVOLC Thermal Alerts System, School of Ocean and Earth Science and Technology (SOEST), Univ. of Hawai'i, 2525 Correa Road, Honolulu, HI 96822, USA (URL: http://modis.higp.hawaii.edu/); Sentinel Hub Playground (URL: https://www.sentinel-hub.com/explore/sentinel-playground); NASA Worldview (URL: https://worldview.earthdata.nasa.gov/).