Report on Karangetang (Indonesia) — June 2020
Bulletin of the Global Volcanism Network, vol. 45, no. 6 (June 2020)
Managing Editor: Edward Venzke.
Edited by A. Elizabeth Crafford.
Karangetang (Indonesia) Incandescent block avalanches through mid-January 2020; crater anomalies through May
Please cite this report as:
Global Volcanism Program, 2020. Report on Karangetang (Indonesia) (Crafford, A.E., and Venzke, E., eds.). Bulletin of the Global Volcanism Network, 45:6. Smithsonian Institution. https://doi.org/10.5479/si.GVP.BGVN202006-267020
Karangetang
Indonesia
2.781°N, 125.407°E; summit elev. 1797 m
All times are local (unless otherwise noted)
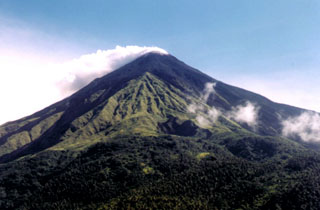
The Karangetang andesitic-basaltic stratovolcano (also referred to as Api Siau) at the northern end of the island of Siau, north of Sulawesi, Indonesia, has had more than 50 observed eruptions since 1675. Frequent explosive activity is accompanied by pyroclastic flows and lahars, and lava-dome growth has created two active summit craters (Main to the S and Second Crater to the N). Rock avalanches, observed incandescence, and satellite thermal anomalies at the summit confirmed continuing volcanic activity since the latest eruption started in November 2018 (BGVN 44:05). This report covers activity from December 2019 through May 2020. Activity is monitored by Indonesia's Pusat Vulkanologi dan Mitigasi Bencana Geologi (PVMBG, also known as CVGHM, or the Center of Volcanology and Geological Hazard Mitigation), and ash plumes are monitored by the Darwin VAAC (Volcanic Ash Advisory Center). Information is also available from MODIS thermal anomaly satellite data through both the University of Hawaii's MODVOLC system and the Italian MIROVA project.
Increased activity that included daily incandescent avalanche blocks traveling down the W and NW flanks lasted from mid-July 2019 (BGVN 44:12) through mid-January 2020 according to multiple sources. The MIROVA data showed increased number and intensity of thermal anomalies during this period, with a sharp drop during the second half of January (figure 40). The MODVOLC thermal alert data reported 29 alerts in December and ten alerts in January, ending on 14 January, with no further alerts through May 2020. During December and the first half of January incandescent blocks traveled 1,000-1,500 m down multiple drainages on the W and NW flanks (figure 41). After this, thermal anomalies were still present at the summit craters, but no additional activity down the flanks was identified in remote satellite data or direct daily observations from PVMBG.
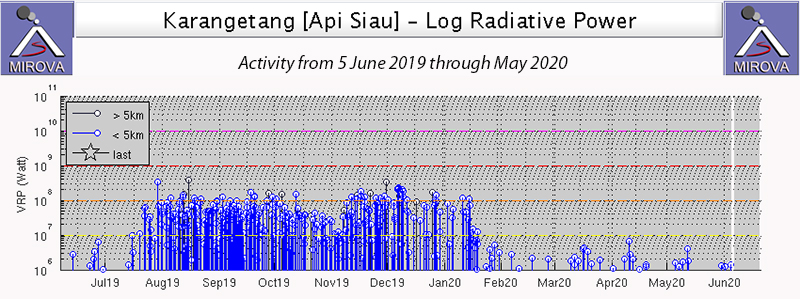 |
Figure 40. An episode of increased activity at Karangetang from mid-July 2019 through mid-January 2020 included incandescent avalanche blocks traveling down multiple flanks of the volcano. This was reflected in increased thermal activity seen during that interval in the MIROVA graph covering 5 June 2019 through May 2020. Courtesy of MIROVA. |
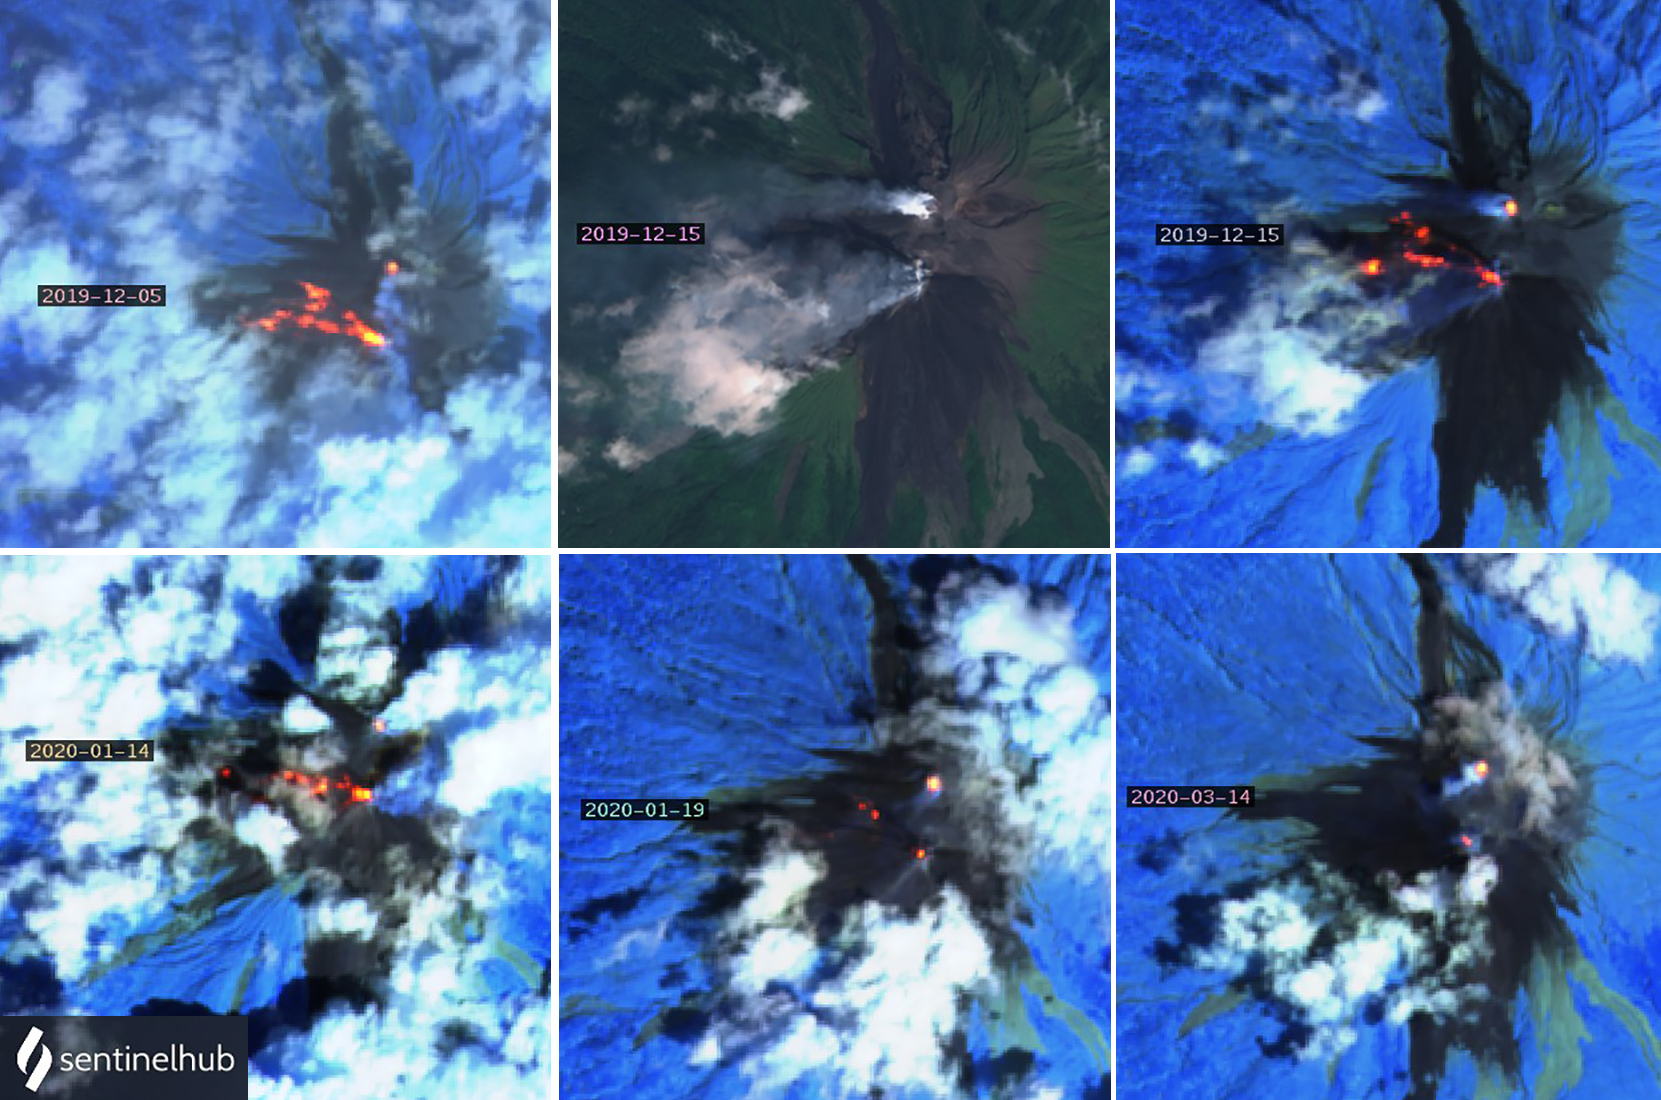 |
Figure 41. An episode of increased activity at Karangetang from mid-July 2019 through mid-January 2020 included incandescent avalanche blocks traveling up to 1,500 m down drainages on the W and NW flanks of the volcano. Top left: large thermal anomalies trend NW from Main Crater on 5 December 2019; about 500 m N a thermal anomaly glows from Second Crater. Top center: on 15 December plumes of steam and gas drifted W and SW from both summit craters as seen in Natural Color rendering (bands 4,3,2). Top right: the same image as at top center with Atmospheric penetration rendering (bands 12, 11, 8a) shows hot zones extending WNW from Main Crater and a thermal anomaly at Second Crater. Bottom left: thermal activity seen on 14 January 2020 extended about 800 m WNW from Main Crater along with an anomaly at Second Crater and a hot spot about 1 km W. Bottom center: by 19 January the anomaly from Second Crater appeared slightly stronger than at Main Crater, and only small anomalies appeared on the NW flank. Bottom right: an image from 14 March shows only thermal anomalies at the two summit craters. Courtesy of Sentinel Hub Playground. |
A single VAAC report in early April noted a short-lived ash plume that drifted SW. Intermittent low-level activity continued through May 2020. Small SO2 plumes appeared in satellite data multiple times in December 2019 and January 2020; they decreased in size and frequency after that but were still intermittently recorded into May 2020 (figure 42).
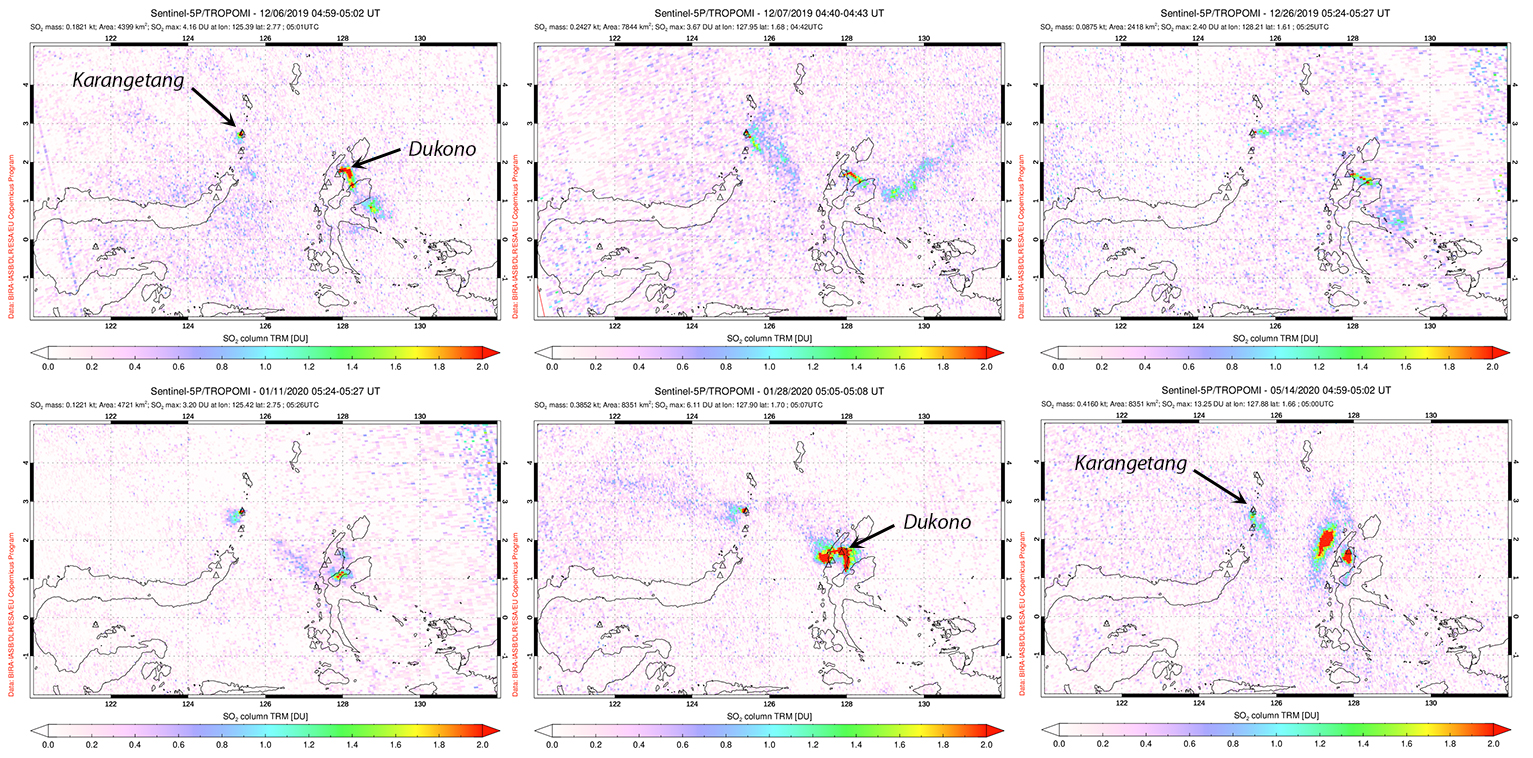 |
Figure 42. Small plumes of sulfur dioxide were measured at Karangetang with the TROPOMI instrument on the Sentinel-5P satellite multiple times during December 2019 (top row). They were less frequent but still appeared during January-May 2020 (bottom row). Larger plumes were also detected from Dukono, located 300 km ESE at the N end of North Maluku. Courtesy of Global Sulfur Dioxide Monitoring Page. |
PVMBG reported in their daily summaries that steam plumes rose 50-150 m above the Main Crater and 25-50 m above Second Crater on most days in December. The incandescent avalanche activity that began in mid-July 2019 also continued throughout December 2019 and January 2020 (figure 43). Incandescent blocks from the Main Crater descended river drainages (Kali) on the W and NW flanks throughout December. They were reported nearly every day in the Nanitu, Sense, and Pangi drainages, traveling 1,000-1,500 m. Incandescence from both craters was visible 10-25 m above the crater rim most nights.
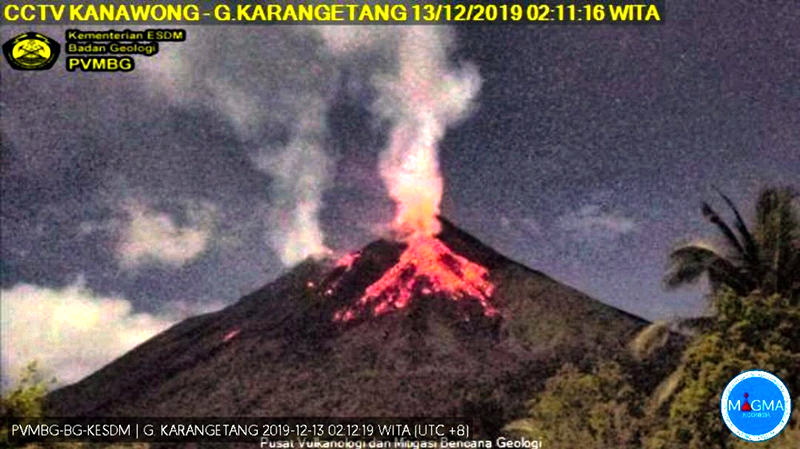 |
Figure 43. Incandescent block avalanches descended the NW flank of Karangetang as far as 1,500 m frequently during December 2019. Image taken 13 December 2019. Courtesy of PVMBG, Oystein Andersen. |
A few blocks were noted traveling 800 m down Kali Beha Barat on 1 December. Incandescence above the Main crater reached 50-75 m during 4-6 December. During 4-7 December incandescent blocks appeared in Kali Sesepe, traveling 1,000-1,500 m down from the summit. They were also reported in Kali Batang and Beha Barat during 4-14 December, usually moving 800-1,000 m downslope. Between 5 and 14 December, gray and white plumes from Second Crater reached 300 m multiple times. During 12-15 December steam plumes rose 300-500 m above the Main crater. Activity decreased during 18-26 December but increased again during the last few days of the month. On 28 December, incandescent blocks were reported 1,500 m down Kali Pangi and Nanitu, and 1,750 m down Kali Sense.
Incandescent blocks were reported in Kali Sesepi during 4-6 January and in Kali Batang and Beha Barat during 4-8 and 12-15 January (figure 44); they often traveled 800-1,200 m downslope. Activity tapered off in those drainages and incandescent blocks were last reported in Kali Beha Barat on 15 January traveling 800 m from the summit. Incandescent blocks were also reported traveling usually 1,000-1,500 m down the Nanitu, Sense, and Pangi drainages during 4-19 January. Blocks continued to occasionally descend up to 1,000 m down Kali Nanitu through 24 January. Pulses of activity occurred at the summit of Second Crater a few times in January. Steam plumes rose 25-50 m during 8-9 January and again during 16-31 January, with plumes rising 300-400 m on 20, 29, and 31 January. Incandescence was noted 10-25 m above the summit of Second Crater during 27-30 January.
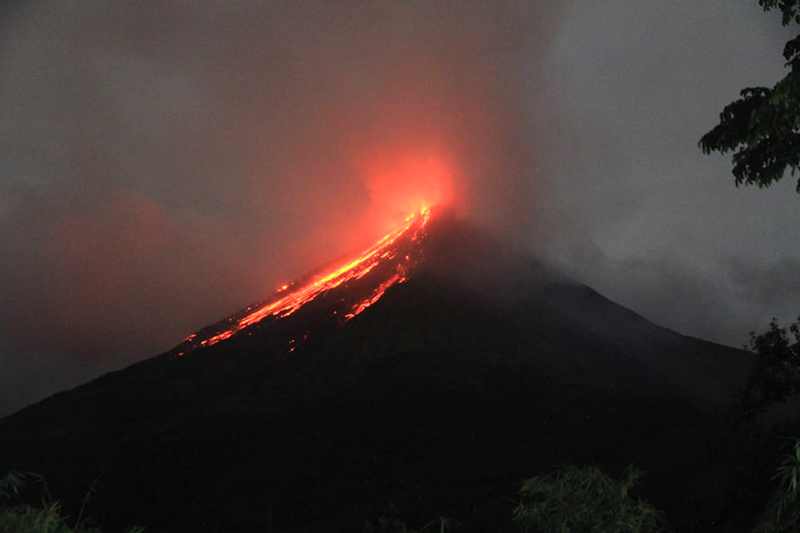 |
Figure 44. Incandescent material descends the Beha Barat, Sense, Nanitu, and Pangi drainages on the NW flank of Karangetang in early January 2020. Courtesy of Bobyson Lamanepa; posted on Twitter on 6 January 2020. |
Activity diminished significantly after mid-January 2020. Steam plumes at the Main Crater rose 50-100 m on the few days where the summit was not obscured by fog during February. Faint incandescence occurred at the Main Crater on 7 February, and steam plumes rising 25-50 m from Second Crater that day were the only events reported there in February. During March, steam plumes persisted from the Main Crater, with heights of over 100 m during short periods from 8-16 March and 25-30 March. Weak incandescence was reported from the Main Crater only once, on 25 March. Very little activity occurred at Second Crater during March, with only steam plumes reported rising 25-300 m from the 22nd to the 28th (figure 45).
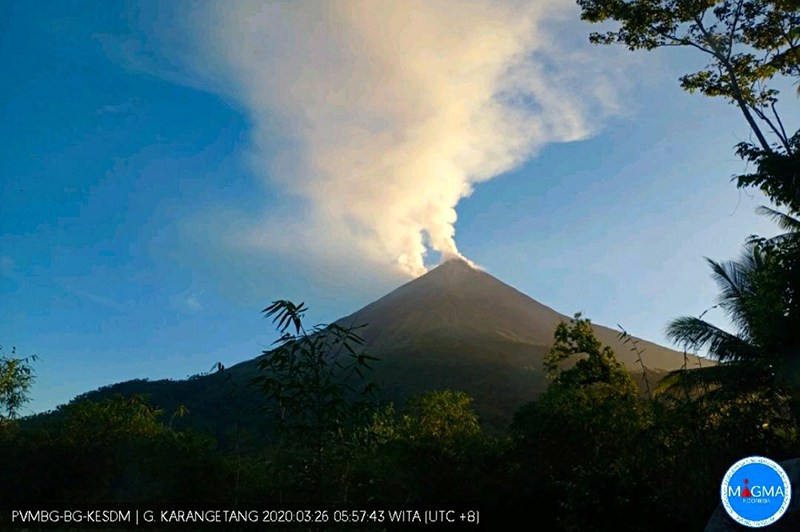 |
Figure 45. Steam plumes at Karangetang rose over 100 m above both summit craters multiple times during March, including on 26 March 2020. Courtesy of PVMBG and Oystein Andersen. |
The Darwin VAAC reported a continuous ash emission on 4 April 2020 that rose to 2.1 km altitude and drifted SW for a few hours before dissipating. Incandescence visible 25 m above both craters on 13 April was the only April activity reported by PVMBG other than steam plumes from the Main Crater that rose 50-500 m on most days. Steam plumes of 50-100 m were reported from Second Crater during 11-13 April. Activity remained sporadic throughout May 2020. Steam plumes from the Main Crater rose 50-300 m each day. Satellite imagery identified steam plumes and incandescence from both summit craters on 3 May (figure 46). Faint incandescence was observed at the Main Crater on 12 and 27 May. Steam plumes rose 25-50 m from Second Crater on a few days; a 200-m-high plume was reported on 27 May. Bluish emissions were observed on the S and SW flanks on 28 May.
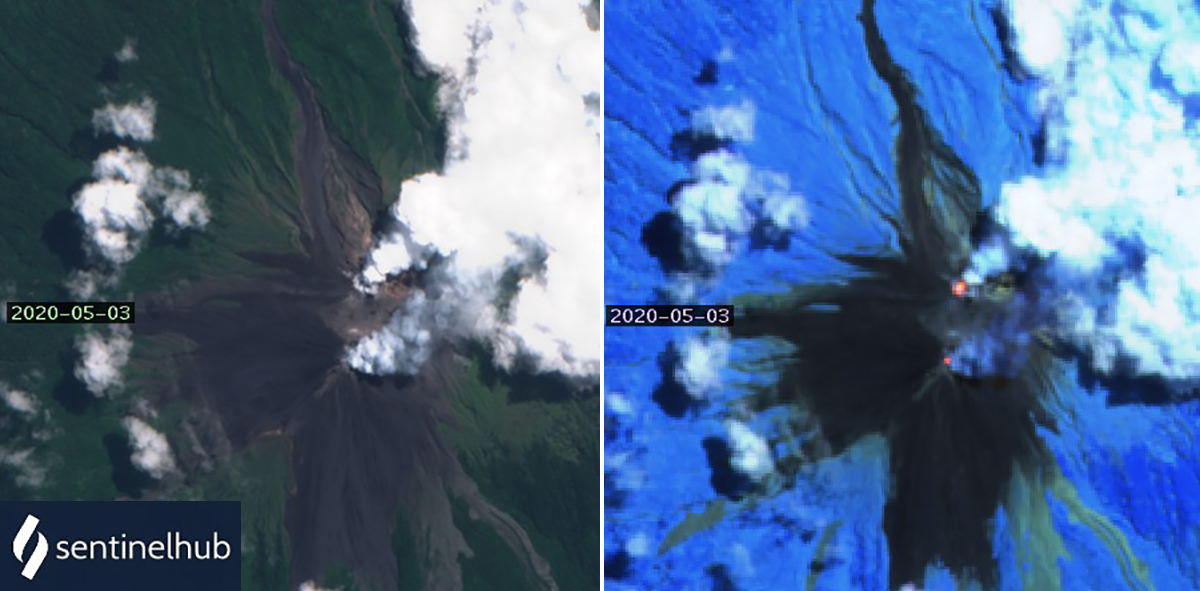 |
Figure 46. Dense steam plumes and thermal anomalies were present at both summit craters of Karangetang on 3 May 2020. Sentinel 2 satellite image with Natural Color (bands 4, 3, 2) (left) and Atmospheric Penetration rendering (bands 12, 11, 8a) (right); courtesy of Sentinel Hub Playground. |
Geological Summary. Karangetang (Api Siau) volcano lies at the northern end of the island of Siau, about 125 km NNE of the NE-most point of Sulawesi. The stratovolcano contains five summit craters along a N-S line. It is one of Indonesia's most active volcanoes, with more than 40 eruptions recorded since 1675 and many additional small eruptions that were not documented (Neumann van Padang, 1951). Twentieth-century eruptions have included frequent explosive activity sometimes accompanied by pyroclastic flows and lahars. Lava dome growth has occurred in the summit craters; collapse of lava flow fronts have produced pyroclastic flows.
Information Contacts: Pusat Vulkanologi dan Mitigasi Bencana Geologi (PVMBG, also known as Indonesian Center for Volcanology and Geological Hazard Mitigation, CVGHM), Jalan Diponegoro 57, Bandung 40122, Indonesia (URL: http://www.vsi.esdm.go.id/); MIROVA (Middle InfraRed Observation of Volcanic Activity), a collaborative project between the Universities of Turin and Florence (Italy) supported by the Centre for Volcanic Risk of the Italian Civil Protection Department (URL: http://www.mirovaweb.it/); Hawai'i Institute of Geophysics and Planetology (HIGP) - MODVOLC Thermal Alerts System, School of Ocean and Earth Science and Technology (SOEST), Univ. of Hawai'i, 2525 Correa Road, Honolulu, HI 96822, USA (URL: http://modis.higp.hawaii.edu/); Sentinel Hub Playground (URL: https://www.sentinel-hub.com/explore/sentinel-playground); Global Sulfur Dioxide Monitoring Page, Atmospheric Chemistry and Dynamics Laboratory, NASA Goddard Space Flight Center (NASA/GSFC), 8800 Greenbelt Road, Goddard, Maryland, USA (URL: https://so2.gsfc.nasa.gov/); Darwin Volcanic Ash Advisory Centre (VAAC), Bureau of Meteorology, Northern Territory Regional Office, PO Box 40050, Casuarina, NT 0811, Australia (URL: http://www.bom.gov.au/info/vaac/); Øystein Lund Andersen (Twitter: @OysteinLAnderse, https://twitter.com/OysteinLAnderse, URL: http://www.oysteinlundandersen.com); Bobyson Lamanepa, Yogyakarta, Indonesia, (URL: https://twitter.com/BobyLamanepa/status/1214165637028728832).