Report on Kadovar (Papua New Guinea) — July 2020
Bulletin of the Global Volcanism Network, vol. 45, no. 7 (July 2020)
Managing Editor: Edward Venzke.
Edited by A. Elizabeth Crafford.
Kadovar (Papua New Guinea) Intermittent ash plumes and persistent summit thermal anomalies, January-June 2020
Please cite this report as:
Global Volcanism Program, 2020. Report on Kadovar (Papua New Guinea) (Crafford, A.E., and Venzke, E., eds.). Bulletin of the Global Volcanism Network, 45:7. Smithsonian Institution. https://doi.org/10.5479/si.GVP.BGVN202007-251002
Kadovar
Papua New Guinea
3.608°S, 144.588°E; summit elev. 365 m
All times are local (unless otherwise noted)
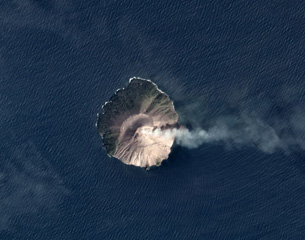
The steeply sloped 1.4-km-diameter Kadovar Island is located in the Bismark Sea offshore from the mainland of Papua New Guinea about 25 km NNE from the mouth of the Sepik River. Its first confirmed observed eruption began in early January 2018, with ash plumes and lava extrusion resulting in the evacuation of around 600 residents from the N side of the island (BGVN 43:03). A dome appeared at the base of the E flank during March-May 2018 (Planka et al., 2019); by November activity had migrated to a new dome growing near the summit on the E flank. Pulsating steam plumes, thermal anomalies, and periodic ash emissions continued throughout 2019 (BGVN 44:05, 45:01), and from January-June 2020, the period covered in this report. Information was provided by the Rabaul Volcano Observatory (RVO), the Darwin Volcanic Ash Advisory Center (VAAC), satellite sources, and photographs from visitors.
Activity during January-June 2020. Intermittent ash plumes, pulsating gas and steam plumes, and thermal anomalies continued at Kadovar during January-June 2020. MIROVA thermal data suggested persistent low-level anomalies throughout the period (figure 45). Sentinel-2 satellite data confirmed thermal anomalies at the summit on 5 and 25 January 2020, and an ash emission on 20 January (figure 46). Persistent pulsating steam plumes were visible whenever the skies were clear enough to see the volcano.
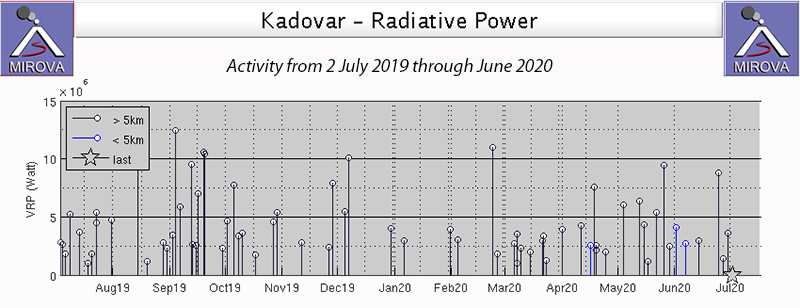 |
Figure 45. Persistent low-level thermal activity at Kadovar was recorded in the MIROVA graph of radiative power from 2 July 2019 through June 2020. The island location is mislocated in the MIROVA system by about 5.5 km SE due to older mis-registered imagery; the anomalies are all on the island. Courtesy of MIROVA. |
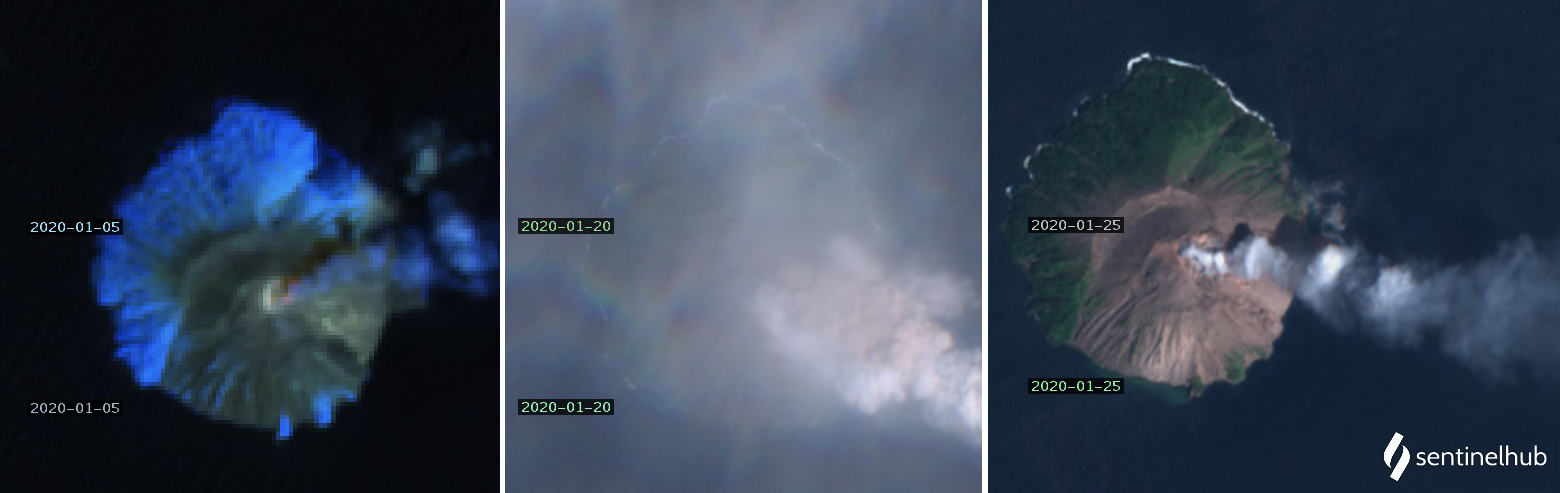 |
Figure 46. Sentinel-2 satellite data confirmed thermal anomalies at the summit of Kadovar on 5 (left) and 25 January 2020, and an ash emission and steam plume that drifted SE on 20 January (center). Pulsating steam-and-gas emissions left a trail in the atmosphere drifting SE for several kilometers on 25 January (right). Left image uses Atmospheric penetration rendering (bands 12, 11, 8a), center and right images use Natural color rendering (bands 4, 3, 2). Courtesy of Sentinel Hub Playground. |
On 2 February 2020 the Darwin VAAC reported a minor eruption plume that rose to 1.5 km altitude and drifted ESE for a few hours. Another plume was clearly discernible in satellite imagery on 5 February at 2.1 km altitude moving SE. RVO issued an information bulletin on 7 February reporting that, since the beginning of January, the eruption had continued with frequent Vulcanian explosions from the Main Vent with a recurrence interval of hours to days. Rocks and ash were ejected 300-400 m above the vent. Rumbling could be heard from Blupblup (Rubrub) island, 15 km E, and residents there also observed incandescence at night. On clear days the plume was sometimes visible from Wewak, on the mainland 100 km W. Additional vents produced variable amounts of steam. The Darwin VAAC reported continuous volcanic ash rising to 1.5 km on 22 February that extended ESE until it was obscured by a meteoric cloud; it dissipated early the next day. A small double ash plume and two strong thermal anomalies at the summit were visible in satellite imagery on 24 February (figure 47).
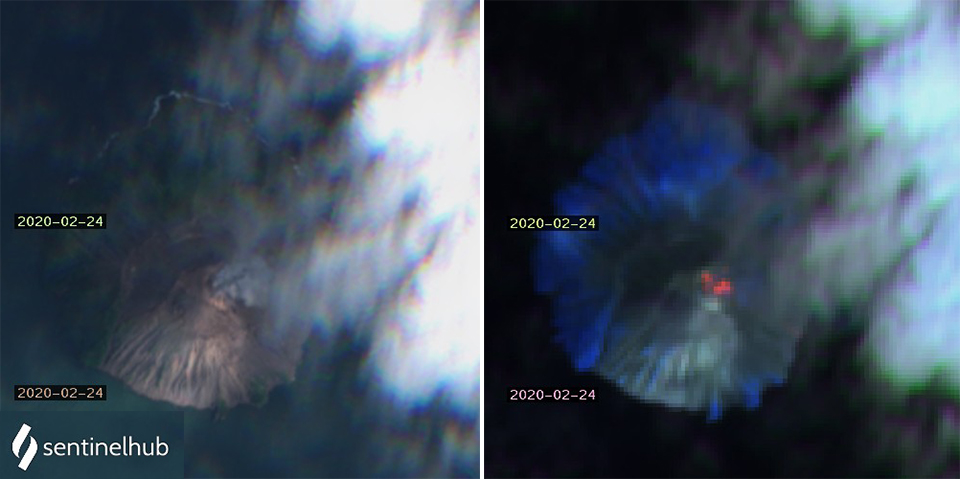 |
Figure 47. Ash emissions and thermal anomalies continued at Kadovar during February 2020. Two small plumes of ash or dense steam rose from the summit on 24 February 2020, seen in this Natural color rendering (bands 4, 3, 2) on the left. The same image rendered in Atmospheric penetration (bands 12, 11, 8a) on the right shows two thermal anomalies in the same locations as the ash plumes. Courtesy of Sentinel Hub Playground. |
The Darwin VAAC reported continuous ash emissions beginning on 13 March 2020 that rose to 1.5 km altitude and drifted SE. The plume was visible intermittently in satellite imagery for about 36 hours before dissipating. During April, pulsating steam plumes rose from two vents at the summit, and thermal anomalies appeared at both vents in satellite data (figure 48). Small but distinct SO2 anomalies were visible in satellite data on 15 and 16 April (figure 49).
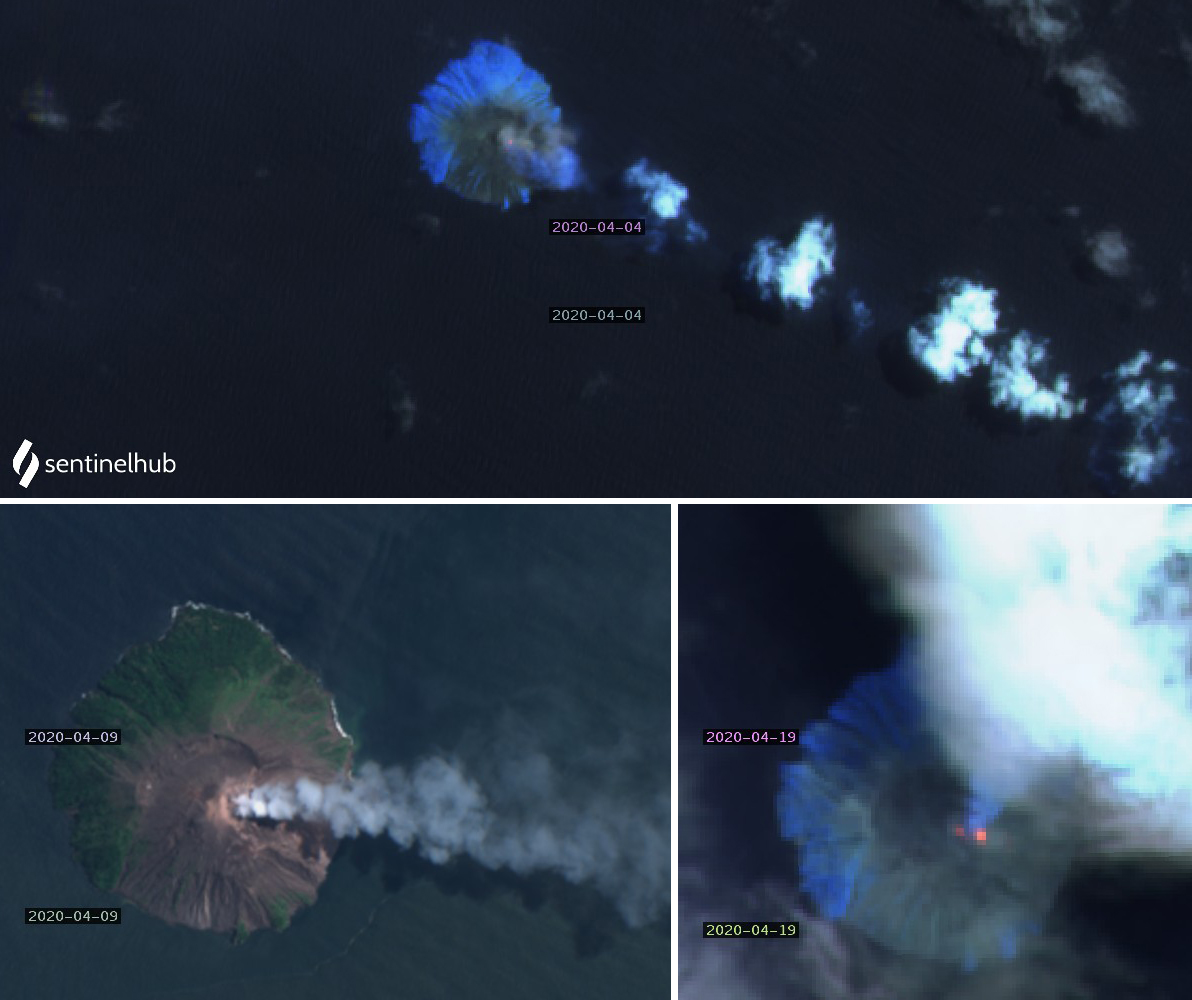 |
Figure 48. Steam plumes and thermal anomalies continued at Kadovar during April 2020. Top: A thermal anomaly at the summit accompanied pulsating steam plumes that drifted several kilometers SE before dissipating on 4 April 2020. Bottom left: Two gas-and-steam plumes drifted E from the summit on 9 April. Bottom right: Two adjacent thermal anomalies were present near the summit on 19 April. Top and bottom right images use Atmospheric penetration rendering (bands 12, 11, 8a), bottom left image uses Natural color rendering (bands 4, 3, 2). Courtesy of Sentinel Hub Playground. |
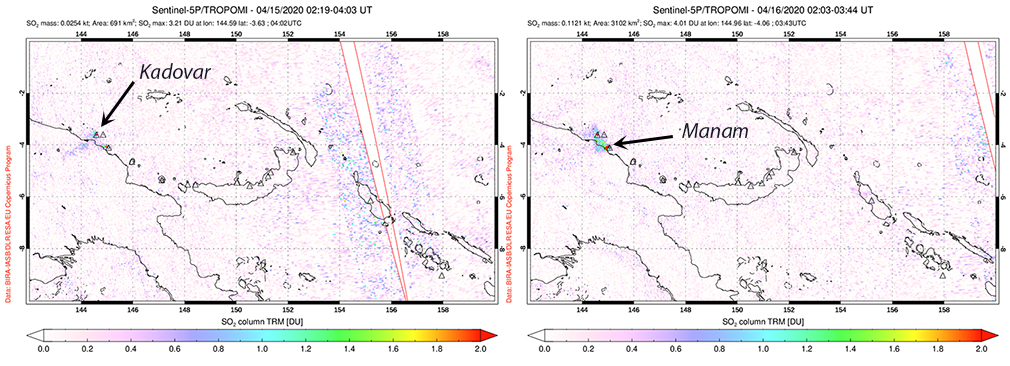 |
Figure 49. Small but distinct SO2 anomalies were detected at Kadovar on 15 and 16 April 2020 with the TROPOMI instrument on the Sentinel-5P satellite. Nearby Manam often produces larger SO2 plumes that obscure evidence of activity at Kadovar. Courtesy of NASA Global Sulfur Dioxide Monitoring Page. |
Two summit vents remained active throughout May and June 2020, producing pulsating steam plumes that were visible for tens of kilometers and thermal anomalies visible in satellite data (figure 50). A strong thermal anomaly was visible beneath meteoric clouds on 8 June.
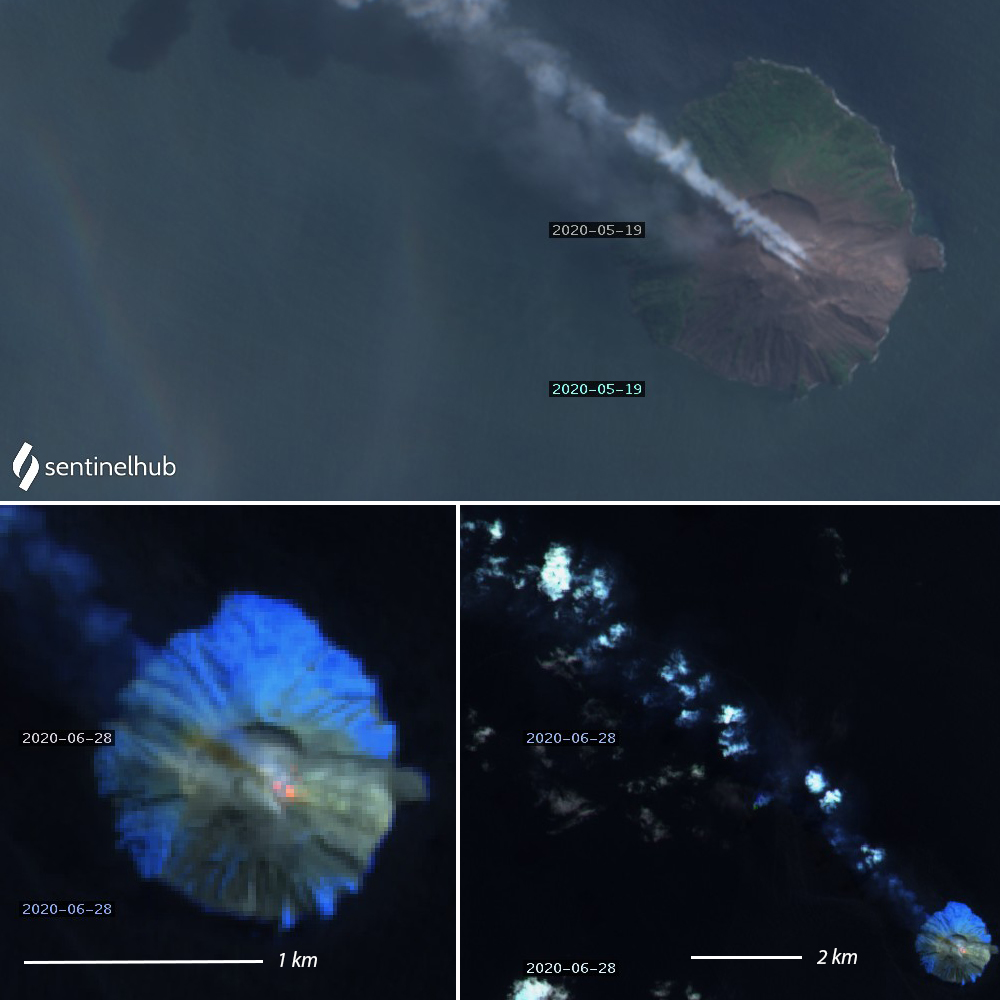 |
Figure 50. During May and June 2020 thermal and plume activity continued at Kadovar. Top: Gas-and-steam plumes drifted NW from two sources at the summit of Kadovar on 19 May 2020. Bottom left: Two thermal anomalies marked the E rim of the summit crater on 28 June 2020. Bottom right: A zoomed out view of the same 28 June image shows pulsating steam plumes drifting 10 km NW from Kadovar. Top image is Natural color rendering (bands 4, 3, 2). Bottom images are Atmospheric penetration rendering (bands 12, 11, 8a) of Sentinel-2 images. Courtesy of Sentinel Hub Playground. |
Visitor observations on 21 October 2019. Claudio Jung visited Kadovar on 21 October 2019. Shortly before arriving on the island an ash plume rose tens of meters above the summit and drifted W (figure 51). From the NW side of the summit crater rim, Jung saw the actively growing dome on the side of a larger dome, and steam and gas issuing from the growing dome (figure 52). The crater rim was covered with dead vegetation, ash, and large bombs from recent explosions (figure 53). The summit dome had minor fumarolic activity around the summit area and dead vegetation halfway up the flank (figure 54) while the fresh blocky lava of the actively growing dome on the E side of the summit produced significant steam and gas emissions. The growing dome produced periodic pulses of dense steam during his visit (figure 55).
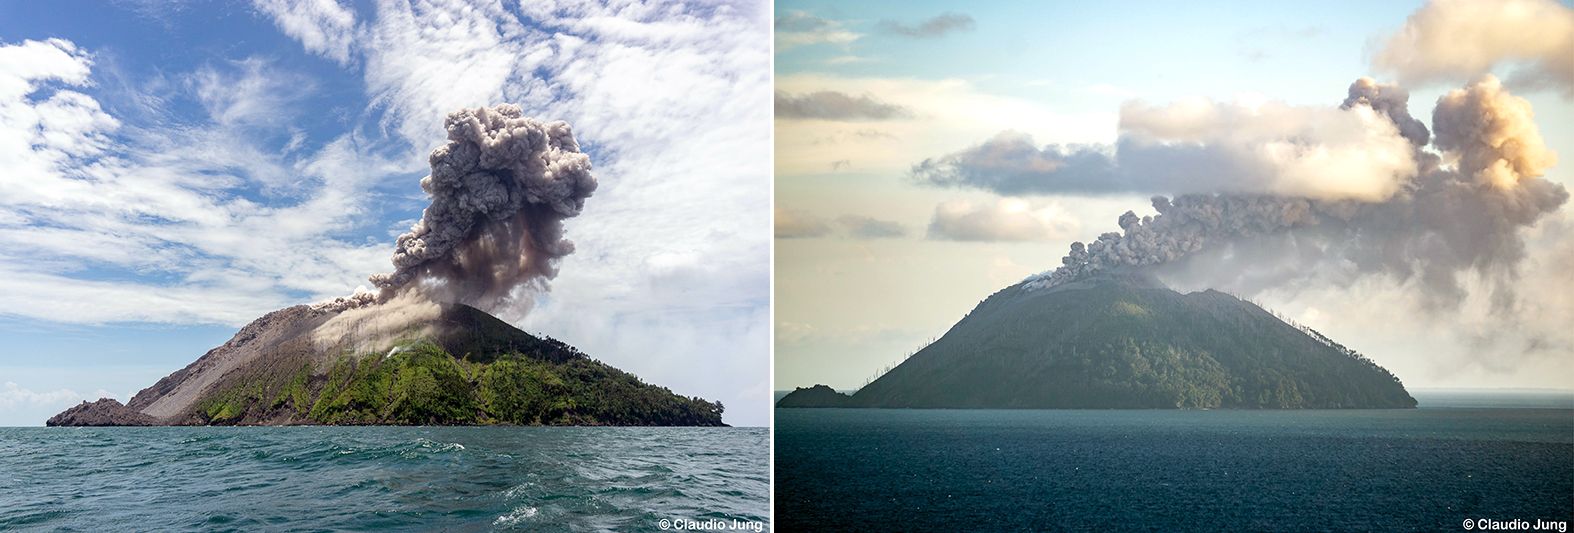 |
Figure 51. Views looking S show the shoreline dome at the base of the E flank of Kadovar that was active during March-May 2018 (left), and an ash plume drifting W from the summit dome located on the E side of the summit crater (right) on 21 October 2019. Copyrighted photos courtesy of Claudio Jung, used with permission. |
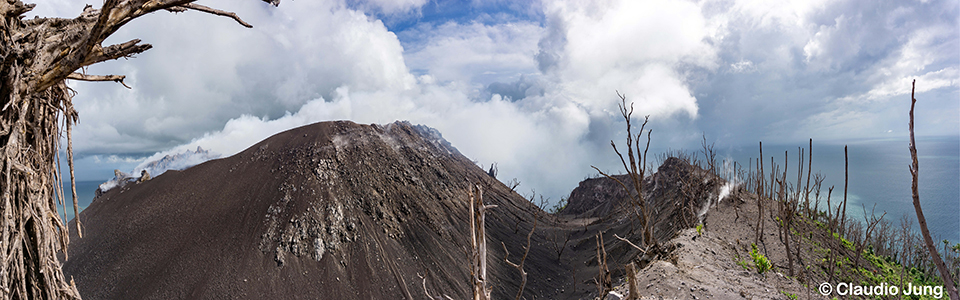 |
Figure 52. A panorama looking SE from the crater rim of Kadovar on 21 October 2019 shows the actively growing dome on the far left with a narrow plume of steam and gas being emitted. A large dome fills the summit crater; the crater rim is visible on the right. Copyrighted photo courtesy of Claudio Jung, used with permission. |
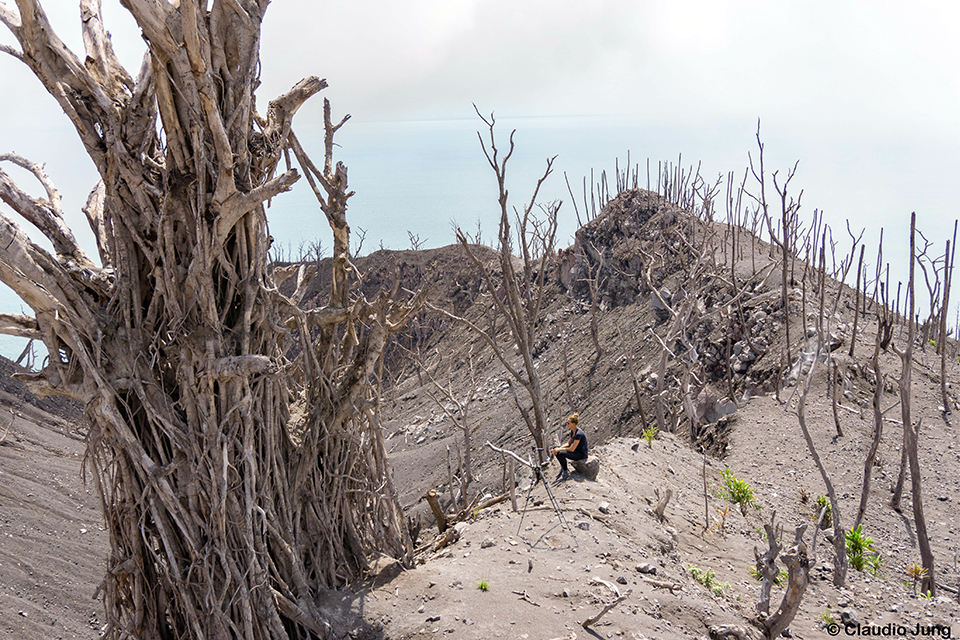 |
Figure 53. The crater rim of Kadovar on 21 October 2019 was covered with dead vegetation, ash, and large bombs from recent explosions. Person is sitting on a large bomb; weak fumarolic activity is visible along the rim. Copyrighted photo courtesy of Claudio Jung, used with permission. |
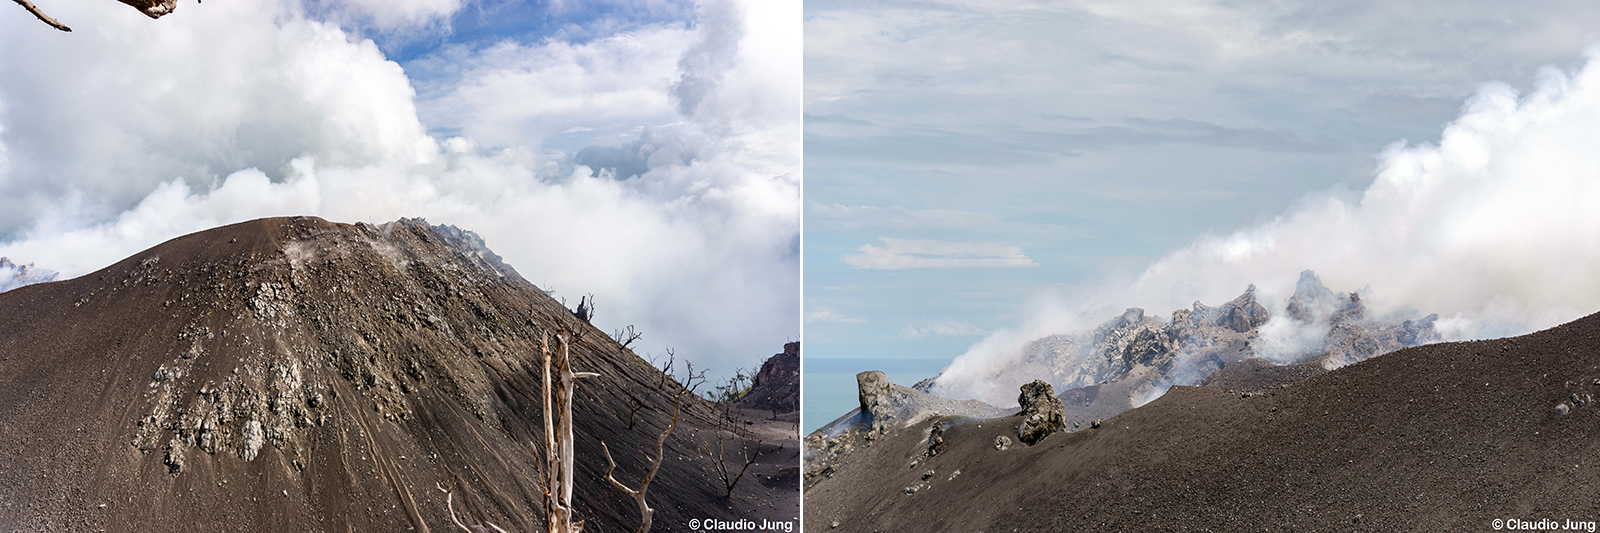 |
Figure 54. The summit dome of Kadovar on 21 October 2019 had minor fumarolic activity around most of its summit and dead vegetation half-way up the flank (left). The dead tree stumps suggest that vegetation covered the lower half of the dome prior to the eruption that began in January 2018. The fresh blocky lava of the actively growing dome on the E side of the summit dome produced significant steam and gas emissions (right). Copyrighted photos courtesy of Claudio Jung, used with permission. |
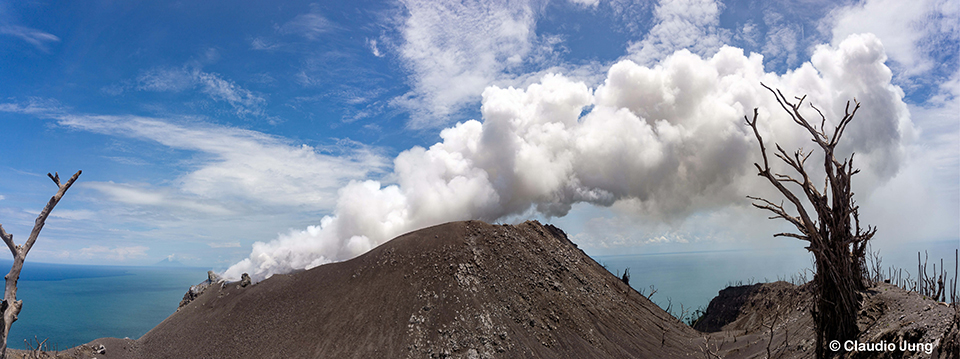 |
Figure 55. Dense steam from the growing dome on the E side of the summit drifted W from Kadovar on 21 October 2019. Copyrighted photo courtesy of Claudio Jung, used with permission. |
Reference: Planka S, Walter T R, Martinis S, Cescab S, 2019, Growth and collapse of a littoral lava dome during the 2018/19 eruption of Kadovar Volcano, Papua New Guinea, analyzed by multi-sensor satellite imagery, Journal of Volcanology and Geothermal Research, v. 388, 15 December 2019, 106704, https://doi.org/10.1016/j.jvolgeores.2019.106704.
Geological Summary. The 2-km-wide island of Kadovar is the emergent summit of a Bismarck Sea stratovolcano of Holocene age. It is part of the Schouten Islands, and lies off the coast of New Guinea, about 25 km N of the mouth of the Sepik River. Prior to an eruption that began in 2018, a lava dome formed the high point of the andesitic volcano, filling an arcuate landslide scarp open to the south; submarine debris-avalanche deposits occur in that direction. Thick lava flows with columnar jointing forms low cliffs along the coast. The youthful island lacks fringing or offshore reefs. A period of heightened thermal phenomena took place in 1976. An eruption began in January 2018 that included lava effusion from vents at the summit and at the E coast.
Information Contacts: Rabaul Volcano Observatory (RVO), Geohazards Management Division, Department of Mineral Policy and Geohazards Management (DMPGM), PO Box 3386, Kokopo, East New Britain Province, Papua New Guinea; Darwin Volcanic Ash Advisory Centre (VAAC), Bureau of Meteorology, Northern Territory Regional Office, PO Box 40050, Casuarina, NT 0811, Australia (URL: http://www.bom.gov.au/info/vaac/); Sentinel Hub Playground (URL: https://www.sentinel-hub.com/explore/sentinel-playground); MIROVA (Middle InfraRed Observation of Volcanic Activity), a collaborative project between the Universities of Turin and Florence (Italy) supported by the Centre for Volcanic Risk of the Italian Civil Protection Department (URL: http://www.mirovaweb.it/); NASA Global Sulfur Dioxide Monitoring Page, Atmospheric Chemistry and Dynamics Laboratory, NASA Goddard Space Flight Center (NASA/GSFC), 8800 Greenbelt Road, Goddard, Maryland, USA (URL: https://so2.gsfc.nasa.gov/); Claudio Jung (URL: https://www.instagram.com/jung.claudio/).