Sangay
Ecuador
2.005°S, 78.341°W; summit elev. 5286 m
All times are local (unless otherwise noted)
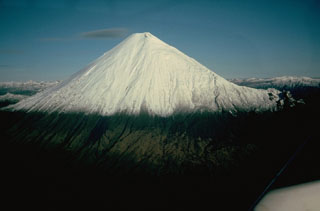
Frequent activity at Ecuador's Sangay has included pyroclastic flows, lava flows, ash plumes, and lahars reported since 1628. Its remoteness on the east side of the Andean crest make ground observations difficult; remote cameras and satellites provide important information on activity. The current eruption began in March 2019 and continued through December 2019 with activity focused on the Cráter Central and the Ñuñurco (southeast) vent; they produced explosions with ash plumes, lava flows, and pyroclastic flows and block avalanches. In addition, volcanic debris was remobilized in the Volcan river causing significant damming downstream. This report covers ongoing similar activity from January through June 2020. Information is provided by Ecuador's Instituto Geofísico, Escuela Politécnica Nacional (IG-EPN), and a number of sources of remote data including the Washington Volcanic Ash Advisory Center (VAAC), the Italian MIROVA Volcano HotSpot Detection System, and Sentinel-2 satellite imagery. Visitors also provided excellent ground and drone-based images and information.
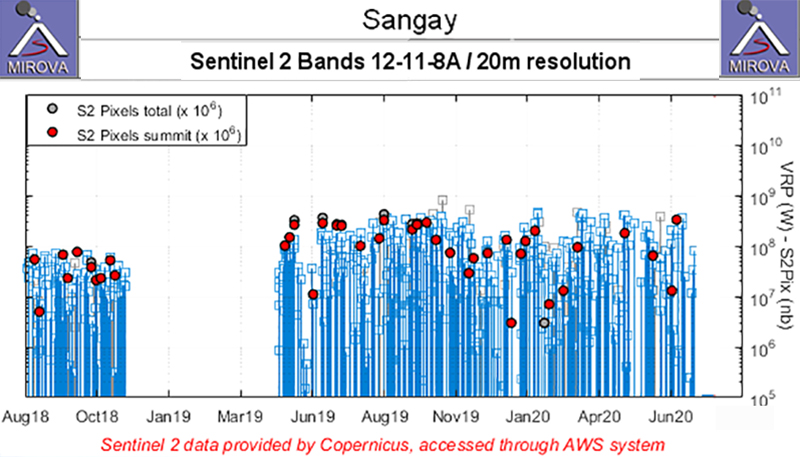
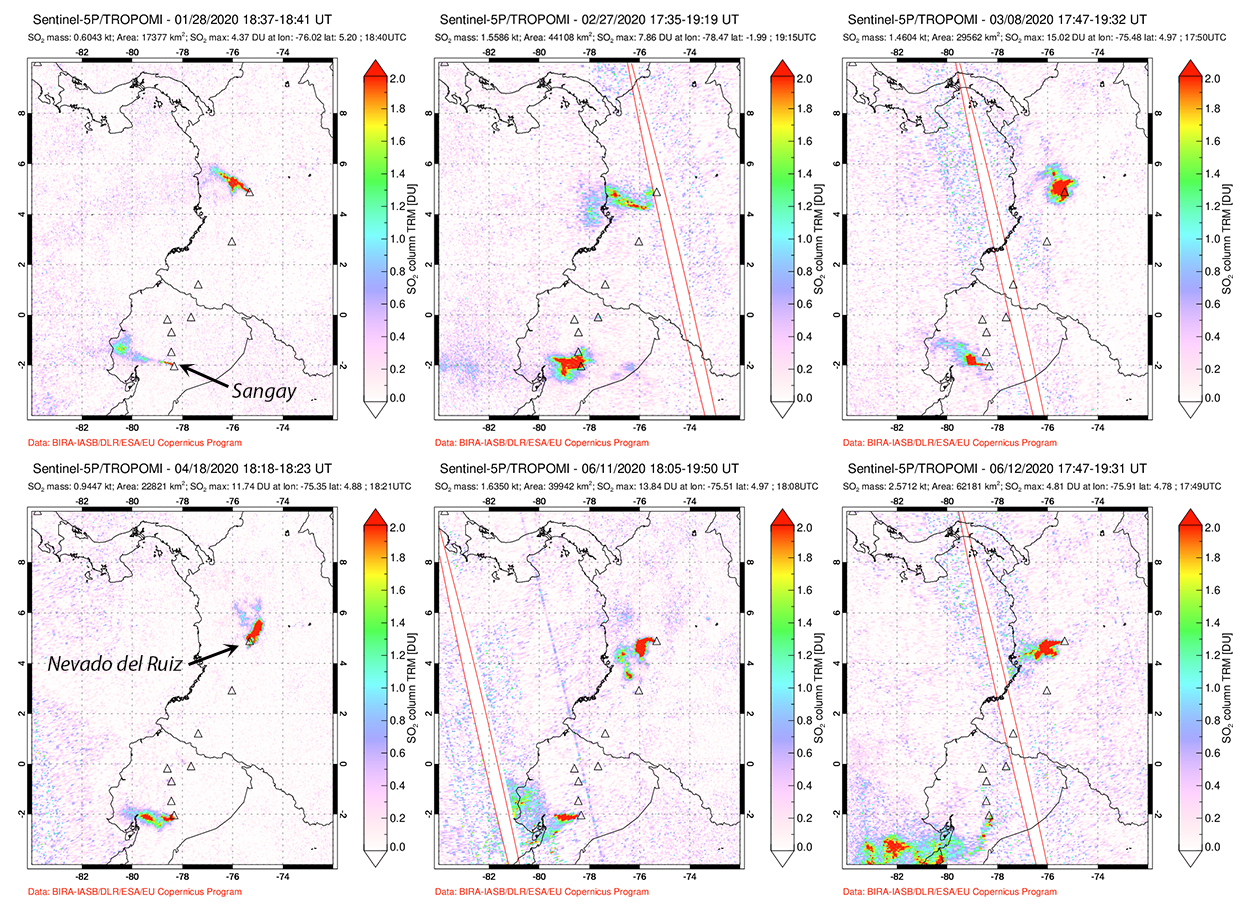
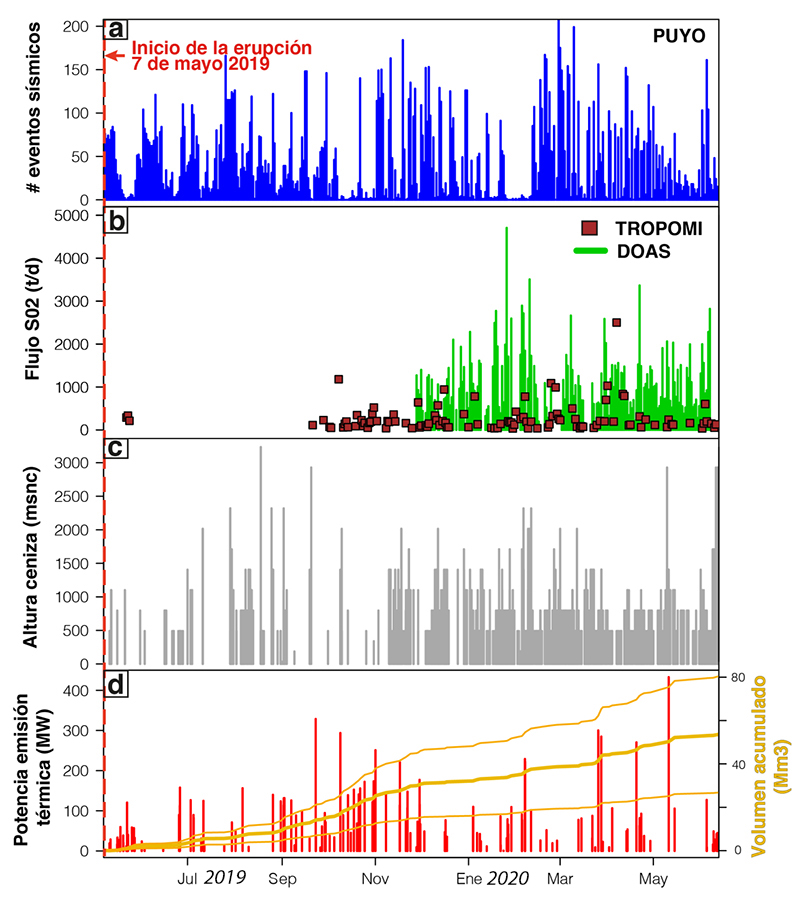
Throughout January-June 2020, multiple daily reports from the Washington Volcanic Ash Advisory Center (VAAC) indicated ash plumes rising from the summit, generally 500-1,100 m. Each month one or more plumes rose over 2,000 m. The plumes usually drifted SW or W, and ashfall was reported in communities 25-90 km away several times during January-March and again in June. In addition to explosions with ash plumes, pyroclastic flows and incandescent blocks frequently descended a large, deep ravine on the SE flank. Ash from the pyroclastic flows rose a few hundred meters and drifted away from the volcano. Incandescence was visible on clear nights at the summit and in the ravine. The MIROVA log radiative power graph showed continued moderate and high levels of thermal energy throughout the period (figure 57). Sangay also had small but persistent daily SO2 signatures during January-June 2020 with larger pulses one or more days each month (figure 58). IG-EPN published data in June 2020 about the overall activity since May 2019, indicating increases throughout the period in seismic event frequency, SO2 emissions, ash plume frequency, and thermal energy (figure 59).
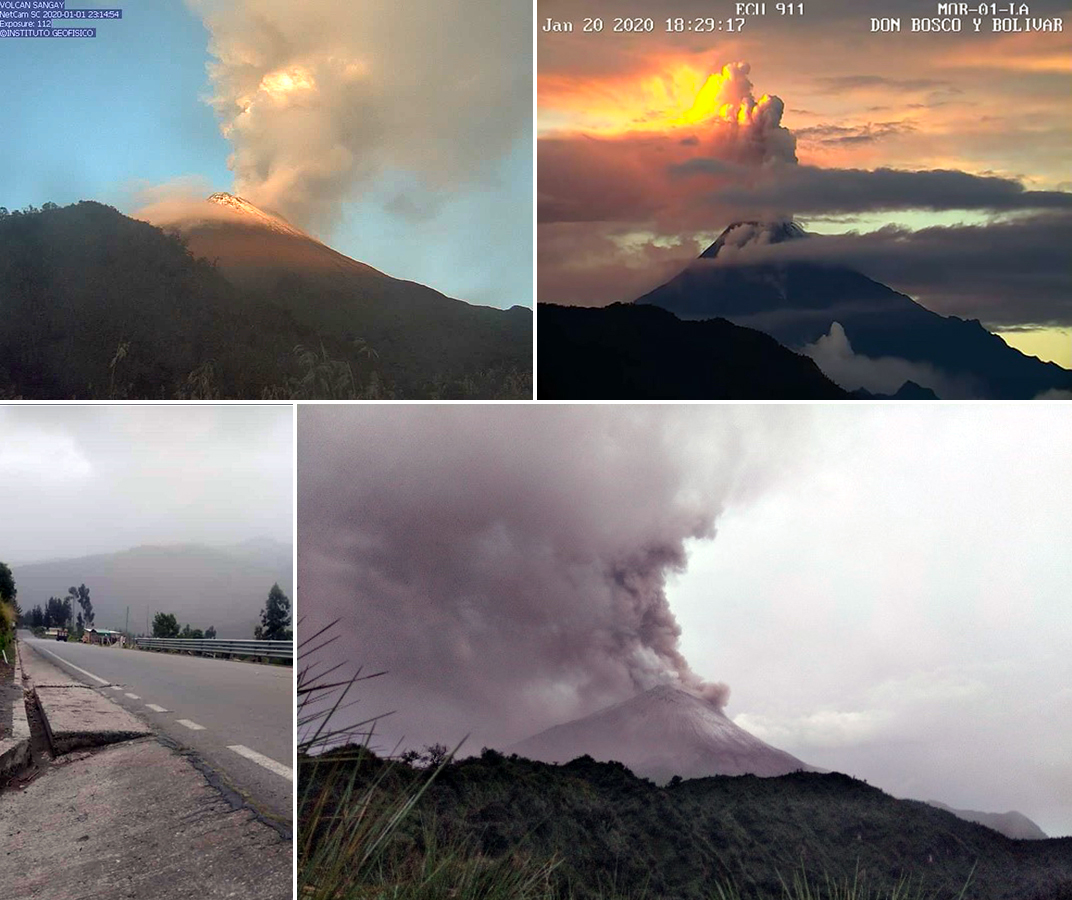
Activity during January-March 2020. IG-EPN and the Washington VAAC reported multiple daily ash emissions throughout January 2020. Gas and ash emissions generally rose 500-1,500 m above the summit, most often drifting W or SW. Ashfall was reported on 8 January in the communities of Sevilla (90 km SSW), Pumallacta and Achupallas (60 km SW) and Cebadas (35 km WNW). On 16 January ash fell in the Chimborazo province in the communities of Atillo, Ichobamba, and Palmira (45 km W). Ash on 28 January drifted NW, with minor ashfall reported in Púngala (25 km NW) and other nearby communities. The town of Alao (20 km NW) reported on 30 January that all of the vegetation in the region was covered with fine white ash; Cebadas and Palmira also noted minor ashfall (figure 60).
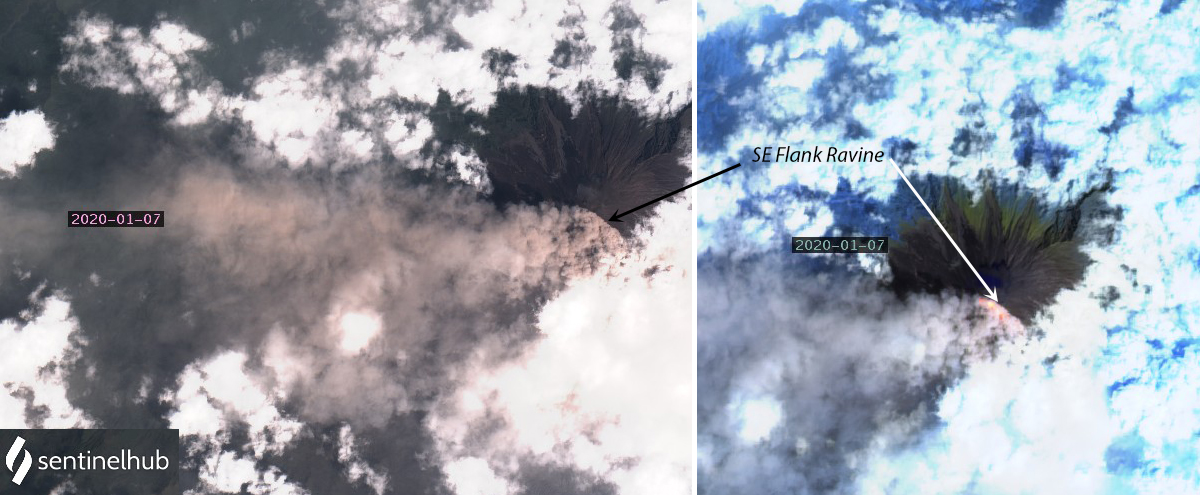
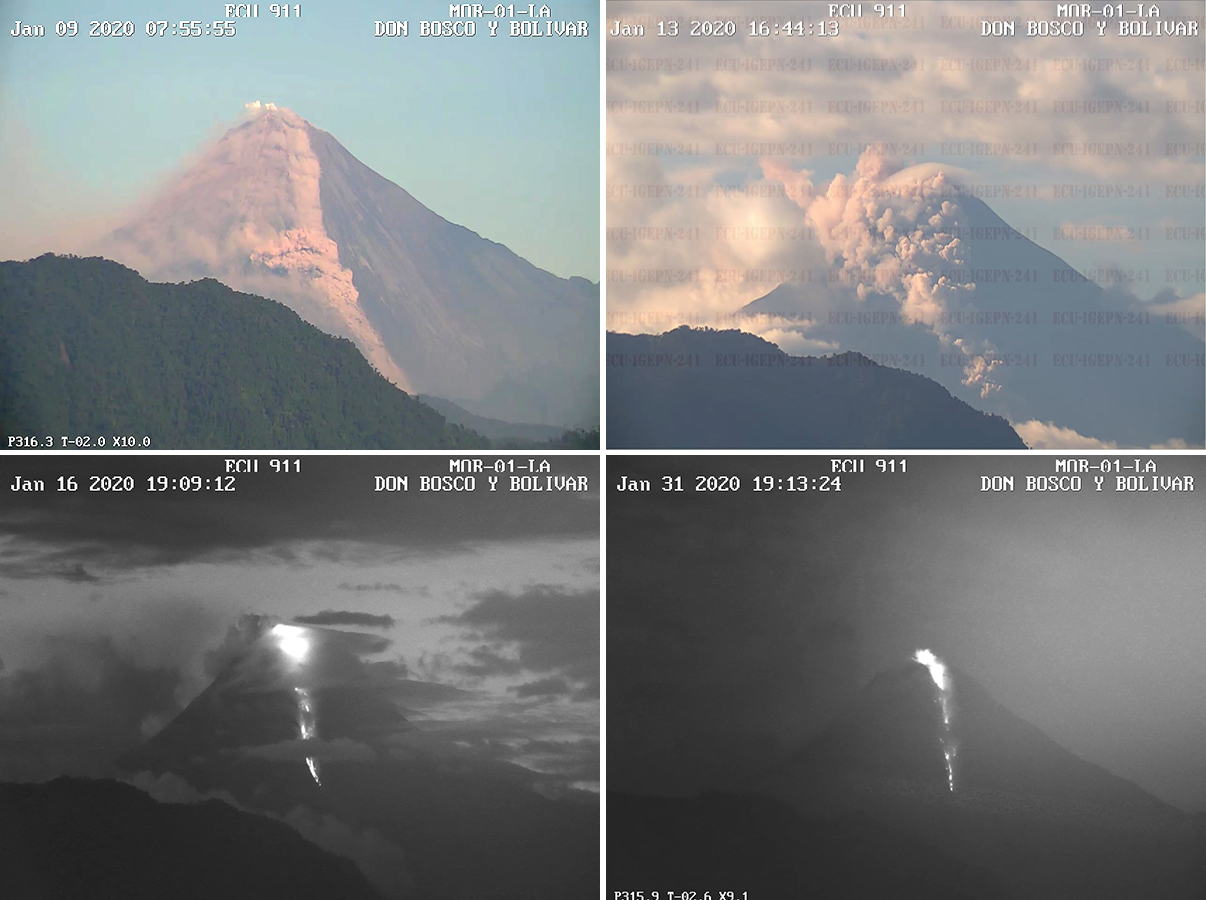
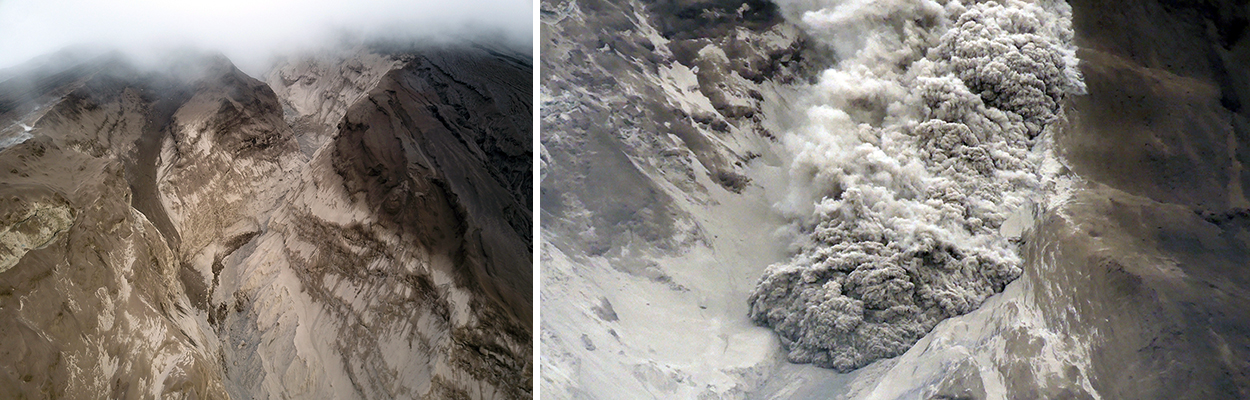
A major ravine on the SE flank has been the site of ongoing block avalanches and pyroclastic flows since the latest eruption began in March 2019. The pyroclastic flows down the ravine appeared incandescent at night; during the day they created ash clouds that drifted SW. Satellite imagery recorded incandescence and dense ash from pyroclastic flows in the ravine on 7 January (figure 61). They were also reported by IG on the 9th, 13th, 26th, and 28th. Incandescent blocks were reported in the ravine several times during the month. The webcam captured images on 31 January of large incandescent blocks descending the entire length of the ravine to the base of the mountain (figure 62). Large amounts of ash and debris were remobilized as lahars during heavy rains on the 25th and 28th.
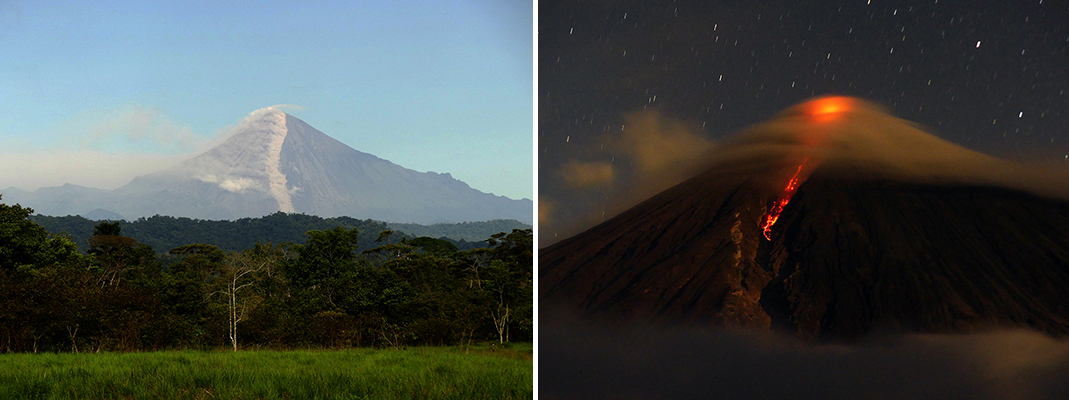
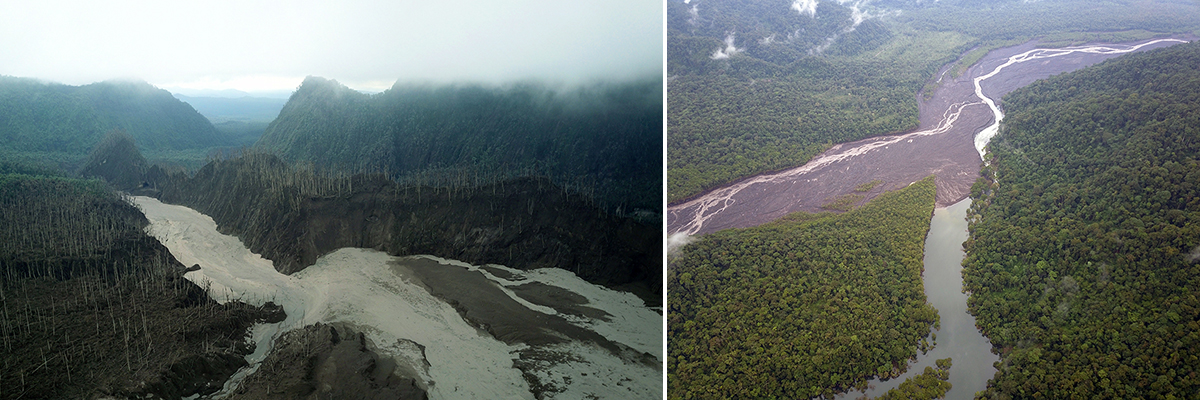
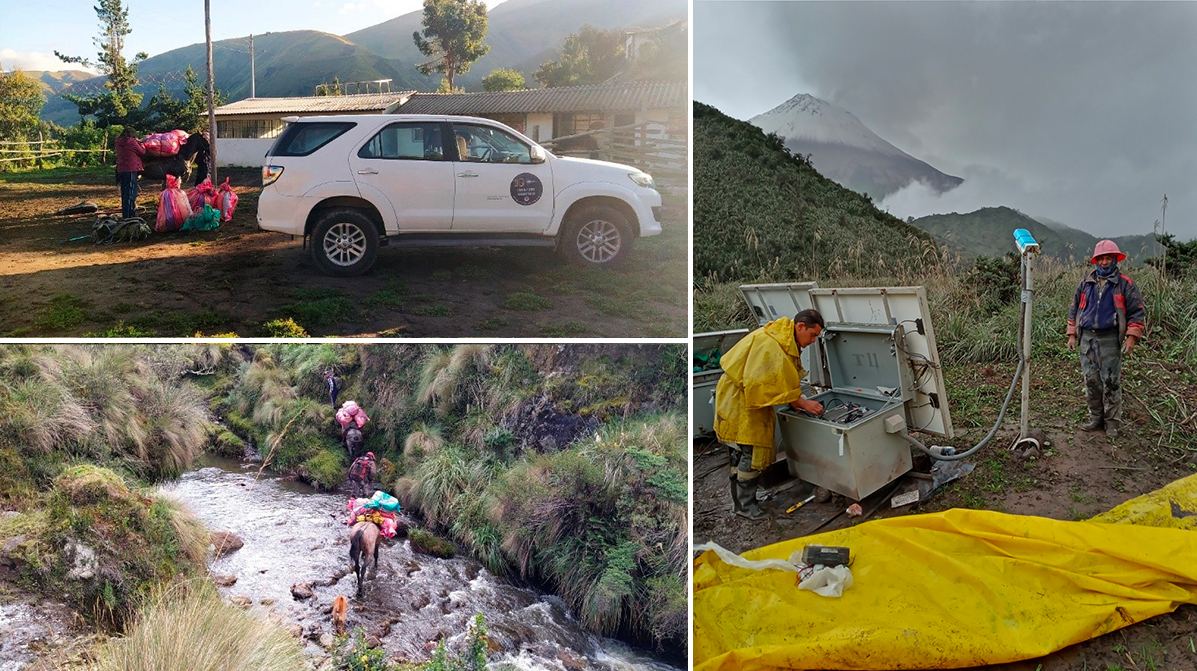
Observations by visitors to the volcano during 9-17 January 2020 included pyroclastic flows, ash emissions, and incandescent debris descending the SE flank ravine during the brief periods when skies were not completely overcast (figure 63 and 64). More often there was ash-filled rain and explosions heard as far as 16 km from the volcano, along with the sounds of lahars generated from the frequent rainfall mobilizing debris from the pyroclastic flows. The confluence of the Rio Upano and Rio Volcan is 23 km SE of the summit and debris from the lahars has created a natural dam on the Rio Upano that periodically backs up water and inundates the adjacent forest (figure 65). A different expedition to Sangay during 26 January-1 February 2020 by IG personnel to repair and maintain the remote monitoring station and collect samples was successful, after which the station was once again transmitting data to IG-EPN in Quito (figure 66).
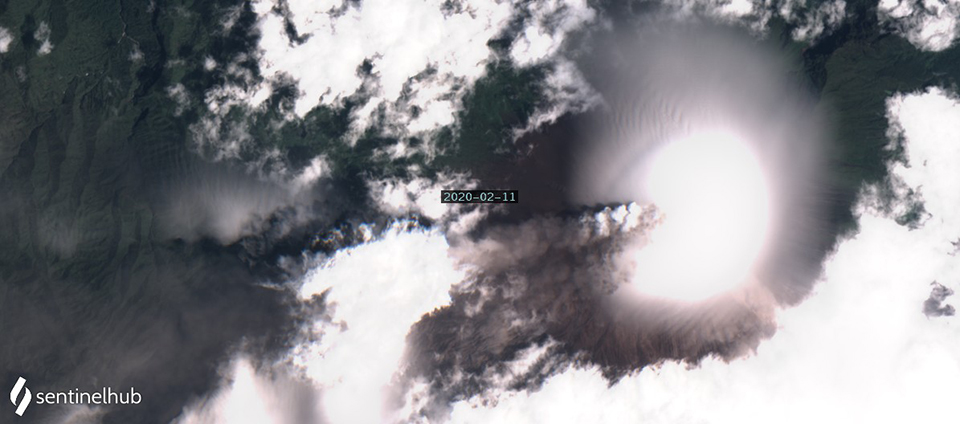
During February 2020, multiple daily VAAC reports of ash emissions continued (figure 67). Plumes generally rose 500-1,100 m above the summit and drifted W, although on 26 February emissions were reported to 1,770 m. Ashfall was reported in Macas (40 km SE) on 1 February, and in the communities of Pistishi (65 km SW), Chunchi (70 km SW), Pumallacta (60 k. SW), Alausí (60 km SW), Guamote (40 km WNW) and adjacent areas of the Chimborazo province on 5 February. The Ecuadorian Red Cross reported ash from Sangay in the provinces of Cañar and Azuay (60-100 km SW) on 25 February. Cebadas and Guamote reported moderate ashfall the following day. The communities of Cacha (50 km NW) and Punín (45 km NW) reported trace amounts of ashfall on 29 February. Incandescent blocks were seen on the SE flank multiples times throughout the month. A pyroclastic flow was recorded on the SE flank early on 6 February; additional pyroclastic flows were observed later that day on the SW flank. On 23 February a seismic station on the flank recorded a high-frequency signal typical of lahars.
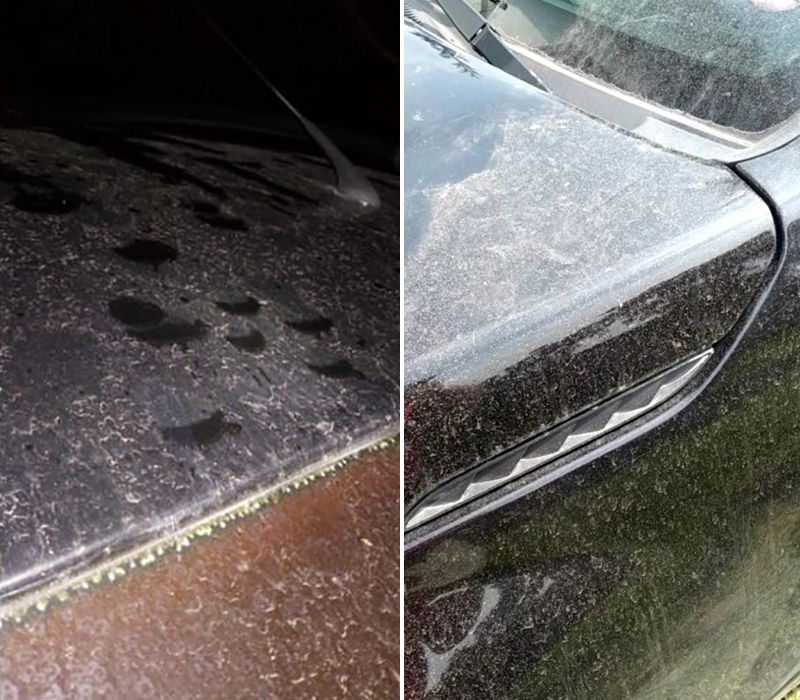
A significant ash emission on 1 March 2020 was reported about 2 km above the summit, drifting SW. Multiple ash emissions continued daily during the month, generally rising 570-1,170 m high. An emission on 12 March also rose 2 km above the summit. Trace ashfall was reported in Cebadas (35 km WNW) on 12 March. The community of Huamboya, located 40 km ENE of Sangay in the province of Morona-Santiago reported ashfall on 17 March. On 19 and 21 March ashfall was seen on the surface of cars in Macas to the SE. (figure 68). Ash was also reported on the 21st in de Santa María De Tunants (Sinaí) located E of Sangay. Ash fell again in Macas on 23 March and was also reported in General Proaño (40 km SE). The wind changed direction the next day and caused ashfall on 24 March to the SW in Cuenca and Azogues (100 km SW).
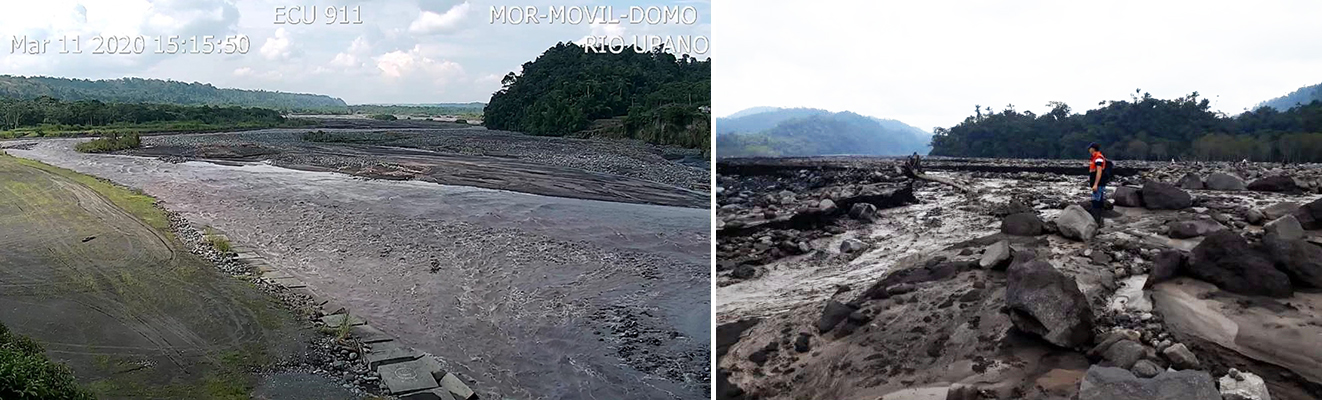
Incandescence from the dome at the crater and on the SE flank was noted by IG on 3, 4, and 13 March. Remobilized ash from a pyroclastic flow was reported drifting SW on 13 March. The incandescent path of the flow was still visible that evening. Numerous lahars were recorded seismically during the month, including on days 5, 6, 8, 11, 15, 30 and 31. Images from the Rio Upano on 11 March confirmed an increase from the normal flow rate (figure 69) inferred to be from volcanic debris. Morona-Santiago province officials reported on 14 March that a new dam had formed at the confluence of the Upano and Volcano rivers that decreased the flow downstream; by 16 March it had given way and flow had returned to normal levels.
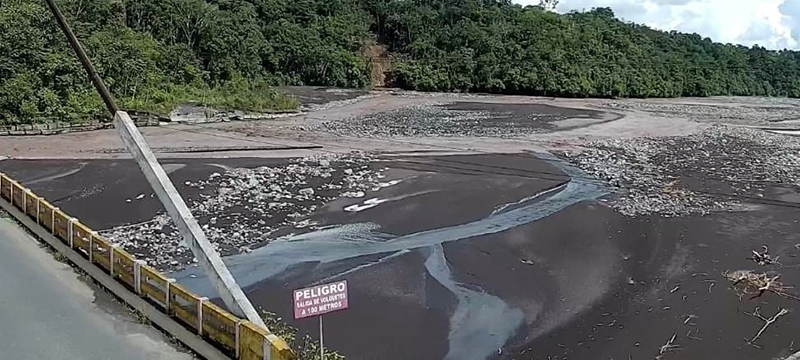
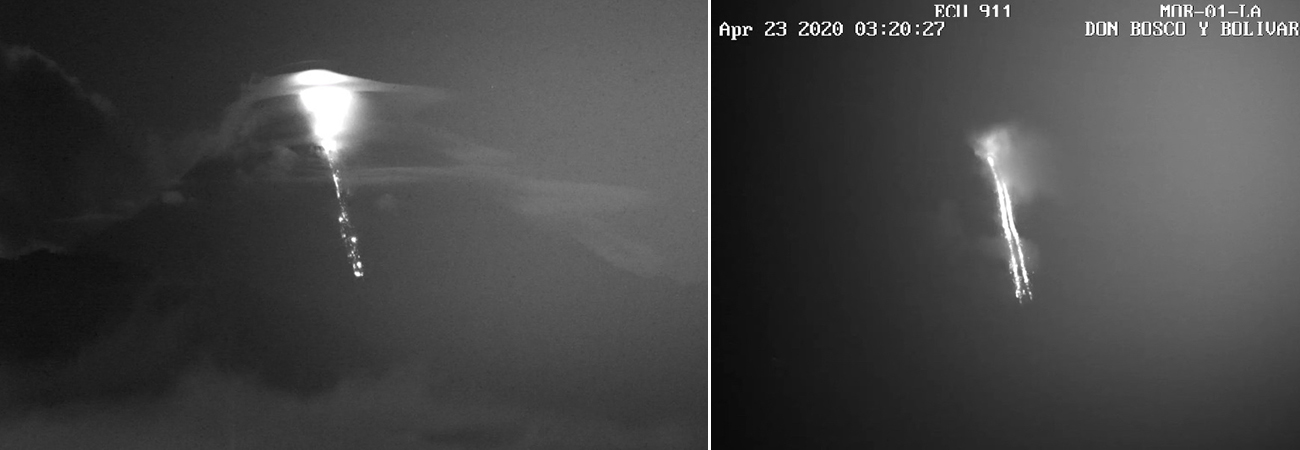
Activity during April-June 2020. Lahar activity continued during April 2020; they were reported seven times on 2, 5, 7, 11, 12, 19, and 30 April. A significant reduction in the flow of the Upano River at the entrance bridge to the city of Macas was reported 9 April, likely due to a new dam on the river upstream from where the Volcan river joins it caused by lahars related to ash emissions and pyroclastic flows (figure 70). The flow rate returned to normal the following day. Ash emissions were reported most days of the month, commonly rising 500-1,100 m above the summit and drifting W. Incandescent blocks or flows were visible on the SE flank on 4, 10, 12, 15-16, and 20-23 April (figure 71).
Activity during May 2020 included multiple daily ash emissions that drifted W and numerous lahars from plentiful rain carrying ash and debris downstream. Although there were only a few visible observations of ash plumes due to clouds, the Washington VAAC reported plumes visible in satellite imagery throughout the month. Plumes rose 570-1,170 m above the summit most days; the highest reported rose to 2,000 m above the summit on 14 May. Two lahars occurred in the early morning on 1 May and one the next day. A lahar signal lasted for three hours on 4 May. Two lahar signals were recorded on the 7th, and three on the 9th. Lahars were also recorded on 16-17, 20-22, 26-27, and 30 May. Incandescence on the SE flank was only noted three times, but it was cloudy nearly every day.
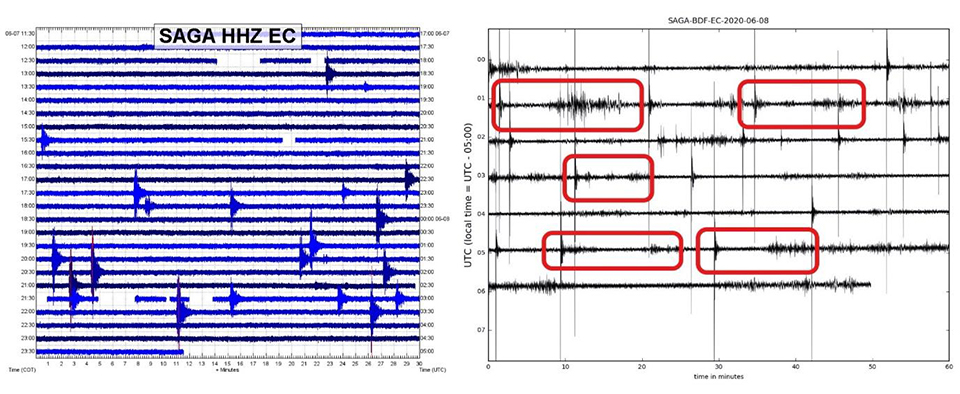
An increase in thermal and overall eruptive activity was reported during June 2020. On 1 and 2 June the webcam captured lava flows and remobilization of the deposits on the SE flank in the early morning and late at night. Incandescence was visible multiple days each week. Lahars were reported on 4 and 5 June. The frequent daily ash emissions during June generally rose to 570-1,200 m above the summit and drifted usually SW or W. The number of explosions and ash emissions increased during the evening of 7 June. IG interpreted the seismic signals from the explosions as an indication of the rise of a new pulse of magma (figure 72). The infrasound sensor log from 8 June also recorded longer duration tremor signals that were interpreted as resulting from the descent of pyroclastic flows in the SE ravine.
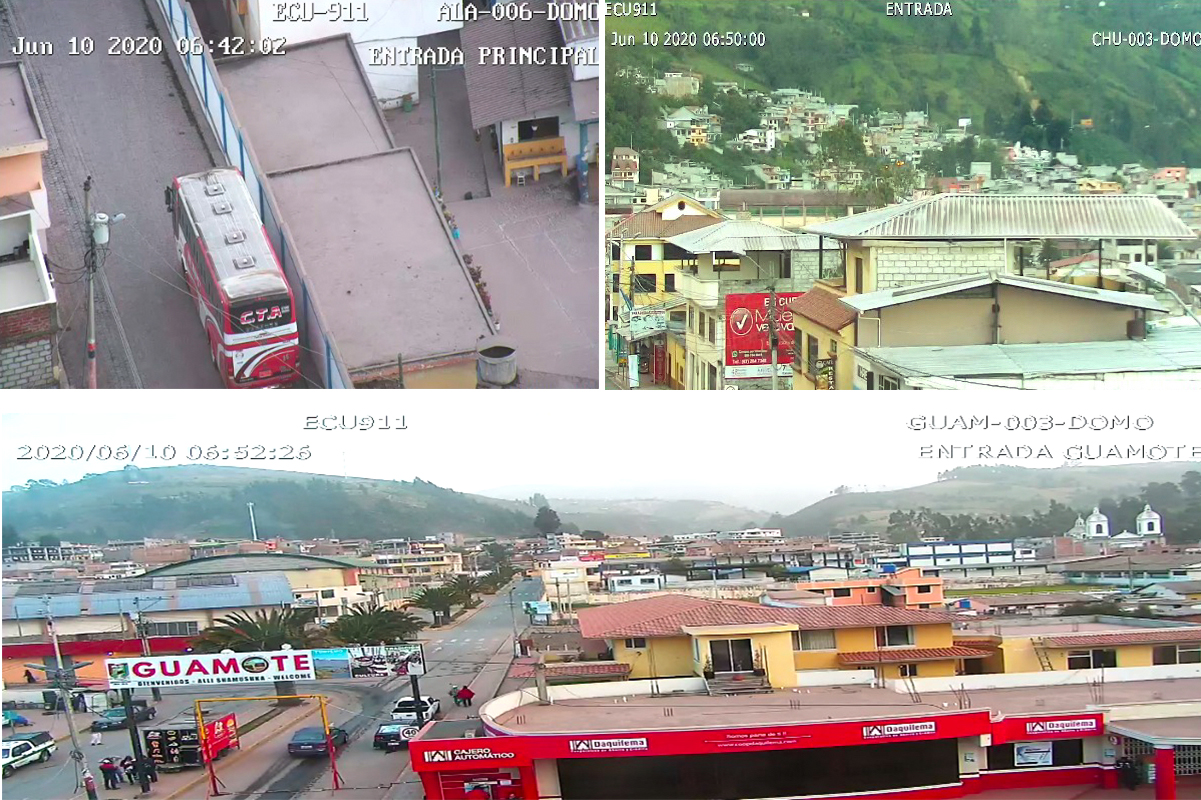
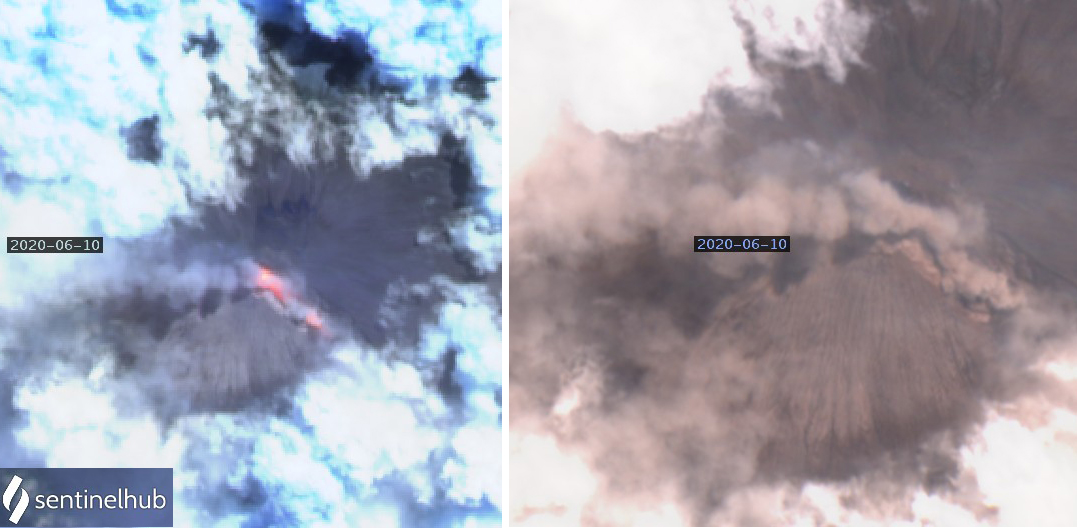
On the evening of 8 June ashfall was reported in the parish of Cebadas and in the Alausí Canton to the W and SW of Sangay. There were several reports of gas and ash emissions to 1,770 m above the summit the next morning on 9 June, followed by reports of ashfall in the provinces of Guayas, Santa Elena, Los Ríos, Morona Santiago, and Chimborazo. Ashfall continued in the afternoon and was reported in Alausí, Chunchi, Guamote, and Chillanes. That night, which was clear, the webcam captured images of pyroclastic flows down the SE-flank ravine; IG attributed the increase in activity to the collapse of one or more lava fronts. On the evening of 10 June additional ashfall was reported in the towns of Alausí, Chunchi, and Guamote (figure 73); satellite imagery indicated an ash plume drifting W and incandescence from pyroclastic flows in the SE-flank ravine the same day (figure 74).
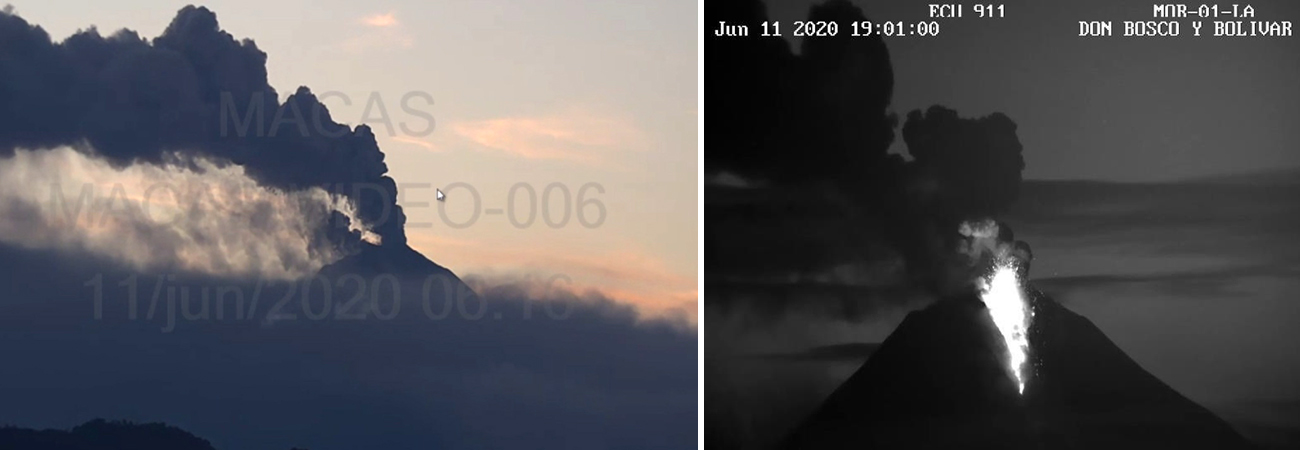
Ashfall continued on 11 June and was reported in Guayaquil, Guamote, Chunchi, Riobamba, Guaranda, Chimbo, Echandía, and Chillanes. The highest ash plume of the report period rose to 2,800 m above the summit that day and drifted SW. That evening the SNGRE (Servicio Nacional de Gestion de Riesgos y Emergencias) reported ash fall in the Alausí canton. IG noted the increase in intensity of activity and reported that the ash plume of 11 June drifted more than 600 km W (figure 75). Ash emissions on 12 and 13 June drifted SW and NW and resulted in ashfall in the provinces of Chimborazo, Cotopaxi, Tungurahua, and Bolívar. On 14 June, the accumulation of ash interfered with the transmission of information from the seismic station. Lahars were reported each day during 15-17 and 19-21 June. Trace amounts of ashfall were reported in Macas to the SE on 25 June.
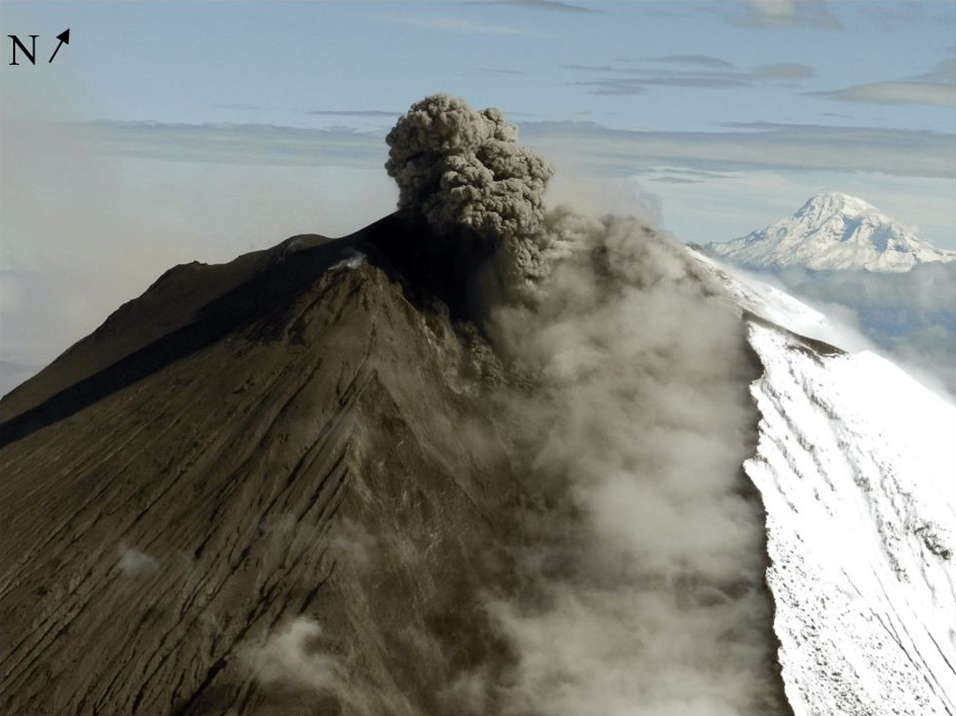
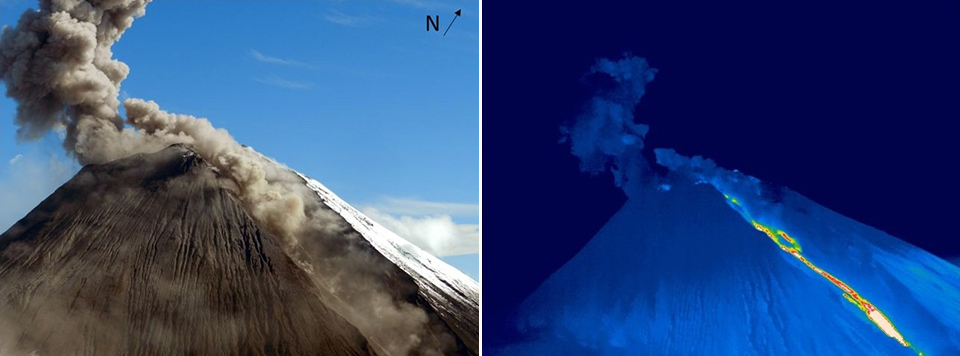
During an overflight of Sangay on 24 June IG personnel observed that activity was characterized by small explosions from the summit vent and pyroclastic flows down the SE-flank ravine. The explosions produced small gas plumes with a high ash content that did not rise more than 500 m above the summit and drifted W (figure 76). The pyroclastic flows were restricted to the ravine on the SE flank, although the ash from the flows rose rapidly and reached about 200 m above the surface of the ravine and also drifted W (figure 77).
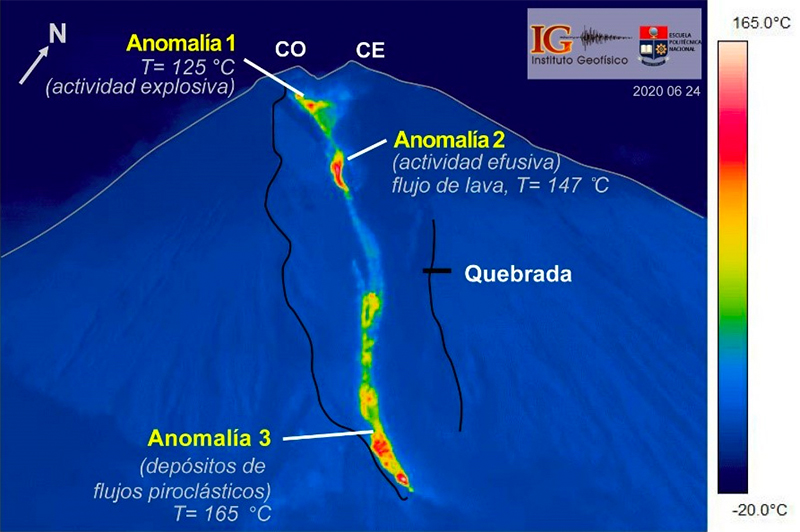
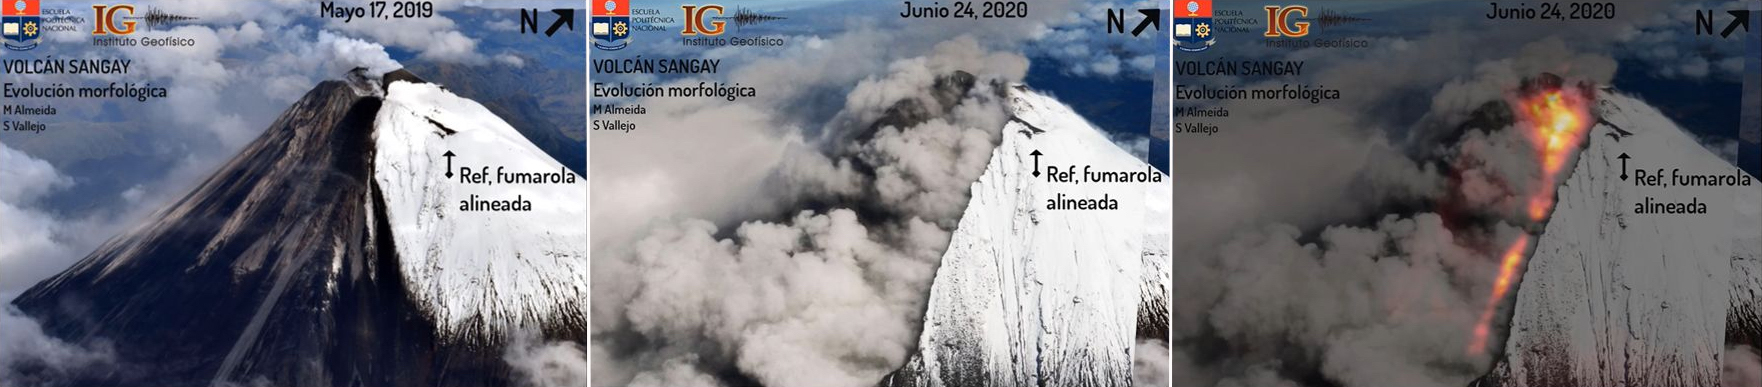
Infrared imagery taken during the overflight on 24 June identified three significant thermal anomalies in the large ravine on the SE flank (figure 78). Analysis by IG scientists suggested that the upper anomaly 1 (125°C) was associated with explosive activity that was observed during the flight. Anomaly 2 (147°C), a short distance below Anomaly 1, was possibly related to effusive activity of a small flow, and Anomaly 3 (165°C) near the base of the ravine that was associated with pyroclastic flow deposits. The extent of the changes at the summit of Sangay and along the SE flank since the beginning of the eruption that started in March 2019 were clearly visible when images from May 2019 were compared with images from the 24 June 2020 overflight (figure 79). The upper part of the ravine was nearly 400 m wide by the end of June.
Geological Summary. The isolated Sangay volcano, located east of the Andean crest, is the southernmost of Ecuador's volcanoes and its most active. The steep-sided, glacier-covered, dominantly andesitic volcano grew within the open calderas of two previous edifices which were destroyed by collapse to the east, producing large debris avalanches that reached the Amazonian lowlands. The modern edifice dates back to at least 14,000 years ago. It towers above the tropical jungle on the east side; on the other sides flat plains of ash have been eroded by heavy rains into steep-walled canyons up to 600 m deep. The earliest report of an eruption was in 1628. Almost continuous eruptions were reported from 1728 until 1916, and again from 1934 to the present. The almost constant activity has caused frequent changes to the morphology of the summit crater complex.
Information Contacts: Instituto Geofísico, Escuela Politécnica Nacional (IG-EPN), Casilla 17-01-2759, Quito, Ecuador (URL: http://www.igepn.edu.ec/); Global Sulfur Dioxide Monitoring Page, Atmospheric Chemistry and Dynamics Laboratory, NASA Goddard Space Flight Center (NASA/GSFC), 8800 Greenbelt Road, Goddard, Maryland, USA (URL: https://so2.gsfc.nasa.gov/); Washington Volcanic Ash Advisory Center (VAAC), Satellite Analysis Branch (SAB), NOAA/NESDIS OSPO, NOAA Science Center Room 401, 5200 Auth Rd, Camp Springs, MD 20746, USA (URL: www.ospo.noaa.gov/Products/atmosphere/vaac, archive at: http://www.ssd.noaa.gov/VAAC/archive.html); MIROVA (Middle InfraRed Observation of Volcanic Activity), a collaborative project between the Universities of Turin and Florence (Italy) supported by the Centre for Volcanic Risk of the Italian Civil Protection Department (URL: http://www.mirovaweb.it/); Sentinel Hub Playground (URL: https://www.sentinel-hub.com/explore/sentinel-playground); Arnold Binas (URL: https://www.doroadventures.com).