Report on Yasur (Vanuatu) — September 2020
Bulletin of the Global Volcanism Network, vol. 45, no. 9 (September 2020)
Managing Editor: Edward Venzke.
Edited by Kadie L. Bennis. Research and preparation by Paul Berger.
Yasur (Vanuatu) Ash and gas explosions continue through August 2020
Please cite this report as:
Global Volcanism Program, 2020. Report on Yasur (Vanuatu) (Bennis, K.L., and Venzke, E., eds.). Bulletin of the Global Volcanism Network, 45:9. Smithsonian Institution. https://doi.org/10.5479/si.GVP.BGVN202009-257100
Yasur
Vanuatu
19.532°S, 169.447°E; summit elev. 361 m
All times are local (unless otherwise noted)
Recent activity at Yasur, which has been erupting since July 1774, includes frequent Strombolian explosions, along with ash and gas plumes from several vents in the summit crater (BGVN 44:02, 45:03). This report summarizes activity during March through August 2020, using information from monthly bulletins of the Vanuatu Meteorology and Geo-Hazards Department (VMGD) and various satellite data. The volcano has remained on Alert Level 2 (major unrest state, on a scale of 0-5), where it has been since 18 October 2016, according to VMGD.
During the current reporting period, VMGD reported that explosive activity continued at an elevated level, with ongoing ash and gas emissions (figure 71). Some of the more intense explosions ejected bombs outside the summit crater. During 2-3, 13, and 17 March, 2-3 April, and 19 July, the Wellington Volcanic Ash Advisory Center (VAAC) identified low-level ash plumes that reached an altitude of 1.5 km and drifted in multiple directions; the ash plume during 2-3 April resulted in ashfall on the SSW part of the island. On 19 May an ash plume rose to a maximum altitude of 2.1 km and drifted SE.
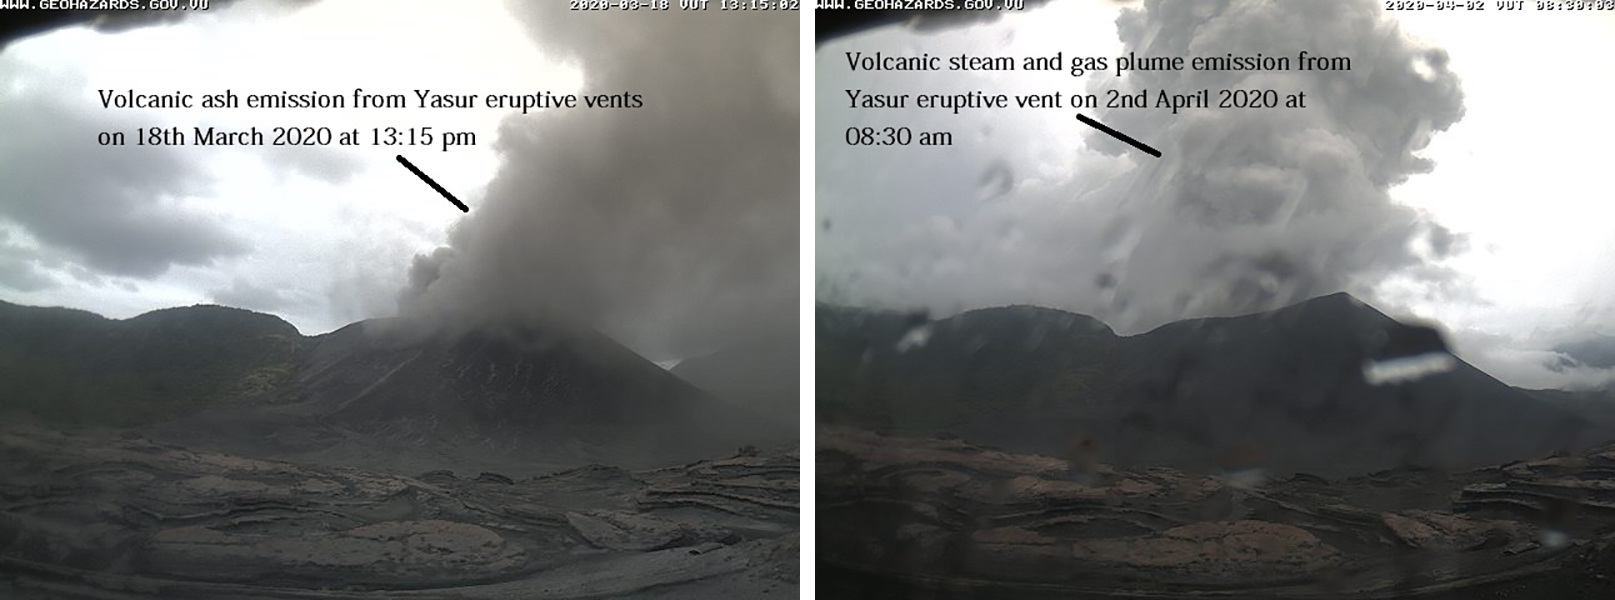 |
Figure 71. Webcam photos of ash emissions from Yasur on 18 March (left)and gas-and-steam emissions on 2 April (right) 2020. Courtesy of VMGD. |
During the reporting period, the MODVOLC thermal algorithm using MODIS satellite data detected a total of 55 thermal hotspots during three days in April, nine days in May, six days in June and August, and four days in July. A maximum of four pixels were recorded on a single day during 26 May, 6 June, and 20 July. The MIROVA (Middle InfraRed Observation of Volcanic Activity) analysis of MODIS satellite data detected numerous hotspots from 16 September 2019 through August 2020, with a slight increase in power and frequency during May (figure 72). Satellite images from Sentinel-2 detected a strong thermal anomaly within the summit crater on 10 May, accompanied by ash and gas emissions (figure 73).
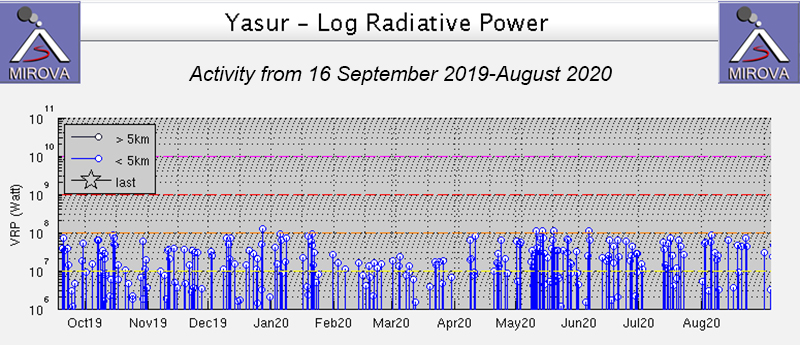 |
Figure 72. Persistent low to moderate thermal activity at Yasur occurred from the summit area from 16 September 2019 through August 2020, as shown in this MIROVA graph (Log Radiative Power). Courtesy of MIROVA. |
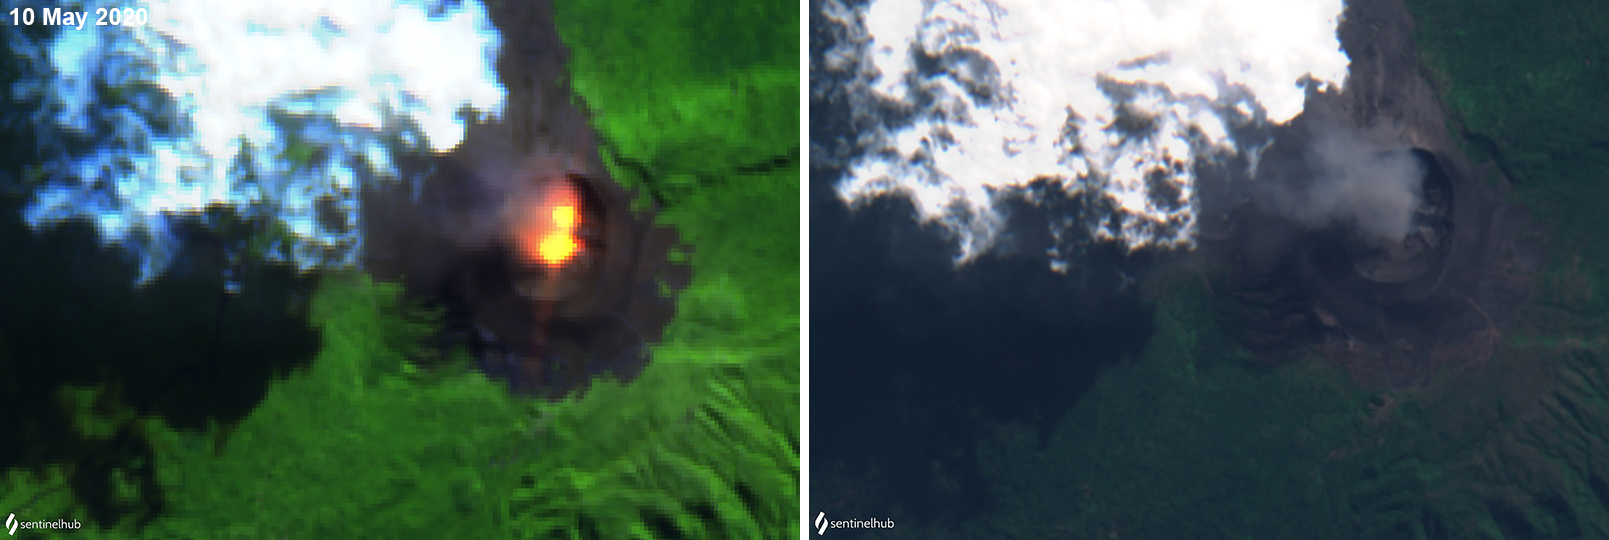 |
Figure 73. Sentinel-2 images of Yasur on 10 May 2020 showing a strong thermal anomaly from the summit crater (left) and a gas emission that appears to contain some ash (right). The thermal anomaly in the S vent area was stronger than in the N vent, an observation also noted in March and April 2019 (BGVN 44:06). The volcano was usually obscured by clouds during March through August. The left image is in false color (bands 12, 11, 4) rendering, the right image is in natural color (bands 4, 3, 2) rendering; courtesy of Sentinel Hub Playground. |
High-resolution satellite sensors commonly recorded moderate sulfur dioxide levels drifting in multiple directions from the volcano. High sulfur dioxide levels were also occasionally observed, especially during March (figure 74).
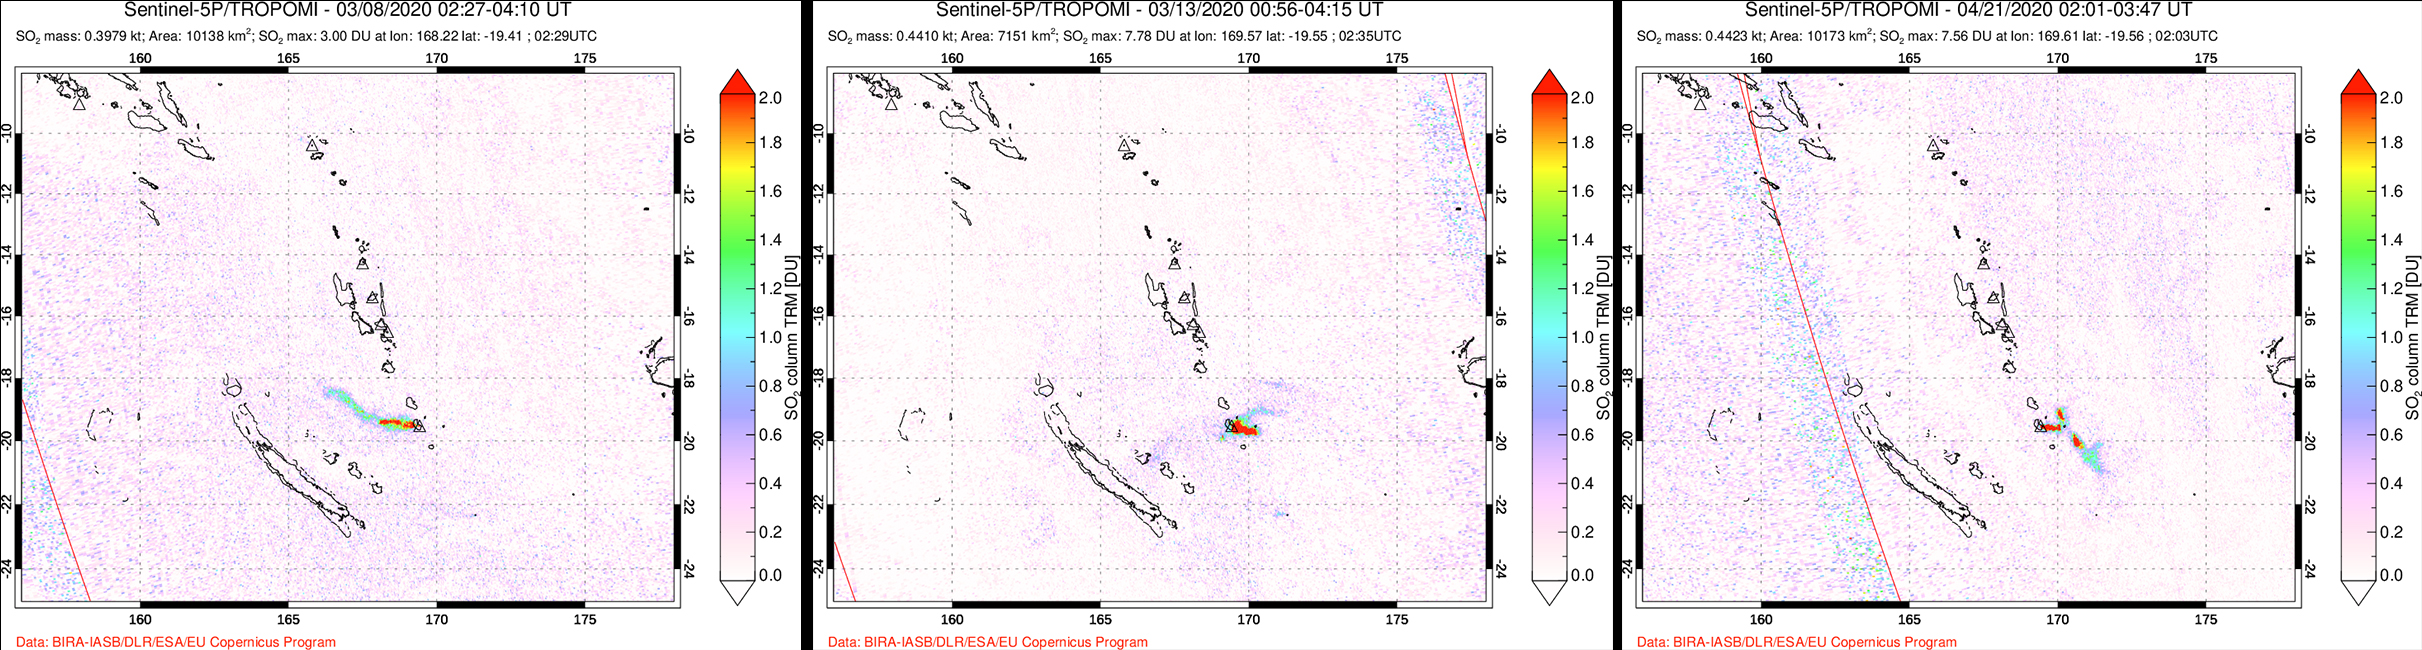 |
Figure 74. High-density SO2 emissions streaming from Yasur during 8 (left) and 13 (middle) March and 21 April (right) 2020, were observed using the TROPOMI imaging spectrometer on the Sentinel-5P satellite. The plume drifted W on 8 March and E on both 13 March and 21 April. Courtesy of NASA Global Sulfur Dioxide Monitoring Page. |
Geological Summary. Yasur has exhibited essentially continuous Strombolian and Vulcanian activity at least since Captain Cook observed ash eruptions in 1774. This style of activity may have continued for the past 800 years. Located at the SE tip of Tanna Island in Vanuatu, this pyroclastic cone has a nearly circular, 400-m-wide summit crater. The active cone is largely contained within the small Yenkahe caldera, and is the youngest of a group of Holocene volcanic centers constructed over the down-dropped NE flank of the Pleistocene Tukosmeru volcano. The Yenkahe horst is located within the Siwi ring fracture, a 4-km-wide open feature associated with eruption of the andesitic Siwi pyroclastic sequence. Active tectonism along the Yenkahe horst accompanying eruptions has raised Port Resolution harbor more than 20 m during the past century.
Information Contacts: Geo-Hazards Division, Vanuatu Meteorology and Geo-Hazards Department (VMGD), Ministry of Climate Change Adaptation, Meteorology, Geo-Hazards, Energy, Environment and Disaster Management, Private Mail Bag 9054, Lini Highway, Port Vila, Vanuatu (URL: http://www.vmgd.gov.vu/, https://www.facebook.com/VanuatuGeohazardsObservatory/); Wellington Volcanic Ash Advisory Centre (VAAC), Meteorological Service of New Zealand Ltd (MetService), PO Box 722, Wellington, New Zealand (URL: http://vaac.metservice.com/index.html); Hawai'i Institute of Geophysics and Planetology (HIGP) MODVOLC Thermal Alerts System, School of Ocean and Earth Science and Technology (SOEST), Univ. of Hawai'i, 2525 Correa Road, Honolulu, HI 96822, USA (URL: http://modis.higp.hawaii.edu/); MIROVA (Middle InfraRed Observation of Volcanic Activity), a collaborative project between the Universities of Turin and Florence (Italy) supported by the Centre for Volcanic Risk of the Italian Civil Protection Department (URL: http://www.mirovaweb.it/); Sentinel Hub Playground (URL: https://www.sentinel-hub.com/explore/sentinel-playground); Global Sulfur Dioxide Monitoring Page, Atmospheric Chemistry and Dynamics Laboratory, NASA Goddard Space Flight Center (NASA/GSFC), 8800 Greenbelt Road, Goddard, Maryland, USA (URL: https://so2.gsfc.nasa.gov/).