Nishinoshima
Japan
27.247°N, 140.874°E; summit elev. 100 m
All times are local (unless otherwise noted)
Japan’s Nishinoshima volcano, located about 1,000 km S of Tokyo in the Ogasawara Arc, erupted above sea level in November 2013 after 40 years of dormancy. Activity lasted through November 2015 and returned during mid-2017, continuing the growth of the island with ash plumes, ejecta, and lava flows. A short eruptive event in July 2018 produced a small lava flow and vent on the side of the pyroclastic cone. The next eruption of ash plumes, incandescent ejecta, and lava flows began in early December 2019, resulting in significant growth of the island. This report covers the ongoing activity from March-August 2020 when activity decreased. Information is provided primarily from Japan Meteorological Agency (JMA) monthly reports and the Japan Coast Guard (JCG), which makes regular overflights to make observations.
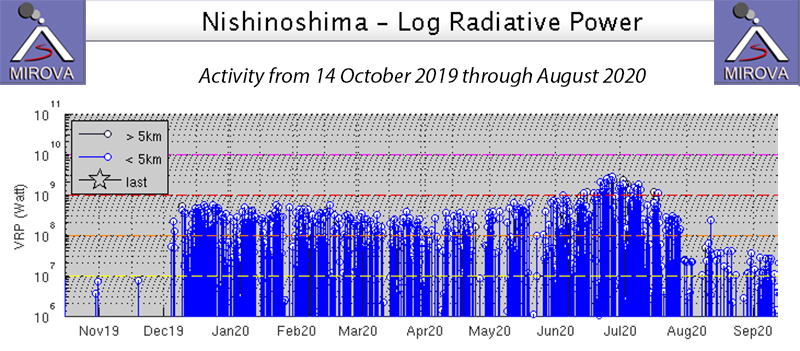
Renewed eruptive activity that began on 5 December 2019 continued during March-August 2020 but appeared to wane by the end of August. Major lava flows covered all sides of the island, with higher levels of activity during late June and early July. Ash emissions increased significantly during June and produced dense black ash plumes that rose up to 6 km altitude in early July. Explosive activity produced lightning and incandescent jets that rose 200 m and large bombs that fell to the base of the pyroclastic cone. Lava flow activity diminished at the end of July. Ash emissions decreased throughout August and appeared to cease after 27 August 2020. The MIROVA plot clearly reflects the high levels of thermal activity between December 2019 and August 2020 (figure 80); this event was reported by JMA as the largest eruption recorded to date. Sulfur dioxide emissions were very high during late June through early August, producing emissions that drifted across much of the western Pacific region.
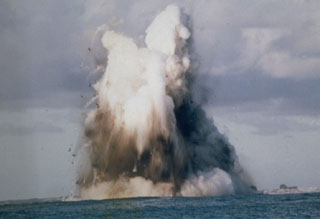
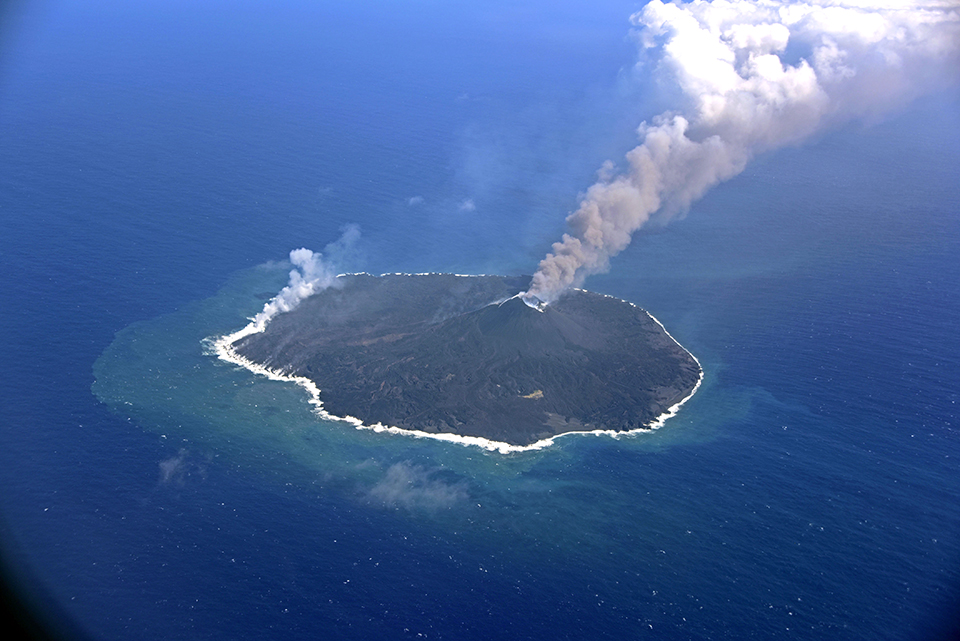
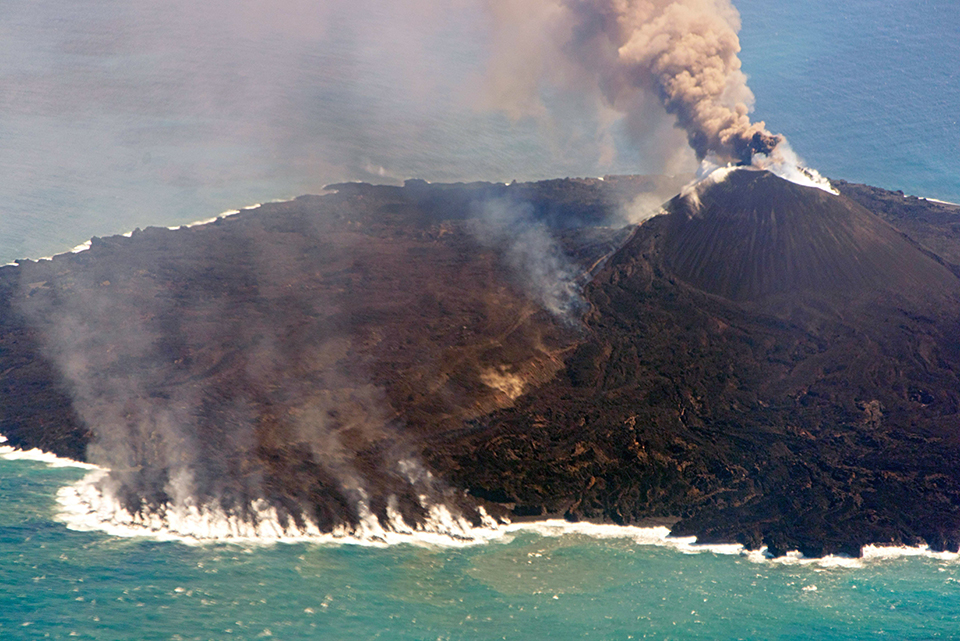
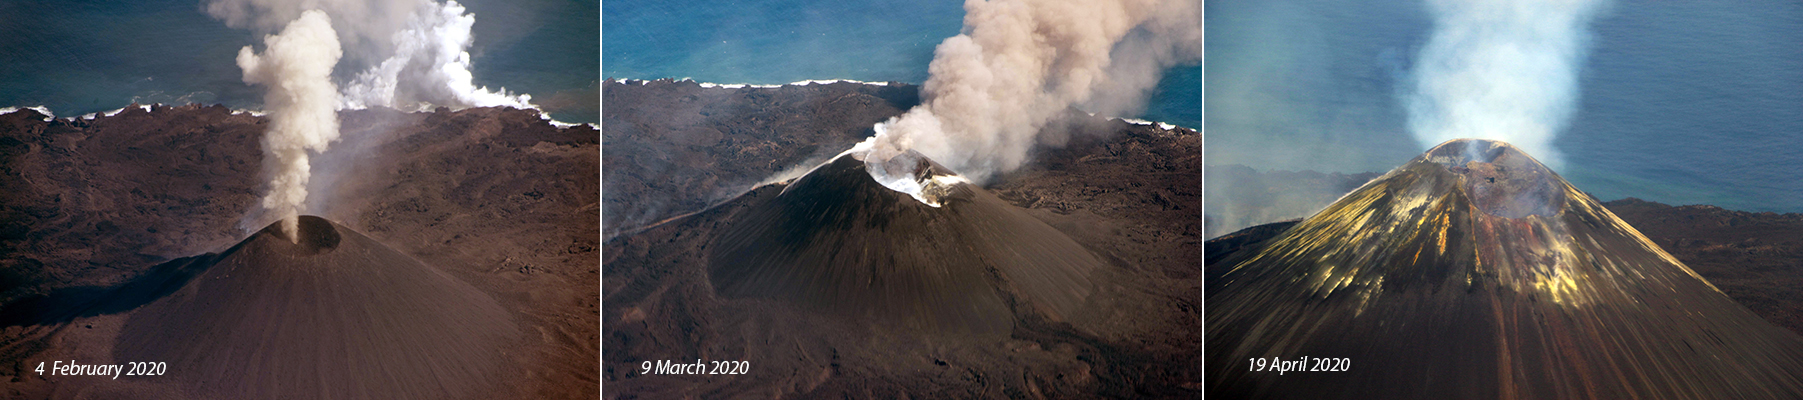
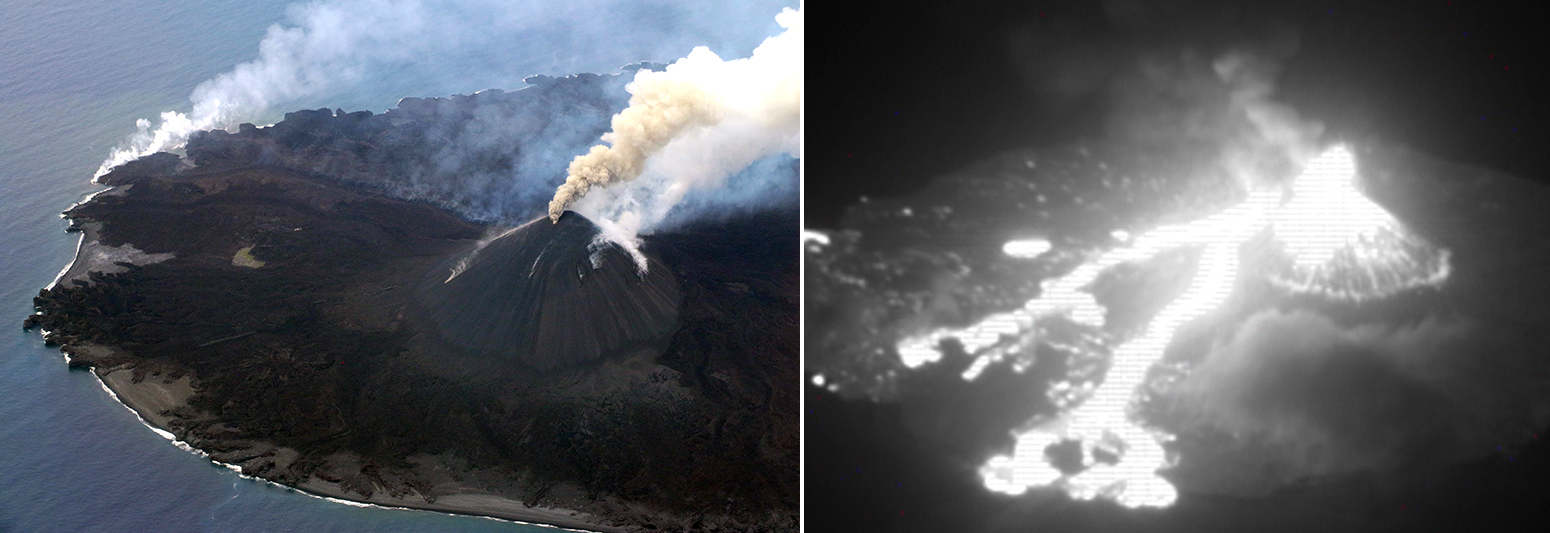
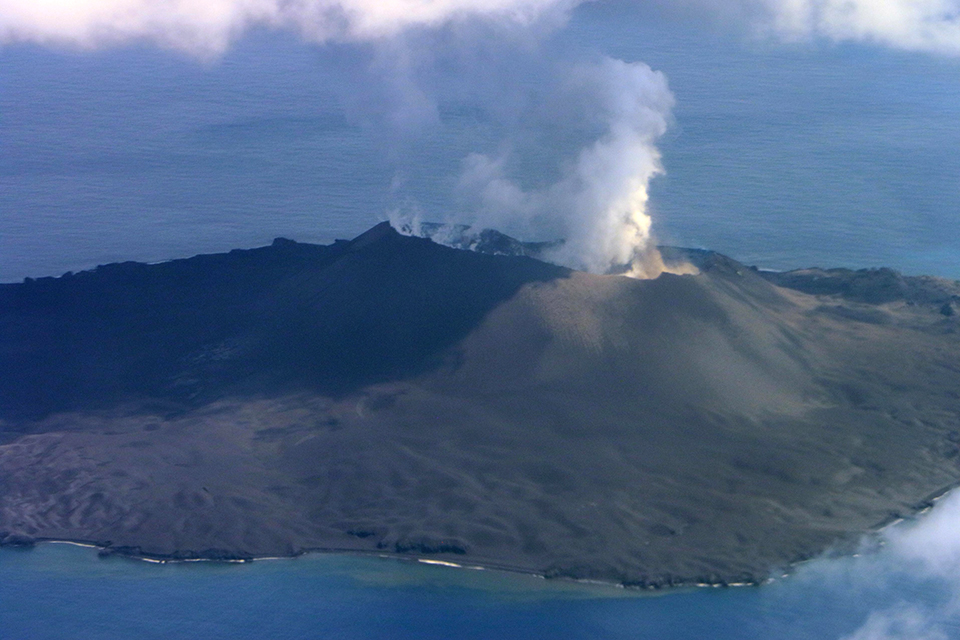
The Japan Coast Guard (JCG) conducted overflights of Nishinoshima on 9 and 15 March 2020 (figure 81). During both visits they observed eruptive activity from the summit crater, including ash emissions that rose to an altitude of approximately 1,000 m and lava flowing down the N and SE flanks (figure 82). Large ejecta was scattered around the base of the pyroclastic cone. The lava flowing north had reached the coast and was producing vigorous steam as it entered the water on 9 March; whitish gas emissions were visible on the N flank of the cone at the source of the lava flow (figure 83). On 9 March yellow-green discolored water was noted off the NE shore. The lava flow on the SE coast produced a small amount of steam at the ocean entry point and a strong signal in thermal imagery on 15 March (figure 84). Multiple daily MODVOLC thermal alerts were issued during 1-10, 17-24, and 27-30 March. Landsat-8 visual and thermal imagery on 30 March 2020 confirmed that thermal anomalies on the N and SE flanks of the volcano continued.
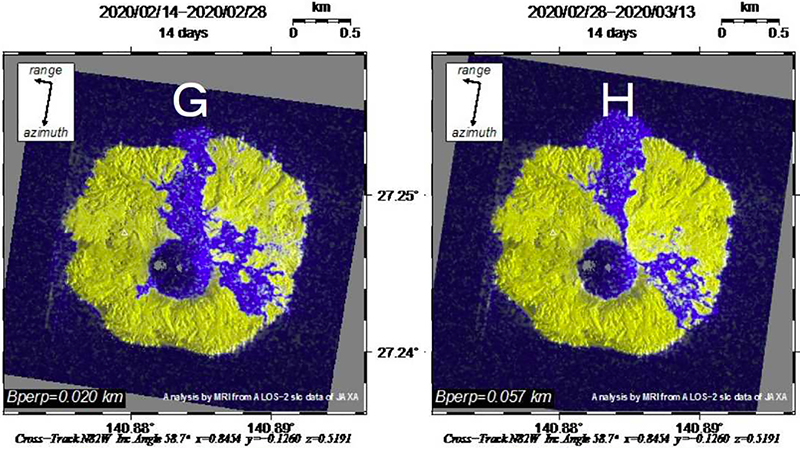
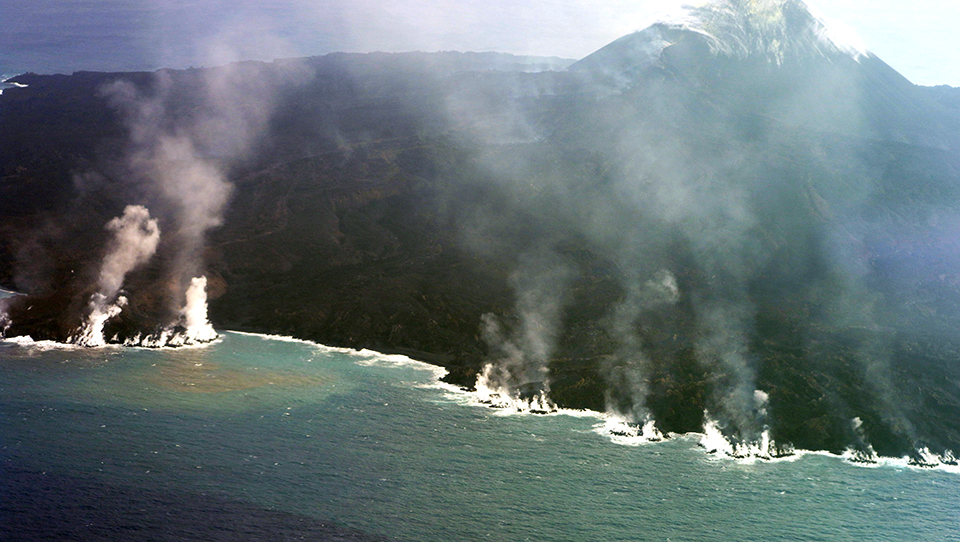
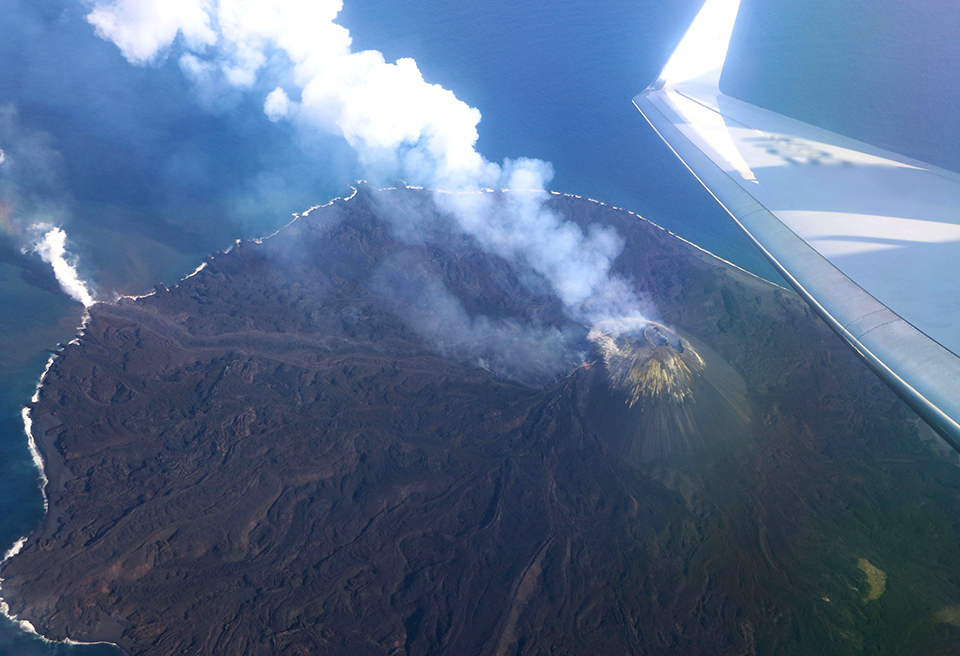
Ash emissions were not observed at Nishinoshima during JCG overflights on 6, 16, and 19 April 2020, but gas-and-steam emissions were noted from the summit crater, and a yellow discoloration interpreted by JMA to be sulfur precipitation was observed near the top of the pyroclastic cone. The summit crater was larger than during previous visits. Steam plumes seen each of those days on the N and NE coasts suggested active ocean entry of lava flows (figure 85). A lava flow was observed emerging from the E flank of the cone and entering the ocean on the E coast on 19 and 29 April (figure 86). During the overflight on 29 April observers noted lava flowing southward from a vent on the E flank of the pyroclastic cone. A narrow, brown, ash plume was visible on 29 April at the summit crater rising to an altitude of about 1,500 m. Thermal observations indicated continued flow activity throughout the month. Multiple daily MODVOLC thermal alerts were recorded during 2-6, 10-11, 17-23, and 28-30 April. Significant growth of the pyroclastic cone occurred between early February and late April 2020 (figure 87).
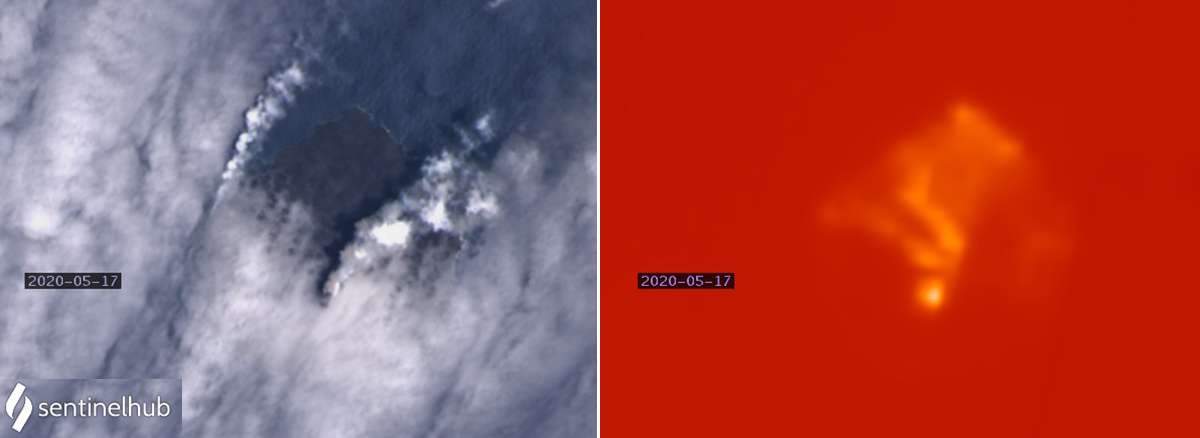
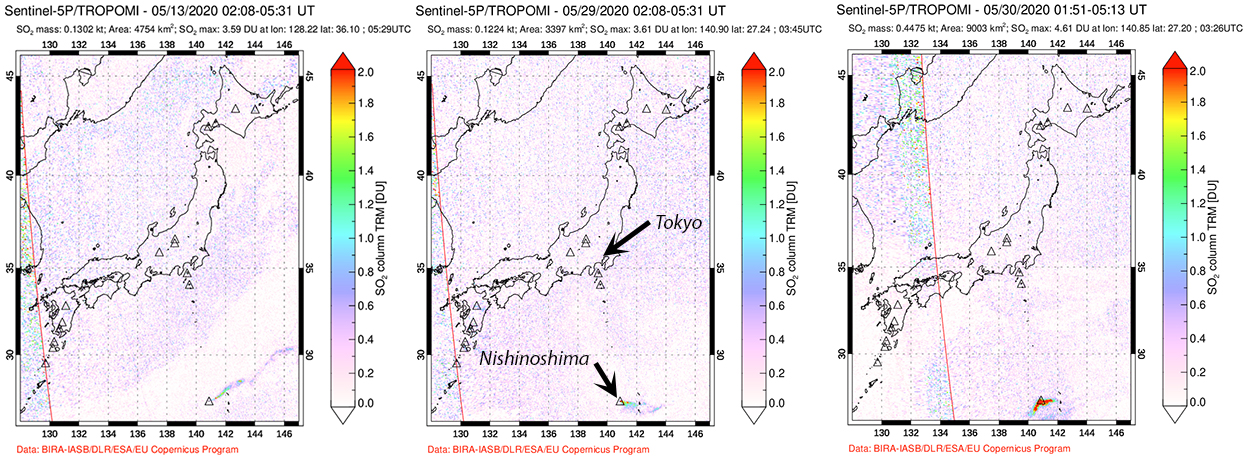
Infrared satellite imagery from 17 May 2020 showed a strong thermal anomaly at the summit and hot spots on the NW flank indicative of flows. Visible imagery confirmed emissions at the summit and steam plumes on the NW flank (figure 88). Gray ash plumes rose to about 1,800 m altitude on 18 May during the only overflight of the month made by the Japan Coast Guard. In addition, white gas emissions rose from around the summit area and large blocks of ejecta were scattered around the base of the pyroclastic cone (figure 89). Steam from ocean-entry lava on the N flank was reduced from previous months, but a new flow moving NW into the ocean was generating a steam plume and a strong thermal signature. Multi-pixel thermal alerts were measured by the MODVOLC system on 1-3, 9-10, 13-15, 18, and 26-30 May. Sulfur dioxide emissions had been weak and intermittent from March through early May 2020 but became more persistent during the second half of May. Although modest in size, the plumes were detectible hundreds of kilometers away from the volcano (figure 90).
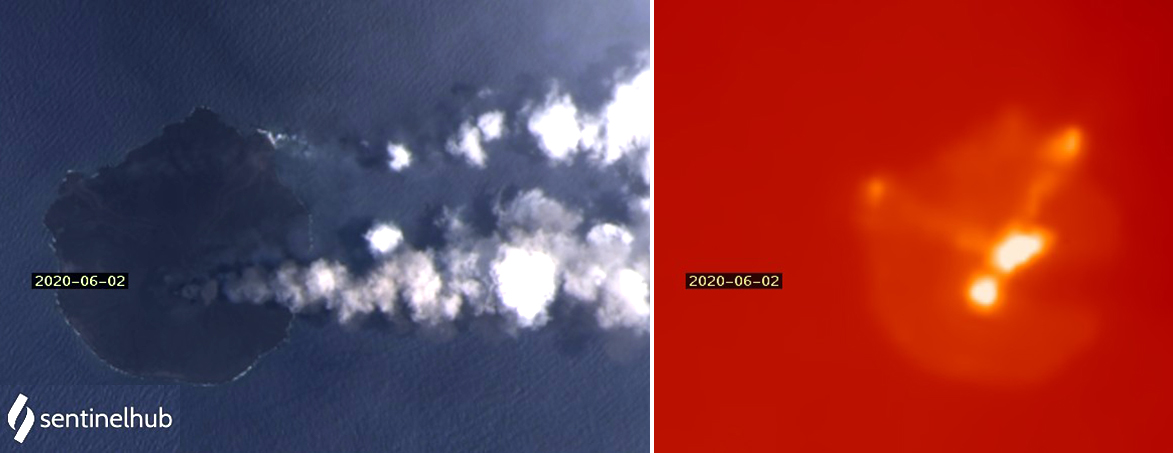
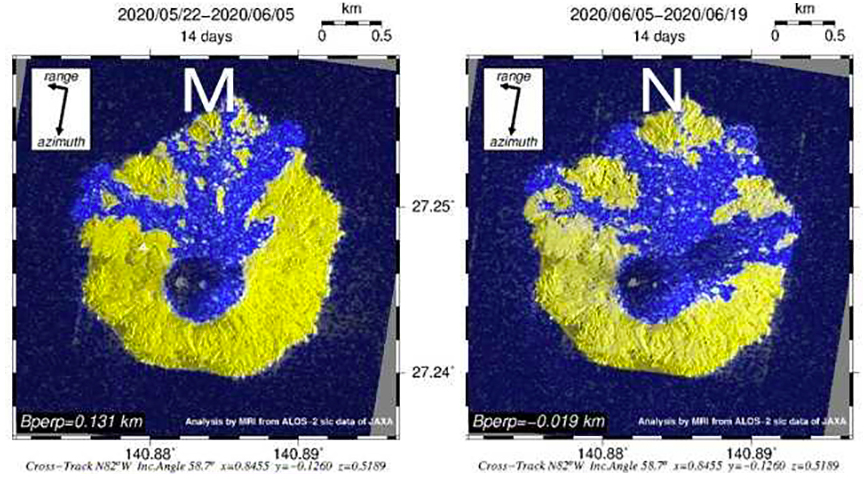
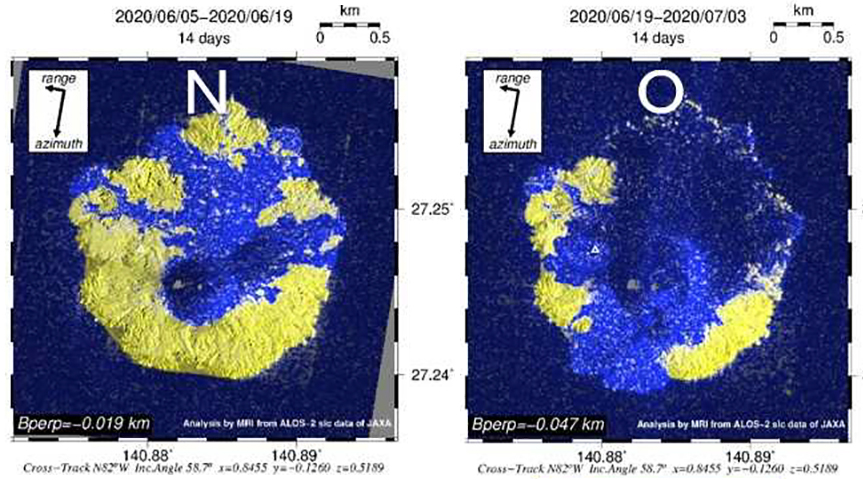
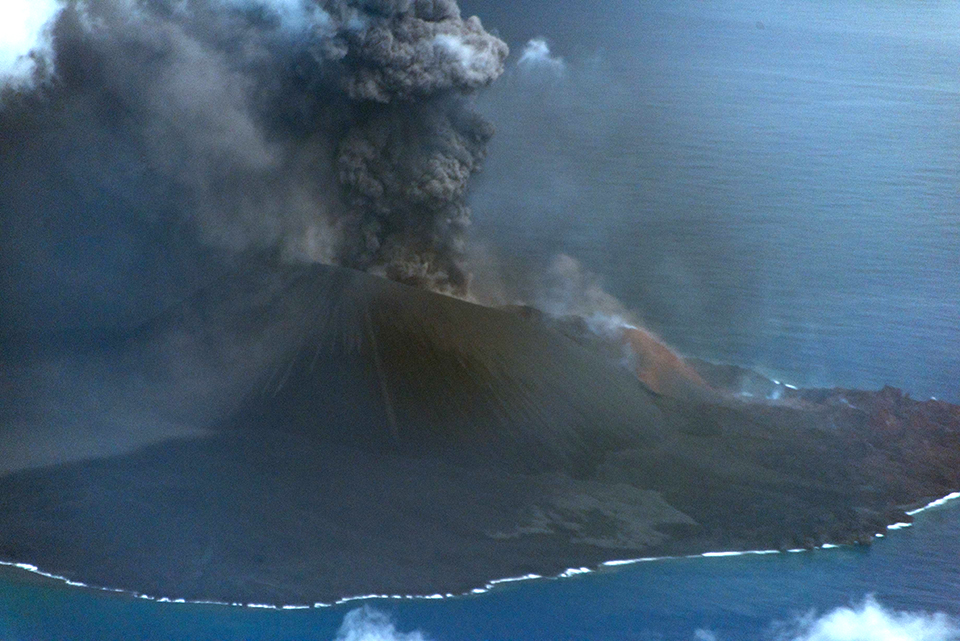
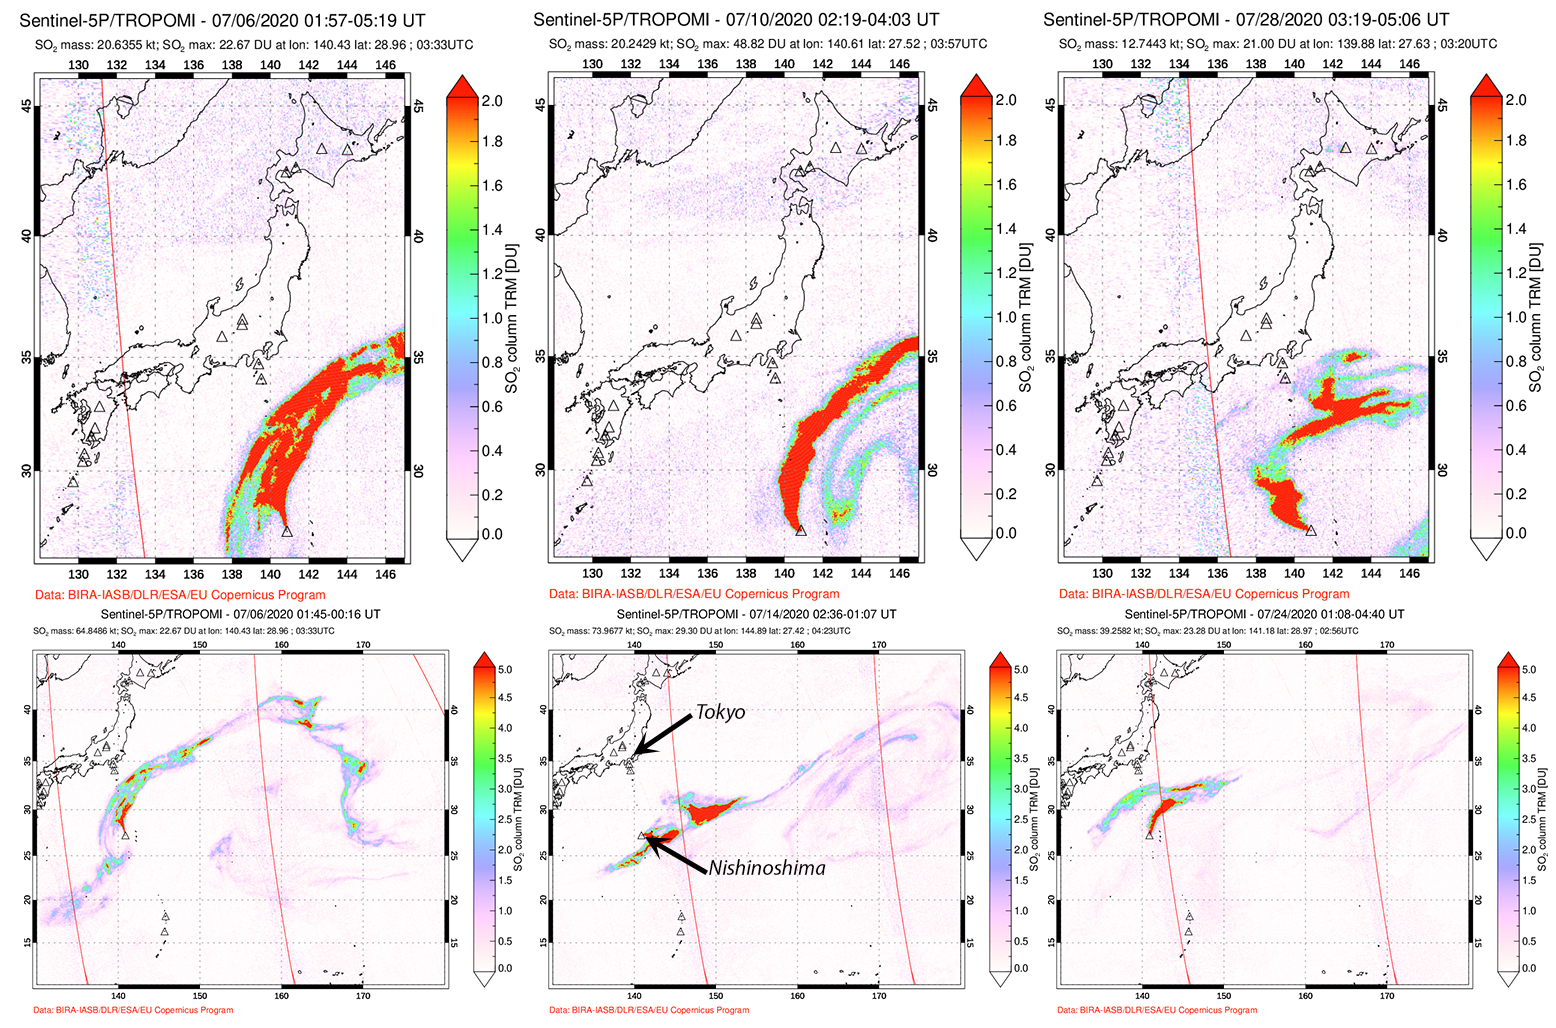
Activity increased significantly during June 2020. Satellite imagery from 2 June revealed two intense thermal anomalies at the summit indicating a new crater, and lava flows active on the NW and NE flanks, all showing gas or steam emissions (figure 91). Dense brown and gray ash emissions were observed rising from the summit crater during JCG overflights on 7 and 15 June (figure 92). Plumes reached at least 1,500 m altitude, and ejecta reached the base of the pyroclastic cone. Between 5 and 19 June the lava flow on the WNW coast slowed significantly, while the flows to the N and E became significantly more active (figure 93). The Tokyo VAAC reported the first ash plume since mid-February on 12 June rose to 2.1 km and drifted NE. On 14 June they reported an ash plume extending E at 2.7 km altitude. Dense emissions continued to drift N and E at 2.1-2.7 km altitude until the last week of the month. The JCG overflight on 19 June observed darker ash emissions than two weeks earlier that drifted at least 180 km NE (figure 94) and incandescent tephra that exploded from the enlarged summit area where three overlapping craters trending E-W had formed.
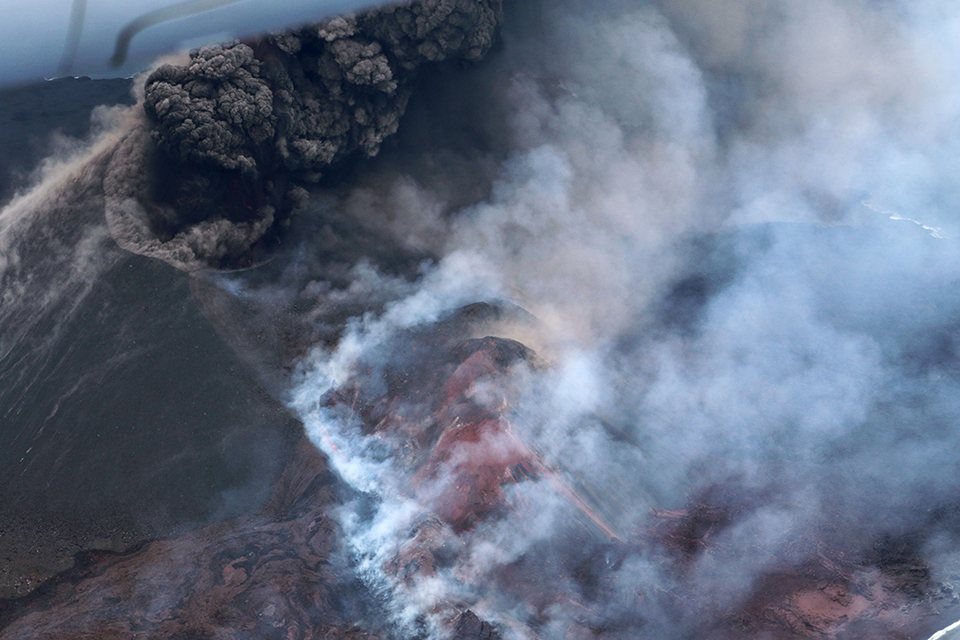
The Tokyo VAAC reported ash emissions that rose to 4.6 km altitude and drifted NE on 25 June. For the remainder of the month they rose to 2.7-3.9 km altitude and drifted N and NE. By the time of the JCG overflight on 29 June, the new crater that had opened on the SW flank had merged with the summit crater (figure 95). Dense black ash emissions rose to 3.4 km altitude and drifted NE, lava flowed down the SW flank into the ocean producing violent steam explosions, and incandescent tephra was scattered at least 200 m from the base of the pyroclastic cone from ongoing explosive activity (figure 96). Multiple layers of recent flow activity were visible along the SW coast (figure 97). Yellow-green discolored water encircled the entire island with a width of 1,000 m.
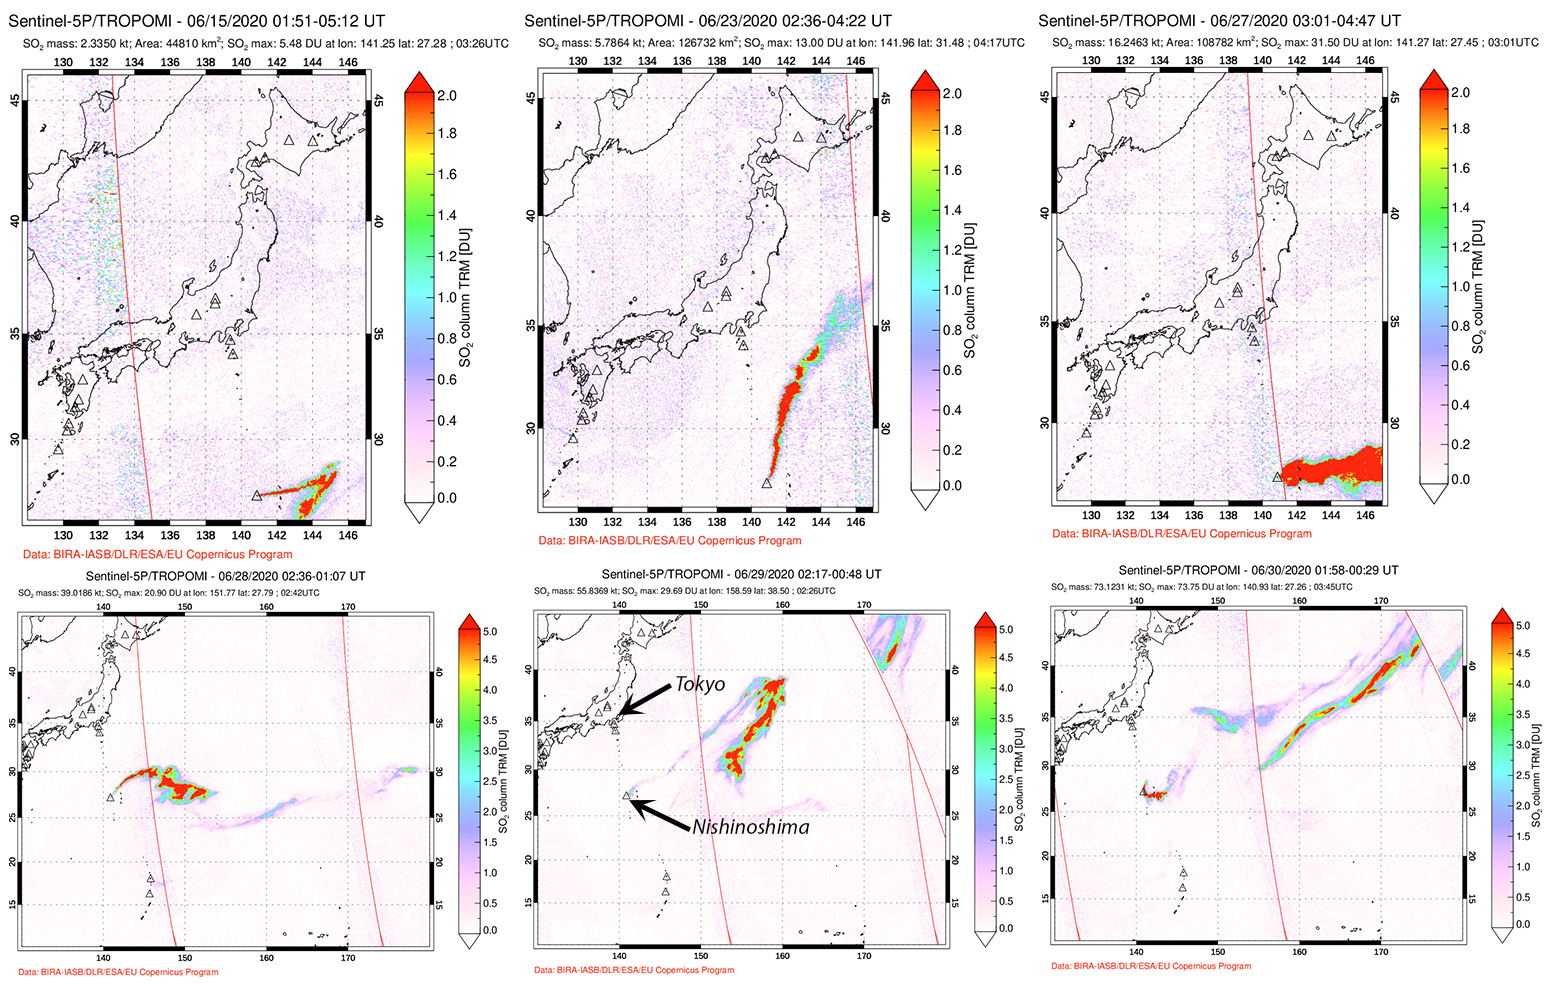
MODVOLC thermal alerts reached their highest levels of the period during June 2020 with multi-pixel alerts recorded on most days of the month. Sulfur dioxide emissions increased steadily throughout June to the highest levels recorded for Nishinoshima; by the end of the month plumes of SO2 were drifting thousands of kilometers across the Pacific Ocean and being captured in complex atmospheric circulation currents (figure 98).
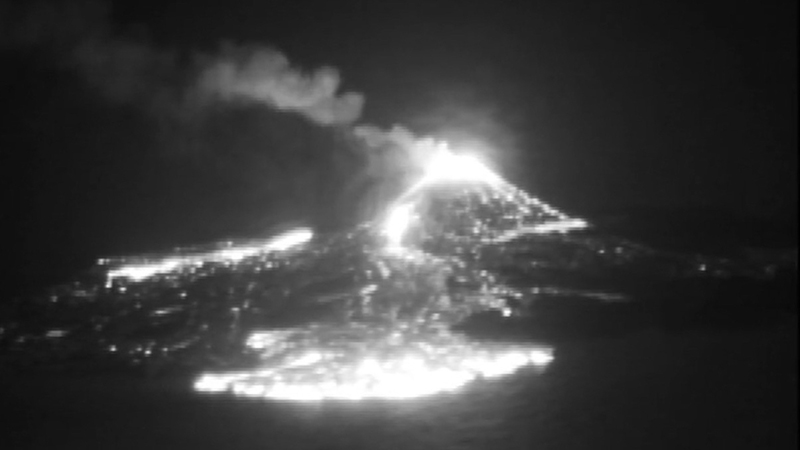
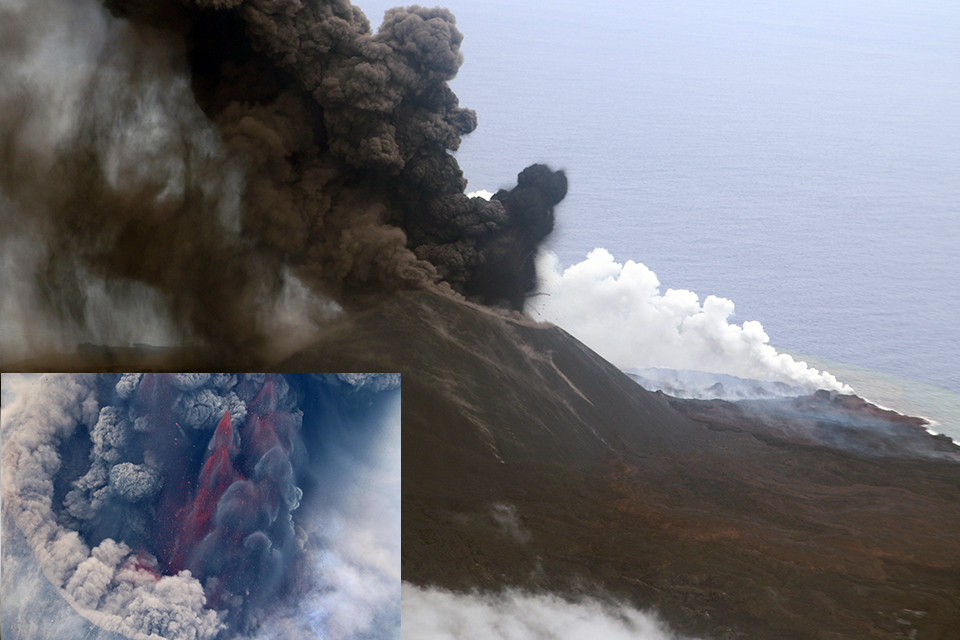
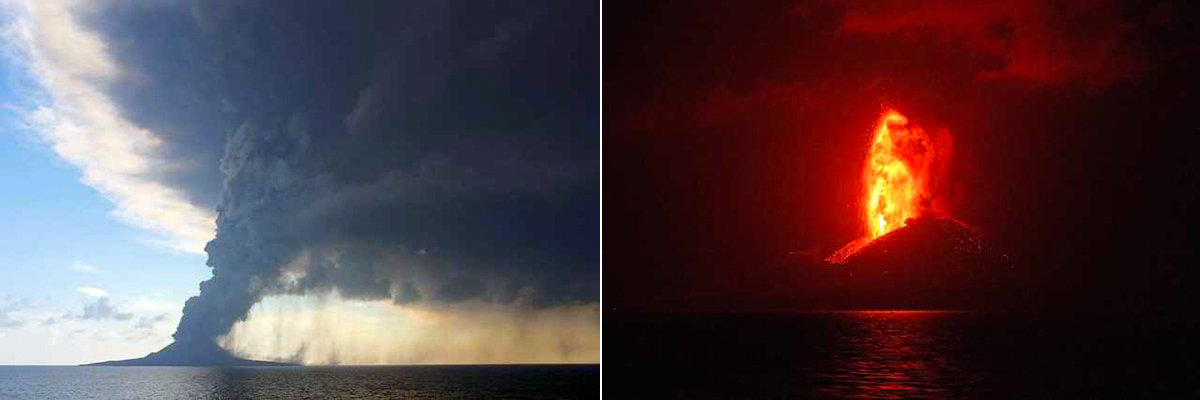
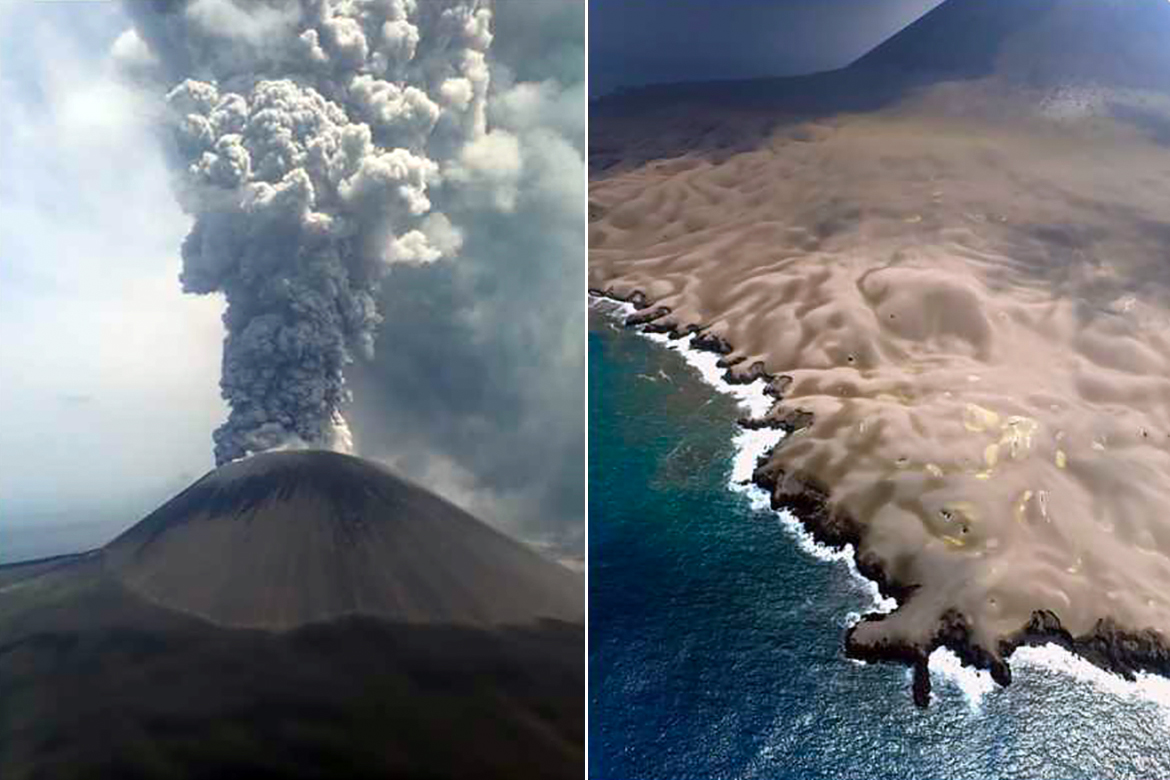
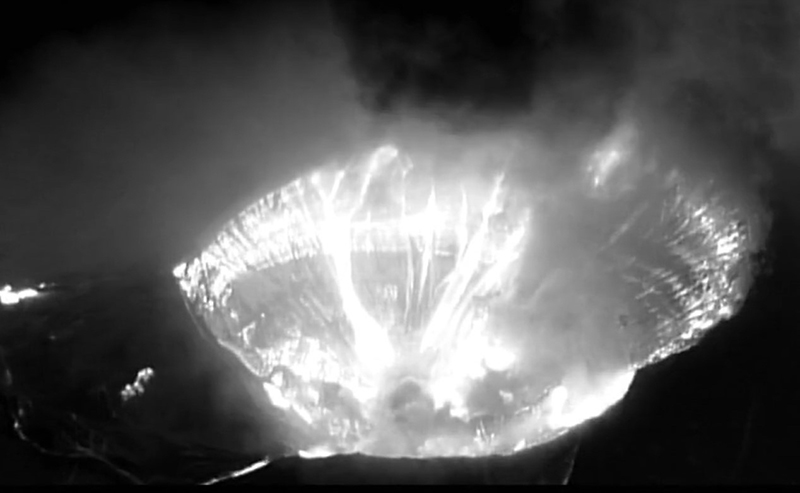
By early July 2020, satellite data indicated that the NE quadrant of the island was covered with ash, and a large amount of new lava had flowed down the SW flank, creating fans extending into the ocean (figure 99). The Tokyo VAAC reported ash emissions that rose to 3.7-4.9 km altitude and drifted N during 1-6 July. The altitude increased to 6.1 km during 8 and 9 July, and ranged from 4.6-6.1 km during 10-14 July while the drift direction changed to NE. The marine meteorological observation ship "Ryofu Maru" reported on 11 July that dense black ash was continuously erupting from the summit crater and drifting W at 1,700 m altitude or higher. They observed large volcanic blocks scattered around the base of the pyroclastic cone, and ash falling from the drifting plume. During the night of 11 July incandescent lava and volcanic lightning rose to about 200 m above the crater rim (figure 100).
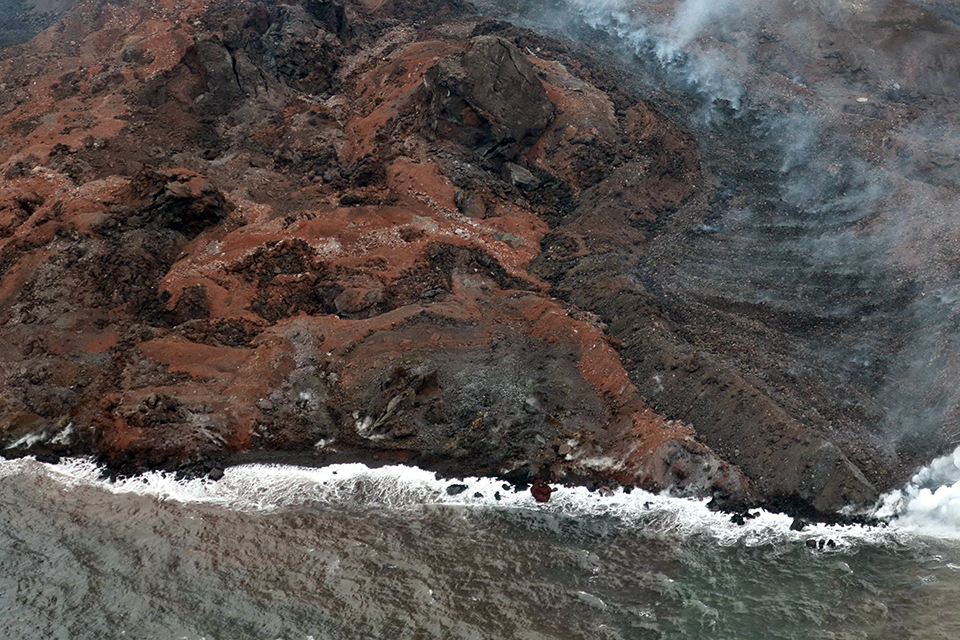
During 16-26 July 2020 the Tokyo VAAC reported ash emissions at 3.7-5.2 km altitude that drifted primarily N and NE. The vessel "Keifu Maru" passed Nishinoshima on 20 July and crewmembers observed continuing emissions from the summit of dense, black ash. JCG observed an ash plume rising to at least 2.7 km altitude during their overflight of 20 July. A large dome of fresh lava was visible on the SW flank of the island (figure 101). Lower ash emissions from 2.4-3.7 km altitude were reported by the Tokyo VAAC during 27-29 July, but the altitude increased to 5.5-5.8 km during the last two days of the month. During an overflight on 30 July by the National Research Institute for Earth Science and Disaster Prevention, dark and light gray ash emissions rose to 3.0 km altitude, but no flowing lava or large bombs were observed. They also noted thick deposits of brownish-gray ash on the N side of the island (figure 102).
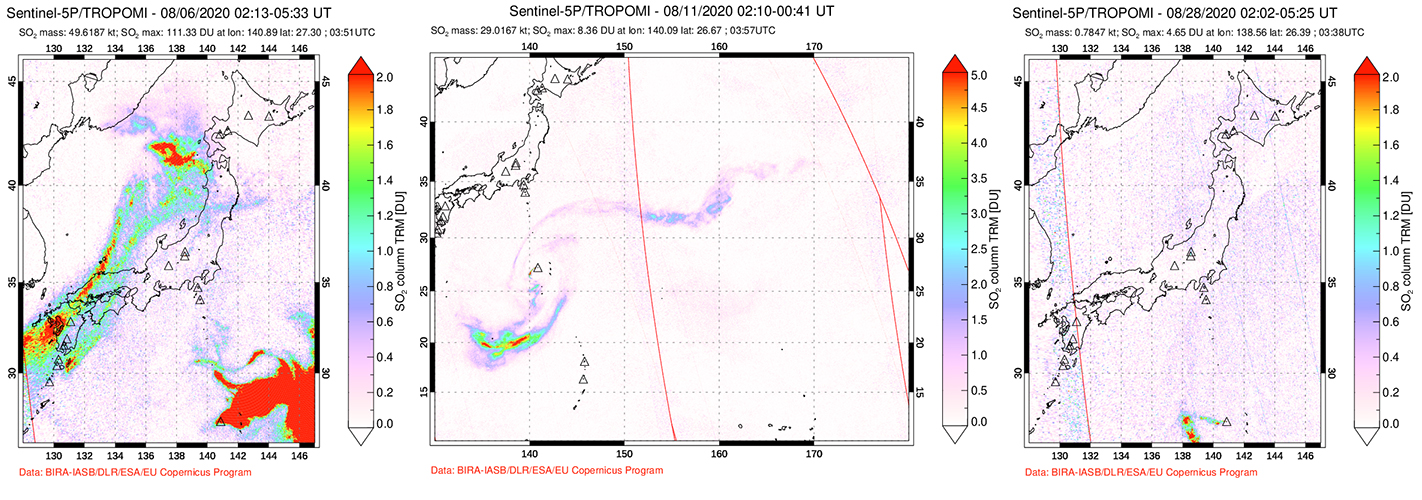
JMA reported a sharp decrease in the lava eruption rate during July with thermal anomalies decreasing significantly mid-month. Multiple daily MODVOLC thermal alerts were recorded during the first half of the month but were reduced to two or three per day during the last third of July. Throughout July, SO2 emissions were the highest recorded in modern times for Nishinoshima. High levels of emissions were measured daily, producing streams with high concentrations of SO2 that were caught up in rotating wind currents and drifted thousands of kilometers across the Pacific Ocean (figure 103).
Thermal activity was greatly reduced during August 2020. Only one or two MODVOLC alerts were issued on 11, 18, 20, 21, 29, and 30 August, and no fresh lava flows were observed. The Tokyo VAAC reported ash emissions daily from 1-20 August. Plume heights were 4.9-5.8 km altitude during 1-4 August after which they dropped to 3.9 km altitude through 15 August. A brief pulse to 4.6 km altitude was recorded on 16 August, but then they dropped to 3.0 km or lower through the end of the month and became intermittent. The last ash emission was reported at 2.7 km altitude drifting W on 27 August.
No eruptive activity was observed during the Japan Coast Guard overflights on 19 and 23 August. High temperatures were measured on the inner wall of the summit crater on 19 August (figure 104). Steam plumes rose from the summit crater to about 2.5 km altitude during both visits (figure 105). Yellow-green discolored water was present on 23 August around the NW and SW coasts. No lava flows were observed, and infrared cameras did not measure any surface thermal anomalies outside of the crater. Very high levels of SO2 emissions were measured through 12 August when they began to noticeably decrease (figure 106). By the end of the month, only small amounts of SO2 were measured in satellite data.
Geological Summary. The small island of Nishinoshima was enlarged when several new islands coalesced during an eruption in 1973-74. Multiple eruptions that began in 2013 completely covered the previous exposed surface and continued to enlarge the island. The island is the summit of a massive submarine volcano that has prominent peaks to the S, W, and NE. The summit of the southern cone rises to within 214 m of the ocean surface 9 km SSE.
Information Contacts: Japan Meteorological Agency (JMA), 1-3-4 Otemachi, Chiyoda-ku, Tokyo 100-8122, Japan (URL: http://www.jma.go.jp/jma/indexe.html); Japan Coast Guard (JCG), Hydrographic and Oceanographic Department, 3-1-1, Kasumigaseki, Chiyoda-ku, Tokyo 100-8932, Japan (URL: https://www1.kaiho.mlit.go.jp/GIJUTSUKOKUSAI/kaiikiDB/kaiyo18-e1.htm); MIROVA (Middle InfraRed Observation of Volcanic Activity), a collaborative project between the Universities of Turin and Florence (Italy) supported by the Centre for Volcanic Risk of the Italian Civil Protection Department (URL: http://www.mirovaweb.it/); Hawai'i Institute of Geophysics and Planetology (HIGP) - MODVOLC Thermal Alerts System, School of Ocean and Earth Science and Technology (SOEST), Univ. of Hawai'i, 2525 Correa Road, Honolulu, HI 96822, USA (URL: http://modis.higp.hawaii.edu/); Tokyo Volcanic Ash Advisory Center (VAAC), 1-3-4 Otemachi, Chiyoda-ku, Tokyo 100-8122, Japan (URL: http://ds.data.jma.go.jp/svd/vaac/data/); Japan Aerospace Exploration Agency-Earth Observation Research Center (JAXA-EORC), 7-44-1 Jindaiji Higashi-machi, Chofu-shi, Tokyo 182-8522, Japan (URL: http://www.eorc.jaxa.jp/); Sentinel Hub Playground (URL: https://www.sentinel-hub.com/explore/sentinel-playground); Global Sulfur Dioxide Monitoring Page, Atmospheric Chemistry and Dynamics Laboratory, NASA Goddard Space Flight Center (NASA/GSFC), 8800 Greenbelt Road, Goddard, Maryland, USA (URL: https://so2.gsfc.nasa.gov/).