Report on Langila (Papua New Guinea) — November 2020
Bulletin of the Global Volcanism Network, vol. 45, no. 11 (November 2020)
Managing Editor: Edward Venzke.
Edited by A. Elizabeth Crafford.
Langila (Papua New Guinea) Intermittent ash emissions and thermal anomalies through October 2020
Please cite this report as:
Global Volcanism Program, 2020. Report on Langila (Papua New Guinea) (Crafford, A.E., and Venzke, E., eds.). Bulletin of the Global Volcanism Network, 45:11. Smithsonian Institution. https://doi.org/10.5479/si.GVP.BGVN202011-252010
Langila
Papua New Guinea
5.525°S, 148.42°E; summit elev. 1330 m
All times are local (unless otherwise noted)
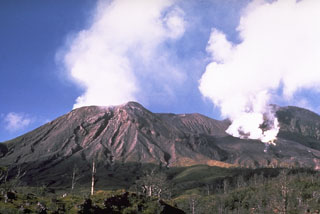
Frequent mild-to-moderate explosive eruptions with ash emissions and lava flows have been recorded since the 19th century from three active craters at the summit of Langila, which is a group of four small overlapping composite basaltic-andesitic cones at the western tip of Papua New Guinea’s New Britain Island (figure 10). The remoteness of its location makes ground-based observations rare from the Rabaul Volcano Observatory (RVO) staff or visitors, and thus most information comes from satellite sources and the Darwin Volcanic Ash Advisory Center (VAAC). Satellite thermal images and MODIS thermal data suggest possible eruptions not previously reported during 2011, 2012, and 2013. A substantial eruption likely began in late 2015 that included thermal anomalies, ash emissions, and extensive lava flows, lasting at least through 2018. Intermittent thermal anomalies and explosive activity since 2018 suggest continued activity through October 2020. This report reviews satellite visual and thermal information about activity during 2011-2018 and provides details of activity from November 2018-October 2020.
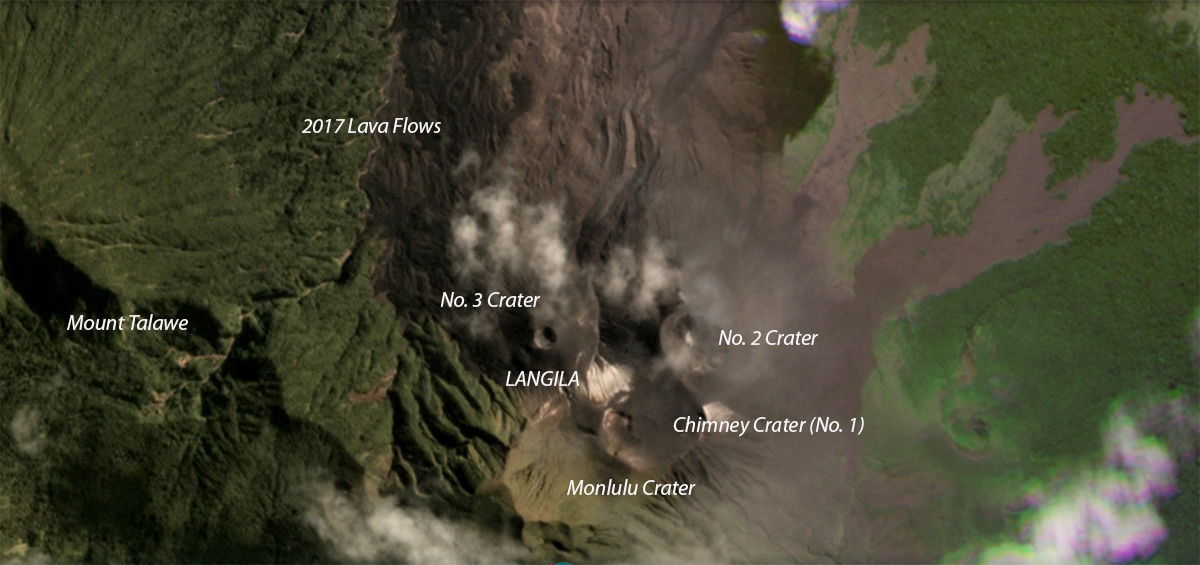 |
Figure 10. A monthly composite satellite image from June 2020 shows the summit craters of Langila. They closely resemble the sketch of the summit created in 1970 (SEAN 03:05), indicating little change in the summit morphology over the last 50 years. The summit of the adjacent Mount Talawe is about 450 m higher than the highest point of Langila at the crater rim around Chimney Crater. Chimney Crater (No. 1) is about 300 m across. Courtesy of Planet Labs, Inc. |
Summary of activity during 2011-2020. Primary data sources for Langila since 2011 have been MODIS thermal data in the form of MODVOLC thermal alerts and MIROVA graphs (since 2016), the Darwin Volcanic Ash Advisory Center, and satellite images from both LANDSAT-8 (August 2013-October 2015) and Sentinel-2 (since October 2015). Based on information from those sources (figure 11), volcanic activity may have occurred on 28 July 2011, 21 July 2012, and during 23 October-1 December 2013. A confirmed eruption from 1-5 December 2012 was previously reported (BGVN 41:01). Increased thermal activity late in 2015 was followed by multiple ash emissions during 2016 (BGVN 42:01); strong evidence of a significant eruption with extensive lava flows is preserved in satellite imagery and heat flow graphs throughout 2017 (BGVN 42:09, 43:06) and ash emissions were frequent during 2018 (BGVN 43:11). Although activity decreased significantly during 2019 and 2020, satellite-based evidence of low-level thermal activity continued. Ash emissions were reported again during August-October 2020.
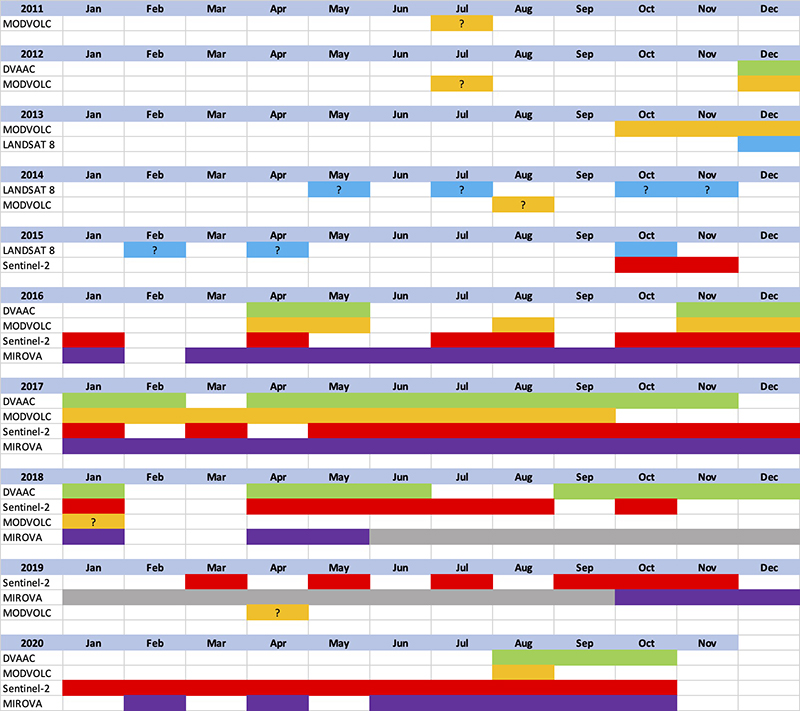 |
Figure 11. A summary table indicating observations of possible volcanic activity at Langila from multiple sources during January 2011-October 2020. Each month with data indicating possible volcanism is highlighted in a specific color for that source. MODVOLC (yellow) is the Hawai'i Institute of Geophysics and Planetology (HIGP) - MODVOLC Thermal Alerts System. DVAAC (green) is the Darwin Volcanic Ash Advisory Center. LANDSAT-8 (blue) is the USGS-run satellite launched in 2013 that houses two instruments, the Operational Land Imager (OLI) and the Thermal Infrared Sensor (TIRS). Sentinel-2 (red) is a satellite system launched by the European Space Agency (ESA) in 2015 that monitors variability in land surface conditions. MIROVA (purple) is a Near Real Time Volcanic HotSpot Detection System run by the Universities of Turin and Florence (Italy) based on the analysis of MODIS (Moderate Resolution Imaging Spectroradiometer) data. |
Possible eruptions during 2011-2013. Limited MODVOLC thermal alert and Landsat 8 data suggest possible eruptions not previously recorded for Langila on 28 July 2011, 21 July 2012, and during 23 October-1 December 2013. An eruption that produced ash emissions and MODVOLC thermal anomalies during December 2012 was previously reported (BGVN 41:01). The two MODVOLC thermal alerts from 28 July 2011 are located NE of the crater complex near the summit in a region with recent lava flow activity. The four MODVOLC alerts from 21 July 2012 are also located NE of the craters but are a few kilometers farther away and may be the result of fires. Seven MODVOLC alerts were recorded during 9-25 December 2012 following ash emissions reported earlier in the month. A group of twelve MODVOLC alerts that occurred between 23 October and 1 December 2013 are also located on the NE side of the crater complex in the same area as anomalies following the December 2012 eruption (figure 12). Thermal anomalies were present at the craters in 2 and 18 December 2013 Landsat thermal images, shortly after the 23 October-1 December MODVOLC alerts that suggested eruptive activity.
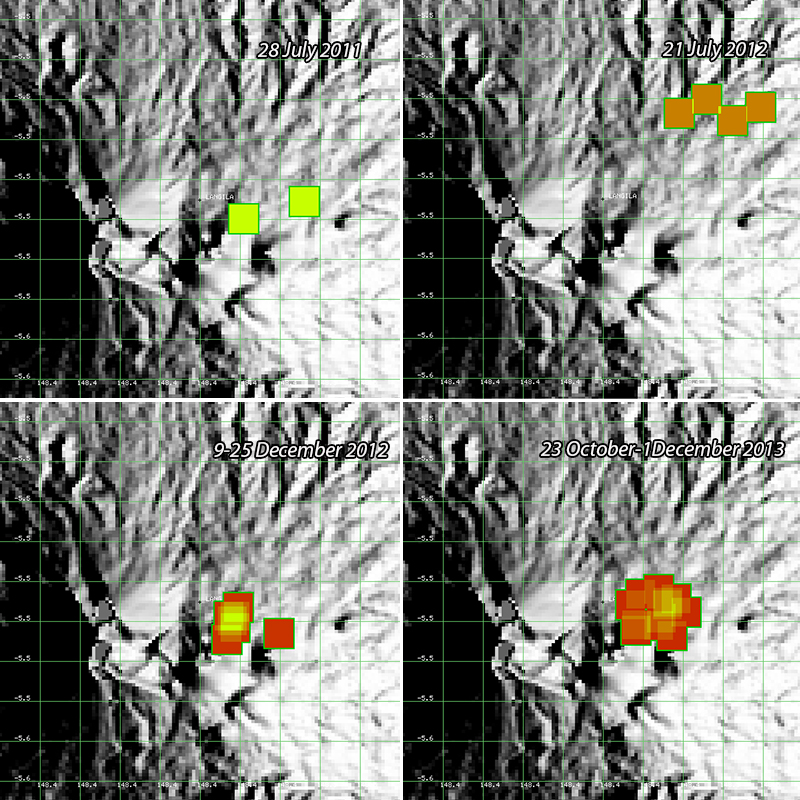 |
Figure 12. MODVOLC alerts show thermal anomalies and possible eruptive activity at Langila during 2011-2013. Top left: 28 July 2011. Top right: 21 July 2012 (possibly from a fire). Bottom left: 9-25 December 2012 after observed ash emissions during 1-5 December 2012. Bottom right: Twelve alerts were recorded between 23 October and 1 December 2013 in the same area as the alerts from December 2012. Courtesy of HIGP MODVOLC Thermal Alerts System. |
Observations during 2014-2015. Landsat 8 imagery from 2014 and 2015 show intermittent thermal anomalies from the summit area. A steam plume drifted N and a weak thermal anomaly was present at the summit craters on 11 May 2014. On 30 July, the anomaly at the crater was small but distinct, and a steam plume drifted NW from the crater. Thermal anomalies were present again at the summit craters on 18 October and 3 November, but no longer seen by 19 November 2014. Plumes of steam drifted NW from Crater 2 on 23 February and 28 April 2015, and weak thermal anomalies were present inside the crater on those days.
Eruption during late 2015-2018. Previous reports have discussed VAAC, MODVOLC, and MIROVA data with respect to activity during 2016-2018 (BGVN 42:01, 42:09, 43:06, and 43:11), but satellite imagery and photographs presented here provide additional details. Landsat images from 5 and 21 October 2015 show thermal anomalies at the craters. Both the Landsat 8 image on 21 October and the first Sentinel-2 image on 22 October show probable volcanic and non-volcanic activity. A thermal anomaly was detected inside the summit crater, and anomalies and smoke, likely from fires burning in the forest, were also present on the E flank. The summit thermal anomaly persisted in the 24 November 2015 Sentinel-2 image. Two distinct hotspots appeared inside Crater 2 in Sentinel 2 satellite imagery on 10 January 2016 along with a dense plume of steam that drifted NW, but there were no thermal anomalies apparent in the same view on 9 February 2016. A previously reported period of increased activity began in March 2016; ash emissions were reported for the first time since December 2012 in April 2016 (BGVN 42:01). Such emissions occurred again in May, November, and December. In addition to the 10 January 2016 thermal anomalies, anomalies and steam plumes at the summit appeared in satellite imagery on 22 April, 11 and 18 July, 27 August, 19 and 29 October, and 25 November 2016 (figure 13). An ash emission was seen in the 5 December Sentinel-2 image. A significant increase in thermal energy was recorded by the MIROVA project beginning in late December 2016 (BGVN 42:01).
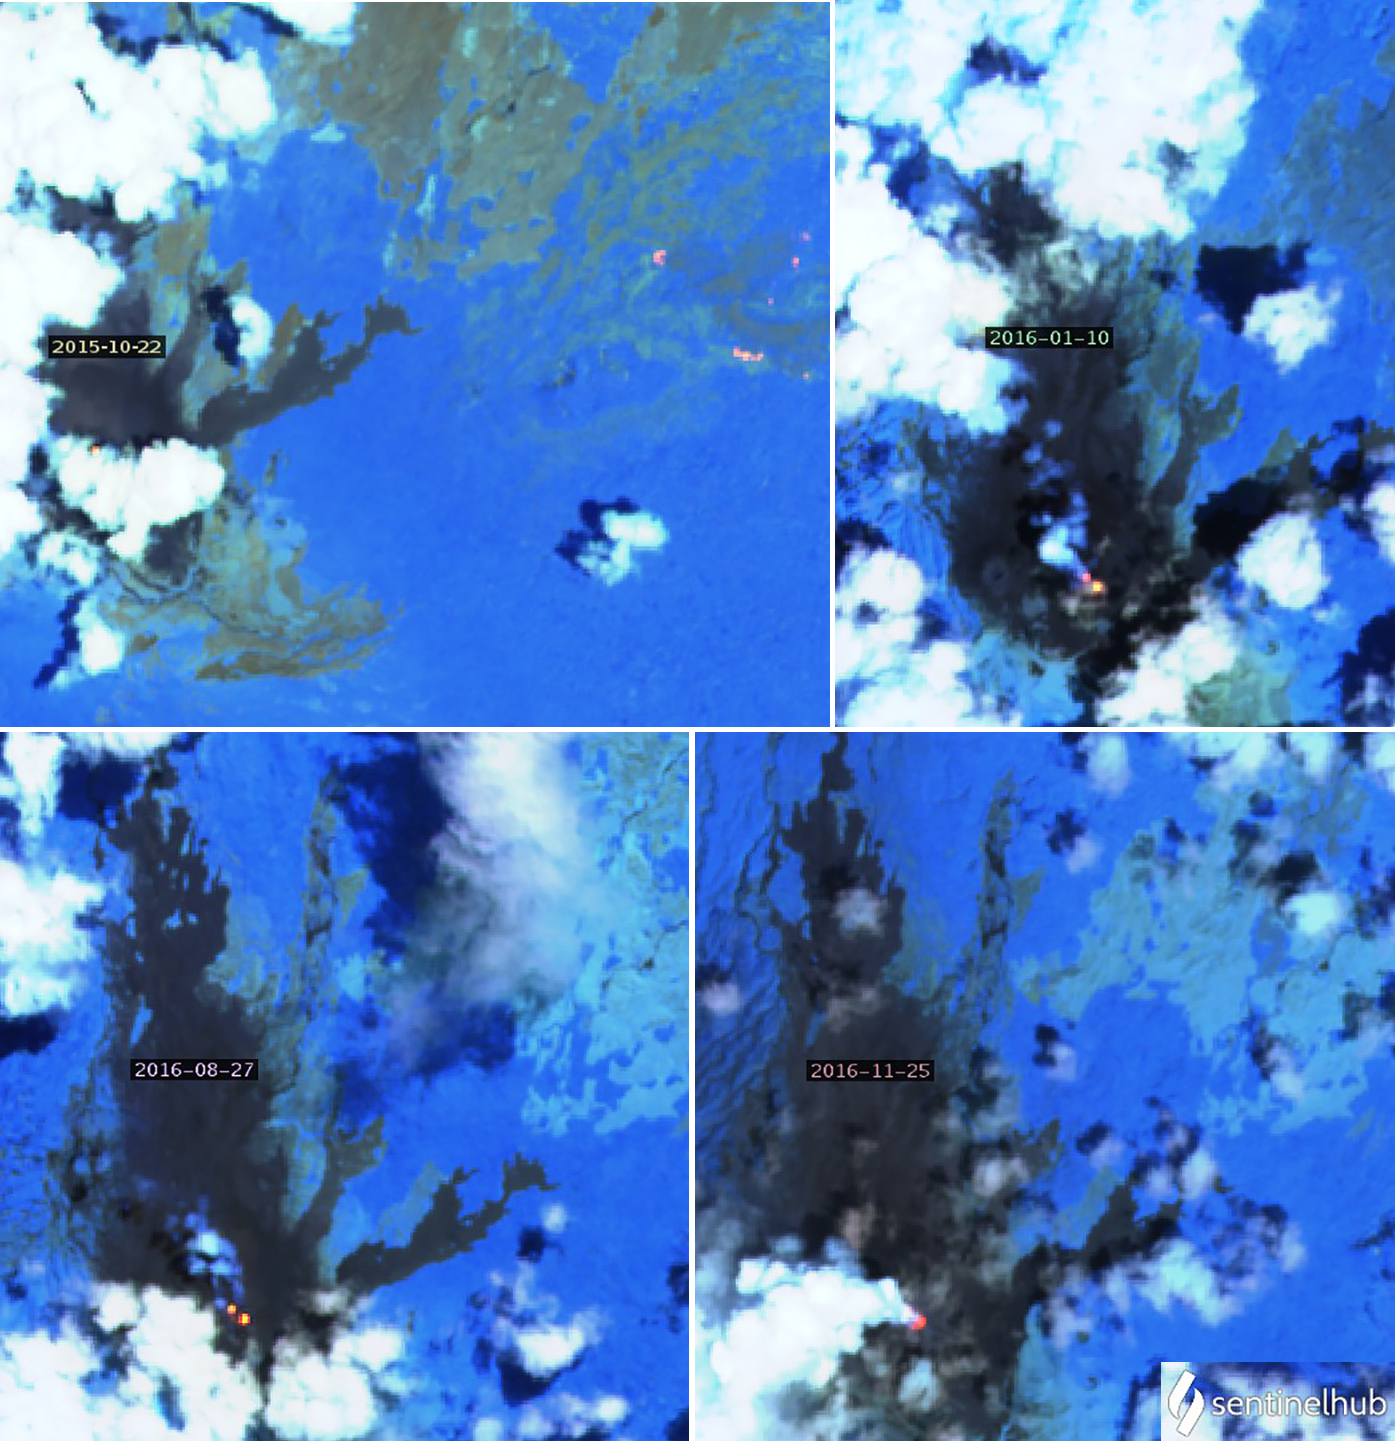 |
Figure 13. Multiple thermal anomalies during late 2015 and 2016 suggested eruptive activity. Top left: a single anomaly was present inside the summit crater of Langila in Sentinel-2 imagery on 22 October 2015; other anomalies on the E flank were likely due to fires. Top right and bottom left: Two hotspots were visible inside Crater 2 on 10 January and 27 August 2016. Bottom right: A single larger anomaly with a dense steam plume was present on 25 November 2016. Atmospheric penetration (bands 12, 11, 8a) rendering courtesy of Sentinel Hub Playground. |
Significant lava flow activity was recorded in satellite images during January-October 2017, along with MIROVA data indicating high levels of heat flow (BGVNN 43:06). In addition to two anomalies at the summit on 27 January 2017, a lava flow about 1 km long trended NW on the W flank at the edge of a larger flow field. By 8 March large incandescent areas were visible more than 2 km N of the original flow in addition to the hotspot at the active summit crater. On 14 May thermal imagery indicated a large anomaly and steam plume at the summit, a large anomaly on the W flank, and a lava flow trending N from the W flank. An anomaly also persisted over 2 km NW of the summit. By 16 June many anomalies were scattered over an area about 500 m wide and 2 km long on the W flank. More linear anomalies with scattered hotspots were present in 6 July and 22 August images on the W flank. Ash emissions were also visible in natural color images on 22 August (figure 14). Activity had declined by 21 October; although no hotspots were visible that day, clear skies showing the western edge of the flow field indicated the extent of new material when compared with an image from about one year earlier (figure 15). On 30 November and 20 December 2017, two hotspots were still visible at the summit.
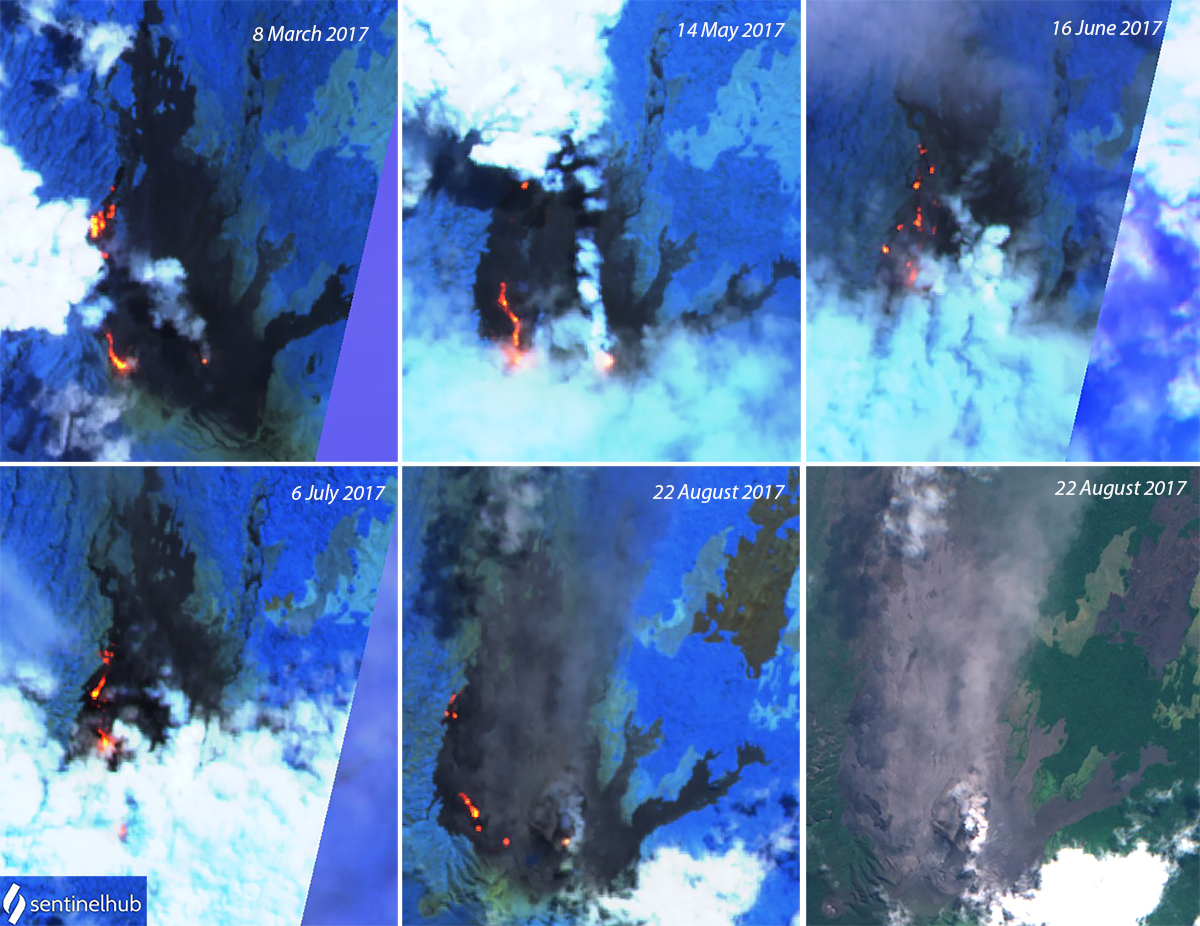 |
Figure 14. Lava flows appeared on the NW flank of Langila and persisted for most of 2017. By 8 March large hot areas were visible more than 2 km N of the original flow in addition to the hotspot at the active summit crater. On 14 May thermal imagery indicated a large anomaly and steam plume at the summit, a large anomaly on the NW flank and a lava flow trending N from the NW flank. An anomaly also persisted more than 2 km NW of the summit. By 16 June many anomalies were scattered over an area about 500 m wide and 2 km long on the NW flank. More linear anomalies with scattered hotspots were present in 6 July and 22 August images on the NW flank. Ash emissions were also visible in natural color images on 22 August. Atmospheric penetration (bands 12, 11, 8a) and Natural color rendering (bands 4, 3, 2) courtesy of Sentinel Hub Playground. |
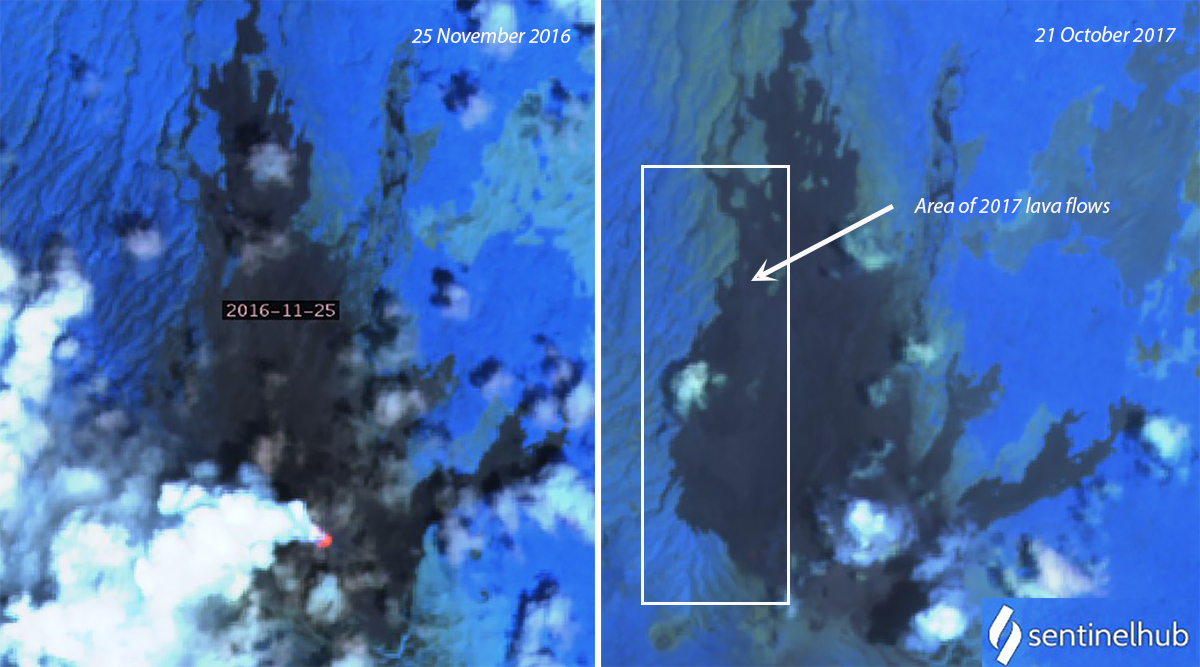 |
Figure 15. A clear image of Langila on 21 October 2017 (right) shows the extent of new lava that emerged from the summit crater area during the year when compared with a similar image from 25 November 2016 (left). The image is about 7 km from top to bottom. Atmospheric penetration (bands 12, 11, 8a) courtesy of Sentinel Hub Playground. |
Eruptive activity continued during 2018, but ash emissions were more frequent than during 2017 and fewer thermal anomalies were reported. The Darwin VAAC reported ash emissions in January, April-June, and September-December. A visitor to New Britain in late May 2018 captured images of ash plumes and experienced ashfall from a small boat offshore (figure 16). Satellite images showed ash plumes rising from the summit on 9 April, 9 May, 18 June, and 23 July (figure 17). Thermal anomalies at the summit could be seen during January, April-June, and August, along with a very weak one on 16 October 2018. Clear skies in November showed no thermal anomaly, but ash emissions were reported by the Darwin VAAC during both November and December. On 11 November a plume that rose to 3.1 km altitude drifted ESE and dissipated within a few hours. An ash plume on 20 December 2018 rose to 4.3 km altitude and drifted SSW for only about two hours before dissipating.
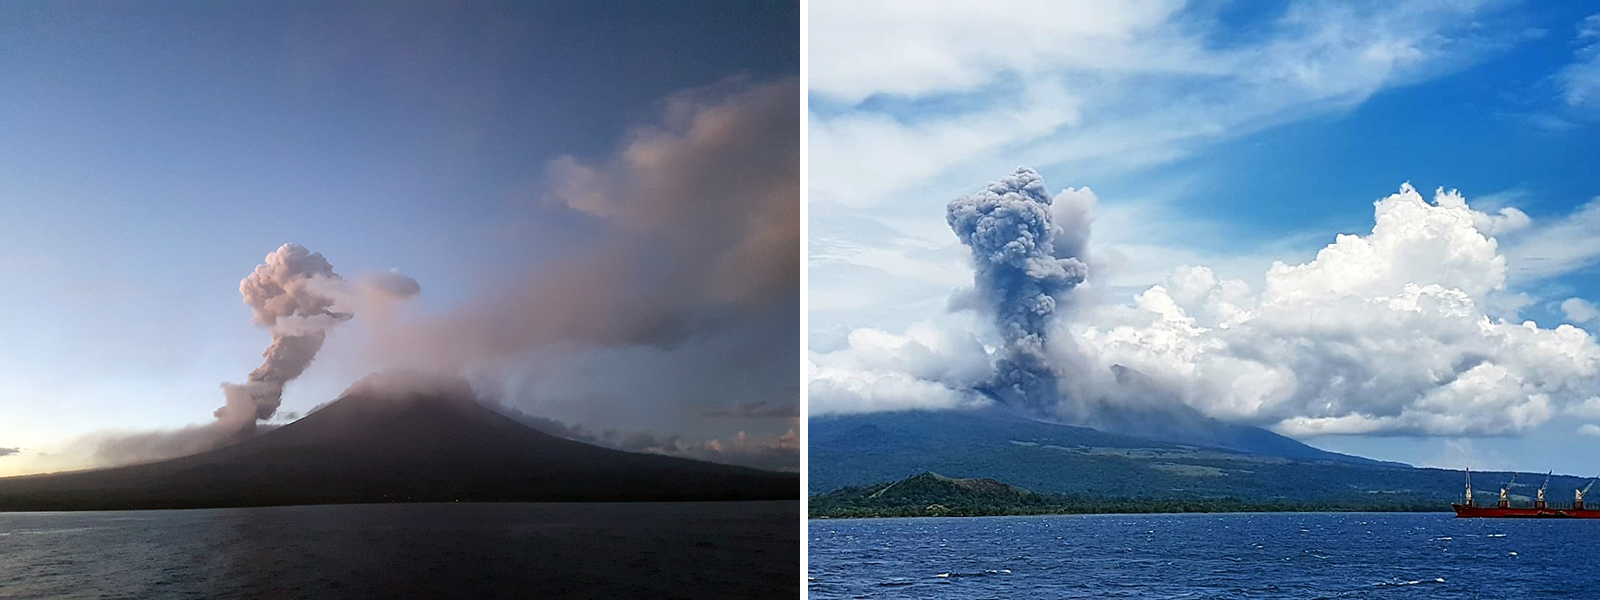 |
Figure 16. Ash plumes from Langila were witnessed by visitors offshore of New Britain in late May 2018. Left image was taken from the NW from a small boat. The right image was taken from Borgen Bay E of the volcano. Photographs courtesy of David Gorman, used with permission. |
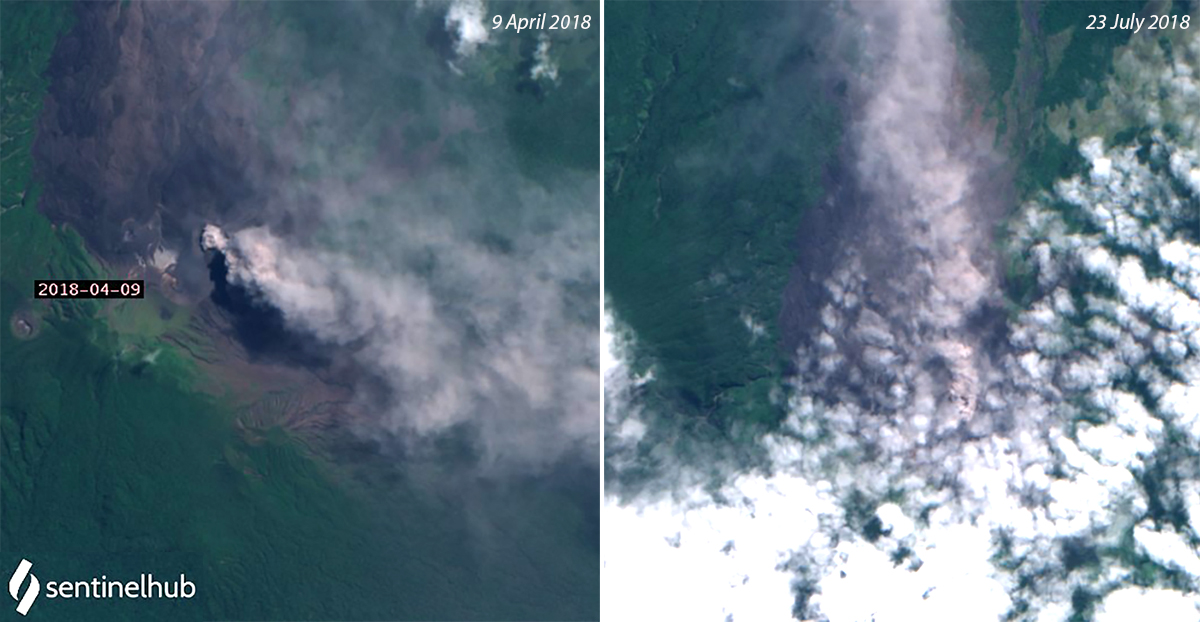 |
Figure 17. Sentinel-2 satellite imagery captured images of ash emissions each month during April-July 2018, including on 9 April (left) when the plume drifted SE and 23 July (right) when the plume drifted N. Natural color (bands 4, 3, 2) rendering courtesy of Sentinel Hub Playground. |
Activity during 2019 and 2020. Although no VAAC notices were issued for Langila between December 2018 and August 2020, thermal anomalies in satellite images suggested possible continued activity during the period. Two hotspots were visible inside one of the summit craters on 10 March and 19 May 2019. Two MODVOLC thermal alerts appeared NE of the summit on 12 April. On 3 July, 29 September, and 31 October thermal anomalies were again present inside the summit crater. (figure 18).
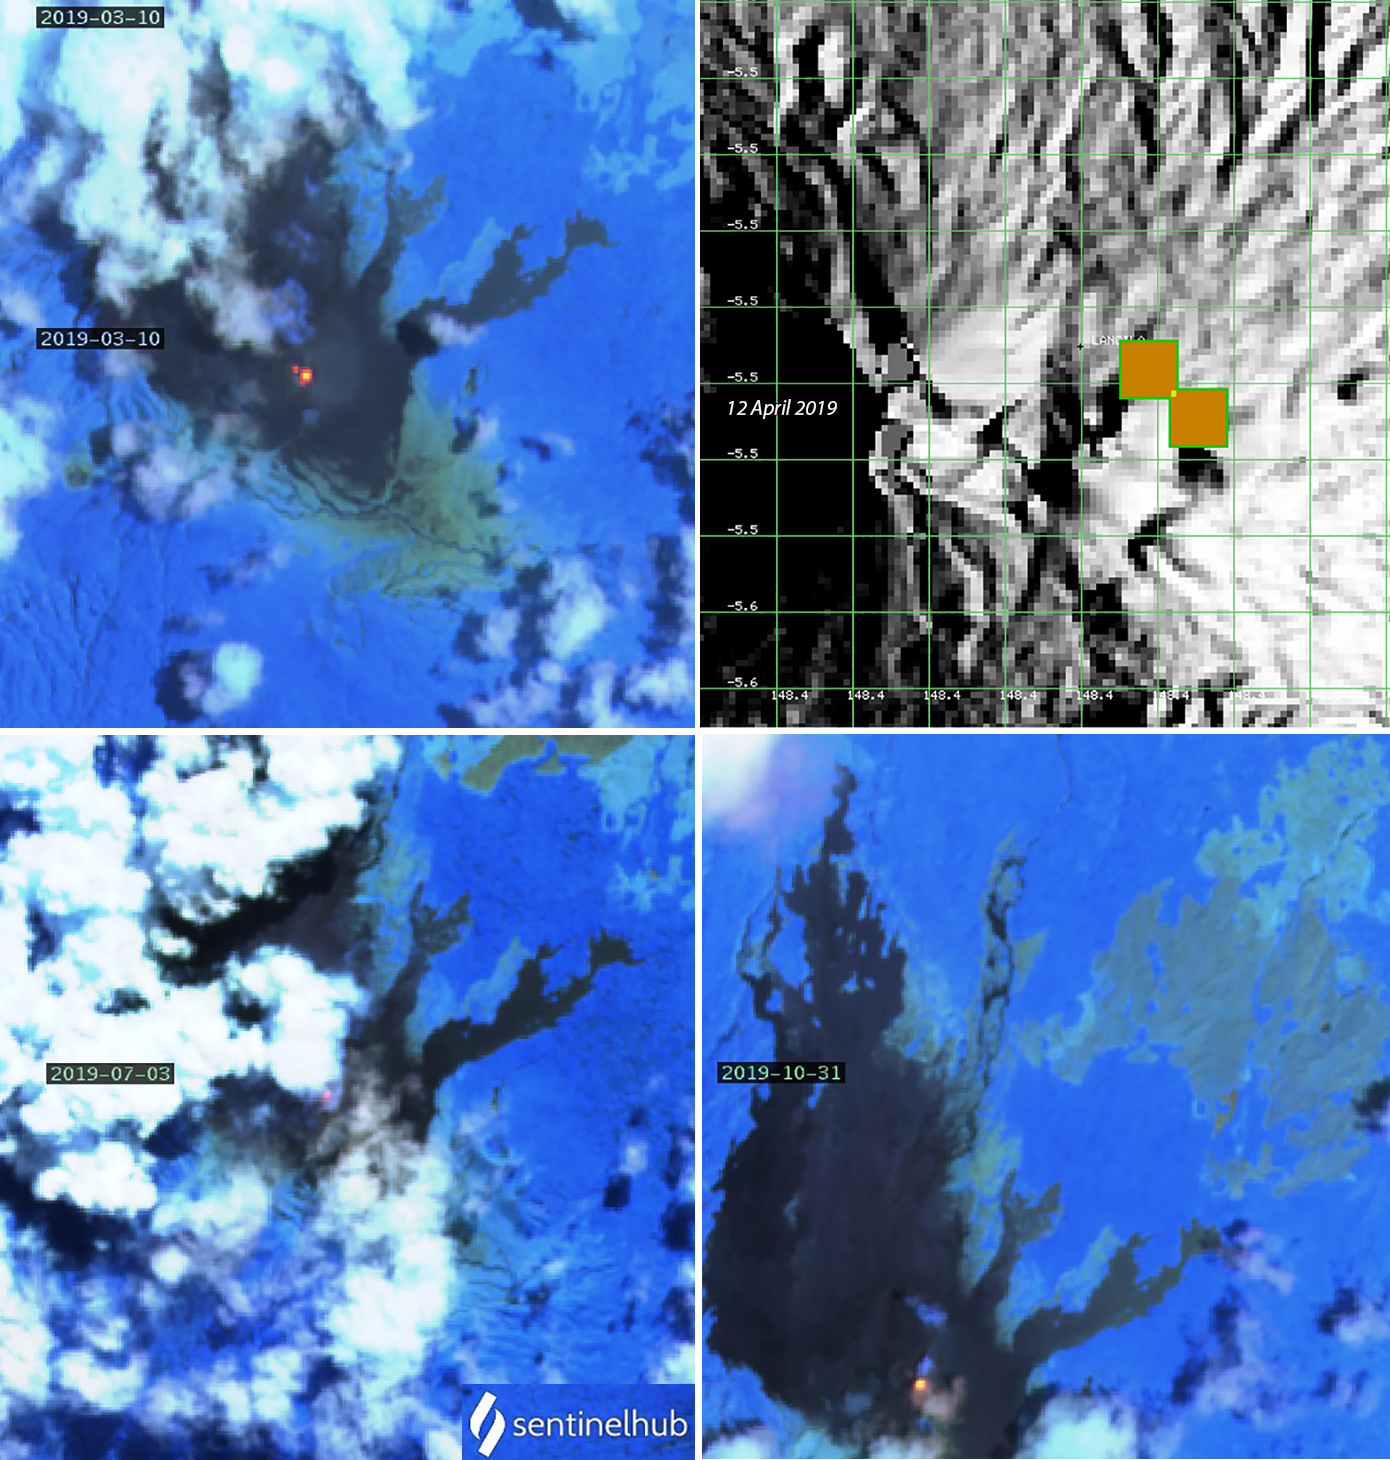 |
Figure 18. Summit thermal anomalies appeared multiple times during 2019 at Langila in Sentinel-2 satellite imagery. Top left: Two hotspots were visible inside one of the summit craters and a gas plume drifted N on 10 March. Top right: Two MODVOLC thermal alerts were recorded close to the active crater on 12 April. Bottom: On 3 July and 31 October 2019 hotspots were visible at the crater. Atmospheric penetration rendering (bands 12, 11, 8A) courtesy of Sentinel Hub Playground and MODVOLC. |
A small increase in thermal activity appeared in the MIROVA data during the second half of November 2019. On 30 November, in addition to an anomaly at the summit craters, an unusual thermal anomaly from an unknown source, possibly a fire, appeared about 1-2 km NE of the craters. It was elongate NE and about 200 m long. In the next image available on 5 December, a dark area appears immediately NE of where the anomaly had been (figure 19). By 25 December the freshly darkened area had faded to dark green.
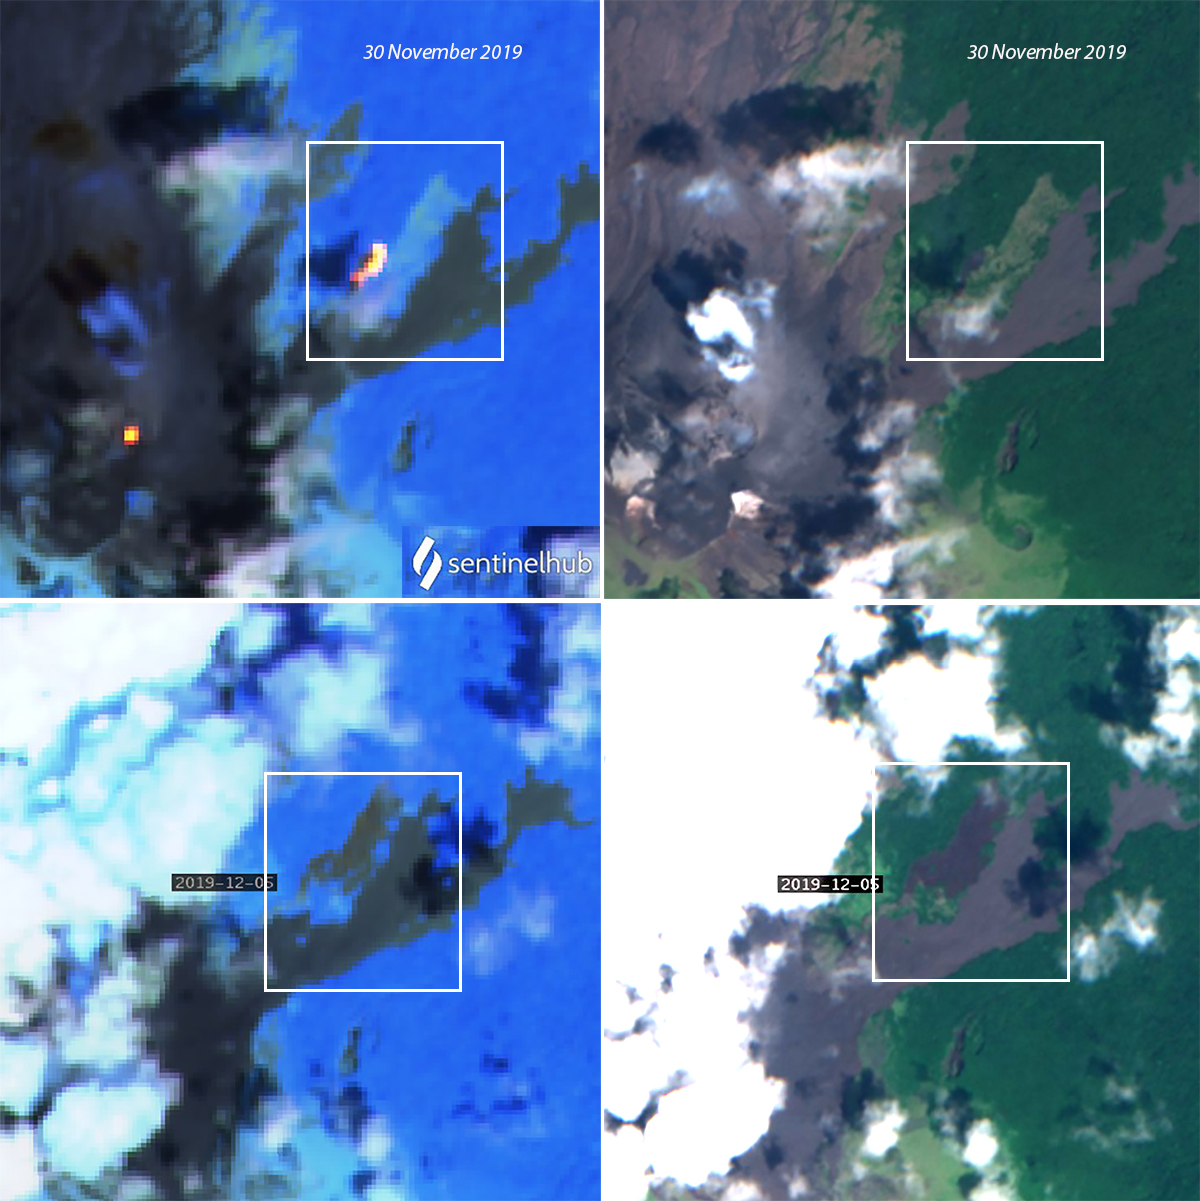 |
Figure 19. A thermal anomaly and dark patch appeared on the NE flank of Langila in late November and early December 2019. The source is unknown, possibly from a fire. Top row: In addition to the thermal anomaly at the summit on 30 November 2019, an unusual thermal anomaly appeared about 1-2 km NE of the craters (white square). It was elongate NE and about 200 m long (left). It appears adjacent to an open area that is brighter green than the surrounding landscape in the Natural color image where a small dark spot at the site of the anomaly is visible (right). Bottom row: On 5 December 2019 the bright anomaly is gone, but a dark patch appears in both images where the bright green landscape was on 30 November. Natural color (bands 4, 3, 2) and Atmospheric penetration rendering (bands 12, 11, 8a) courtesy of Sentinel Hub Playground. |
Either one or two thermal anomaly spots were present at the summit crater of Langila at least once each month during January-October 2020, and an ash plume drifted NNW from the summit on 20 July 2020 (figure 20). Beginning in late June, MIROVA recorded multiple low-level thermal anomalies which continued through October (figure 21). Four MODVOLC thermal alerts were issued on 2 August. That same day, the Darwin VAAC issued the first ash advisory of 2020 reporting an ash emission that rose to 2.4 km altitude and drifted NW. It was discernable in both the visible and RGB satellite imagery for about 12 hours before dissipating. An ash emission on 22 August rose to 1.8 km altitude and drifted NW. On 22 September, a plume rose to 2.7 km altitude and drifted NW. An ash plume on 5 October rose to 1.8 km altitude and drifted NW briefly before dissipating. Another plume the next day rose to 3.0 km altitude and drifted WSW for about four hours before disappearing from satellite imagery. On 22 October an ash plume was reported drifting S at 2.1 km altitude. It was only discernable in satellite imagery for about 30 minutes before dissipating. Two plumes were reported on 24 October that rose to 1.8-2.1 km altitude and briefly drifted N and NW.
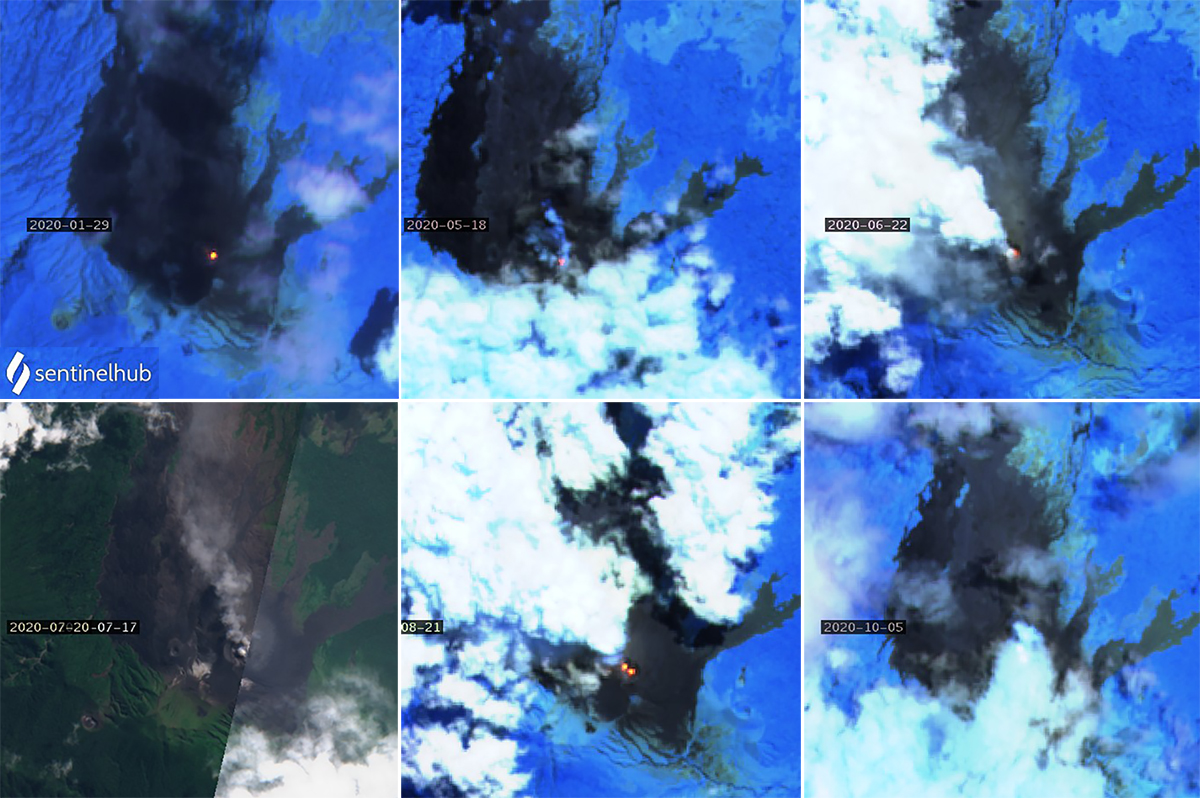 |
Figure 20. Steam plumes and thermal anomalies were visible at the summit of Langila in satellite imagery at least once each month from January through October 2020, and ash emissions were seen in July. Top row: Single anomalies at the summit crater were recorded on 29 January, 18 May, and 22 June 2020. Bottom row: An ash plume was visible in Natural color imagery drifting NNW on 20 July, two anomalies at the summit crater were distinct on 21 August, and anomalies were visible through clouds and steam on 5 October 2020. Natural color (bands 4, 3, 2) and Atmospheric penetration rendering (bands 12, 11, 8a) courtesy of Sentinel Hub Playground. |
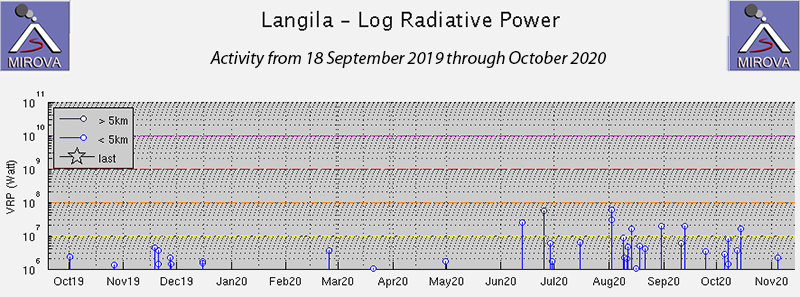 |
Figure 21. A small increase in thermal activity at Langila was recorded by the MIROVA project during the second half of November 2019 at the same time that thermal anomalies were detected in Sentinel-2 satellite data. Multiple low to moderate power thermal anomalies were also recorded between June and November 2020. Graph shows Log Radiative Power from 18 September 2019 through October 2020. Courtesy of MIROVA. |
Geological Summary. Langila, one of the most active volcanoes of New Britain, consists of a group of four small overlapping composite basaltic-andesitic cones on the lower E flank of the extinct Talawe volcano in the Cape Gloucester area of NW New Britain. A rectangular, 2.5-km-long crater is breached widely to the SE; Langila was constructed NE of the breached crater of Talawe. An extensive lava field reaches the coast on the N and NE sides of Langila. Frequent mild-to-moderate explosive eruptions, sometimes accompanied by lava flows, have been recorded since the 19th century from three active craters at the summit. The youngest and smallest crater (no. 3 crater) was formed in 1960 and has a diameter of 150 m.
Information Contacts: Darwin Volcanic Ash Advisory Centre (VAAC), Bureau of Meteorology, Northern Territory Regional Office, PO Box 40050, Casuarina, NT 0811, Australia (URL: http://www.bom.gov.au/info/vaac/); Hawai'i Institute of Geophysics and Planetology (HIGP) - MODVOLC Thermal Alerts System, School of Ocean and Earth Science and Technology (SOEST), Univ. of Hawai'i, 2525 Correa Road, Honolulu, HI 96822, USA (URL: http://modis.higp.hawaii.edu/); MIROVA (Middle InfraRed Observation of Volcanic Activity), a collaborative project between the Universities of Turin and Florence (Italy) supported by the Centre for Volcanic Risk of the Italian Civil Protection Department (URL: http://www.mirovaweb.it/); Sentinel Hub Playground (URL: https://www.sentinel-hub.com/explore/sentinel-playground); Planet Labs, Inc. (URL: https://www.planet.com/); David Gorman, (URL: https://www.instagram.com/jimmyceb/, posted at https://twitter.com/SherineFrance/status/1002157440597741568).