Report on Telica (Nicaragua) — November 2020
Bulletin of the Global Volcanism Network, vol. 45, no. 11 (November 2020)
Managing Editor: Edward Venzke.
Edited by Kadie L. Bennis.
Telica (Nicaragua) Thermal anomalies persist with explosions in August 2018, July 2020, and September-October 2020
Please cite this report as:
Global Volcanism Program, 2020. Report on Telica (Nicaragua) (Bennis, K.L., and Venzke, E., eds.). Bulletin of the Global Volcanism Network, 45:11. Smithsonian Institution. https://doi.org/10.5479/si.GVP.BGVN202011-344040
Telica
Nicaragua
12.606°N, 86.84°W; summit elev. 1036 m
All times are local (unless otherwise noted)
Telica, located in Nicaragua, is a volcano complex that consists of several cones and craters and includes a 700-m-wide double crater; the southern crater, measuring 120 m deep, is the source of recent eruptions. The latest eruptions, during June-August 2018 and July-October 2020, have been characterized by seismicity, fumaroles, persistent thermal anomalies, and occasional explosions and ash plumes. The primary source of information comes from the Instituto Nicaragüense de Estudios Territoriales (INETER), the Sistema Nacional para la Prevencion, Mitigacion y Atencion de Desastres (SINAPRED), and various satellite data.
Summary of activity during July 2018-October 2020. Activity during this reporting period was relatively low, consisting of frequent earthquakes, SO2 emissions, and fumarolic activity; explosions and resulting ash plumes were reported during August 2018, July 2020, and late September-October 2020. During October 2018 through early March 2019 the Sentinel-2 MODIS Thermal Volcanic Activity graph provided by the MIROVA system identified a strong cluster of frequent thermal anomalies in the summit area, followed by a period of quiescence from mid-March 2018 through mid-March 2020 (figure 46). By then, a single thermal hotspot was detected, followed by intermittent thermal anomalies from July to early September 2020. Sentinel-2 thermal satellite imagery showed a persistent thermal anomaly in the summit crater during the reporting period, with a possible new lava flow that migrated from the E side of the summit crater to the W on 30 December 2018 (figure 47). The thermal anomaly was visible on clear days, dominantly on the E side of the summit crater.
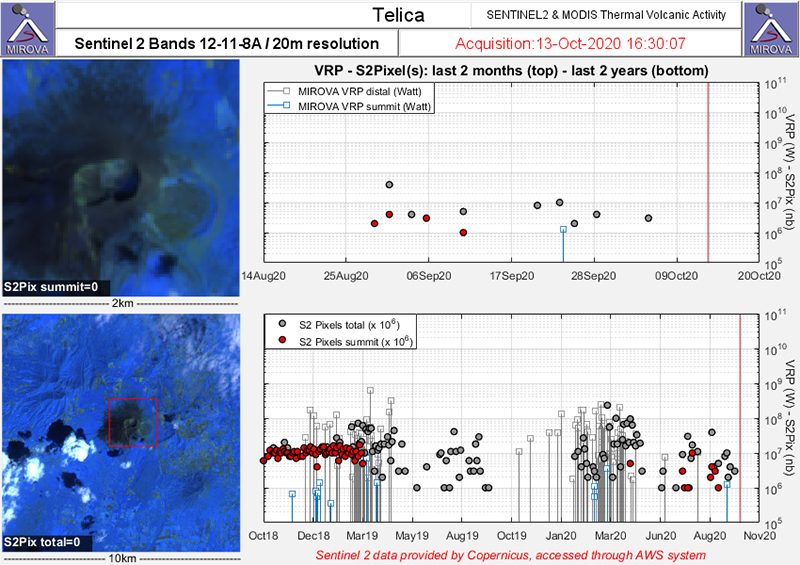 |
Figure 46. A cluster of thermal anomalies were detected in the summit area of Telica (red dots) during October 2018 through early March 2019. Thermal activity began again in mid-March 2020 and continued intermittently through early September 2020 as recorded by the Sentinel-2 MODIS Thermal Volcanic Activity data (bands 12, 11, 8A). Courtesy of MIROVA. |
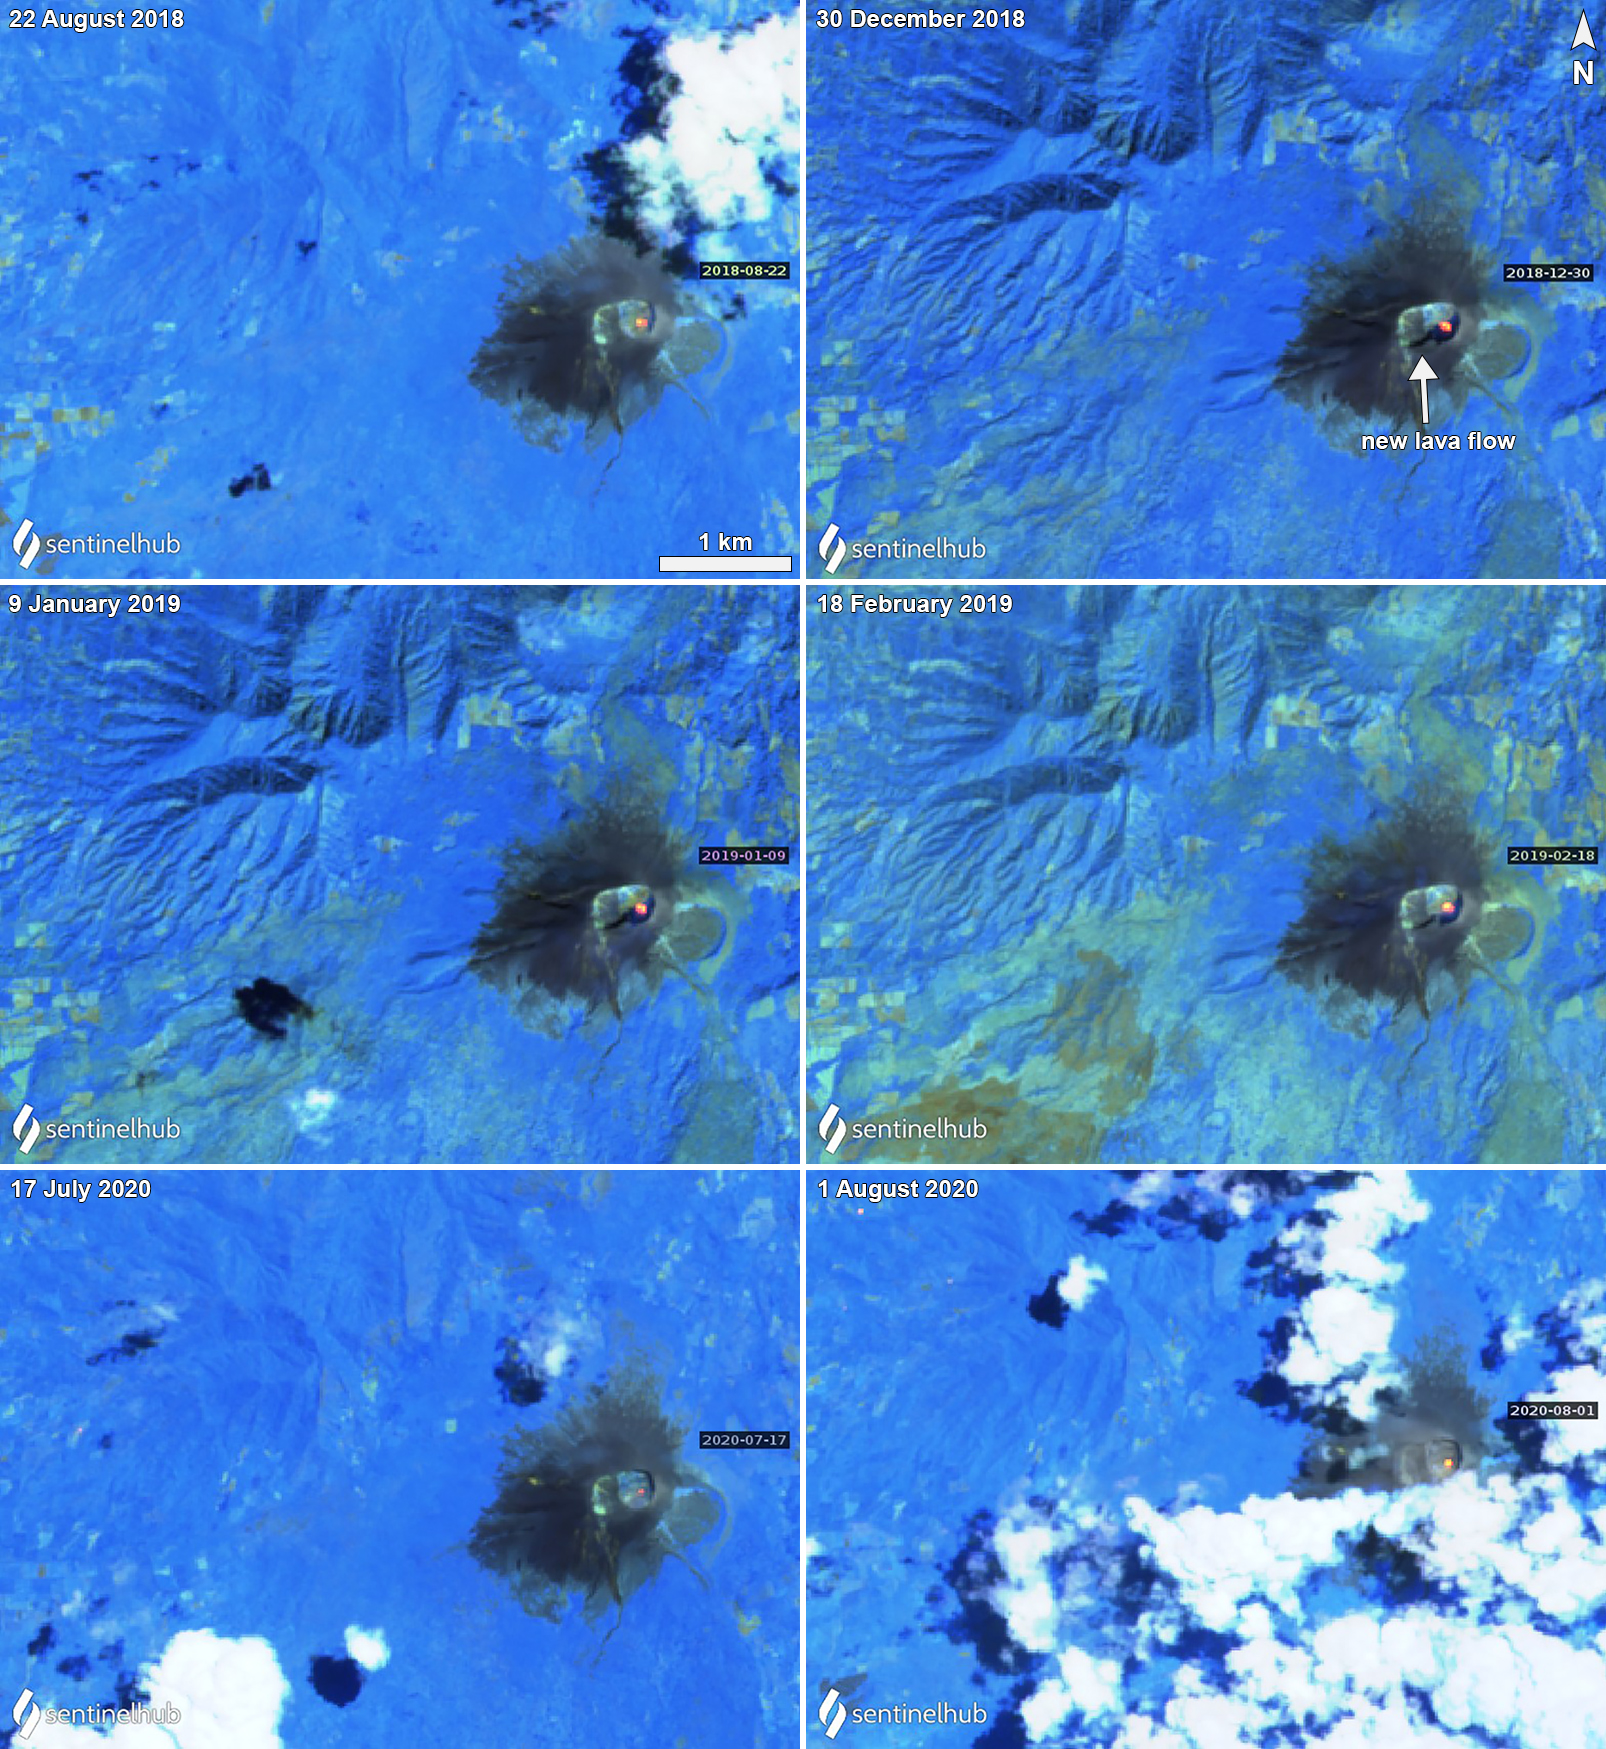 |
Figure 47. Sentinel-2 thermal satellite imagery showed a persistent thermal anomaly (bright yellow-orange) at Telica in the summit crater during the reporting period. The thermal anomaly typically occurs on the E side of the crater. A new lava flow that appears black, extends W from the thermal anomaly on 30 December 2018 (top right) within the summit crater, which continues into February 2019. Images with “Atmospheric penetration” (bands 12, 11, 8A) rendering; courtesy of Sentinel Hub Playground. |
Activity during July-December 2018. Activity as reported by INETER was relatively low during 2018 with the exception of August, which was characterized by explosions and ash plumes. Seismicity, which included a low number of volcanic earthquakes, was reported throughout the year. On 15 August an explosion generated an ash plume that rose 200 m above the crater (figure 48). Sulfur dioxide emissions were measured during August and September, with a daily average in the 293-451 tons range. During September, INETER scientists observed fumaroles on the S wall of the crater.
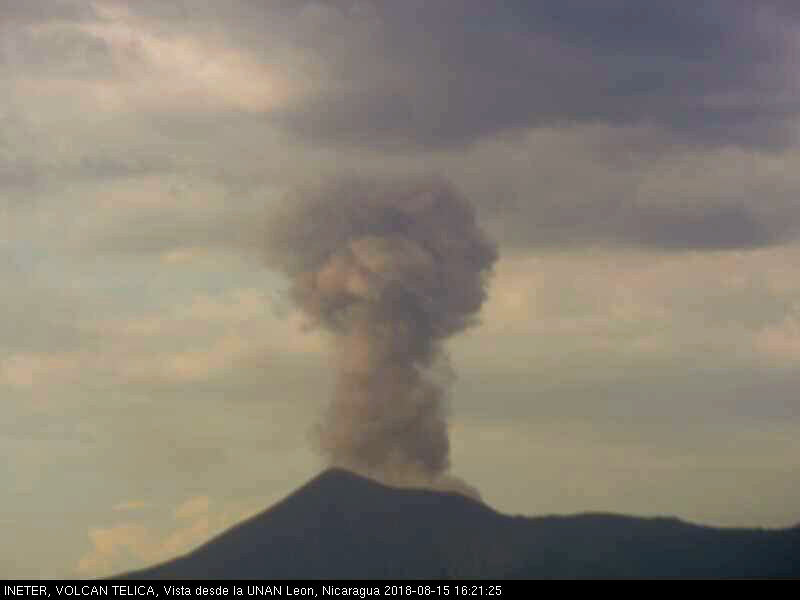 |
Figure 48. Webcam image (color corrected) of an ash plume rising 200 m above Telica on 15 August 2018. Courtesy of SINAPRED. |
Activity during 2019. Similar low activity was reported in 2019, primarily consisting of volcanic earthquakes, fumaroles, and sulfur dioxide emissions. During the year, just over 1 million seismic events were recorded, which included hybrid-type and volcano-tectonic events. SO2 emissions were measured using the Mobile-DOAS technique in February-April and June-November, with averages of 153-380 tons/day. On 14 May fumaroles were visible in the crater on the W wall. INETER scientists noted internal collapses were observed in the SE and S walls. A fracture about 25 m long and 2 m wide on the N edge of the crater exhibited gas-and-steam emissions. On 19 November field work was carried out by INETER scientists to measure the temperature of the fumaroles; the maximum temperature was 170°C, which was less than the temperature recorded in May (346°C).
Activity during January-October 2020. During January-October 2020, activity remained similar to the previous years, consisting of fumarolic activity and seismicity; activity increased beginning in late July through October. Seismicity continued to be reported each month, totaling about 816,000 events, which included hybrid and volcano-tectonic events. Fieldwork by INETER on 11 February showed that the main crater had been obstructed by landslides on the S and W walls due to continued fumarolic activity. The temperature of these gas-and-steam emissions was 101°C, which was lower compared to their previous measurements in November 2019. SO2 emissions measured during February-October had daily averages of 129-370 tons. On 11 March field scientists noted that the main crater continued to be obstructed by landslides on the S and SW walls and that gas-and-steam emissions rose from the E, S, and W crater wall, creating greater collapses and fractures in the surrounding rock. During April-July and September-October, similar observations were made.
Beginning on 7 July 2020 eruptive activity increased, according to INETER; five seismic stations recorded explosions and volcanic tremors, which generated gas-and-ash emissions in the main crater that rose 500-600 m above the crater. On 20 July at 1659 small explosions were detected that produced gas-and-ash plumes that rose 200 m above the crater rim (figure 49). At the time of the explosions, RSAM values increased from 57 to 153 and remained at 144 units after the events. On 29 July seven to ten gas-and-ash explosions generated plumes that rose 30-60 m above the crater rim and drifted N. According to a Washington VAAC advisory, an ash plume rose to 1.5 km altitude and drifted W. Sporadic explosions and gas-and-ash emissions, accompanied by fumarolic plumes, continued during August through October, according to INETER.
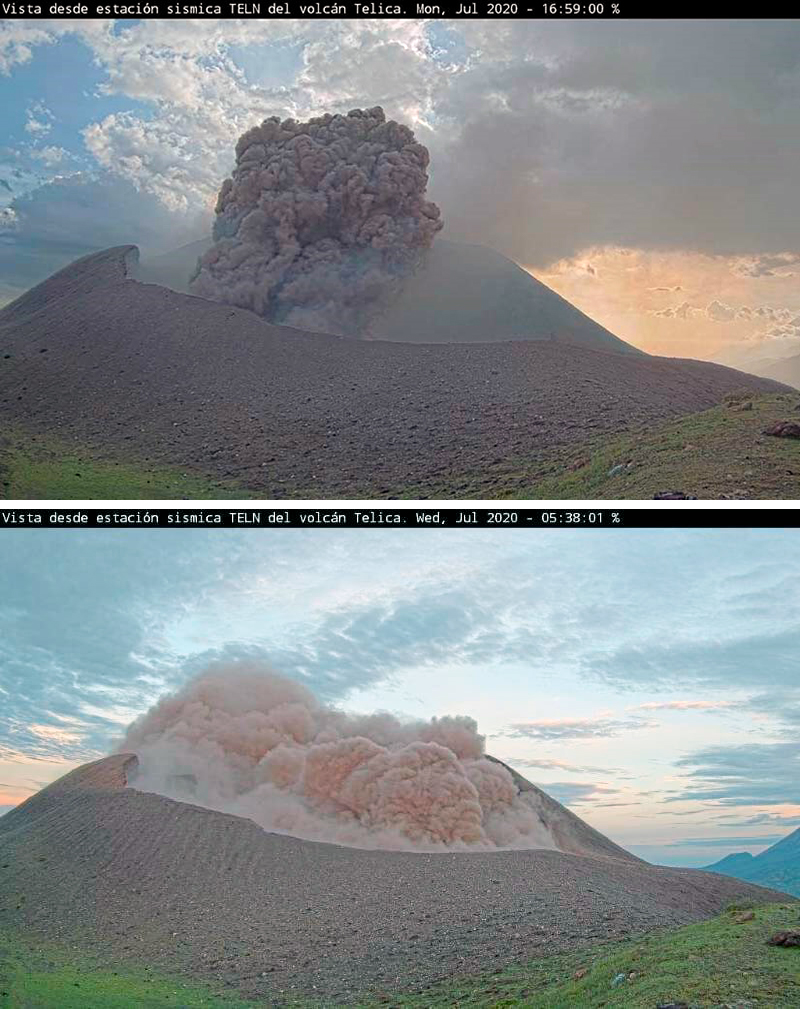 |
Figure 49. Webcam images of an ash explosion at Telica rising 200 m above the crater on 20 July (top) and 30-60 m above the crater and drifting N on 29 July 2020 (bottom). Courtesy of SINAPRED. |
Explosions on 27 September resulted in a collapse in the crater wall, with more defined fractures on the S and W walls. On 29 September gray ash emissions were observed rising to a low height above the crater rim (figure 50). A seismic swarm on 4 October was registered by a seismic station N of the volcano. During 6-7 October five explosions were recorded, according to INETER, the largest of which occurred on 7 October at 0742 and generated an ash plume that rose 600 m above the crater and drifted SW (figure 51). This event resulted in ashfall around the crater. Another explosion on 8 October produced a gas-and-ash plume that rose 500 m above the crater and drifted E and SE, depositing some ash near the crater. New fumarolic emissions were observed rising above the N crater wall. On 29 October a series of three explosions began at 1910 and ended at 2137. These explosions ejected rock fragments onto the flanks of the volcano, producing gas-and-ash plumes that rose as high as 1 km above the crater and drifted W. Resulting ashfall was reported in communities of El Bosque, Jacinto Baca (15 km WSW), Filiberto Morales (15 km WSW), Carlos Huete, Linda Vista, Divino Niño (31 km W). During 30-31 October three explosions were detected, producing gas-and-ash plumes that rose 250-600 m above the crater, which caused a minor amount of ashfall on the flanks.
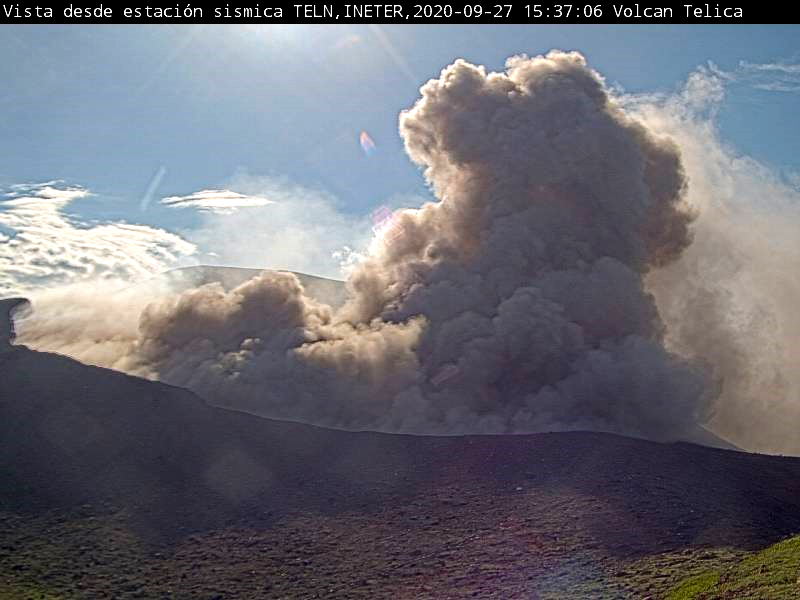 |
Figure 50. Webcam image showing gray ash plumes rising above Telica on 29 September 2020. Courtesy of INETER. |
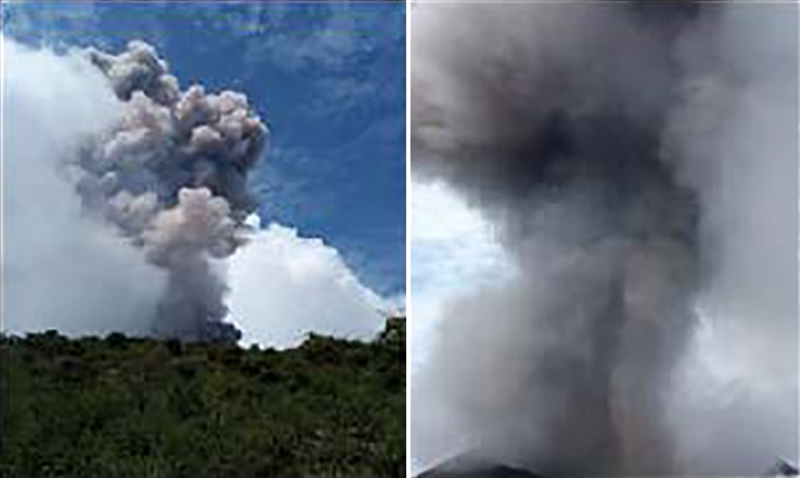 |
Figure 51. Photos of the explosion and resulting ash plume at Telica on 6 October (left) and 7 October 2020 (right). Photos by Chavarría D.; courtesy of INETER. |
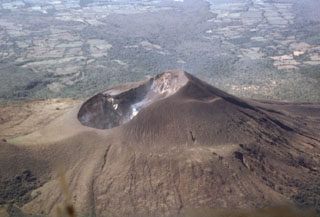
Geological Summary. Telica, one of Nicaragua's most active volcanoes, has erupted frequently since the beginning of the Spanish era. This volcano group consists of several interlocking cones and vents with a general NW alignment. Sixteenth-century eruptions were reported at symmetrical Santa Clara volcano at the SW end of the group. However, its eroded and breached crater has been covered by forests throughout historical time, and these eruptions may have originated from Telica, whose upper slopes in contrast are unvegetated. The steep-sided cone of Telica is truncated by a 700-m-wide double crater; the southern crater, the source of recent eruptions, is 120 m deep. El Liston, immediately E, has several nested craters. The fumaroles and boiling mudpots of Hervideros de San Jacinto, SE of Telica, form a prominent geothermal area frequented by tourists, and geothermal exploration has occurred nearby.
Information Contacts: Instituto Nicaragüense de Estudios Territoriales (INETER), Apartado Postal 2110, Managua, Nicaragua (URL: http://www.ineter.gob.ni/); Sistema Nacional para la Prevencion, Mitigacion y Atencion de Desastres (SINAPRED), Edificio SINAPRED, Rotonda Comandante Hugo Chávez 50 metros al Norte, frente a la Avenida Bolívar, Managua, Nicaragua (URL: http://www.sinapred.gob.ni/); Washington Volcanic Ash Advisory Center (VAAC), Satellite Analysis Branch (SAB), NOAA/NESDIS OSPO, NOAA Science Center Room 401, 5200 Auth Rd, Camp Springs, MD 20746, USA (URL: www.ospo.noaa.gov/Products/atmosphere/vaac, archive at: http://www.ssd.noaa.gov/VAAC/archive.html); MIROVA (Middle InfraRed Observation of Volcanic Activity), a collaborative project between the Universities of Turin and Florence (Italy) supported by the Centre for Volcanic Risk of the Italian Civil Protection Department (URL: http://www.mirovaweb.it/); Sentinel Hub Playground (URL: https://www.sentinel-hub.com/explore/sentinel-playground).