Report on Copahue (Chile-Argentina) — December 2020
Bulletin of the Global Volcanism Network, vol. 45, no. 12 (December 2020)
Managing Editor: Edward Venzke.
Edited by Kadie L. Bennis.
Copahue (Chile-Argentina) New eruption in June-October 2020 with crater incandescence, ash plumes, and local ashfall
Please cite this report as:
Global Volcanism Program, 2020. Report on Copahue (Chile-Argentina) (Bennis, K.L., and Venzke, E., eds.). Bulletin of the Global Volcanism Network, 45:12. Smithsonian Institution. https://doi.org/10.5479/si.GVP.BGVN202012-357090
Copahue
Chile-Argentina
37.856°S, 71.183°W; summit elev. 2953 m
All times are local (unless otherwise noted)
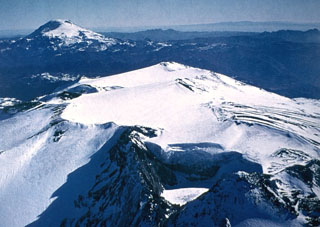
Copahue is an elongated composite cone located along the Chile-Argentina border. The E summit crater consists of an acidic 300-m-wide crater lake which is characterized by intense fumarolic activity. Previous activity consisted of continuous gas-and-ash emissions during early November 2019, accompanied by nighttime incandescence, minor SO2 plumes, and the reappearance of the lake in the El Agrio crater during early December 2019 (BGVN 45:03). This report, covering March-November 2020, describes an eruption with gas-and-ash plumes from mid-June through late October, accompanied by thermal anomalies visible in satellite imagery and small SO2 plumes. Primary information for this report comes from the Servicio Nacional de Geología y Minería (SERNAGEOMIN) Observatorio Volcanológico de Los Andes del Sur (OVDAS), the Buenos Aires Volcanic Ash Advisory Center (VAAC), and various satellite data.
Activity during March-May 2020 was relatively low and consisted primarily of seismicity, sulfur dioxide emissions, and occasional white gas-and-steam emissions rising 300-900 m above the El Agrio crater. On 20 March a series of volcano-tectonic seismic events were detected SSW of the volcano; satellite images showed a decrease in the size of the crater lake. SO2 emissions had daily averages of 487-636 tons, with the highest value reaching 1,884 tons/day on 16 May. During April slight subsidence was reported in the crater, occurring at a maximum rate of 0.3 cm/month.
Activity during most of June and July consisted of occasional white gas-and-steam emissions rising 350-500 m above the El Agrio crater and SO2 emissions averaging 592-1,950 tons/day; a high value of 1,897 tons/day was reported on 13 June. However, on 16 June a period of increased seismicity was accompanied by crater incandescence and gas emissions containing some ash. SO2 plumes increased slightly in July with values of 2,100 and 1,713 tons/day on 2 and 4 July, respectively. Another ash plume was observed by local residents on 16 July, accompanied by elevated seismicity and SO2 emissions of 4,684 tons/day. On 20 July residents of La Araucanía described an odor that indicated hydrogen sulfide gas emissions. A photo on 23 July showed an ash plume rising above the crater (figure 55).
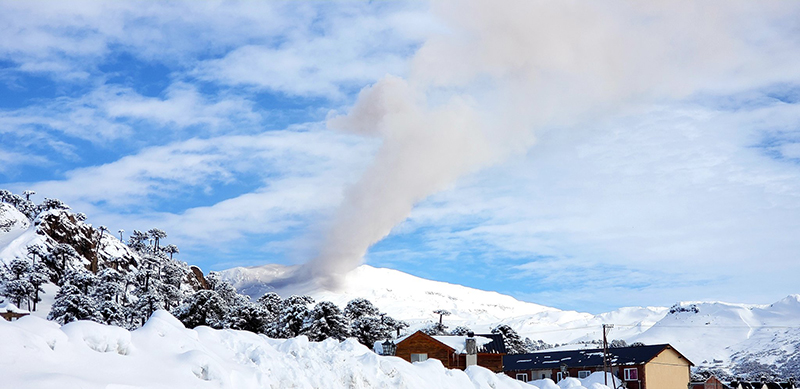 |
Figure 55. Photo of a gas-and-ash plume rising from Copahue on 23 July 2020. Courtesy of Valentina Sepulveda, taken from Caviahue, Argentina. |
Beginning in early August, and continuing through September 2020, the Sentinel-2 MODIS Thermal Volcanic Activity graph provided by the MIROVA system identified a small cluster of thermal anomalies in the summit area (figure 56). Thermal anomalies during this time were also captured in Sentinel-2 thermal satellite imagery, showing a persistent hotspot of varying strength in the summit crater (figure 57). This thermal activity was accompanied by small sulfur dioxide plumes identified by the TROPOMI instrument on the Sentinel-5P satellite, which exceeded two Dobson Units (DU). Distinct SO2 emissions greater than two DUs were detected on 6, 11, 21, 22, and 29 August, 1 and 6 September, and 4 and 15 October (figure 58).
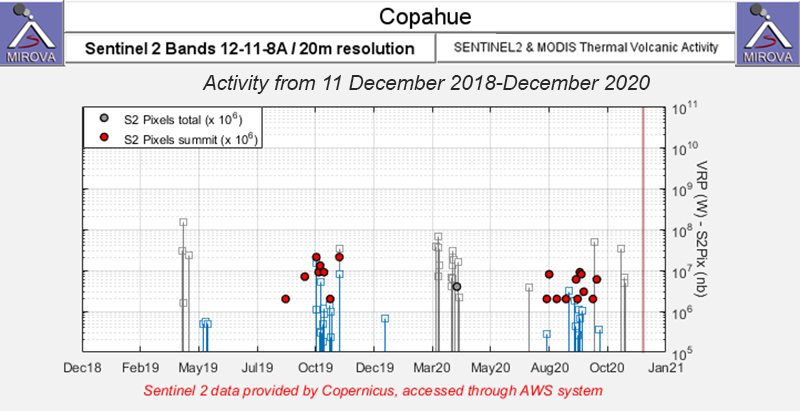 |
Figure 56. A small cluster of thermal anomalies were detected in the summit area of Copahue (red dots) during early August through September 2020 as recorded by the Sentinel-2 MODIS Thermal Volcanic Activity data (bands 12, 11, 8A). Courtesy of MIROVA. |
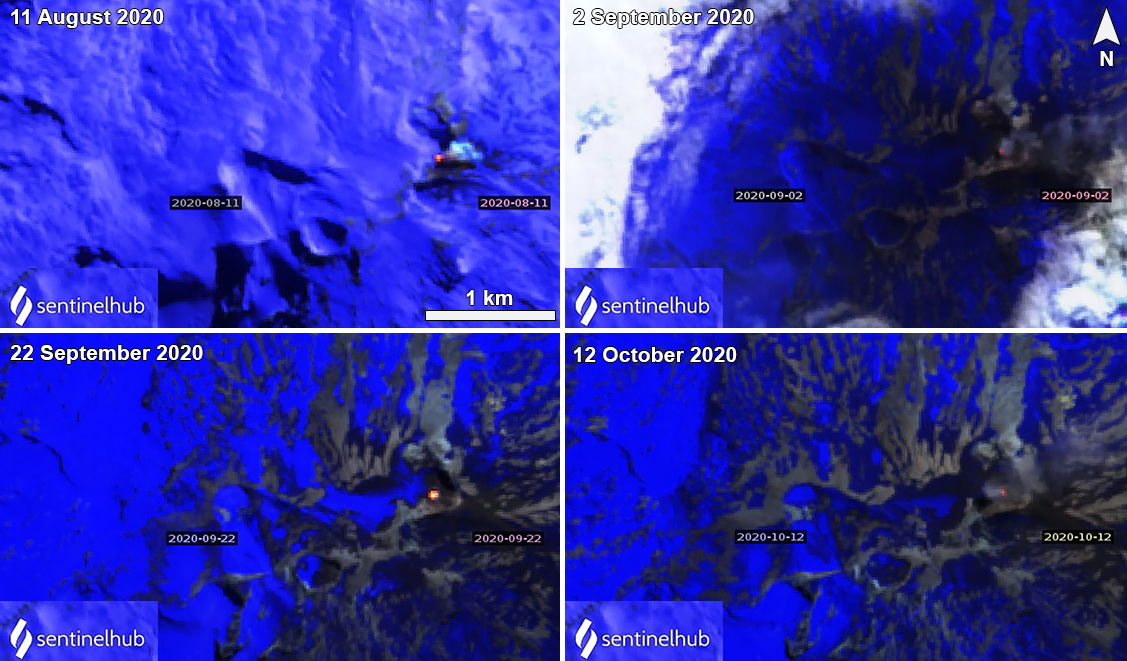 |
Figure 57. Sentinel-2 thermal satellite imagery showed a thermal anomaly (bright yellow-orange) at Copahue during August-October 2020. Images using “Atmospheric penetration” rendering (bands 12, 11, 8a). Courtesy of Sentinel Hub Playground. |
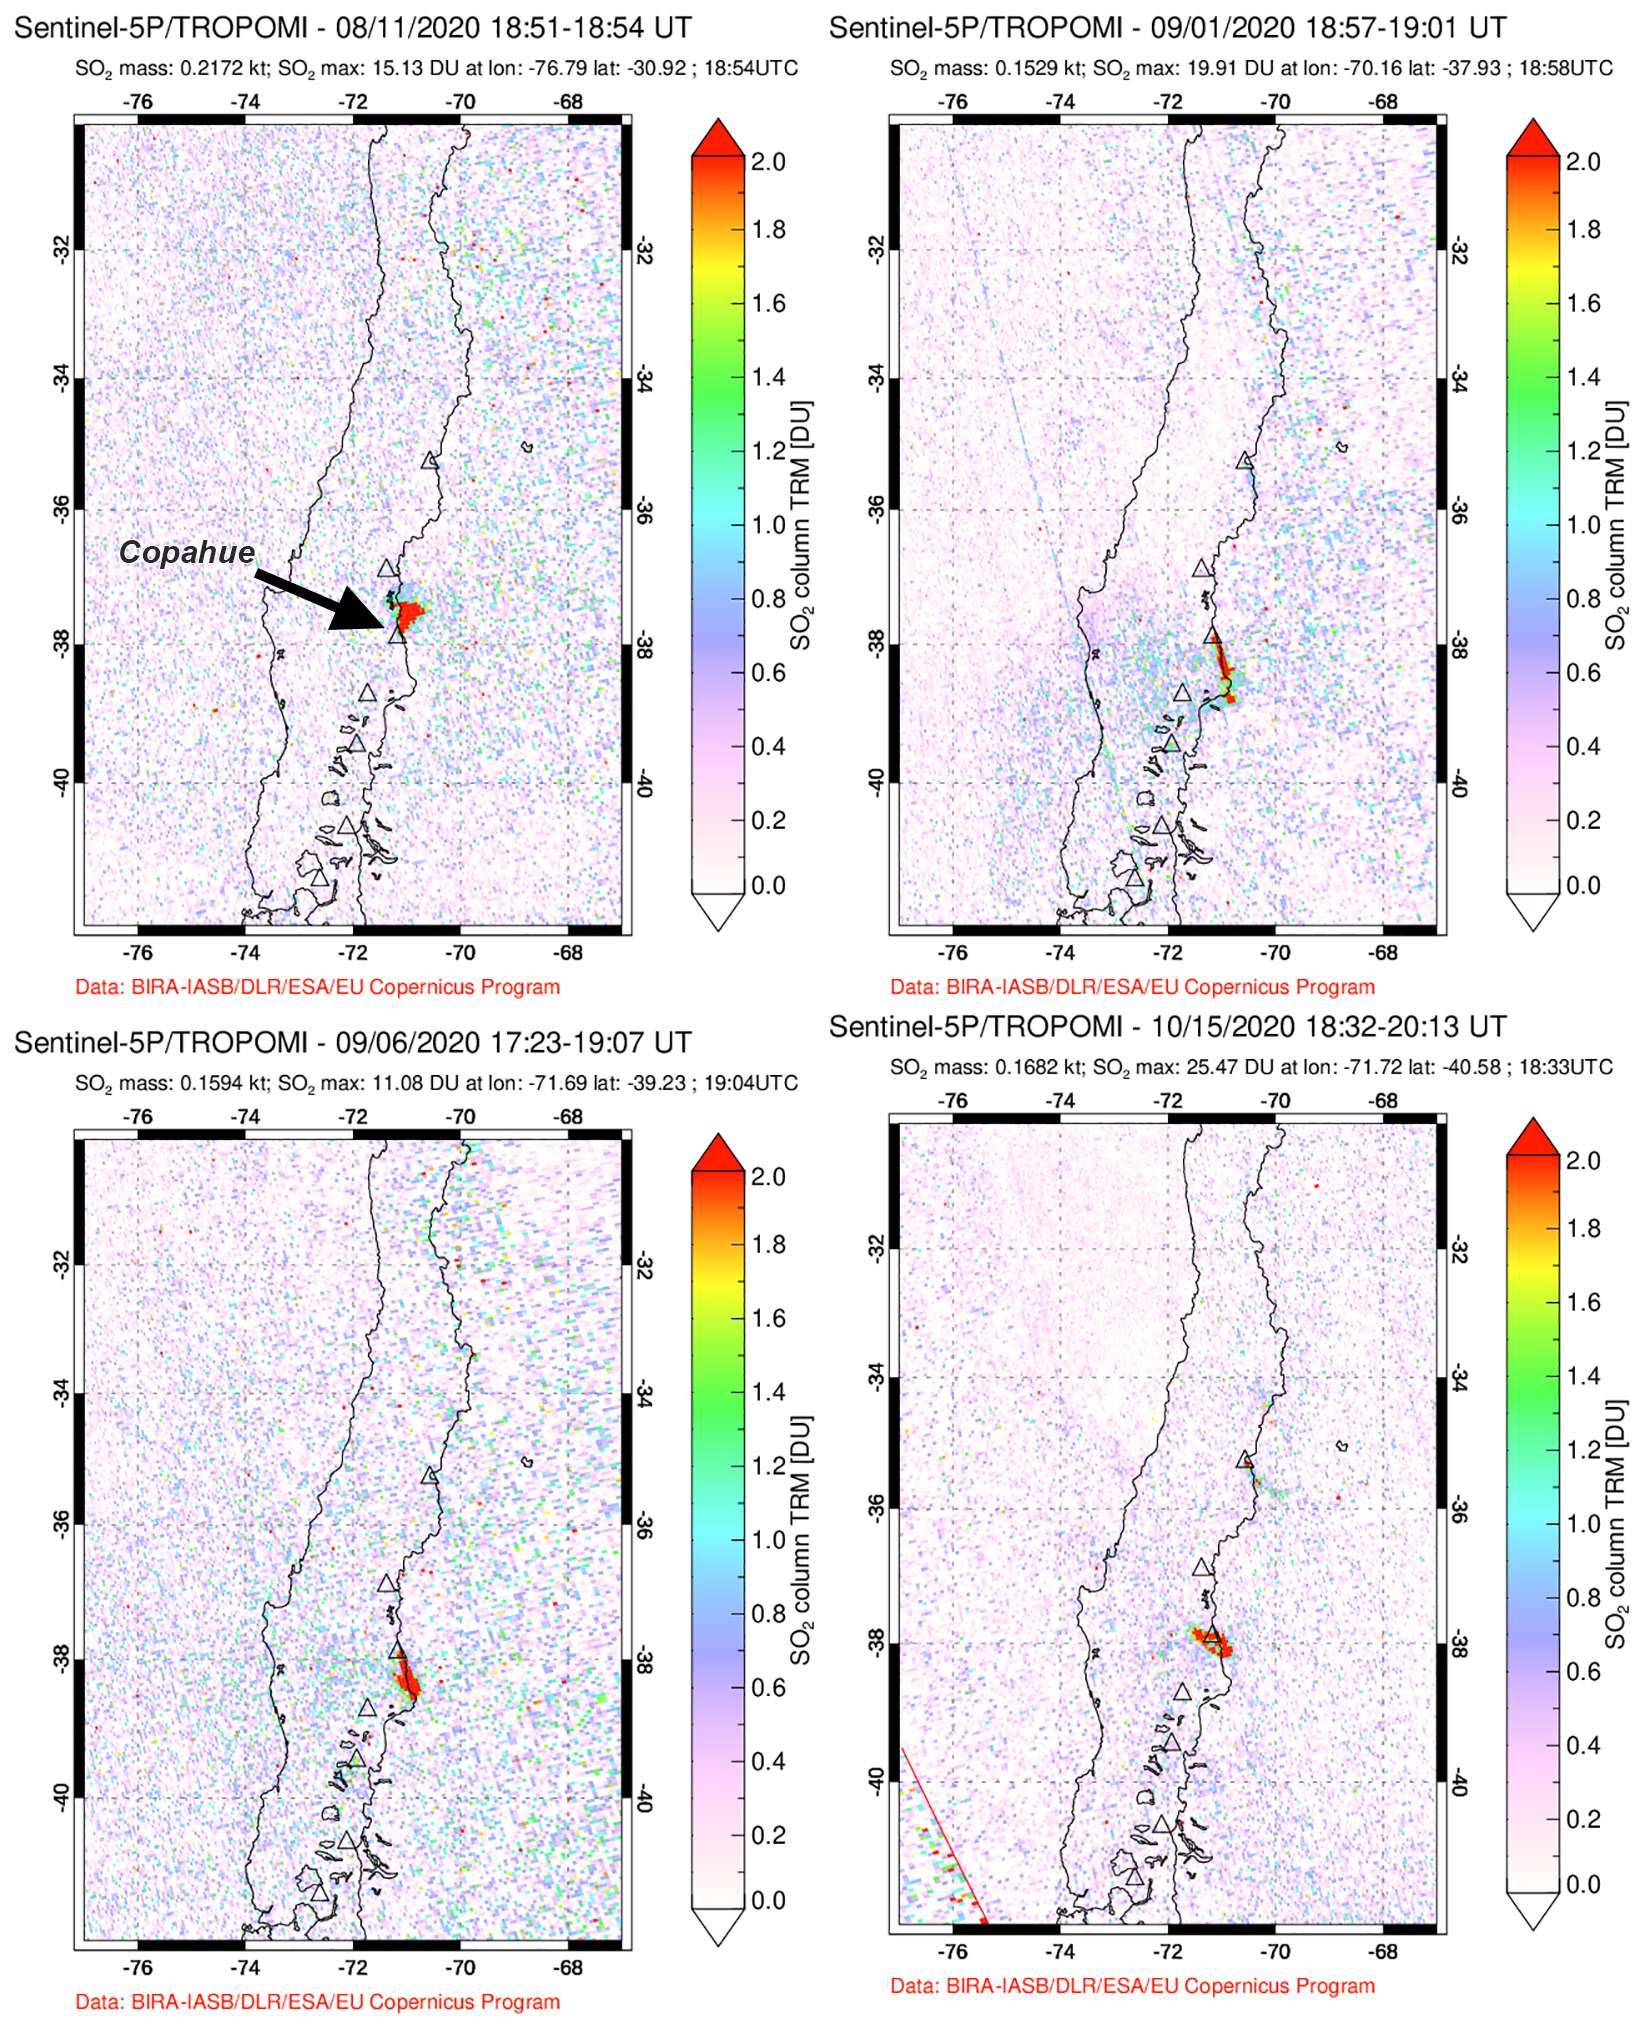 |
Figure 58. Small SO2 plumes were recorded at Copahue during August-October 2020. Top row: 11 August and 1 September 2020. Bottom row: 6 September and 15 October 2020. Courtesy of the NASA Global Sulfur Dioxide Monitoring Page. |
During August, approximately 133 explosive events were detected, in addition to the gas-and-steam and SO2 emissions (figure 59). On 3 August pulses of ash emissions were reported by SERNAGEOMIN, which resulted in a 2.2-km-long tephra deposit estimated to have a volume of 1 km3. Gray gas-and-ash emissions were observed on 6 August, followed by a thermal anomaly detected in satellite imagery beginning on 8 August. Sulfur dioxide emissions were elevated compared to previous months, measuring an average of 2,641 tons/day with high values of 4,498 tons/day on 12 August that increased to 4,627 tons/day by 27 August. During 16-31 August webcams recorded gas-and-ash plumes rising as high as 1.7 km altitude and were sometimes accompanied by nighttime crater incandescence. Plumes drifted in multiple directions as far as 4.3 km N, 9 km NE, 8 km E, 4 km SE, 4 km SW, 9 km W, and 4.4 km NW.
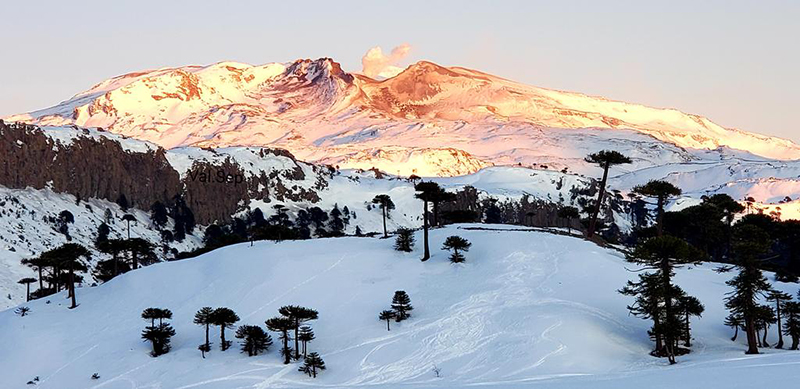 |
Figure 59. Photo of a white gas-and-steam plume rising from Copahue on 12 August 2020. Courtesy of Valentina Sepulveda, taken from Caviahue, Argentina. |
Elevated activity continued into September with 2-10 explosive events detected during the month; during 1-15 September webcams recorded gas-and-ash plumes rising to 1.1 km altitude, drifting 6-15 km SW and SE, which were sometimes accompanied by nighttime crater incandescence (figure 60). On 7 September a Buenos Aires VAAC advisory reported an ash plume rising to 3.7 km altitude drifting SE. On 11 September a webcam showed a weak gas emission, possibly containing some ash. Three episodes of gas-and-steam plumes were reported, rising 100-1,040 m above the crater, sometimes accompanied by incandescence. SO2 emissions were in the 1,499-1,714 tons/day range, with a high value of 4,522 tons/day on 28 September. SERNAGEOMIN reported repetitive explosions in the acid lake area alongside fumarolic activity, ejecting some material 1.7 km N, 1.2 km SE, and 4 km E of the crater.
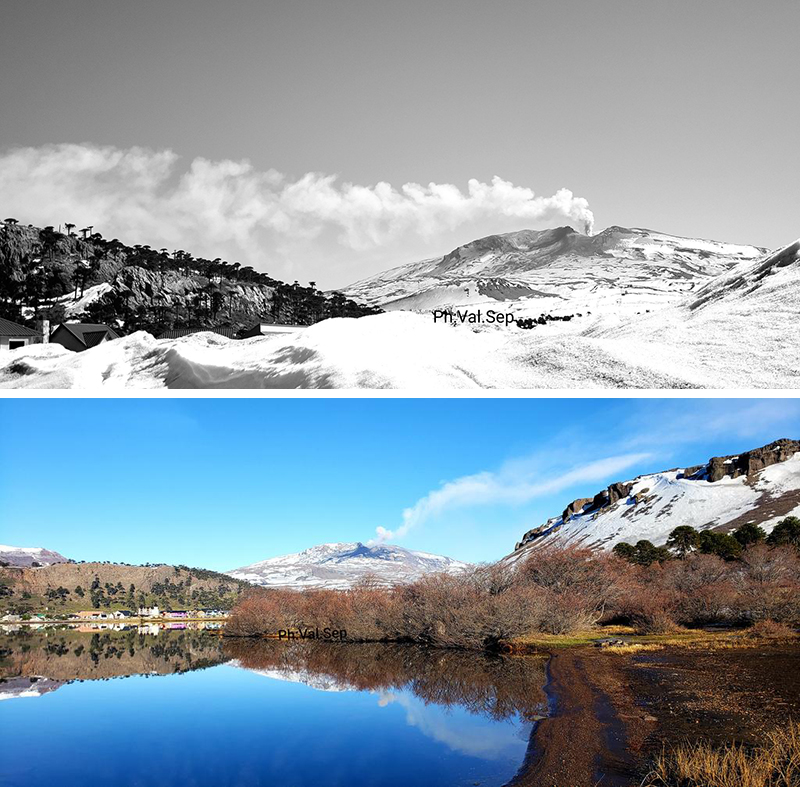 |
Figure 60. Photos of gas-and-steam plumes rising from Copahue on 6 September (top) and 28 September (bottom) 2020. Courtesy of Valentina Sepulveda, taken from Caviahue, Argentina. |
Persistent activity in October consisted of gas-and-steam plumes, ash emissions, and SO2 emissions. The gas-and-steam plumes rose 1.4 km above the crater, occasionally accompanied by nighttime incandescence. On 5 October the SO2 emissions were at a high value of 3,824 tons/day. During 12-15 October ash emissions resulted in a wide distribution of ashfall that reached 6.8 km NE, 7 km SE, and 6.7 km SW (figure 61). A pilot reported an ash plume rose to 3.7 km altitude drifting SE, according to a VAAC advisory, though the plume was not visible in satellite data. Sentinel-2 satellite imagery recorded strong gas-and-ash plumes during August-October, drifting generally S and E, which resulted in ash deposits on the nearby flanks (figure 62). Continued emissions had covered all of the flanks with ash by late October.
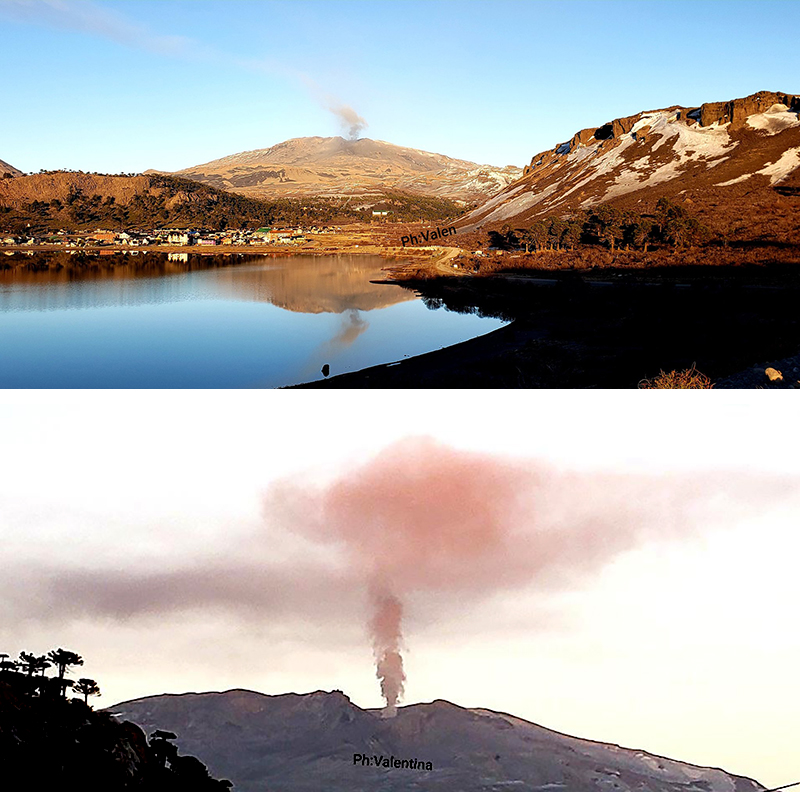 |
Figure 61. Photos of a gas-and-ash plume rising from Copahue on 13 October (top) and 15 October (bottom) 2020. Courtesy of Valentina Sepulveda, taken from Caviahue, Argentina. |
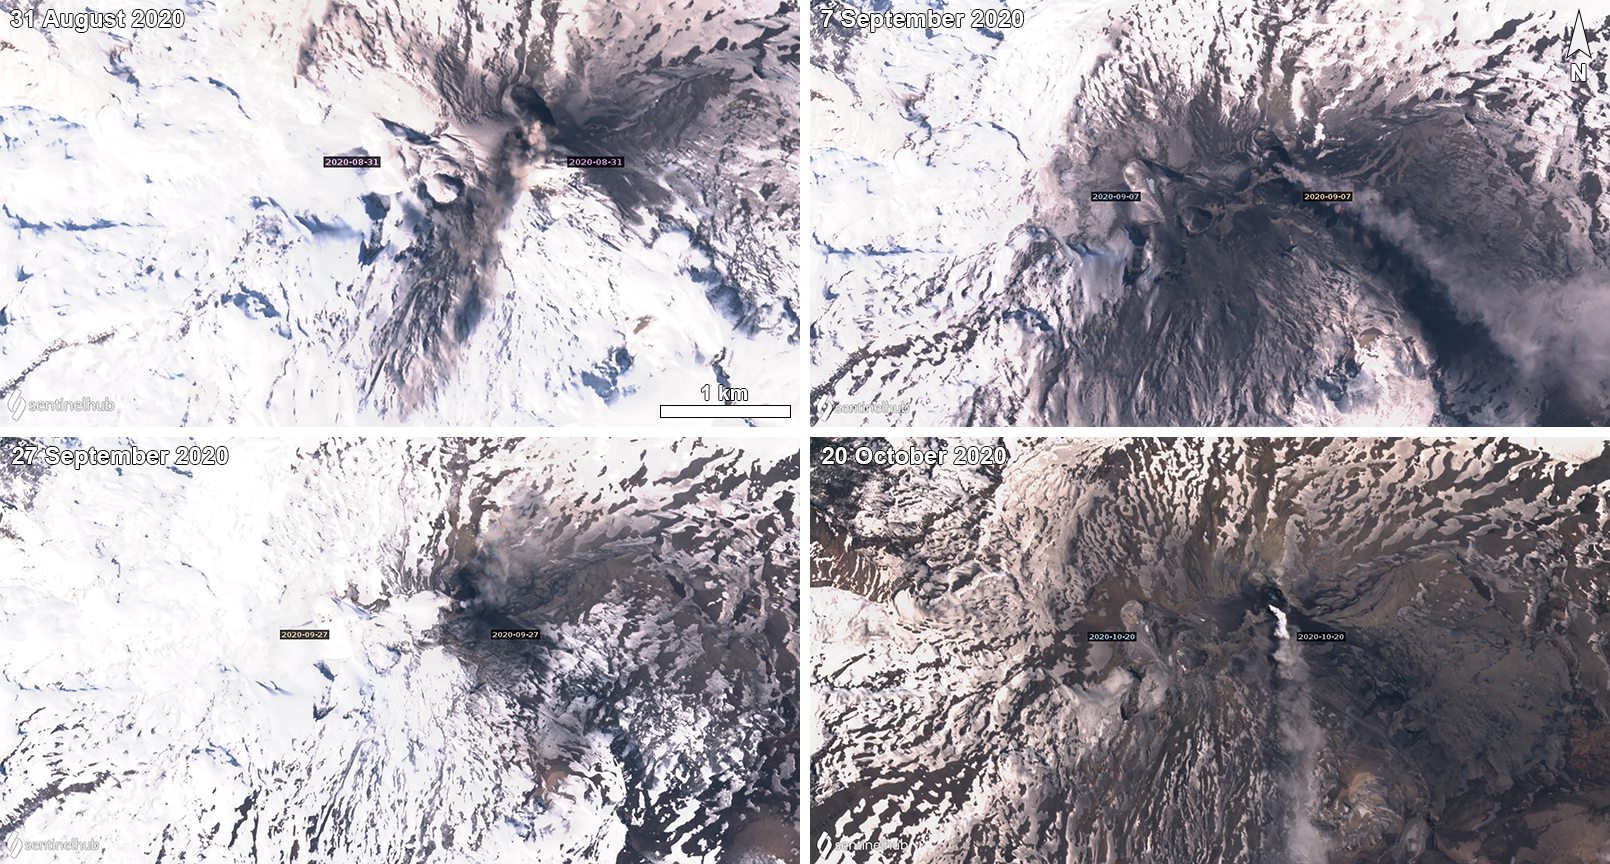 |
Figure 62. Sentinel-2 images showing ash gas-and-ash plumes rising from Copahue during August-October 2020, resulting in some ashfall in the nearby areas. The ash plume on 31 August (top left) is drifting S with ashfall observed on the N and S flanks. The ash plume on 7 September (top right) is drifting SE with ashfall on the E and S flanks. The ash plume on 27 September (bottom left) is drifting E and N with ashfall on the NE flanks. The ash plume on 20 October (bottom right) is drifting S with ashfall on all the flanks due to continued activity. Images using “Natural color” rendering (bands 4, 3, 2). Courtesy of Sentinel Hub Playground. |
Similar activity during November decreased, primarily characterized by gas-and-steam plumes and SO2 emissions. White gas-and-steam emissions, possibly with some ash content, were observed with a webcam on 9 and 12 November, accompanied by low but continuous seismicity. During 11-12 November SO2 emissions were at a high value of 904 tons/day. A white gas-and-steam plume was observed on 15 November rising 760 m above the crater; typical degassing rose 200-300 m above the crater, according to SERNAGEOMIN. The daily average of SO2 emissions ranged 366-582 tons.
Geological Summary. Volcán Copahue is an elongated composite cone constructed along the Chile-Argentina border within the 6.5 x 8.5 km wide Trapa-Trapa caldera that formed between 0.6 and 0.4 million years ago near the NW margin of the 20 x 15 km Pliocene Caviahue (Del Agrio) caldera. The eastern summit crater, part of a 2-km-long, ENE-WSW line of nine craters, contains a briny, acidic 300-m-wide crater lake (also referred to as El Agrio or Del Agrio) and displays intense fumarolic activity. Acidic hot springs occur below the eastern outlet of the crater lake, contributing to the acidity of the Río Agrio, and another geothermal zone is located within Caviahue caldera about 7 km NE of the summit. Infrequent mild-to-moderate explosive eruptions have been recorded since the 18th century. Twentieth-century eruptions from the crater lake have ejected pyroclastic rocks and chilled liquid sulfur fragments.
Information Contacts: Servicio Nacional de Geología y Minería (SERNAGEOMIN), Observatorio Volcanológico de Los Andes del Sur (OVDAS), Avda Sta María No. 0104, Santiago, Chile (URL: http://www.sernageomin.cl/); MIROVA (Middle InfraRed Observation of Volcanic Activity), a collaborative project between the Universities of Turin and Florence (Italy) supported by the Centre for Volcanic Risk of the Italian Civil Protection Department (URL: http://www.mirovaweb.it/); Global Sulfur Dioxide Monitoring Page, Atmospheric Chemistry and Dynamics Laboratory, NASA Goddard Space Flight Center (NASA/GSFC), 8800 Greenbelt Road, Goddard, Maryland, USA (URL: https://so2.gsfc.nasa.gov/); Sentinel Hub Playground (URL: https://www.sentinel-hub.com/explore/sentinel-playground); Valentina Sepulveda, Hotel Caviahue, Caviahue, Argentina (URL: https://twitter.com/valecaviahue, Twitter: @valecaviahue).