Pacaya
Guatemala
14.382°N, 90.601°W; summit elev. 2569 m
All times are local (unless otherwise noted)
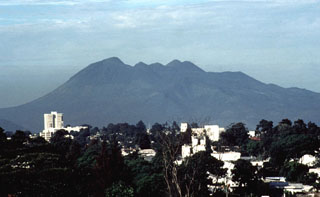
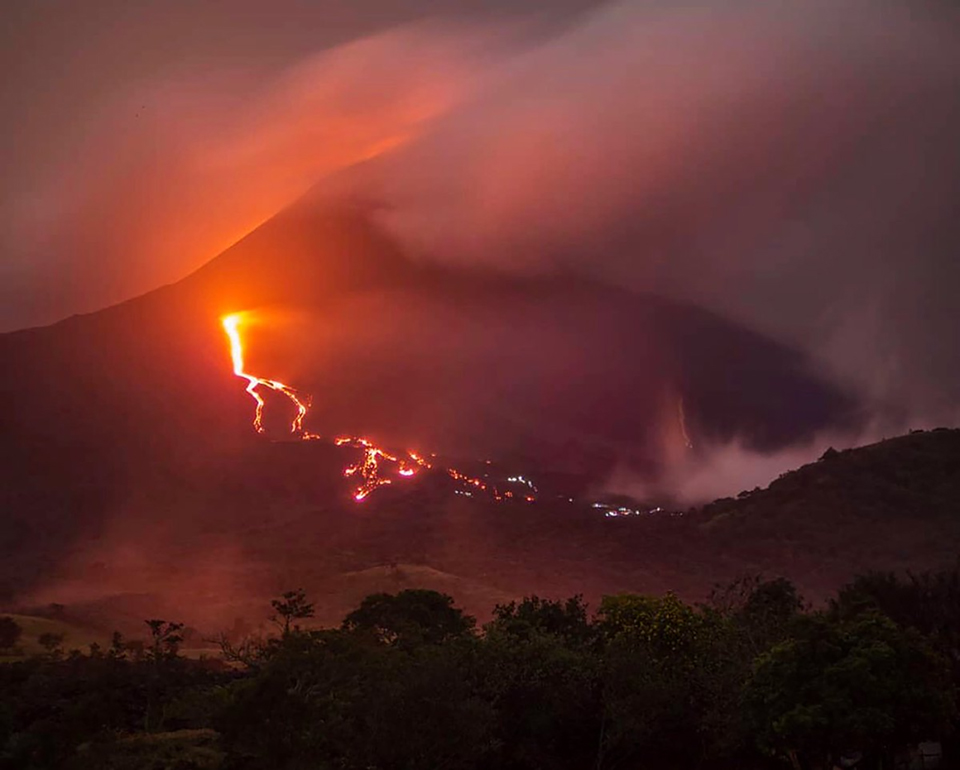
Extensive lava flows, bomb-laden Strombolian explosions, and ash plumes emerging from Mackenney crater have characterized the persistent activity at Pacaya since 1961. The latest eruptive episode began with intermittent ash plumes and incandescence in June 2015; the growth of a new pyroclastic cone inside the summit crater was confirmed later that year. The pyroclastic cone has continued to grow, producing Strombolian explosions rising above the crater rim and frequent loud explosions. In addition, fissures on the flanks of the summit crater have produced an increasing number of lava flows traveling distances of over one kilometer down multiple flanks during 2019 and 2020 (figure 129). Increasing explosive and effusive activity during August-November 2020 is covered in this report with information provided by Guatemala's Instituto Nacional de Sismologia, Vulcanologia, Meteorologia e Hydrologia (INSIVUMEH), multiple sources of satellite data, and numerous photographs from observers on the ground.
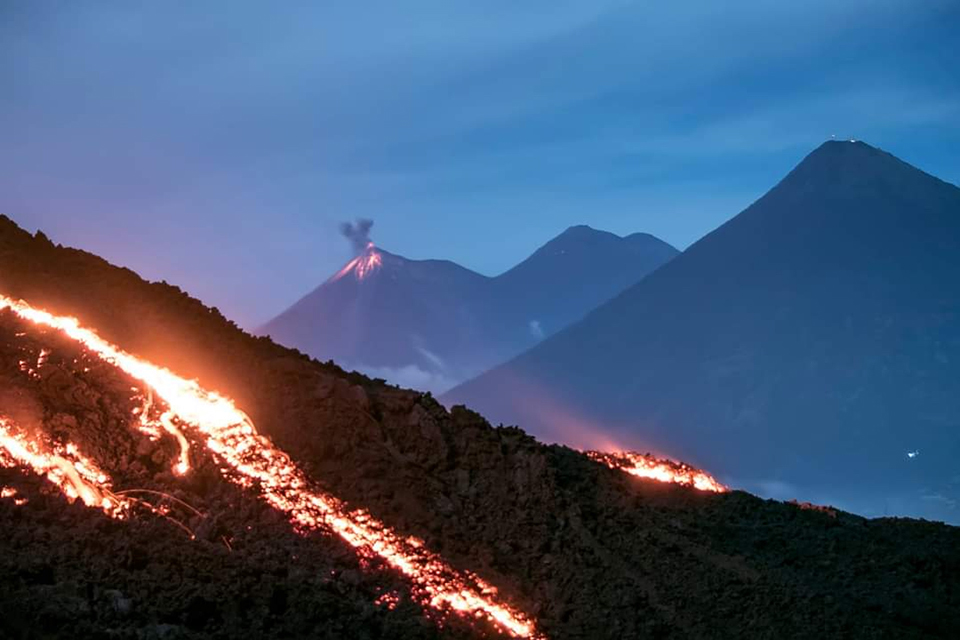
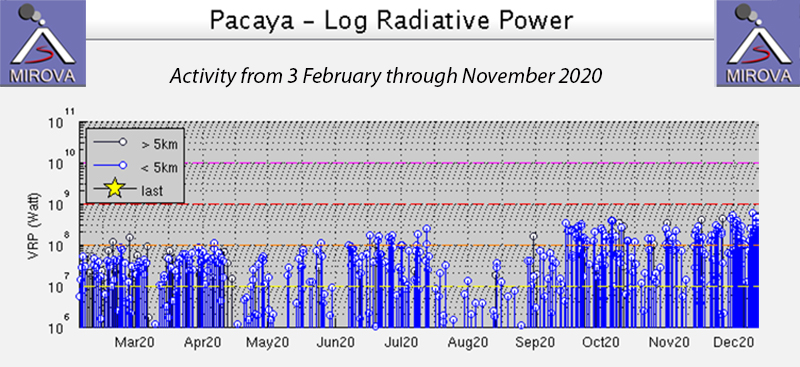
After a brief pause in effusive activity at the end of July 2020, two lava flows appeared on the NW flank on 12 August. Another flow began on the NE flank ten days later, and multiple flows were active for the remainder of the month, some reaching 650 m long. Multiple lava flows issued from fissures on the N flank and elsewhere throughout September. A flow on the NE flank was reported as 1,200 m long and was visible from Guatemala City on 8 September. A new flow on the S flank was very active later in the month. Flows were persistent on most of the flanks throughout October; a flow appeared from a fissure on the W flank on 20 October and reached 1 km in length by 24 October. Block avalanches spalled off the front of the flows and generated small ash plumes. Multi-branched flows on the W and SW flanks from the W flank fissure remained active throughout November. The slowdown in effusive activity in late July and early August 2020 is apparent in the MIROVA thermal anomaly data, as is the significant increase in activity during September that persisted into November 2020 (figure 130).
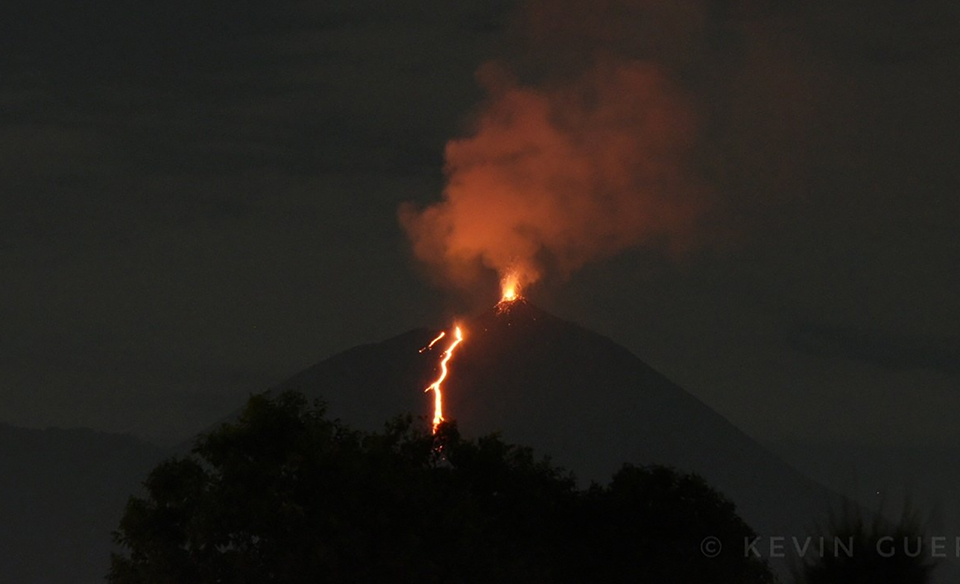
The break in the lava flow activity that began on 25 July 2020 (BGVN 45:08) lasted until 12 August. During that time, steam plumes were reported rising 25-75 m above the summit and drifting generally S or SW as far as 6 km before dissipating. Strombolian explosions rose 25-150 m above the rim of Mackenney crater and ejecta reached 50 m from the rim; noises as loud as a train engine were heard in nearby communities. Incandescence was observed nearly constantly along with persistent seismic tremor activity. On 12 August two lava flows emerged on the NW flank, each reaching about 150 m long. Incandescence from the flows was visible each day through 21 August on the NW flank in the area just above Cerro Chino (figure 131). The active flows were 100-200 m long during this period. A new lava flow appeared on the NE flank and grew to 300 m in length on 22 August.
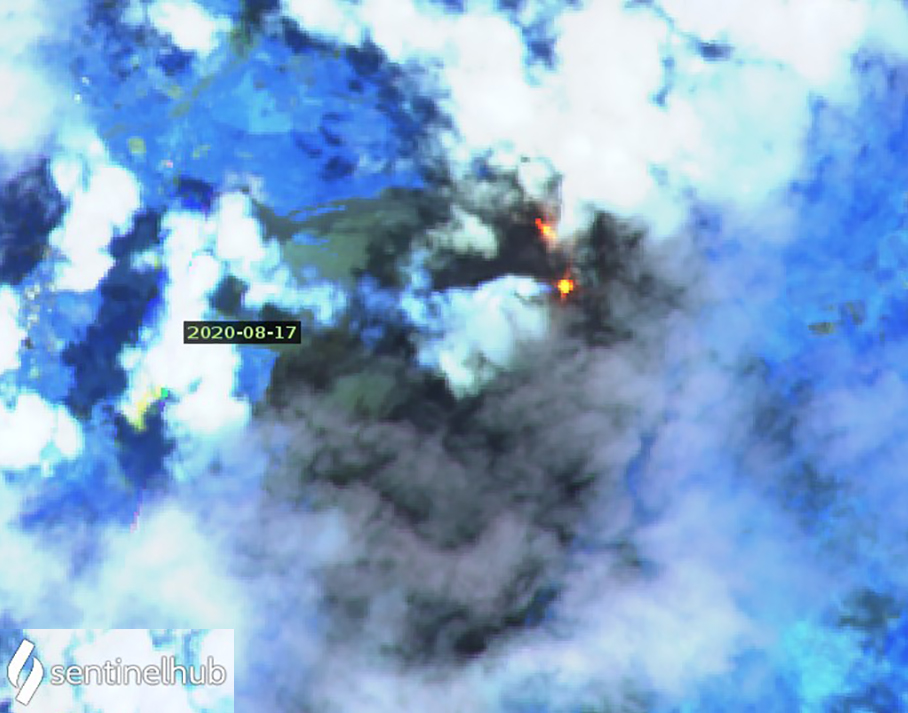
Multiple lava flows were active on the NW, N, and NE flanks for the rest of the August. Incandescence on 24 August from the NW-flank flow near Cerro Chino indicated it was 250-300 m long. During 27 and 28 August flows were reported on the N and NNE flanks, 600 and 300 m long, respectively (figure 132). Incandescent pulses were reported from the crater overnight on 28-29 August; the NW flank flow remained active and was 300 m long. MODVOLC reported three thermal alerts on 29 August. The next day, 30 August, incandescence from the 650-m-long N flank flow and 300-m-long NE flank flow continued. Constant crater incandescence accompanied dense gray ash emissions on 31 August; the lava flow on the N flank remained incandescent for 350-400 m, but there was no incandescence or degassing from the NE-flank flow on the last day of the month.
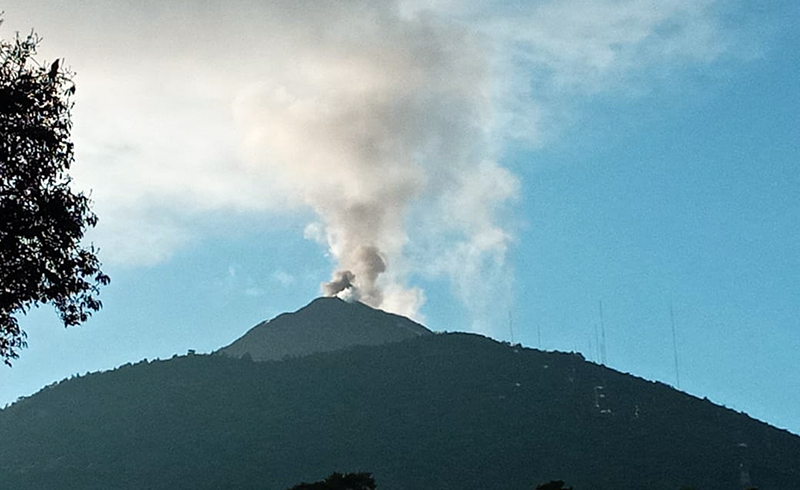
White and blue steam and gas plumes were present daily throughout September 2020. They drifted in multiple directions as far as 8 km from the summit before dissipating. Strombolian activity was constant, building up the pyroclastic cone inside of Mackenney crater and sending ejecta as far as 50 m from the rim. Ejecta rose 50-150 m on most days; it was reported at 200 m high on 3, 9, and 14 September and was heard loudly and rattled windows nearby on 17 and 27 September. Constant crater incandescence with prolonged degassing of dense gray ash plumes was reported on 5, 10, 15, 17, and 21 September.
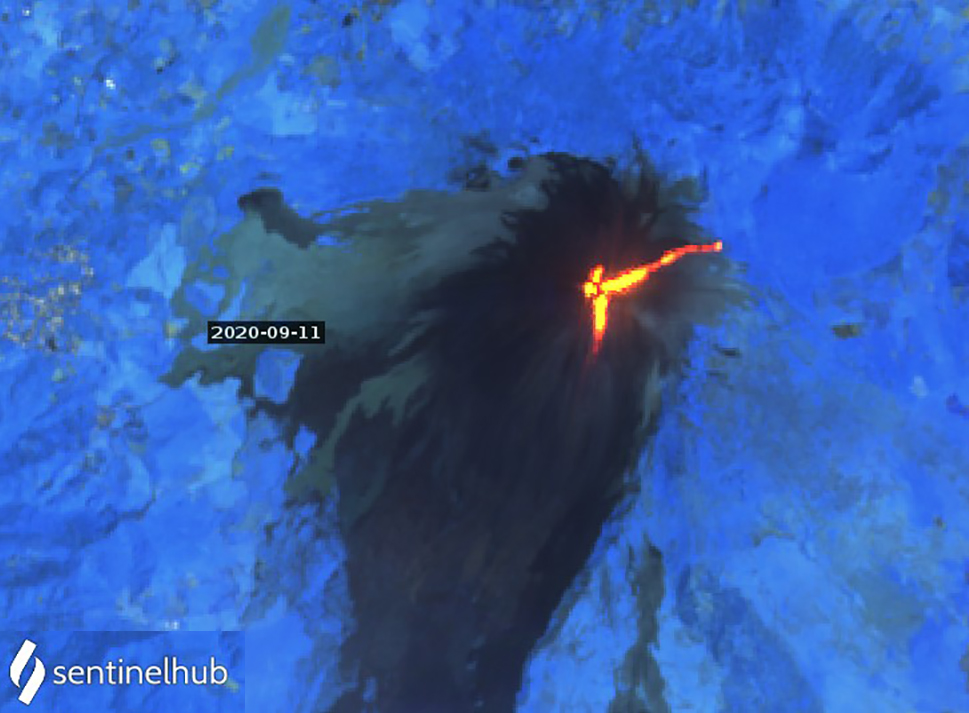
Multiple lava flows issued from fissures on the N flank and elsewhere throughout the month. Two lava flows on 1 September on the N flank were 50 and 350 m long. The next day three flows on the same flank were 300, 350, and 650 m long. On 3 September a new flow appeared on the E flank and extended 600 m from its source in addition to two flows on the N flank. For the next several days multiple flows were active on the N and NE flanks, reaching 450 m on the NE flank on 7 September. The next day the flow on the NE flank reached 1,200 m in length and was visible from Guatemala City. Activity continued with multiple flows 150-300 m long through 12 September (figure 133).
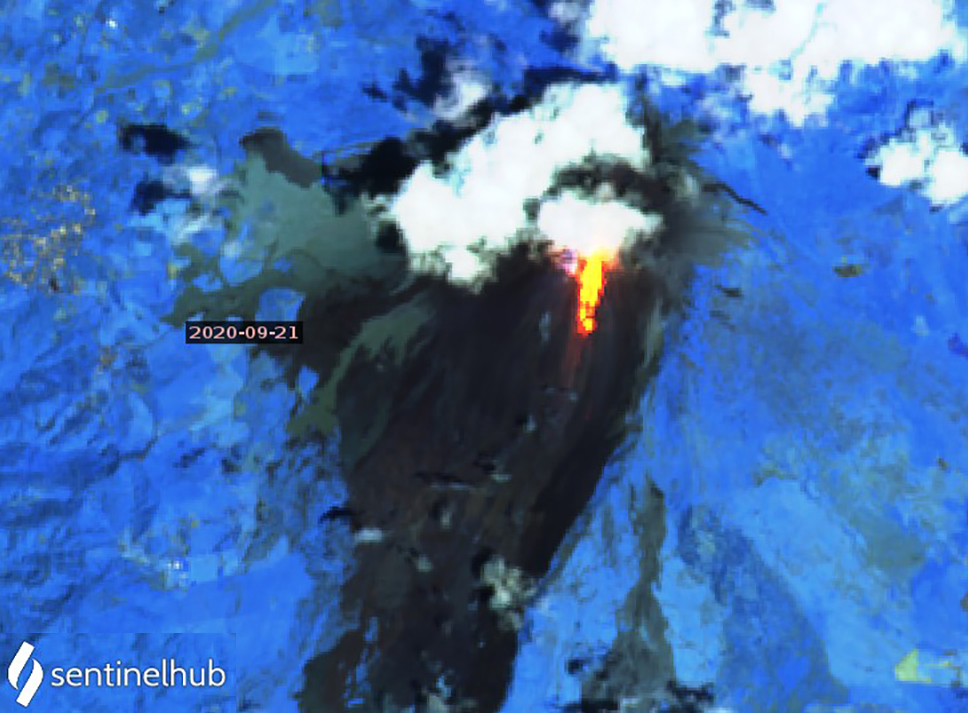
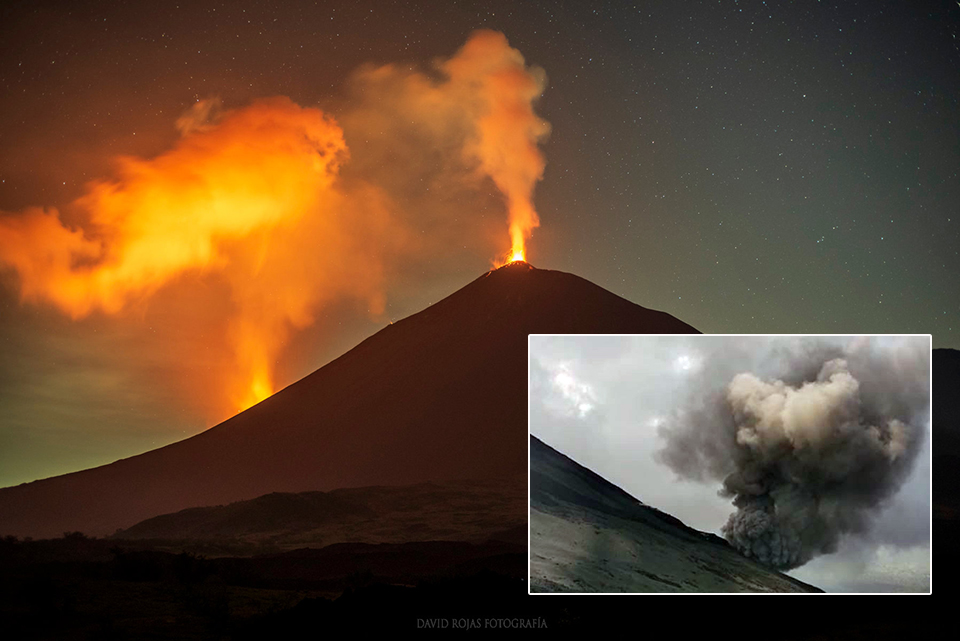
On 13 September 2020 the flows on the N and NE flanks reached 600 and 300 m long, while a third flow reached 150 m down the S flank. The flow on the S flank was the most active during 14-23 September, extending 550 m from its source and producing numerous block avalanches from the flow front (figure 134). During the last week of the month the focus of the flow activity returned to the NE, N, and NW flanks where multiple flows were reported, some up to 550 m long, along with constant Strombolian activity (figures 135). Increased thermal activity resulted in MODVOLC thermal alerts reported on seven days during the second half of the month.
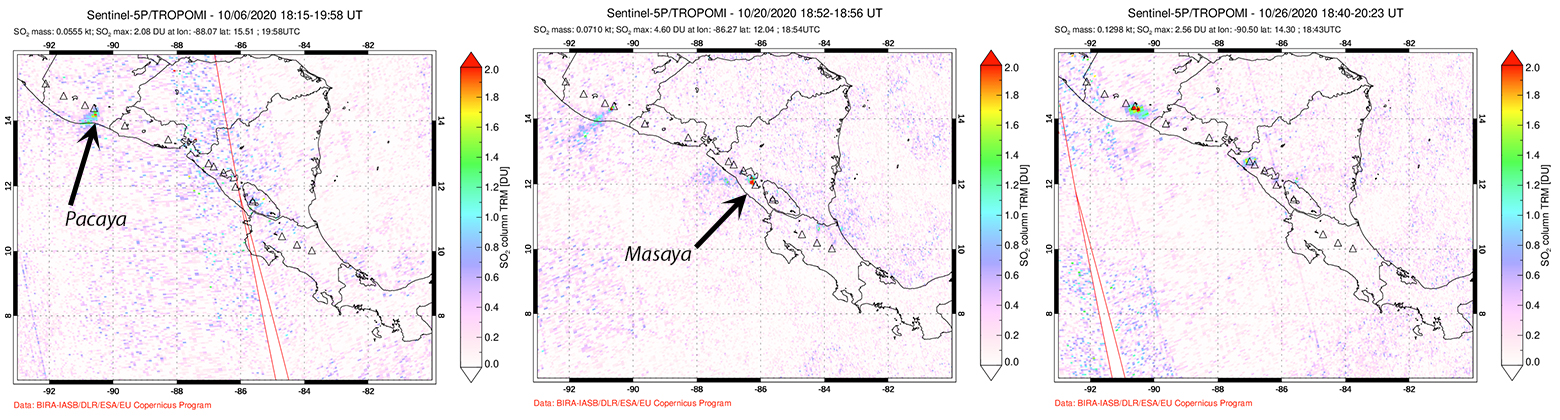
Gas and steam plumes persisted throughout October 2020. They generally rose a few hundred meters above the summit and usually drifted S or W up to 10 km. Strombolian explosions continued daily, reported at 75-150 m high for most of the month. In a special report on 8 October INSIVUMEH noted increased Strombolian activity that sent bombs and fine ash 200-300 m above the crater, with ash emissions drifting 12 km W. During the last week of the month the ejecta reached 250 m high on several days. Loud noises and shock waves were periodically reported; vibrations were felt in San Francisco de Sales on 23 October and in areas to the S of Guatemala City on 27 October. INSIVUMEH reported ash emissions that drifted 8-10 km S and W from the summit on 23 October. The Washington VAAC reported ash emissions seen in satellite imagery drifting 15 km NE at 3.7 km altitude on 28 October. Weak sulfur dioxide emissions were recorded by the TROPOMI instrument on 6, 20, and 26 October (figure 136).
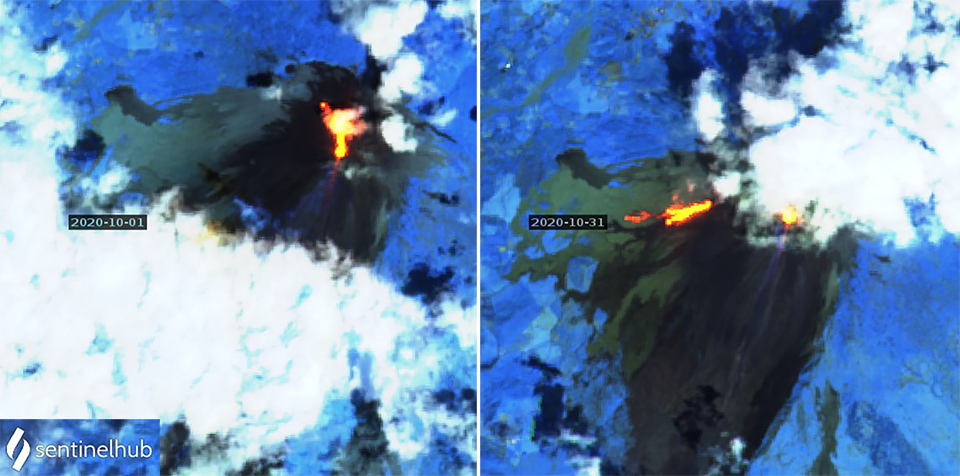
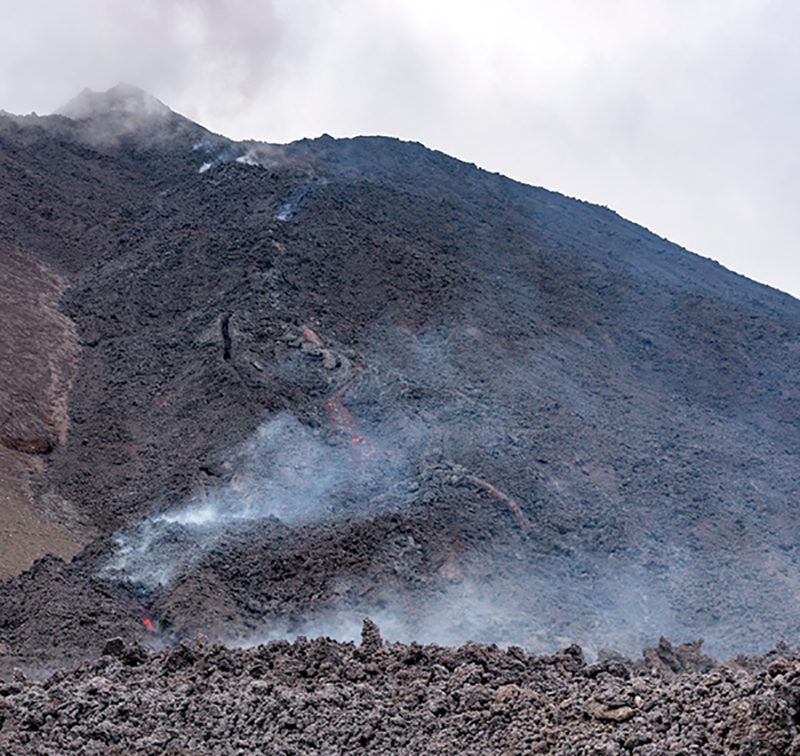
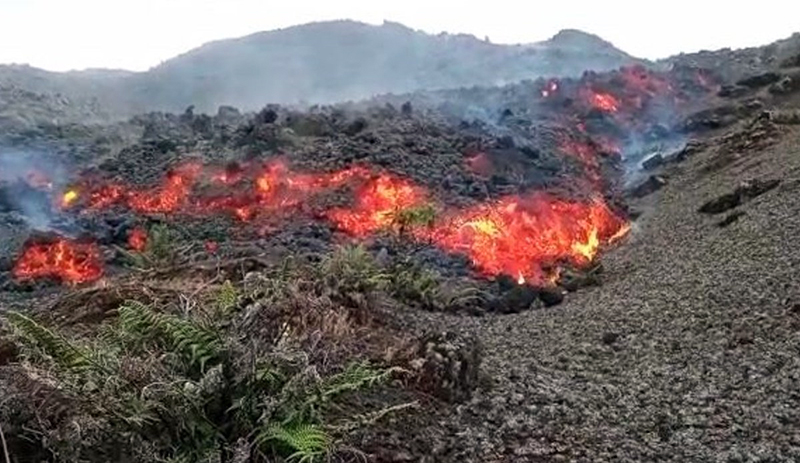
Numerous lava flows were active throughout the month of October 2020 on multiple flanks (figure 137). During 1-4 October INSIVUMEH reported one or two flows active on the N and NE flanks that were 100-500 m long (figure 138). On 4 October there was a 200-m-long flow on the S flank, and another flow on the W flank. The S-flank flow grew to 250 m long by 8 October, had block avalanches spalling off the front, and fine ash that was stirred up by the wind. The next day three flows were active; they were 400 m long on the NE flank, 300 m on the N flank, and 200 m on the W flank. The N-flank flow was the most active during 11-15 October, reaching 650 m long. The W-flank flow was very active from 20 October through the end of the month, issuing from a fissure at mid-flank. It reached 1 km in length by 24 October and burned vegetation at the flow front (figures 139). A flow on the NE flank was 350 m long on 26 October (figure 140). MODVOLC issued thermal alerts on 7 days of the month, including seven alerts on 5 October.
Although the weather was cloudy for much of November 2020, white steam and blue gas plumes were visible drifting S or W from the summit on many days, some reaching 10 km from the volcano before dissipating. Sporadic Strombolian explosions rose 100-200 m above the pyroclastic cone inside Mackenney crater; the explosions were often accompanied by small ash plumes that rose a few hundred meters and drifted downwind 8-10 km before dissipating. A small SO2 plume was recorded in the TROPOMI satellite data on 8 November, the same day that INSIVUMEH and the Washington VAAC reported an ash emission drifting NE at 3.4 km altitude over the village of Los Llanos and others in the area (figure 141). An increase in activity reported by INSIVUMEH on 15 November consisted of Strombolian explosions sending material up to 300 m above the summit and ejecting bombs up to 100 m outside the crater.
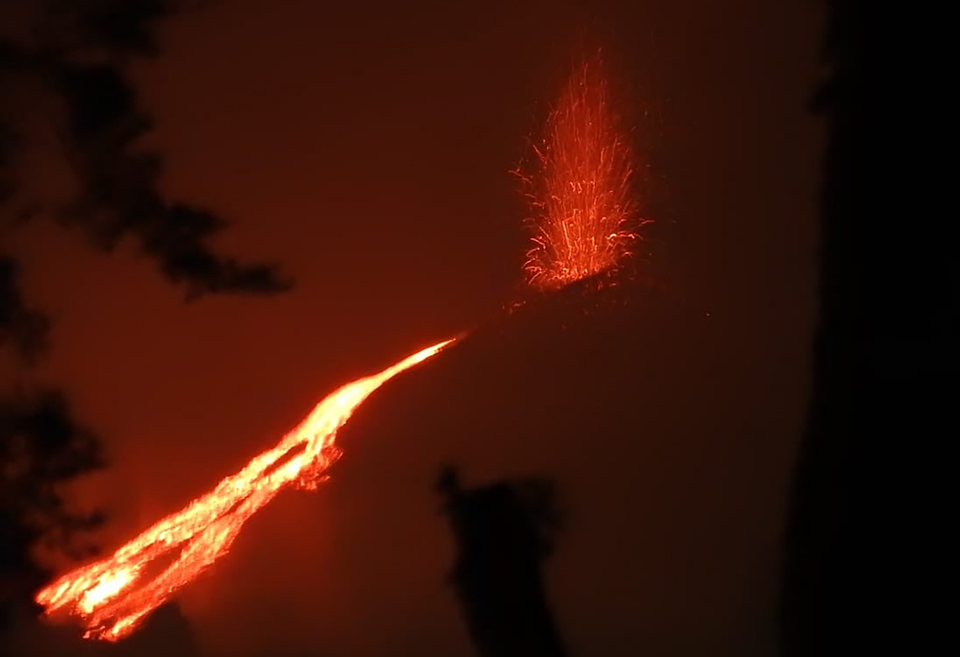
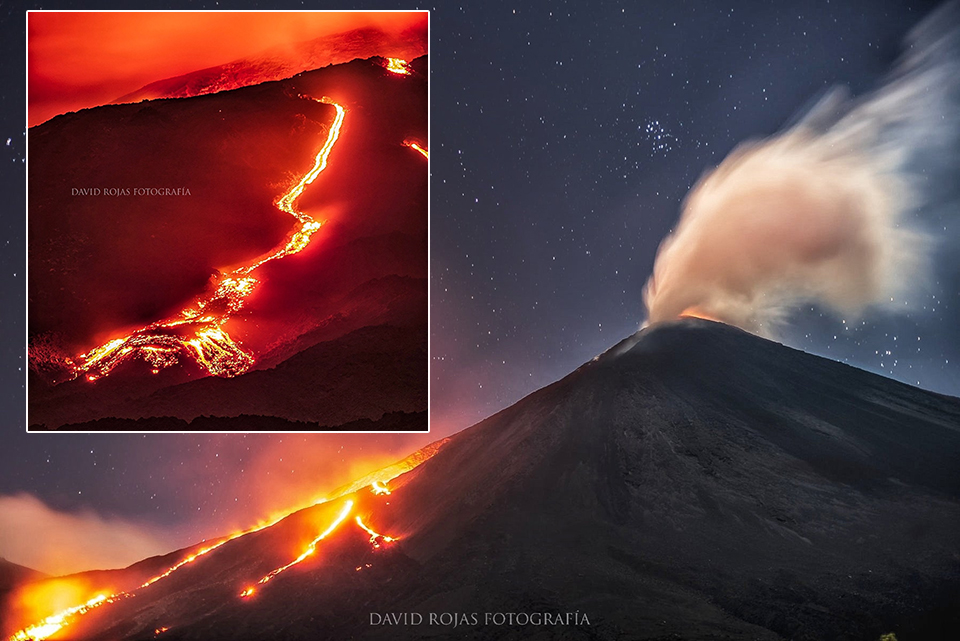
Lava flows were still very active on the SW flank throughout November, emerging from a fissure a few hundred meters down from the summit that initially opened on 20 October. The main flow was 600 m long on 1 November and grew to 1,200 m long by 11 November (figure 142). On 5 November there were four separate branches of the SW-flank flow that were active. Block avalanches were common at the flow front. On 14 November a second flow was observed emerging from a fissure higher up on the SW flank from the earlier flow; they both were active for several days. INSIVUMEH issued a special report indicating increased effusion on 15 November from the SW-flank fissure. Block avalanches were occurring from the front of the 1-km-long flow, which had several branches. The blocks were 1-3 m in diameter and created small plumes of ash when moving as far as 500 m down the slope. An explosion during the night of 14-15 November at the SW-flank fissure created incandescent ejecta and ash emissions for several hours (figure 143). The flow remained active throughout the rest of November; on 26 November two flows were active from the main fissure, 500 and 400 m long (figure 144). On 30 November the main flow on the SW flank had three branches and extended 600 m from the mid-flank fissure.
Geological Summary. Eruptions from Pacaya are frequently visible from Guatemala City, the nation's capital. This complex basaltic volcano was constructed just outside the southern topographic rim of the 14 x 16 km Pleistocene Amatitlán caldera. A cluster of dacitic lava domes occupies the southern caldera floor. The post-caldera Pacaya massif includes the older Pacaya Viejo and Cerro Grande stratovolcanoes and the currently active Mackenney stratovolcano. Collapse of Pacaya Viejo between 600 and 1,500 years ago produced a debris-avalanche deposit that extends 25 km onto the Pacific coastal plain and left an arcuate scarp inside which the modern Pacaya volcano (Mackenney cone) grew. The NW-flank Cerro Chino crater was last active in the 19th century. During the past several decades, activity has consisted of frequent Strombolian eruptions with intermittent lava flow extrusion that has partially filled in the caldera moat and covered the flanks of Mackenney cone, punctuated by occasional larger explosive eruptions that partially destroy the summit.
Information Contacts: Instituto Nacional de Sismologia, Vulcanologia, Meteorologia e Hydrologia (INSIVUMEH), Unit of Volcanology, Geologic Department of Investigation and Services, 7a Av. 14-57, Zona 13, Guatemala City, Guatemala (URL: http://www.insivumeh.gob.gt/ ); Sentinel Hub Playground (URL: https://www.sentinel-hub.com/explore/sentinel-playground); Coordinadora Nacional para la Reducción de Desastres (CONRED), Av. Hincapié 21-72, Zona 13, Guatemala City, Guatemala (URL: http://conred.gob.gt/www/index.php) (URL: https://twitter.com/ConredGuatemala/status/1310057080162844673, https://conred.gob.gt/monitoreo-a-flujo-de-lava-en-el-volcan-pacaya/) ; NASA Global Sulfur Dioxide Monitoring Page, Atmospheric Chemistry and Dynamics Laboratory, NASA Goddard Space Flight Center (NASA/GSFC), 8800 Greenbelt Road, Goddard, Maryland, USA (URL: https://so2.gsfc.nasa.gov/); Hawai'i Institute of Geophysics and Planetology (HIGP) - MODVOLC Thermal Alerts System, School of Ocean and Earth Science and Technology (SOEST), Univ. of Hawai'i, 2525 Correa Road, Honolulu, HI 96822, USA (URL: http://modis.higp.hawaii.edu/); MIROVA (Middle InfraRed Observation of Volcanic Activity), a collaborative project between the Universities of Turin and Florence (Italy) supported by the Centre for Volcanic Risk of the Italian Civil Protection Department (URL: http://www.mirovaweb.it/); David Rojas, Guatemala (URL: https://www.instagram.com/davidrojasgtfoto/, https://twitter.com/DavidRojasGt/); Mariana Lemus, Guatemala (URL: https://www.instagram.com/marianalemusgt/); Noti7 (URL: https://twitter.com/Noti7Guatemala/status/1320169410833883136); Sh!ft (URL: https://twitter.com/kevingt_/status/1299204020662304768); Prensa Objetiva (URL: https://twitter.com/noticiasprensa/status/1328102695832612865).