Report on Kilauea (United States) — March 2021
Bulletin of the Global Volcanism Network, vol. 46, no. 3 (March 2021)
Managing Editor: Edward Venzke.
Edited by Kadie L. Bennis.
Kilauea (United States) New eruption in December 2020 with an active lava lake, lava flows, spattering, and a dome fountain
Please cite this report as:
Global Volcanism Program, 2021. Report on Kilauea (United States) (Bennis, K.L., and Venzke, E., eds.). Bulletin of the Global Volcanism Network, 46:3. Smithsonian Institution. https://doi.org/10.5479/si.GVP.BGVN202103-332010
Kilauea
United States
19.421°N, 155.287°W; summit elev. 1222 m
All times are local (unless otherwise noted)
Kīlauea, which overlaps the E flank of the Mauna Loa shield volcano, is the southeastern-most volcano in Hawaii. It’s East Rift Zone (ERZ) has been intermittently active for at least 2,000 years; the most recent eruption period began in January 1983 and was characterized by open lava lakes and lava flows from the summit caldera and the East Rift Zone. During May 2018 lava migrated into the Lower East Rift Zone (LERZ) and opened 24 fissures along a 6-km-long NE-trending fracture zone that produced lava flows traveling in multiple directions. Lava fountaining was reported in these fissures and the lava lake in the Halema’uma’u crater drained (BGVN 43:10).
September 2018 marked the end of the previous eruption period after 36 years of continuous activity. A new eruption began during December 2020 in the Halema’uma’u crater, characterized by a new lava lake, lava flows, lava fountaining, and gas-and-steam emissions. This report covers the activity from December 2020 through January 2021 using information provided from the US Geological Survey's (USGS) Hawaiian Volcano Observatory (HVO) in the form of daily reports, volcanic activity notices, and abundant photo, map, and video data.
Monitoring through mid-December 2020. Monitoring data from HVO since the end of the previous eruption in September 2018 included variable rates of seismicity and ground deformation, low rates of sulfur dioxide emissions, and minor morphological changes. Areas of elevated ground temperatures and minor gas emissions persisted in the vicinity of the 2018 LERZ fissures. Since March 2019, GPS stations and tiltmeters at the summit had detected deformation consistent with slow magma accumulation approximately 1-2 km below ground level. In addition, GPS stations in the upper ERZ recorded increased rates of uplift beginning in September. The HVO seismic network recorded 1,450 earthquakes in September, a significant increase over previous months, followed by another increase to 2,100 events in October. The pond at the bottom of the Halema’uma’u crater, which appeared on 25 July 2019, continued to collect water over time, slowly expanding and deepening from 23 m in early January 2020 to 48 m by 3 November 2020 (figure 467).
 |
Figure 467. Photos comparing the growth of the water lake in the Halema’uma’u crater at Kīlauea on 18 December 2019 (left) and 23 September 2020 (right). During this time, the lake had risen approximately 25 m and had a surface area of 0.033 km2, compared to December 2019 (0.011 km2). Photos taken from the E rim of Halema’uma’u by K. Mulliken and M. Patrick; courtesy of USGS HVO. |
The number of earthquakes detected in November was 1,350, less than what was recorded in October. By late November seismic stations recorded an average of at least 480 shallow, small-magnitude, earthquakes per week underneath the summit and upper ERZ; during 29-30 November HVO recorded over 80 earthquakes beneath the summit, beginning at 2300 on 29 November and continuing for 11 hours. On 2 December, spikes in seismicity were reported, consistent with a small dike intrusion under the S part of the caldera; tiltmeters at the summit detected about 8 cm of caldera floor uplift. At 1745 earthquakes intensified and another spike occurred after 0000 to an average rate of 10-12 earthquakes per hour. Within 24 hours, up to 220 earthquakes were recorded, occurring in clusters under the caldera and upper ERZ, according to HVO. By the afternoon of 3 December, seismicity and ground deformation rates at the summit had decreased and returned to near background levels. On 17 December, the number and duration of long-period seismic signals increased.
Eruptive activity during 20-21 December 2020. On the evening of 20 December at 2030 an earthquake swarm was recorded, accompanied by ground deformation detected by tiltmeters. Shortly after 2130 HVO reported an orange glow within the Halema’uma’u crater at Kīlauea’s summit caldera, observed on an infrared monitoring camera, as well as a vigorous gas-and-steam plume, which marked the beginning of the eruption. At 2236 an M 4.4 earthquake was detected below the S flank. The Volcano Alert Level (VAL) was raised to Warning and the Aviation Color Code was raised to Red.
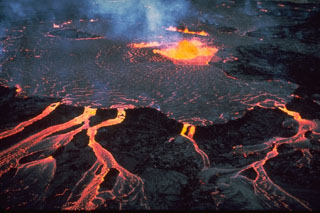
An HVO Volcanic Activity Notice issued on 21 December at 1014 stated that the water lake in the summit crater had boiled away due to new effusive activity, producing a large gas-and-steam emission (figure 468). Three vents in the N, NW, and W walls of the Halema’uma’u crater generated lava flows that fed a growing lava lake at the base of the crater (figure 469). Minor lava fountaining at these vents rose 25 m high; the highest fountain reached 50 m high in the N fissure. The lava lake began rising several meters per hour since the start of the eruption and exhibited a circulating perimeter, but a stagnant center (figure 470). Occasional blasts originated from the ponded lava in the crater. The eruption was confined to the Halema’uma’u crater. On 21 December the VAL was lowered to Warning and the Aviation Color Code decreased to Orange. Sulfur dioxide emission rates remained high at around 30,000 tons/day. In comparison, the emission rates from the pre-2018 lava lake ranged between 3,000-6,500 tons/day.
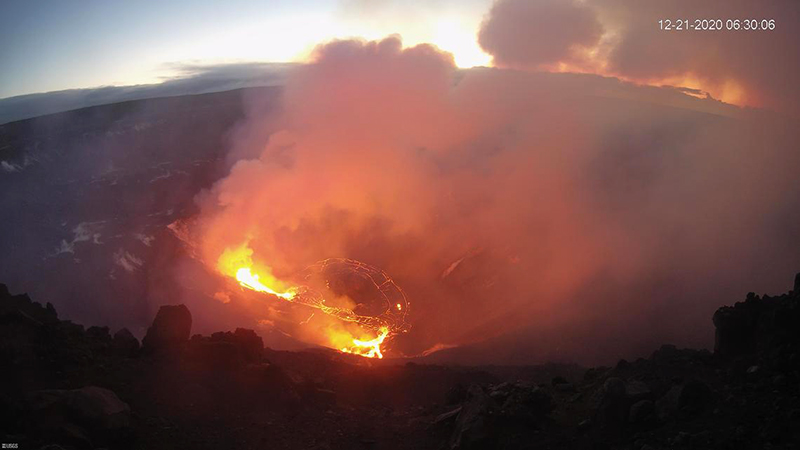 |
Figure 468. Webcam image of the summit of Kīlauea at 0630 on 21 December 2020. The water lake had been replaced by a lava lake as fissure vents in the wall of Halema’uma’u effused lava into the crater. Strong gas-and-steam emissions were visible. Courtesy of HVO. |
 |
Figure 469. Map of the Halema’uma’u crater at Kīlauea showing the location of volcanic activity shortly after 2130 on 20 December 2020. The red spots are the approximate locations of the three initial fissure vents effusing lava into the bottom of the Halema’uma’u crater. The water lake at the base of the crater had been replaced with a growing lava lake. The lava is deeper by at least 10 m compared to the water lake in this base map. The base map is from imagery collected on 23 September 2020. The eastern-most vent was characterized by lava fountains up to 50 m high with minor fountaining on the W side. Courtesy of HVO. |
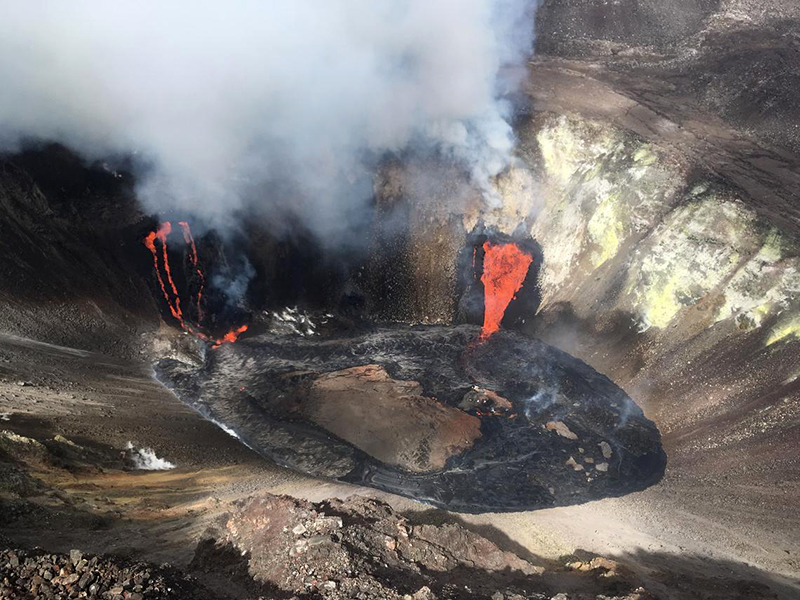 |
Figure 470. Aerial view of the summit of Kīlauea during an overflight at 1120 on 21 December 2020 showing two active fissure vents that effused lava into the growing lava lake in the Halema’uma’u crater. The N fissure (right-most) is the dominant stream of lava. The fresh cooling lava appears black, surrounding the center of the lake, which was described as stagnant. Courtesy of HVO. |
Activity during 22-25 December 2020. The effusive eruption continued on 22 December from at least two vents on the N and W sides of Halema’uma’u; the third vent between the N and W vents paused between 0730 and 0800. The middle and W vents became inundated by the growing lava lake, while the northern-most vent remained vigorous. As of 1151 the crater lake had grown to 487 m below the crater rim, which suggests that the lake had filled 134 m from the crater floor; the rate at which the lake rose was more than 1 m per hour. Measurements made on 22 December showed that approximately 10-12 million cubic meters of lava had been erupted to that point, with a surface area of about 0.13-0.22km2 (figure 471). Another measurement made during the afternoon showed that the volume of the lava lake grew an additional two million cubic meters. The dimensions of the lake were 690 m E-W and 410 m N-S. Overflights were made on 21 and 22 December to obtain natural color and thermal infrared images of the growing lava lake (figure 472).
 |
Figure 471. Location map showing the activity from the new eruption at the summit of Kīlauea in the Halema’uma’u crater updated on 22 December 2020 at 1400. Two active fissure vents (orange dots) on the N and W side of the crater fed lava into the growing lava lake (red). The blue dashed line represents the extent of the former water lake (July 2019 to December 2020) that was present in the crater before the eruption and the black dashed line represents the extent of the lava lake that was present during 2008-2018. The current lava lake is larger than both the previous lakes and has formed slightly more N compared to the former lava lake. Map created by M. Zoeller; courtesy of USGS HVO. |
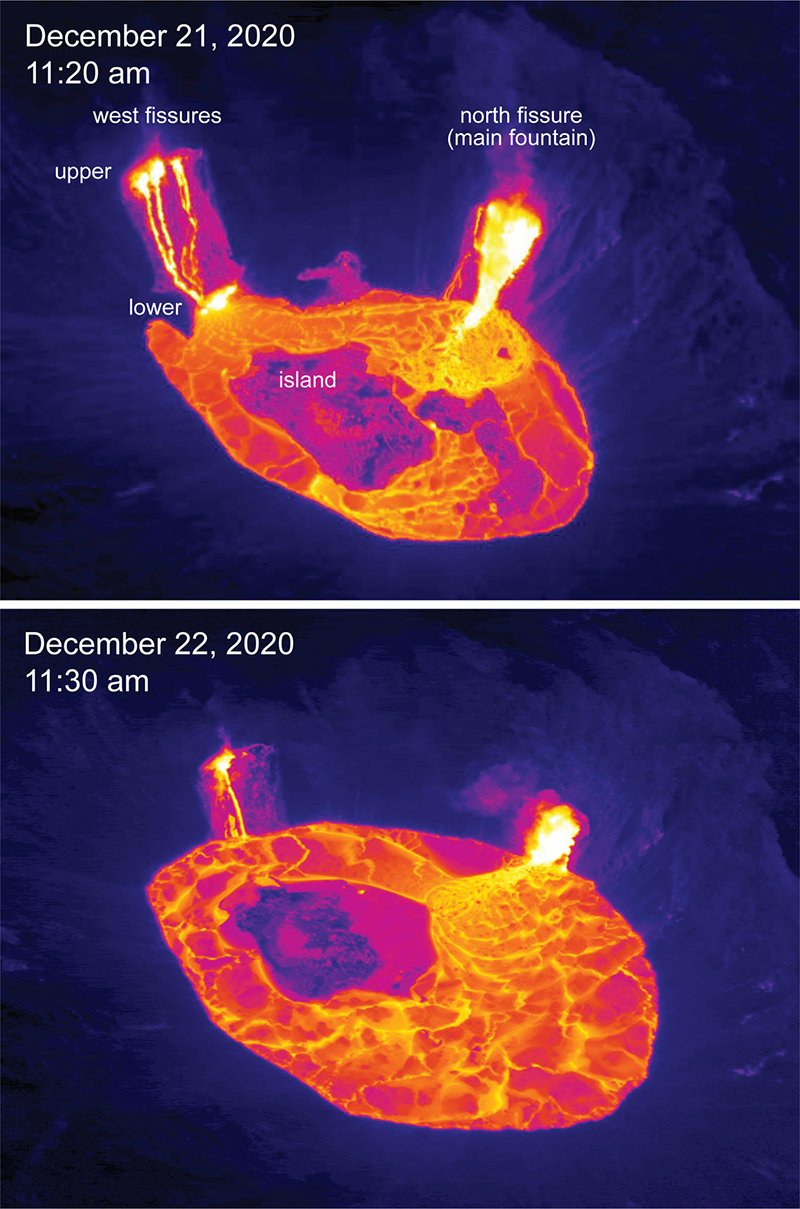 |
Figure 472. Comparison of thermal images taken on 21 December at 1120 (top) and 22 December 2020 at 1130 (bottom) showing the rise and infilling of the lava lake from wall vents in the Halema’uma’u crater at Kīlauea’s summit. Images by M. Patrick; courtesy of HVO. |
By 23 December the lava lake had deepened to 155 m (figure 473). Two fissure vents on the N and W walls remained active; the W vent fed two narrow channels into the lake and the N vent remained the most vigorous. An island of cooler, solidified, lava within the lava lake that measured 115 x 260 m was drifting slowly eastward, based on a thermal map. During an overflight made later in the day, the approximate surface area was 0.25 km2, with dimensions of 460 x 715 m. High SO2 emissions were an estimated 30,000-40,000 tons/day, based on measurements made on 21 and 23 December.
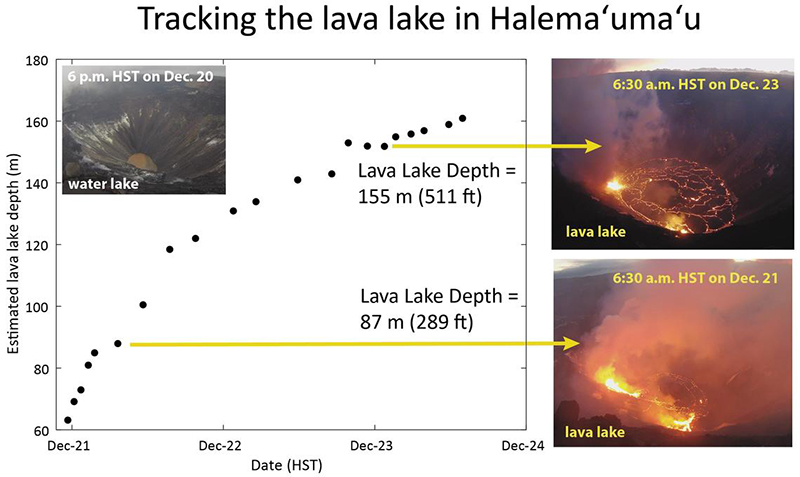 |
Figure 473. Plot showing the increasing depth in Kīlauea’s summit lava lake since the beginning of the eruption on 20 December 2020 at 2130. A laser rangefinder was used to take measurements of the lava lake surface about 2-3 times per day. The depth of the lake was about 155 m on 23 December at 0630 (top right) compared to 87 m on 21 December at 0630 (bottom right). In comparison, the water lake that was observed in Halema’uma’u before the start of the eruption was 51 m at its deepest. Plot by H. Dietterich; courtesy of HVO. |
Measurements taken on 24 and 25 December showed a continuously growing lava lake that was 169 and 176 m deep, respectively, and the volume of the lake had reached 21 million cubic meters. By 25 December the vigorously erupting N fissure vent was starting to become inundated and the W vent displayed intermittent spattering (figure 474). Around 1400 the lake level had dropped by 2 m to reveal a narrow black ledge around the N edge of the crater. The rate of SO2 emissions decreased to 16,000-20,000 tons/day during 25 December.
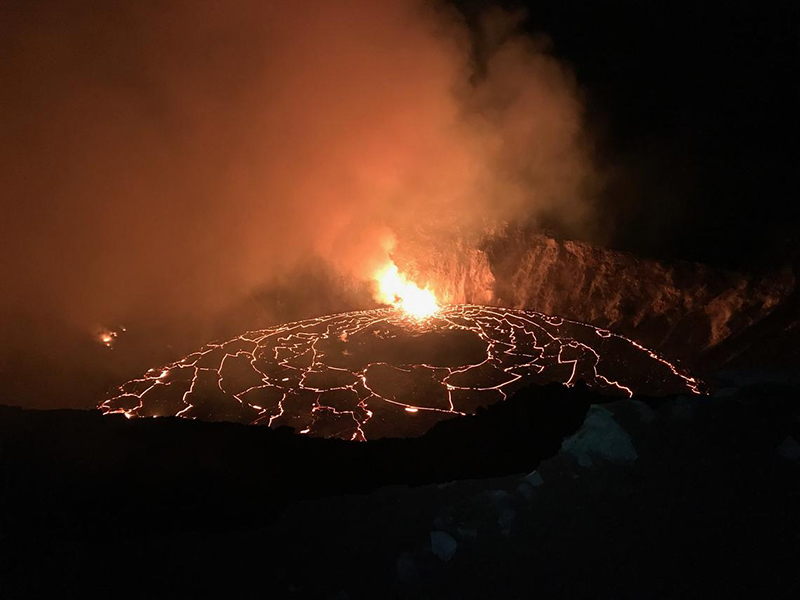 |
Figure 474. Photo of the Halema’uma’u crater at the summit of Kīlauea at 0230 on 25 December 2020 showing lava flows and lava fountaining feeding the lake. The main N vent started to become inundated by the growing lava lake. Intermittent activity continued at the W vent. Photo taken from the S rim of the crater by J. Schmith and C. Parcheta; courtesy of HVO. |
Activity during 26-31 December 2020. During the morning of 26 December, at 0240, the N vent continued to erupt lava into the lake while the W vent began to effuse more vigorously with up to three narrow lava flows feeding the lake (figure 475). The depth and volume of the lake remained the same as on 25 December: 176 m deep and 21 million cubic meters. Lava fountaining was visible up to 10 m high above the W vent. After 0300, the N vent declined in activity and started to drain lava from the lake. Summit tiltmeters continued to record some deformation. Effusive activity remained confined to Halema’uma’u; the lava lake was 177 m deep as of 0700 m on 27 December. The SO2 emissions continued to decrease to about 3,300-5,500 tons/day during 27-28 December. Summit tiltmeters continued to record weak inflation.
 |
Figure 475. Photo of the W vent in Halema’uma’u at Kīlauea’s summit shows the effusive activity increased on 26 December 2020. Some lava fountaining in this vent was visible while lava flows continued to feed the lake from the N vent. The lava fountaining in the W vent rose at least 10 m high. Photo was taken at 0515 by H. Dietterich; courtesy of HVO. |
On 28 December the volume of the lava lake had grown to 21.5 million cubic meters and a thermal map updated on 26 December showed the new dimensions of the lava lake were 520 x 790 m, covering a surface area of 0.29 km2. The narrow black ledge visible above the N edge of the crater was about 1-2 m above the lake surface. During 27-28 December the main central island of cooler, solidified, lava drifted slowly W and measured about 110 x 225 m. The island surface was about 6 m above the lake surface and was covered in tephra, possibly remnants of explosive activity generated when lava first reached the water lake. Reduced, but still elevated, SO2 emissions were 3,300 tons/day; the emission plume carried Pele’s Hair and Pele’s Tears SW, depositing the tephra in areas downwind.
Effusive activity continued, with the lava lake measuring 179-180 m deep with a narrow black ledge around it as of 0400 on 29 December. Multiple narrow lava channels from the W vent fed into the crater. The lava lake volume was slightly more than 22 million cubic meters. The central 135 x 250 m island of solidified lava had drifted slowly W until 2200 on 28 December, then during the morning of 29 December it stalled and began rotating. There were about 10 smaller islands to the E.
On the morning of 30 December, at 0345, the lava lake was 181 m deep with the narrow black ledge around it; the lava lake was an estimated volume of 23 million cubic meters. A spatter cone built around the W vent, while lava effused through crusted-over channels. The main central island was about 6-8 m above the surface of the lake. The rate of SO2 emissions were 3,800 tons/day.
Similar observations were made during 31 December; the lava lake continued to grow, with the depth of the lake measuring 181-186 m and dimensions of 530 x 800 m, based on thermal mapping. The total surface area was 0.33 km2. Spattering continued in the W vent while lava flowed through crusted-over channels into the lake (figure 476). The main island in the lake continued to drift slowly W while roughly 10 smaller islands were observed around the E end of the crater (figure 477). The SO2 emission rate increased to 4,500-6,300 tons/day, compared to the previous day.
 |
Figure 476. Photo of the active W vent in Halema’uma’u at the summit of Kīlauea, viewed from the W crater rim on 31 December 2020 with incandescence, spattering, and a prominent spatter cone; the lava lake is visible in the right background. Photo by B. Carr; courtesy of HVO. |
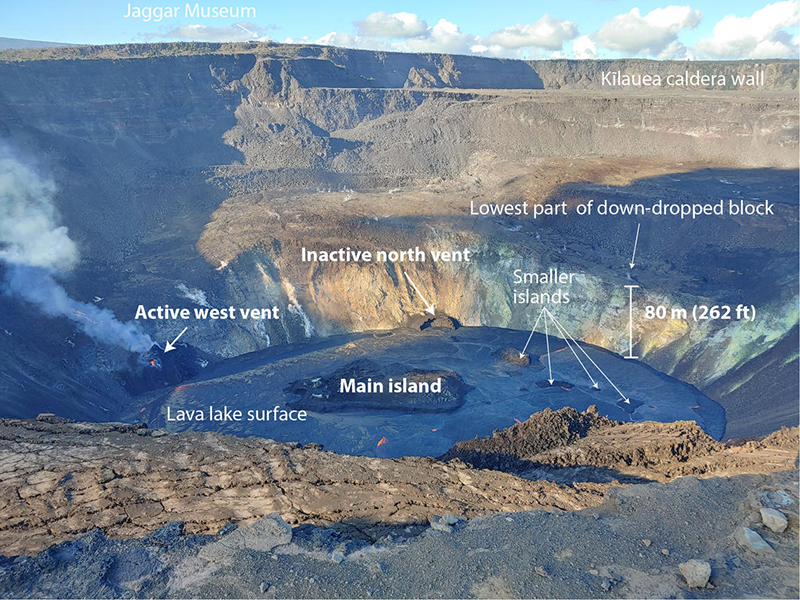 |
Figure 477. Annotated photo taken from the S rim of Halema’uma’u at the summit of Kīlauea at 1700 on 30 December 2020 showing the location of the main central island and the smaller islands located on the eastern part of the crater. The W vent continued to effuse lava, as well as some spattering, while the N vent was inactive. Photo by K. Lynn; courtesy of HVO. |
Activity during January 2021. Effusive activity continued within Halema’uma’u during January 2021. Lava originated from the NW side of the crater, with the W vents exhibiting spattering and lava effusions through crusted-over channels into the lava lake. A levee had also begun to develop around the perimeter of the lake (figure 478), creating what is known as a “perched” lake. According to HVO, this is common in lava lakes at Kīlauea, and is due to repeated small overflows and the rafting and piling of surface crust that fuses together to form a barrier. During 31 December and 1 January the main island of solidified lava (135 x 250 m) had moved W while the other 10 smaller islands remained near the E side of the lake. Summit tiltmeters recorded weak deflation during 1-2 January. Both SO2 emission rates and seismicity remained elevated; the SO2 emission rate was 4,400 tons/day on 1 January.
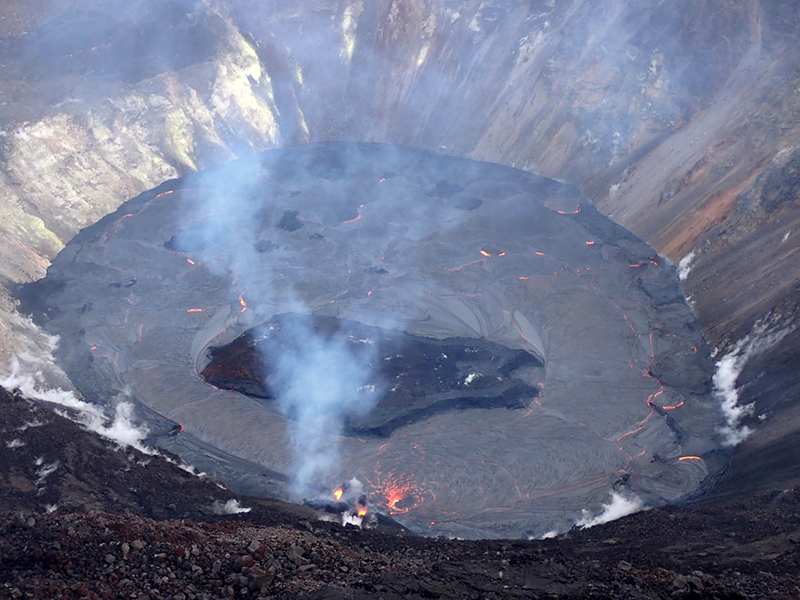 |
Figure 478. Photo of the lava lake in Halema’uma’u at Kīlauea on 1 January 2021 that has developed a levee (darker black) around the perimeter, allowing the lake to be slightly perched above its base. Photo by M. Patrick; courtesy of HVO. |
During 2-3 January the depth of the lake had grown to 189-190 m, had a volume of 26 million cubic meters, and still maintained the narrow black ledge around its perimeter. Measurements on 3 January showed that the lake was perched about a meter above its E and W edges, and discontinuously on the N edge. A thermal webcam showed spatter originating from two places in the W vents and a small dome fountain above the lake crust in front of the W vents (figure 479). The dome fountain had formed where lava was entering the lake from a submerged inlet at the base of the W vent. The height of the dome fountain reached 5 m and the width was an estimated 10 m. The main island, about 6 m above the lake surface, continued to drift W in front of the W vents while the 10 smaller islands remained relatively stationary near the E end of the lake.
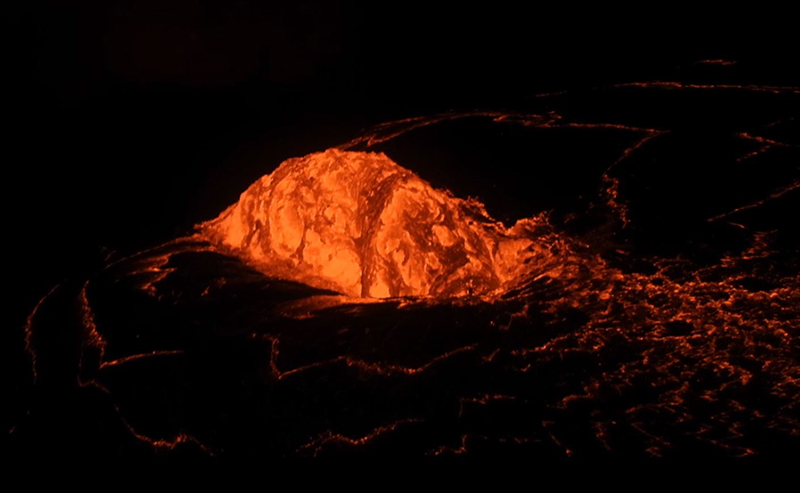 |
Figure 479. Video data showed the lava at Kīlauea’s summit crater formed a dome fountain at the inlet to the lava lake in Halema’uma’u during 2-3 January 2021. The fountain is located near the base of the W vents where the inlet had become partially submerged. The 5-m-high dome fountain was about 10 m wide. Video by H. Dietterich; courtesy of HVO. |
Lava effusion continued during 4-5 January from vents on the NW side of the crater. The lava lake was perched 1-2 m above its edge and had deepened to 191-192 m (figure 480). A thermal map from 5 January showed the perched lake dimensions had slightly decreased in size to 520 x 760 m, with a volume of about 27 million cubic meters. Summit tiltmeters continued to record weak deflation. Spatter in the W vents was visible from the top of a small cone on the NW wall of Halema’uma’u; the dome fountain persisted in front of the W vents (figure 481). The main island was rotating counterclockwise in front of the W vent while the now 11 smaller islands had generally stayed in the E side of the crater. Measurements on 4 January showed that the island was 7-8 m above the lake surface.
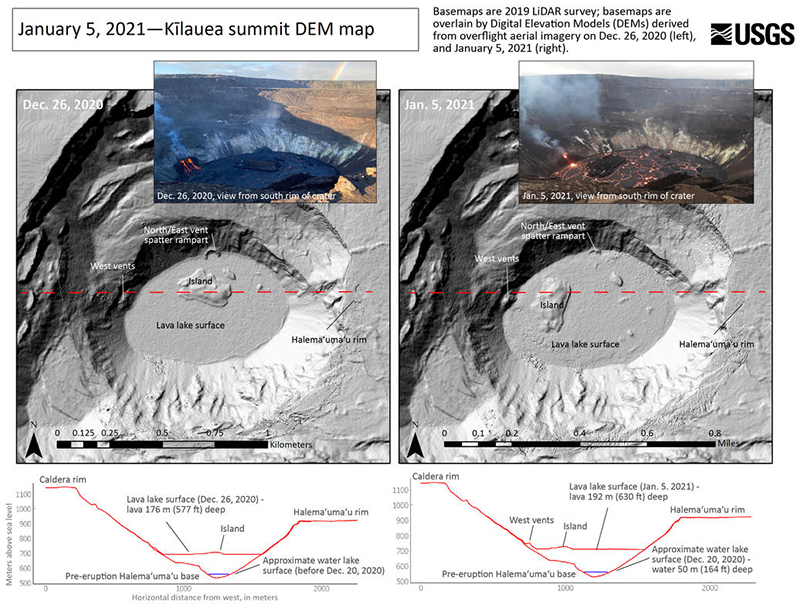 |
Figure 480. A comparison of the Digital Elevation Model (DEM) and topographic profiles of the Halema’uma’u crater at Kīlauea created from aerial imagery collected during helicopter overflights, showing the change in depth and elevation of the lava lake between 26 December 2020 (left) and 5 January 2021 (right). The N vent remained inactive as it became inundated by the rising lava. The central island had migrated W and rotated by 5 January. The depth of the lava lake was 192 m on 5 January. DEMs created by B. Carr, graphic created by K. Mulliken; courtesy of USGS HVO. |
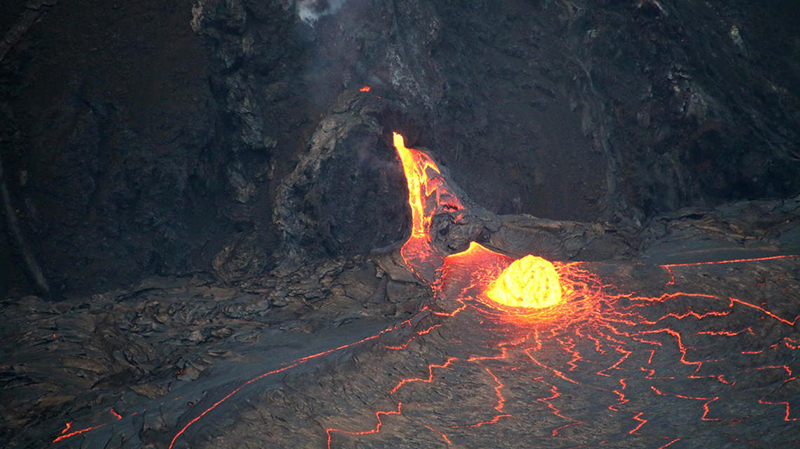 |
Figure 481. Photo of the Halema’uma’u crater at Kīlauea at 0545 on 5 January 2021 showing ongoing activity at the W vent, generating a lava flow that feeds both the lake and the dome fountain. Photo by K. Lynn; courtesy of USGS HVO. |
HVO continued to monitor the changes in the active lava lake on 6 January, which was 194 m deep and remained perched 1-2 m above its edge. At 1500 rapid deflationary tilt was recorded overnight into 7 January. Lava from the W vents continued to feed the dome fountain through crusted-over channels on the W side of the crater. During the morning of 7 January the dome fountain weakened giving way to spattering at the top of the vent and the formation of a second cone. A thermal map on 7 January showed that the lake size had decreased to 470 x 760 m, covering 0.28 km2; more of the E part appeared to be stagnant while solidified lava was being progressively pulled beneath the molten surface (figure 482). SO2 emissions were still elevated at 3,400 tons/day on 6 January, but had decreased to 2,700 tons/day the next day. During 7-8 January incandescence was visible from two small cones on the NW wall of Halema’uma’u while lava flowed into the lake through a crusted channel. The main island remained 135 x 250 m; it had moved slightly E while the 11 smaller islands remained stationary.
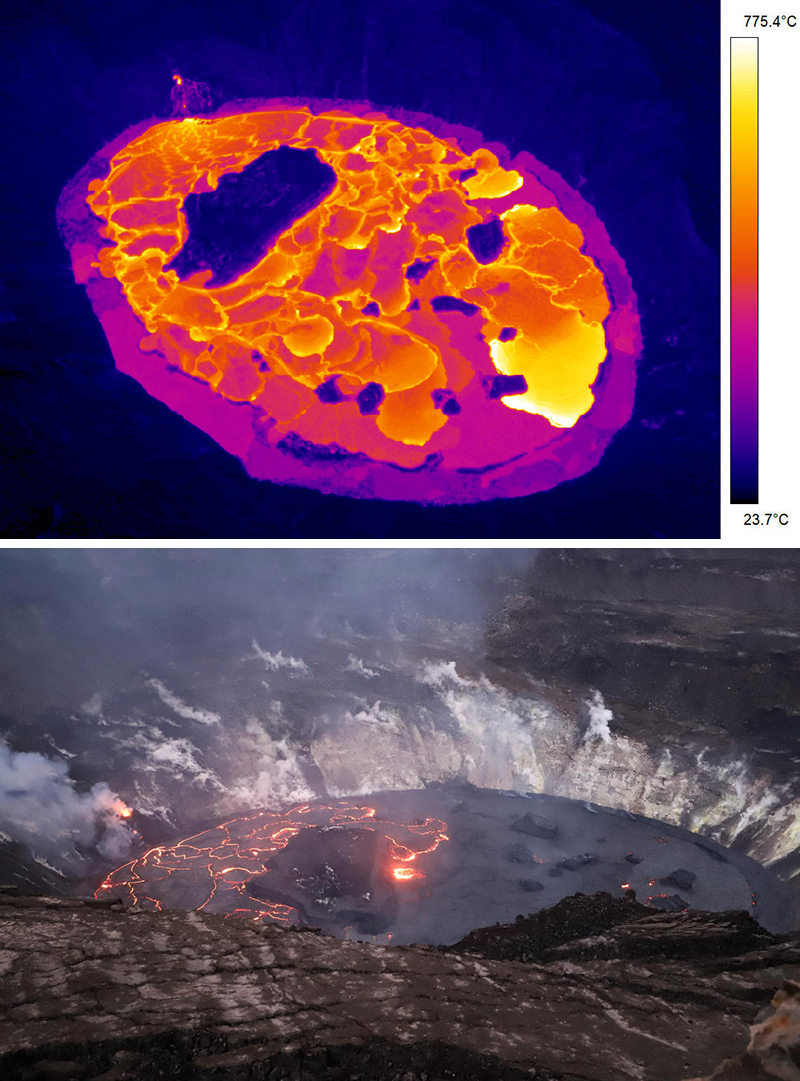 |
Figure 482. Thermal image (top) and photo (bottom) of the lava lake at Kīlauea showing the larger central island on the W side of the Halema’uma’u crater and 11 smaller islands on the E side of the crater, taken on 7 and 9 January 2021, respectively. The lake is slightly perched and surrounded by a lower ledge of cooler lava along the perimeter (appears pink-purple in the thermal image along the perimeter). The lava effusion at the W vent has become less intense and much of the E half of the lake has stagnated completely, likely because the lake level has not changed significantly in the last three days. Image by M. Patrick (top) and photo by H. Dietterich (bottom); courtesy of HVO. |
Incandescence and spatter continued on 9 January at the two W vents as lava descended through a crusted channel into the lake. Summit tiltmeters recorded weak deflation since 1 January, but on the evening of 9 January weak inflation was detected. A newly installed instrument during 9-10 January showed that the lake had risen about a meter since the switch to inflationary tilt. The depth of the lake slightly increased to 196 m below the W vents on the morning of 10 January. The W vents exhibited strong lava flows during the afternoon with spattering and spatter-fed lava flows from the top of the small cones on the NW wall of Halema’uma’u; lava also flowed through crusted-over channels into the lake. Low lava fountaining was also visible during 10-11 January. The SO2 emission rates were 2,300 tons/day and 2,500 tons/day on 10 and 11 January, respectively.
During the morning of 12 January the lava lake remained at a depth of 196 m below the W vents; the stagnant E half of the lake was about 4 m shallower and had subsided below its perched rims. Low lava fountaining and flows through channels from the top of the small cones were visible. Measurements of the main island on 12 January showed that it was 8 m above the surface, with the highest point at 23 m. By 13 January, the depth of the lake had increased to 198 m. On 13 January a small portion of the active cone had collapsed, causing a second vent to open adjacent to the main vent and effuse lava for less than 20 minutes.
Activity continued in Halema’uma’u with low fountaining, lava flows, and spattering from the W vent through 22 January (figure 483). The depth of the lake continued to increase slowly to 204 m on 22 January. The entire lake was perched 1-2 m above the crust between the levees along the perimeter and the crater wall. All of the islands of solidified lava within the lake were stagnant; the dimensions of the main island were unchanged since 10 January. On 14 January the SO2 emissions increased to 4,700 tons/day, then decreased to 2,500 tons/day on 16 January. On 19 January at 1746 field crews observed a minor collapse event from the spatter cone on its N rim and open channel margins at the W vent (figure 484). Summit tiltmeters began to detect some deflation on 20 January; the rate of which began to slow by 21 January. Measurements on 22 January showed that the S end of the main island was 12 m above the lava lake surface, with the highest point still around 23 m.
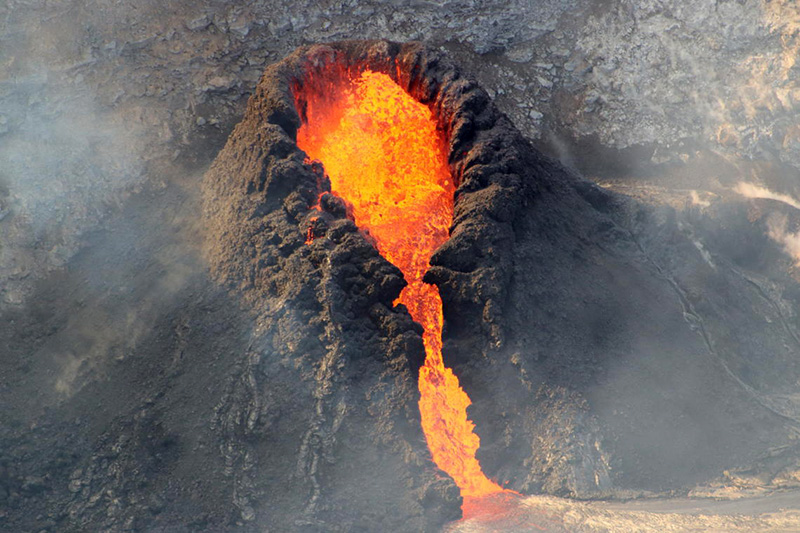 |
Figure 483. Photo of low fountaining and an accompanying lava flow at the W vent of Halema’uma’u at Kīlauea on 15 January 2021. The vent formed a spatter cone around the fountaining as the flow moved through an open channel into the lake. Photo by M. Patrick; courtesy of HVO. |
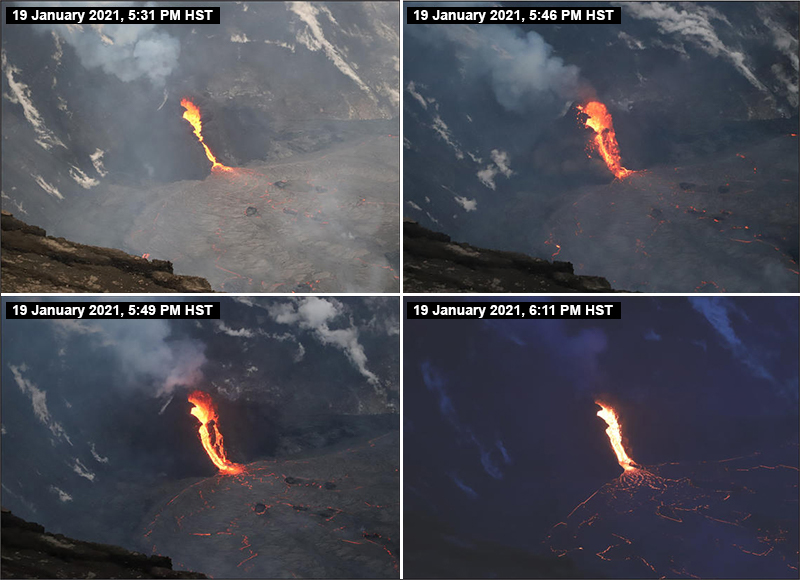 |
Figure 484. Series of photos showing the W vent at Kīlauea (seen from the S rim looking NW) that continued to feed the growing lava lake in Halema’uma’u through an open channel. At 1746 on 19 January field crews observed a minor collapse on the N rim of the spatter cone and channel margins. The photo at 1731 (top left) shows the vent just before the collapse; the photo at 1746 (top right) shows just after the collapse; the photos at 1749 (bottom left) and at 1811 (bottom right) show the destabilization and movement of the portion of the remaining cone flank surrounded by incandescence. Photos by H. Dietterich; courtesy of HVO. |
During the morning of 23-25 January the lava lake was about 205 m deep; the W half remained active with low fountaining and a lava flow while the E half was stagnant (figure 485). The E side of the lake was elevated about 1-2 m and the W half was elevated about 4 m above the solidified lava adjacent to the crater wall. HVO reported that summit tiltmeters continued to record variable inflation and deflation. On 23 January SO2 emission rates were 2,200 tons/day.
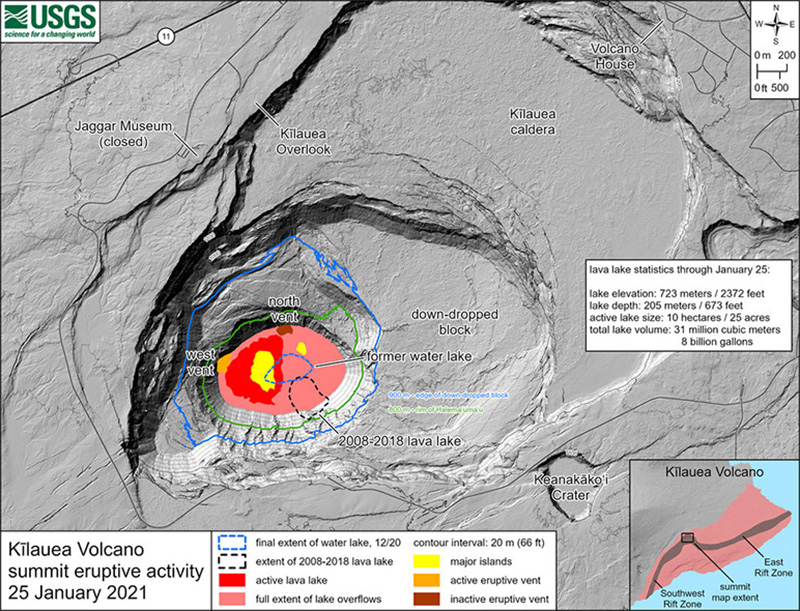 |
Figure 485. Map of the Halema’uma’u crater at the summit of Kīlauea on 25 January 2021 showing the locations of the active lava lake (red), the extent of the lava lake (light red), the major islands of solidified lava (yellow), the active W vent (orange), and the inactive N vent (maroon). The depth of the lake is 205 m, the size of the lake is 0.1 km2, and the total lake volume is 31 million cubic meters. In comparison, the dashed blue line represents the final extent of the water lake that evaporated on 20 December 2020 and the dashed black line represents the extent of the 2008-2018 lava lake. Courtesy of USGS HVO. |
The depth of the lava lake continued to deepen, and by the evening of 27 January it was 209 m, while the stagnant E half remained up to 5 m lower. The active lake surface no longer extended around the E side of the central island; surface circulation was limited to the W, N, and S sides of the island. Activity in the W vents consisted of slow surface movements at the base of the lava flow and overturning of the crust near its margins. The E side of the lake was elevated approximately 1 m while the W was 3 m above the solidified lava adjacent to the crater wall. All the islands within the lake were stationary. By 28 January only the W part of the lava lake was active. On 29 January, measurements made on the main island showed its edges were 7-8 m above the lake surface.
On the morning of 30 and 31 January, the active W part of the lava lake was 211 and 212 m deep, respectively; the W vent had crusted over except for a single (possibly two) openings that were mostly obscured by degassing, though several incandescent areas on the cone were visible. Surface lava continued to effuse into the central part of Halema’uma’u from the base of the cone (figure 486). A series of surface cracks separated the active and stagnant parts of the lake. During 30-31 January tiltmeters recorded inflation at the summit.
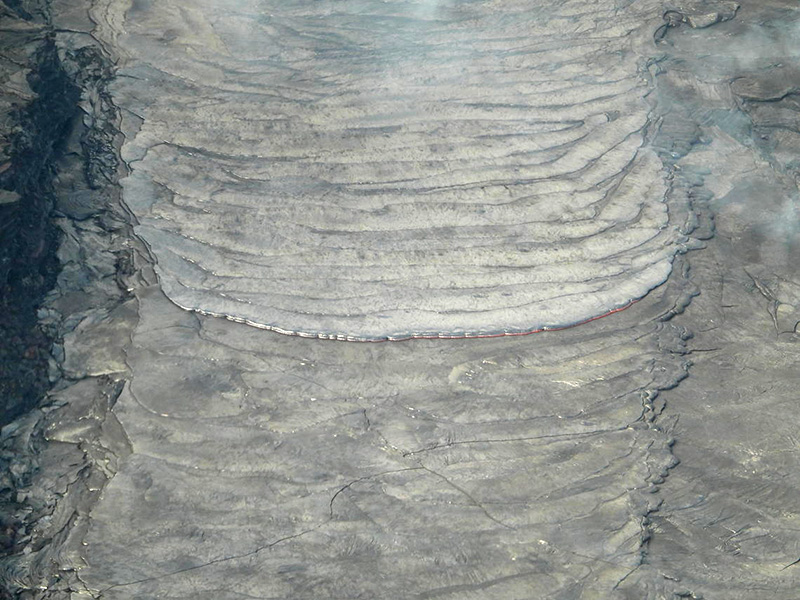 |
Figure 486. Photo showing the leading edge of an active lava lobe moving S into the central part of Halema’uma’u at Kīlauea on 31 January 2021. Photo by M. Patrick; courtesy of HVO. |
Geological Summary. Kilauea overlaps the E flank of the massive Mauna Loa shield volcano in the island of Hawaii. Eruptions are prominent in Polynesian legends; written documentation since 1820 records frequent summit and flank lava flow eruptions interspersed with periods of long-term lava lake activity at Halemaumau crater in the summit caldera until 1924. The 3 x 5 km caldera was formed in several stages about 1,500 years ago and during the 18th century; eruptions have also originated from the lengthy East and Southwest rift zones, which extend to the ocean in both directions. About 90% of the surface of the basaltic shield volcano is formed of lava flows less than about 1,100 years old; 70% of the surface is younger than 600 years. The long-term eruption from the East rift zone between 1983 and 2018 produced lava flows covering more than 100 km2, destroyed hundreds of houses, and added new coastline.
Information Contacts: Hawaiian Volcano Observatory (HVO), U.S. Geological Survey, PO Box 51, Hawai'i National Park, HI 96718, USA (URL: http://hvo.wr.usgs.gov/).