Report on Yasur (Vanuatu) — April 2021
Bulletin of the Global Volcanism Network, vol. 46, no. 4 (April 2021)
Managing Editor: Edward Venzke.
Edited by Kadie L. Bennis.
Yasur (Vanuatu) Gas-and-ash emissions, SO2 plumes, and thermal anomalies during September 2020-February 2021
Please cite this report as:
Global Volcanism Program, 2021. Report on Yasur (Vanuatu) (Bennis, K.L., and Venzke, E., eds.). Bulletin of the Global Volcanism Network, 46:4. Smithsonian Institution. https://doi.org/10.5479/si.GVP.BGVN202104-257100
Yasur
Vanuatu
19.532°S, 169.447°E; summit elev. 361 m
All times are local (unless otherwise noted)
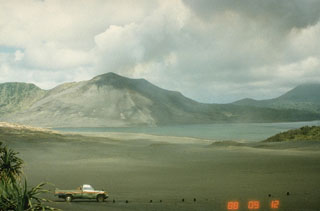
Yasur, located at the SE tip of Tanna Island, contains a 400-m-wide summit crater within the small Yenkahe caldera. Its current eruption has been ongoing since at least 1774 and has consisted of Strombolian and Vulcanian activity. More recently, Strombolian activity and gas-and-ash explosions have been reported (BGVN 45:03 and 45:09). This report covers activity from September 2020 through February 2021 that is characterized by ongoing explosions, gas-and-ash emissions, SO2 plumes, and thermal anomalies. Information primarily comes from monthly bulletins of the Vanuatu Meteorology and Geo-Hazards Department (VMGD) and various satellite data.
VMGD reported that ongoing explosions and gas-and-ash emissions continued at an elevated level throughout this reporting period, based on ground observations and seismic data. On clear weather days these emissions were captured by Sentinel-2 satellite imagery (figure 75). Some of the more intense explosions may result in larger ejecta falling in or around the summit crater. On 18 January 2021 a webcam image captured a gas-and-ash emission rising above the crater rim at 1500 (figure 76).
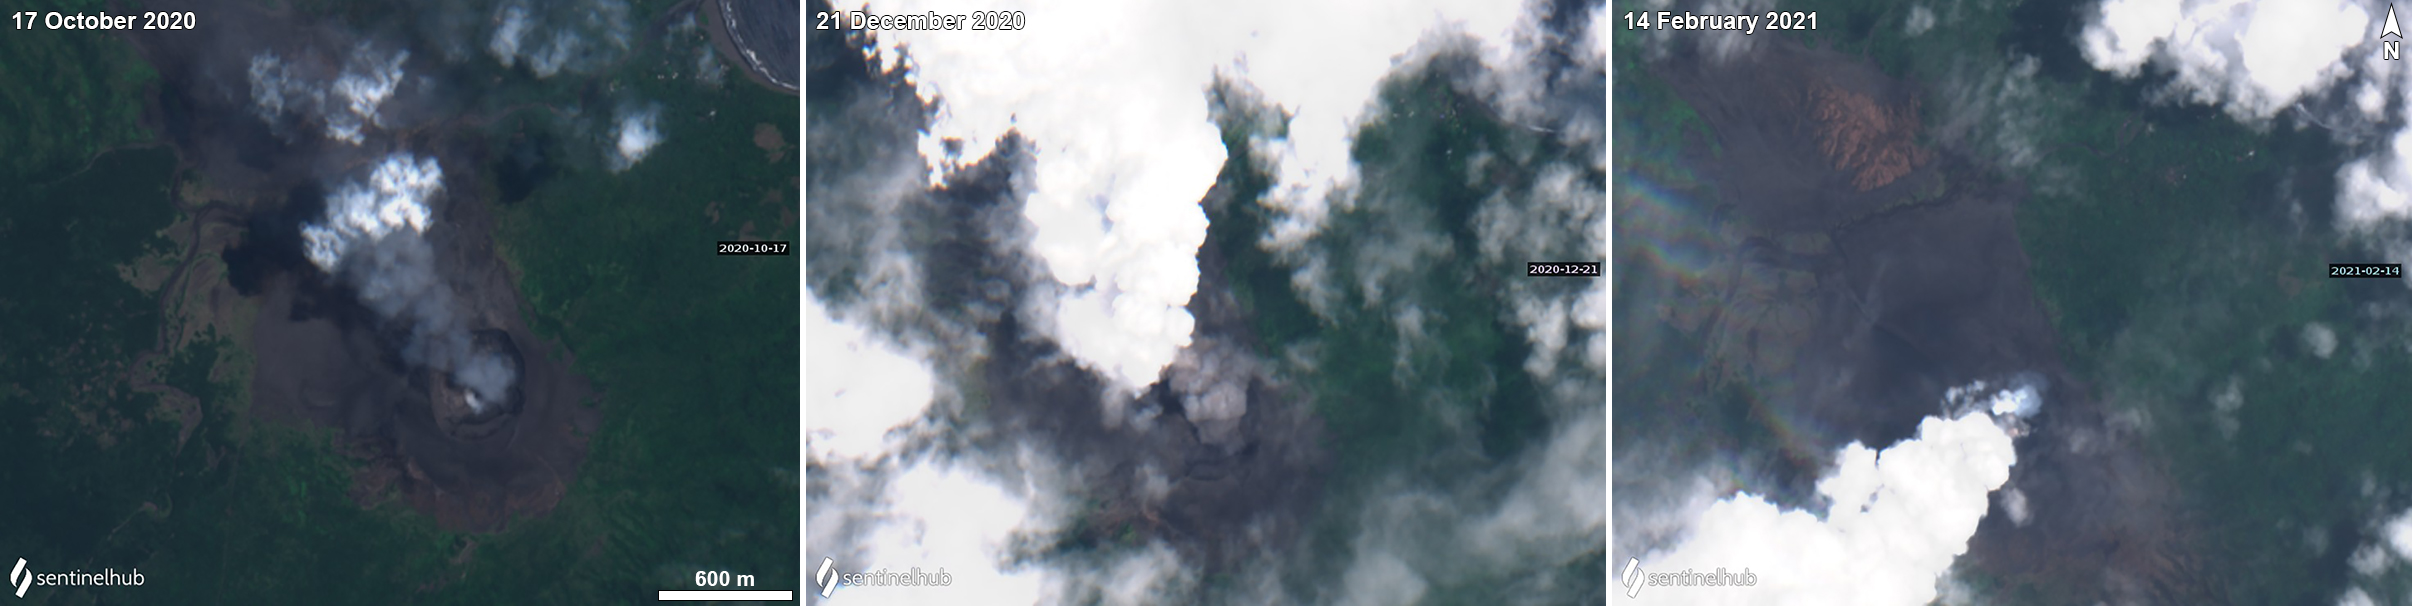 |
Figure 75. Sentinel-2 satellite images showing gas-and-ash emissions rising from the summit crater of Yasur on clear weather days. Ash is visible during 17 October (left) and 21 December 2020 (middle), while white gas-and-steam emissions are observed on 14 February 2021 (right). Sentinel-2 satellite images with “Natural Color” (bands 4, 3, 2) rendering. Courtesy of Sentinel Hub Playground. |
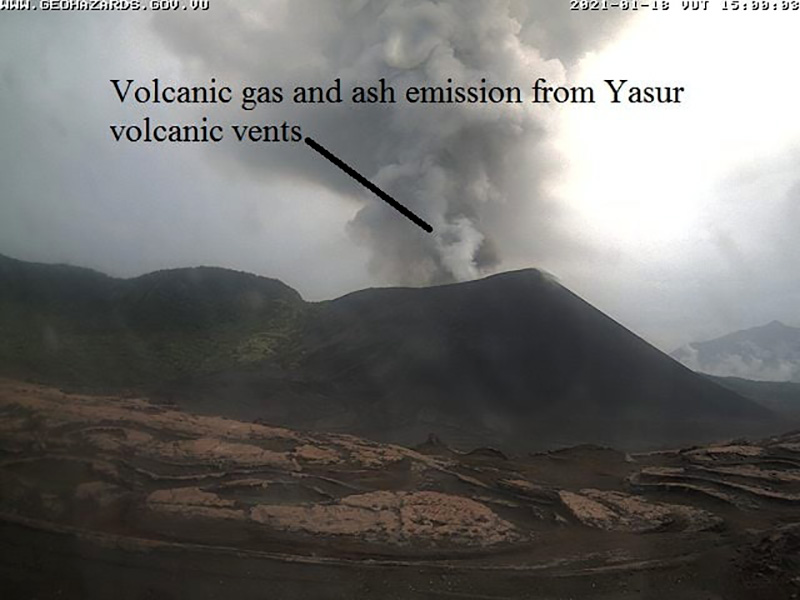 |
Figure 76. Webcam photo of a gas-and-ash emission rising from Yasur on 18 January 2021 taken at 1500. Courtesy of VMGD. |
Sulfur dioxide emissions were measured using the Sentinel-5P/TROPOMI satellite instrument for multiple days each month from September through February 2021 (figure 77). The density and drift direction of these SO2 plumes varied. During 17-19 January relatively dense SO2 plumes were detected consecutively, and drifted SE (figure 78).
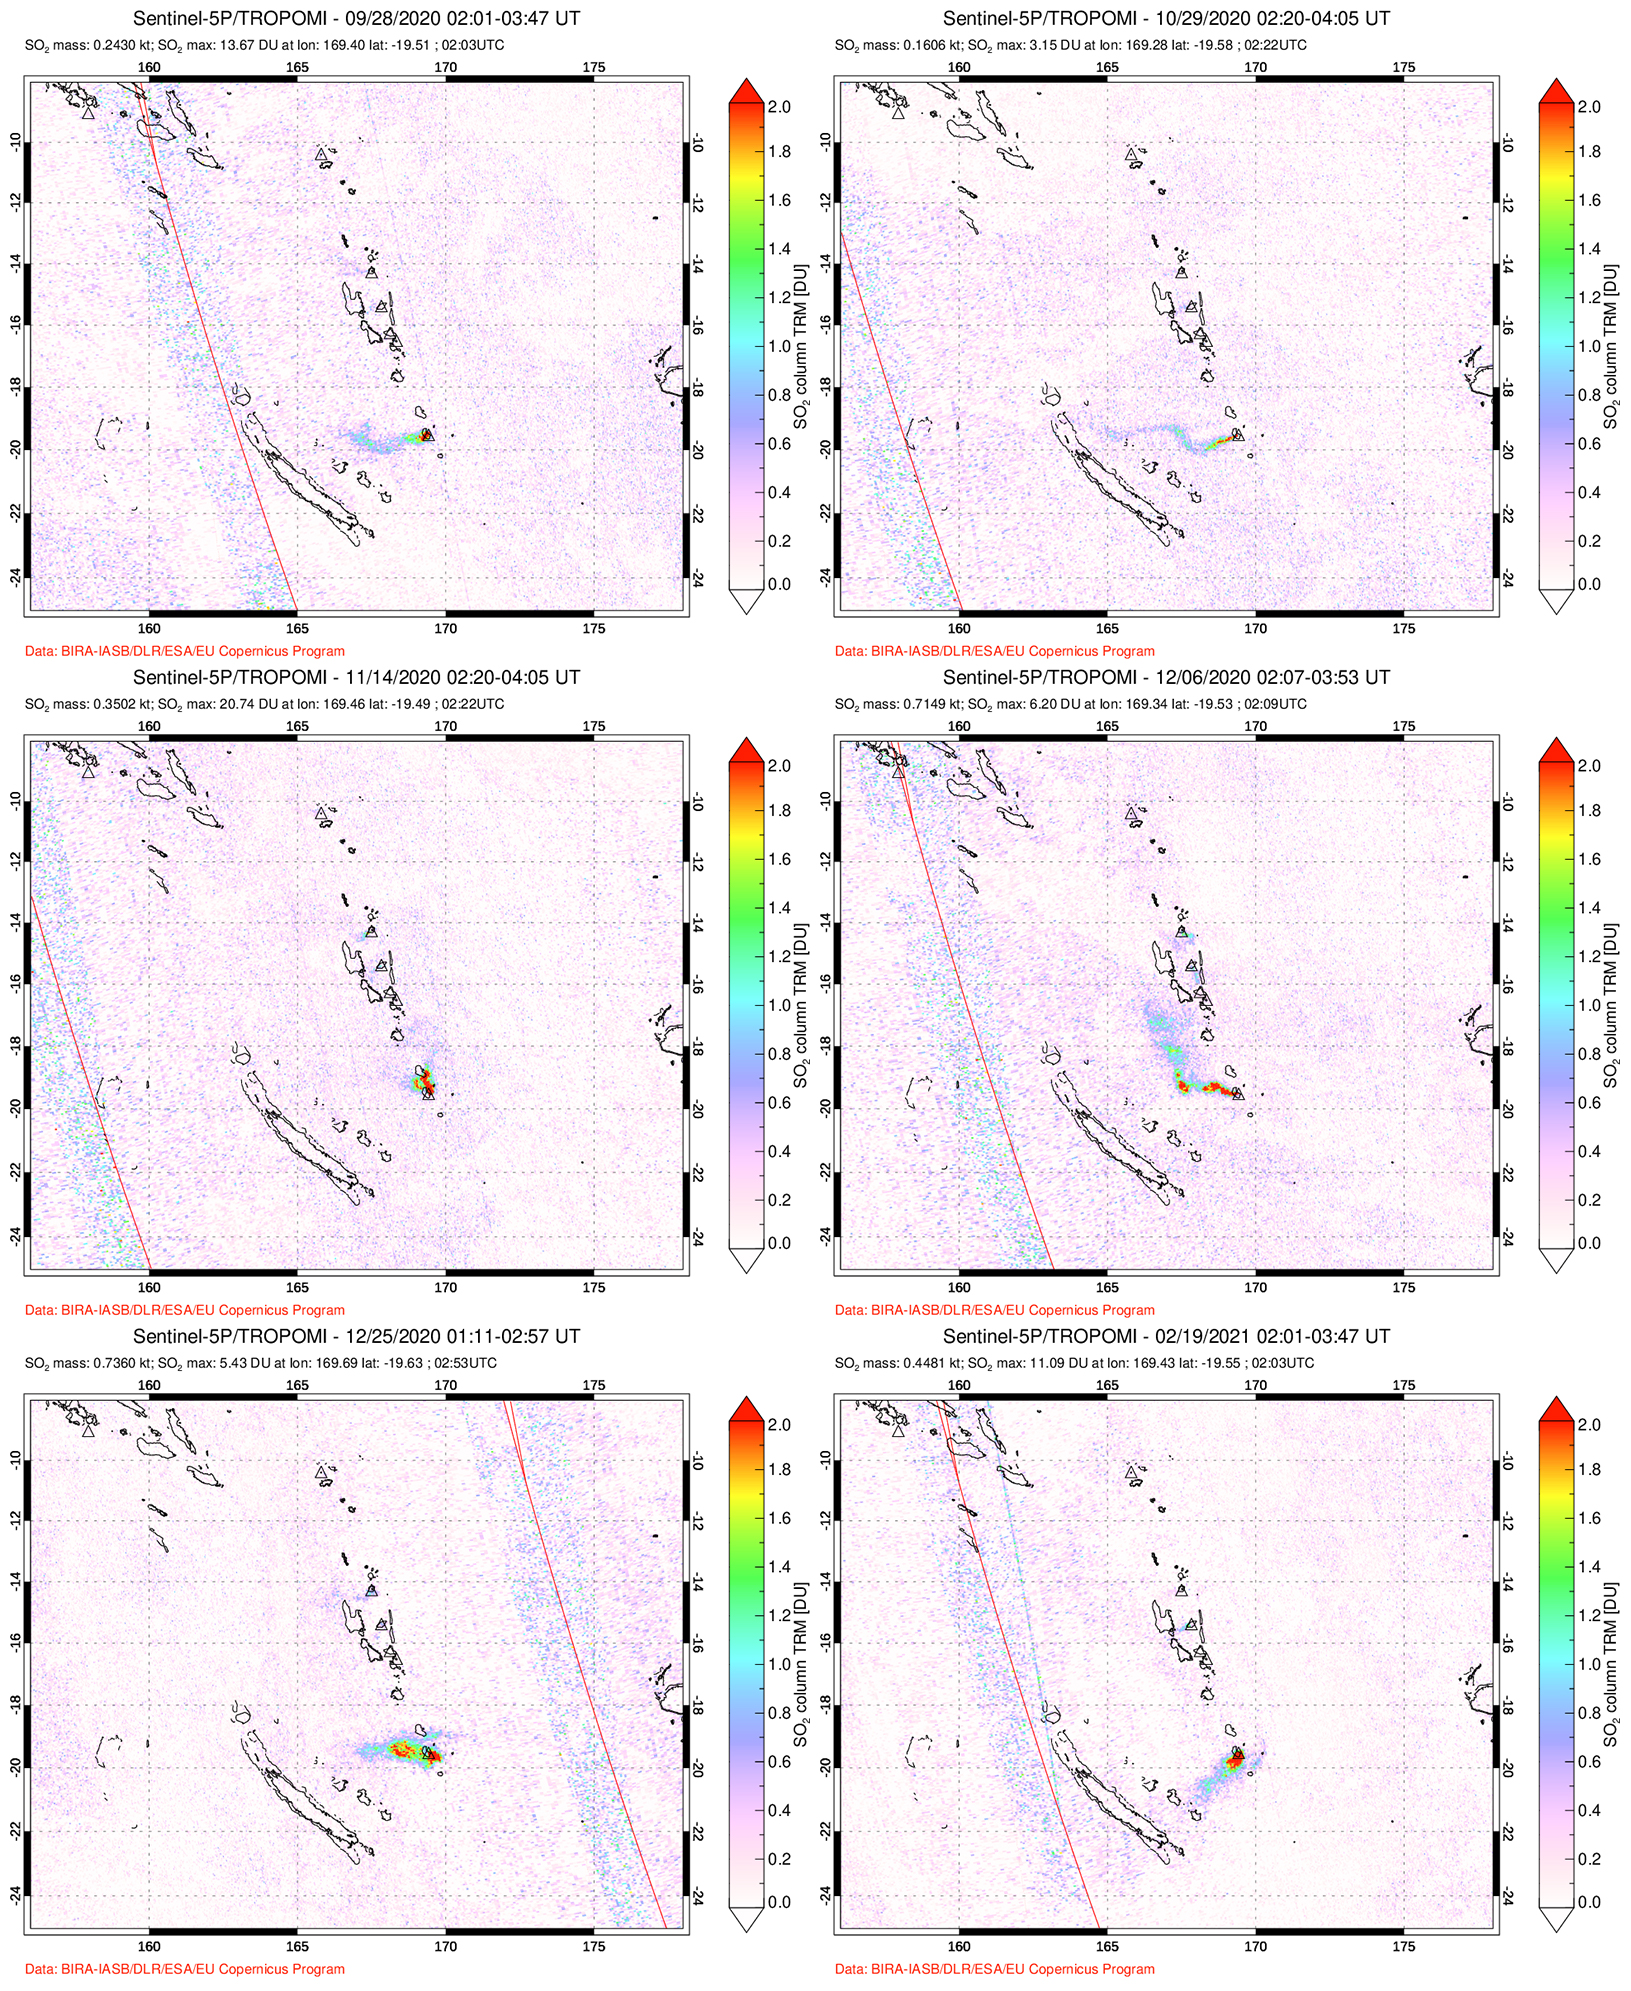 |
Figure 77. Occasional SO2 plumes of varying densities were observed from Yasur during each month of September 2020 through February 2021. Plumes drifted generally W on 28 September (top left), 29 October (top right), 6 December (middle right), 25 December 2020 (bottom left), slightly N on 14 November (middle left), and SW on 19 February 2021 (bottom right). Courtesy of NASA Global Sulfur Dioxide Monitoring Page. |
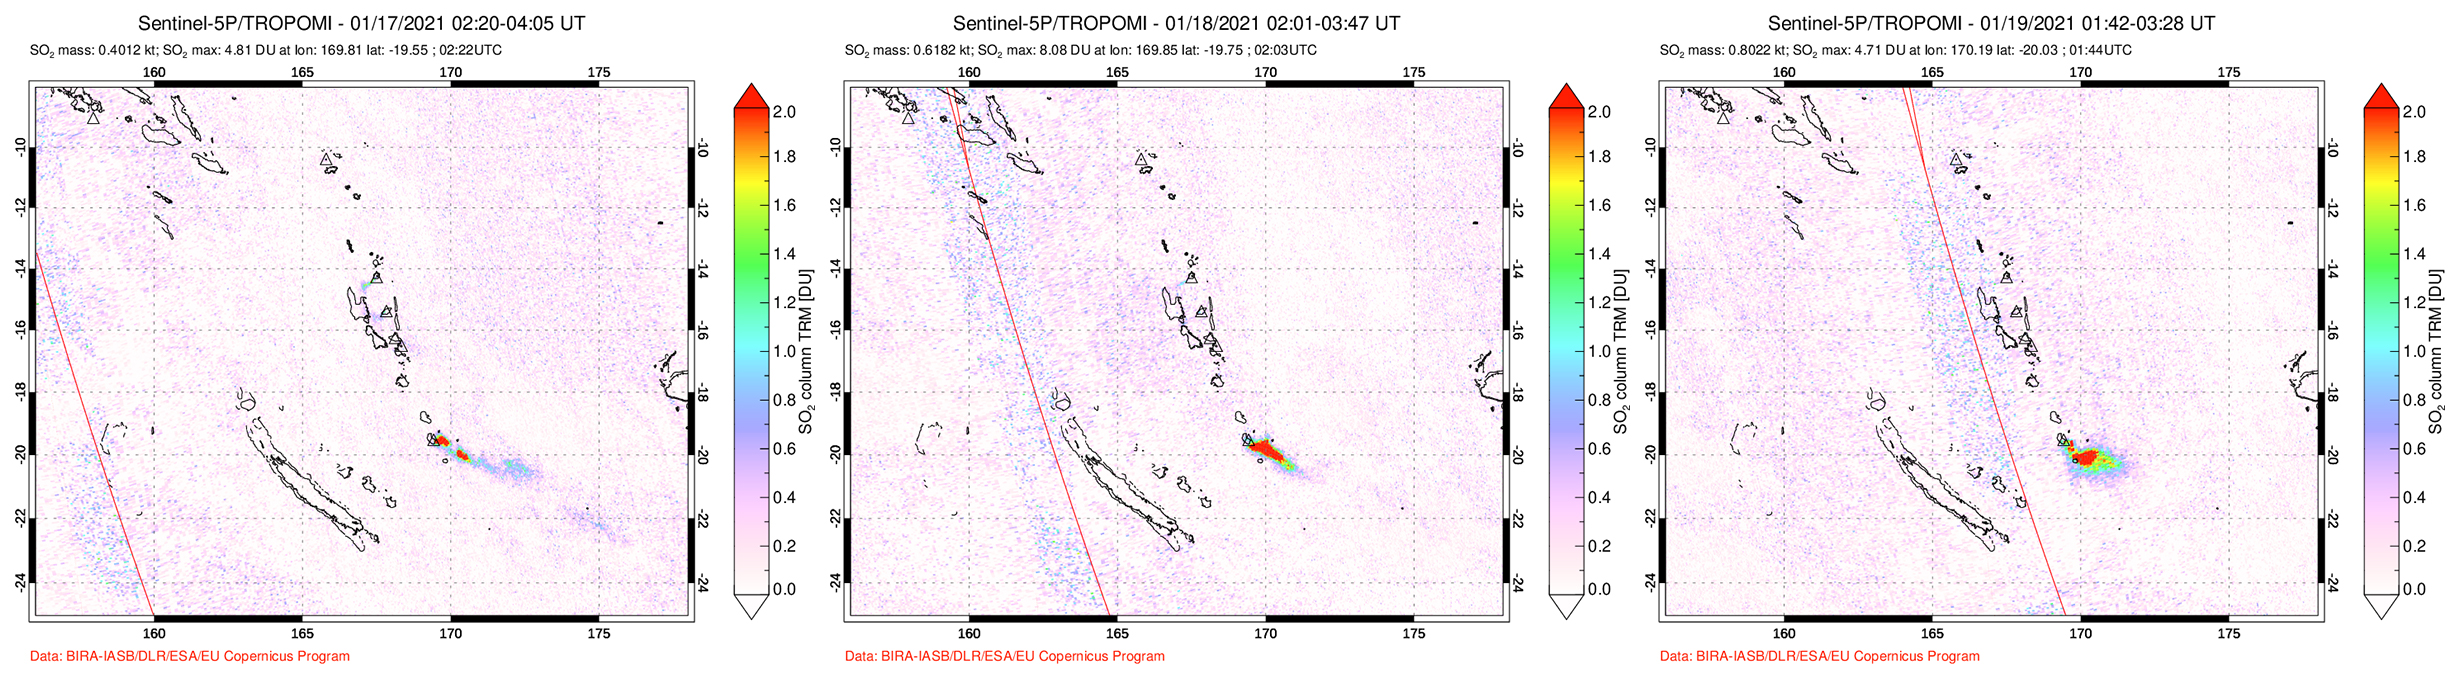 |
Figure 78. Relatively high-density SO2 plumes from Yasur during 17 (left), 18 (middle), and 19 (right) January 2021 were observed consecutively using the TROPOMI imaging spectrometer on the Sentinel-5P satellite. The plumes drifted SE on each of the days. Courtesy of NASA Global Sulfur Dioxide Monitoring Page. |
Intermittent thermal anomalies recorded by the MIROVA (Middle InfraRed Observation of Volcanic Activity) system during September 2020 through February 2021 were low to moderate in power (figure 79). Brief noticeable break in activity occurred during early December 2020 and for much of January 2021. The MODVOLC thermal alert data recorded 41 thermal signatures primarily within the summit crater over a total of 25 different days during September 2020-February 2021. Some of these thermal anomalies were also captured in Sentinel-2 thermal satellite imagery; thermal anomalies were visible in the N and S vents in the summit crater (figure 80).
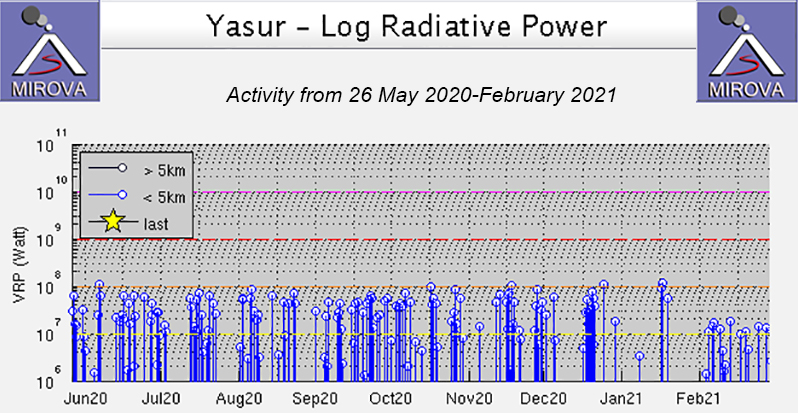 |
Figure 79. MIROVA (Log Radiative Power) thermal data for Yasur from 26 May 2020 through February 2021 showed persistent low to moderate thermal activity. A brief but noticeable break in activity occurred during early December, early January, and late January. Courtesy of MIROVA. |
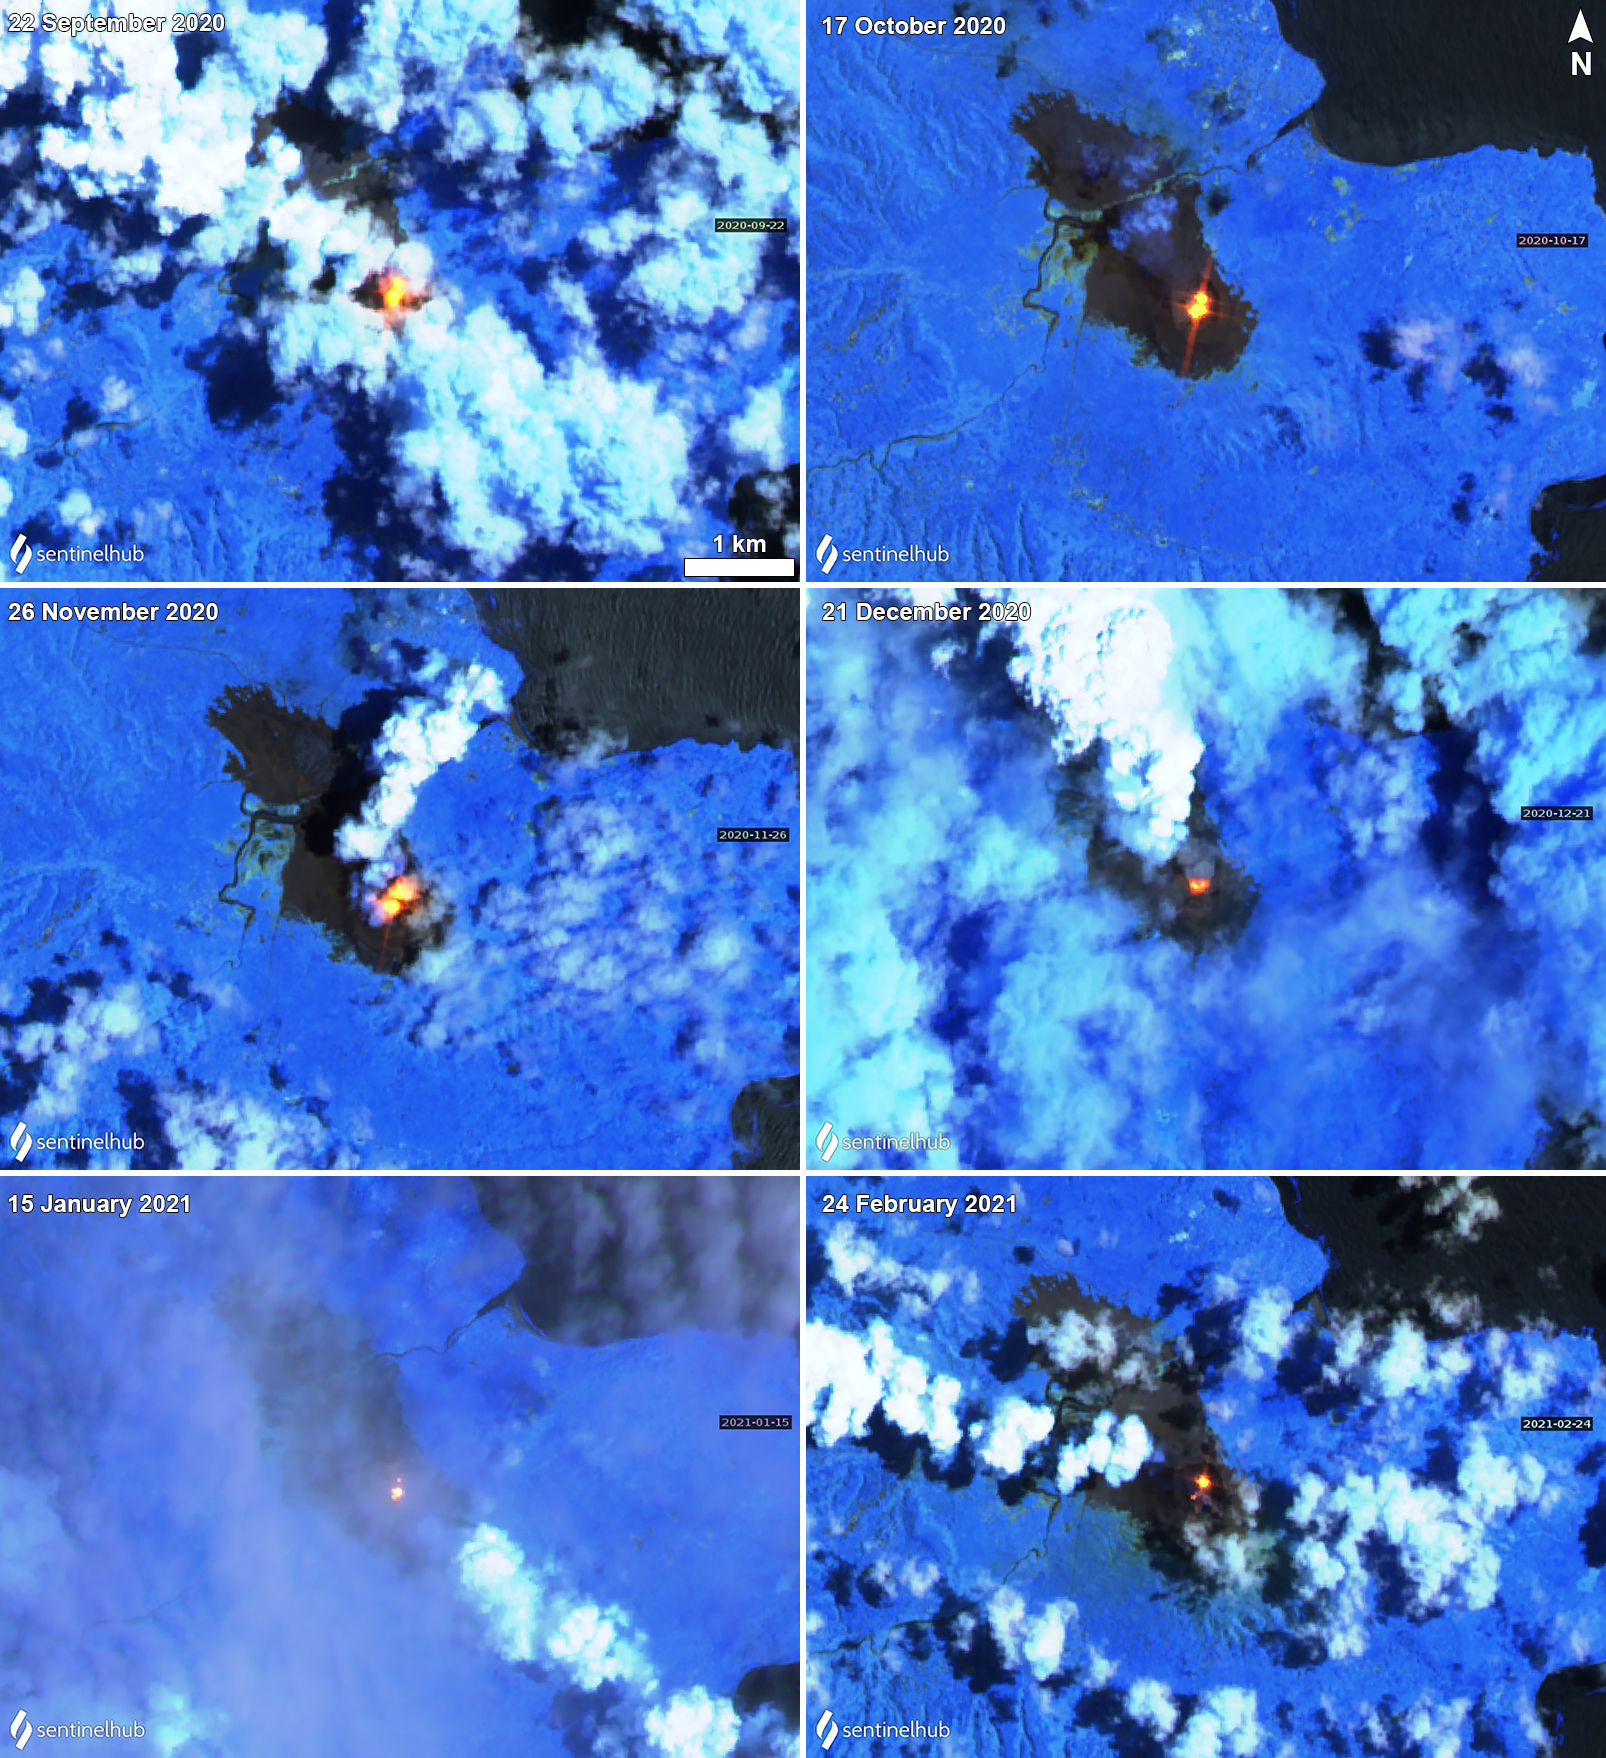 |
Figure 80. Sentinel-2 thermal satellite images showing strong thermal anomalies (yellow-orange) in the N and S vents of the summit crater at Yasur each month from September 2020 through February 2021. During 22 September (top left), 17 October (top right), and 26 November (middle left), the two thermal anomalies in the crater were roughly the same intensity. On 21 December (middle right) the anomaly was accompanied by a small, gray ash plume. On 15 January (bottom left) and 24 February (bottom right) the intensity of the anomaly in the N vent and then the S vent had decreased slightly. Sentinel-2 satellite images with “Atmospheric penetration” (bands 12, 11, 8A) rendering. Courtesy of Sentinel Hub Playground. |
Geological Summary. Yasur has exhibited essentially continuous Strombolian and Vulcanian activity at least since Captain Cook observed ash eruptions in 1774. This style of activity may have continued for the past 800 years. Located at the SE tip of Tanna Island in Vanuatu, this pyroclastic cone has a nearly circular, 400-m-wide summit crater. The active cone is largely contained within the small Yenkahe caldera, and is the youngest of a group of Holocene volcanic centers constructed over the down-dropped NE flank of the Pleistocene Tukosmeru volcano. The Yenkahe horst is located within the Siwi ring fracture, a 4-km-wide open feature associated with eruption of the andesitic Siwi pyroclastic sequence. Active tectonism along the Yenkahe horst accompanying eruptions has raised Port Resolution harbor more than 20 m during the past century.
Information Contacts: Geo-Hazards Division, Vanuatu Meteorology and Geo-Hazards Department (VMGD), Ministry of Climate Change Adaptation, Meteorology, Geo-Hazards, Energy, Environment and Disaster Management, Private Mail Bag 9054, Lini Highway, Port Vila, Vanuatu (URL: http://www.vmgd.gov.vu/, https://www.facebook.com/VanuatuGeohazardsObservatory/); MIROVA (Middle InfraRed Observation of Volcanic Activity), a collaborative project between the Universities of Turin and Florence (Italy) supported by the Centre for Volcanic Risk of the Italian Civil Protection Department (URL: http://www.mirovaweb.it/); Hawai'i Institute of Geophysics and Planetology (HIGP) - MODVOLC Thermal Alerts System, School of Ocean and Earth Science and Technology (SOEST), Univ. of Hawai'i, 2525 Correa Road, Honolulu, HI 96822, USA (URL: http://modis.higp.hawaii.edu/); NASA Global Sulfur Dioxide Monitoring Page, Atmospheric Chemistry and Dynamics Laboratory, NASA Goddard Space Flight Center (NASA/GSFC), 8800 Greenbelt Road, Goddard, Maryland, USA (URL: https://so2.gsfc.nasa.gov/); Sentinel Hub Playground (URL: https://www.sentinel-hub.com/explore/sentinel-playground).