Report on Stromboli (Italy) — May 2021
Bulletin of the Global Volcanism Network, vol. 46, no. 5 (May 2021)
Managing Editor: Edward Venzke.
Edited by Kadie L. Bennis.
Stromboli (Italy) Strombolian explosions, lava flows, fountains, and spatter during January-April 2021
Please cite this report as:
Global Volcanism Program, 2021. Report on Stromboli (Italy) (Bennis, K.L., and Venzke, E., eds.). Bulletin of the Global Volcanism Network, 46:5. Smithsonian Institution. https://doi.org/10.5479/si.GVP.BGVN202105-211040
Stromboli
Italy
38.789°N, 15.213°E; summit elev. 924 m
All times are local (unless otherwise noted)
Stromboli, in the northeastern Aeolian Islands, includes the active Northern (N) and Central-South (CS) craters in the summit area at the head of the Sciara del Fuoco, a large scarp that runs from the summit down the NW flank. The current eruption period began February 1934 and has been recently characterized by Strombolian explosions, incandescent ejecta, lava flows, and pyroclastic flows (BGVN 46:02). This report updates activity consisting of similar eruptive events during January through April 2021 using information from daily and weekly reported by Italy's Istituto Nazionale di Geofisica e Vulcanologia (INGV) and various satellite data.
Activity was consistent during this reporting period. The average explosion rates ranged from 2-28 per hour in the N crater and 1-8 per hour in the CS crater, though individual explosions varied in intensity (table 11). Ejected material rose up to 250 m above both the N and CS craters. Strombolian explosions were often accompanied by gas-and-steam emissions and frequent intense spattering in the N crater, depositing material on the Sciara del Fuoco. Lava fountains were also reported. On 18, 22, and 24 January four lava flows were detected in the N crater area. According to INGV, the average SO2 emissions measured 250-300 tons/day.
Table 11. Summary of activity at Stromboli during January-April 2021. Data courtesy of INGV.
| Month | Activity |
| Jan 2021 | Strombolian activity. Average explosion rates 7-22 per hour in N crater and 1-8 in CS crater. Some spattering in N crater. Ejected material rose 80-250 m above N crater and 250 m above CS crater. Average SO2 emissions 250-300 tons/day. |
| Feb 2021 | Strombolian activity. Average explosion rates 5-28 per hour in N crater and 1-6 in CS crater. Continuous spattering in N crater. Ejected material rose 80-250 m above N crater and 250 m above CS crater. Average SO2 emissions 250-300 tons/day. |
| Mar 2021 | Strombolian activity. Average explosion rates 2-14 per hour in N crater and 1-8 in CS crater. Continuous spattering in N crater. Ejected material rose 80-250 m above N crater and 250 m above CS crater. Average SO2 emissions 250-300 tons/day. |
| Apr 2021 | Strombolian activity. Average explosion rates 2-18 per hour in N crater and 1-7 in CS crater. Continuous spattering in N crater. Ejected material rose 250 m above N crater and 250 m above CS crater. Average SO2 emissions 250-300 tons/day. |
Activity during January consisted of Strombolian explosions in the N and CS craters ranging from 7-18 per hour and 1-4 per hour, respectively. The frequency of explosive events was relatively low during 1-6 January (less than 10 events per hour), increased on 7 and 8 January (up to 18 events per hour), then dropped again during 9-10 January (12-14 events per hour). The N1 vent contained two points of emission, producing low-intensity explosions that ejected fine ash, coarse lapilli, and bombs. The N2 vent contained four points of emission that generated explosions of more variable intensity and ejected coarse lapilli. Spattering at this vent also constructed some hornitos, which in turn generated jets of incandescent material. Spattering was more energetic during 7-8 January and then started to decline to weak and less frequent intervals.
During 18, 22, and 24 January INGV reported four lava flows in the N crater beyond the edge of the N2 vent, extending onto the upper Sciara del Fuoco (figure 196). Two points of emission between vents N1 and N2 have been designated P1 and P2 (figure 197), the latter of which has been observed since October. The first lava flow originated from P1 and was reported on 18 January at 1115; incandescent blocks of material traveled a few tens of meters in the upper part of the Sciara before stopping (reaching an elevation of 700 m). A second lava flow, originating from P2 occurred between 1600 and 2100 on 18 January, stopped in the central part of the Sciara. The third lava flow also originated from P2 on 22 January between 1222 and 2100, extending for a few hundred meters in the upper and central part of the Sciara (figure 198); this flow had a greater volume compared to the first two and accumulated at the coastline. The fourth lava flow was detected on 24 January at 1956 from P2 and continued until the morning of 25 January; its volume was less than the third flow. In the CS crater at least two vents were active, one of which emitted only ash, while the other ejected coarse incandescent material 250 m above the crater.
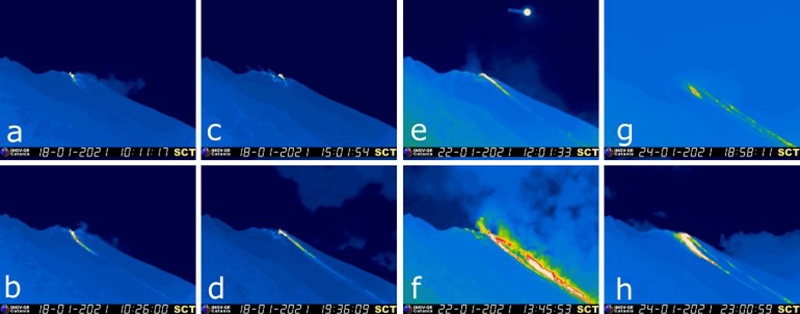 |
Figure 196. Thermal webcam images showing the evolution of the lava flows (bright red, yellow, and green) at Stromboli during 18 (a-d), 22 (e-f), and 24 (g-h) January 2021 accompanied by some gas-and-steam emissions. Images captured by the SCT surveillance camera. Courtesy of INGV (Rep. No. 04/2021, Stromboli, Bollettino Settimanale, 18/01/2021 - 24/01/2021, data emissione 26/01/2021). |
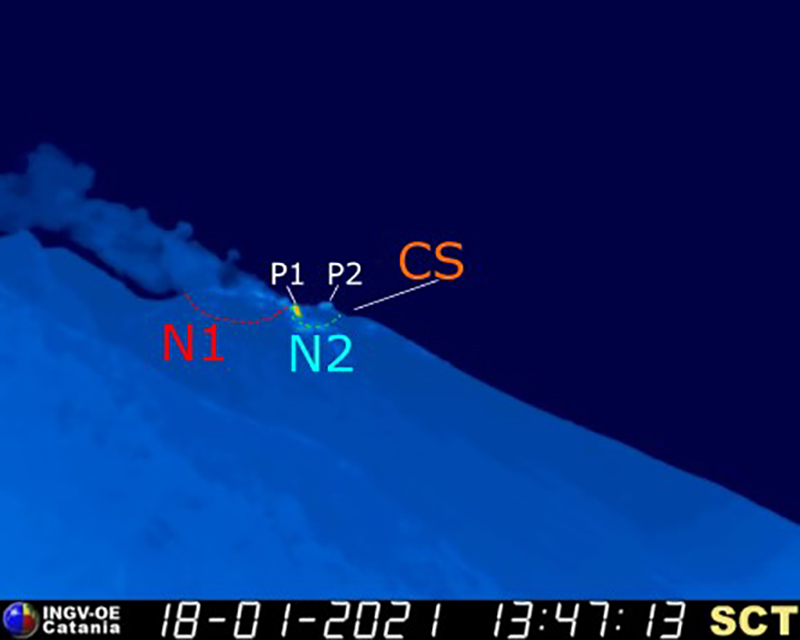 |
Figure 197. Thermal webcam image indicating the relative locations of the crater areas (N1, N2, and CS) and lava emission points (P1 and P2) on Stromboli. Image taken on 18 January 2021 captured by the SCT surveillance camera. Courtesy of INGV (Rep. No. 04/2021, Stromboli, Bollettino Settimanale, 18/01/2021 - 24/01/2021, data emissione 26/01/2021). |
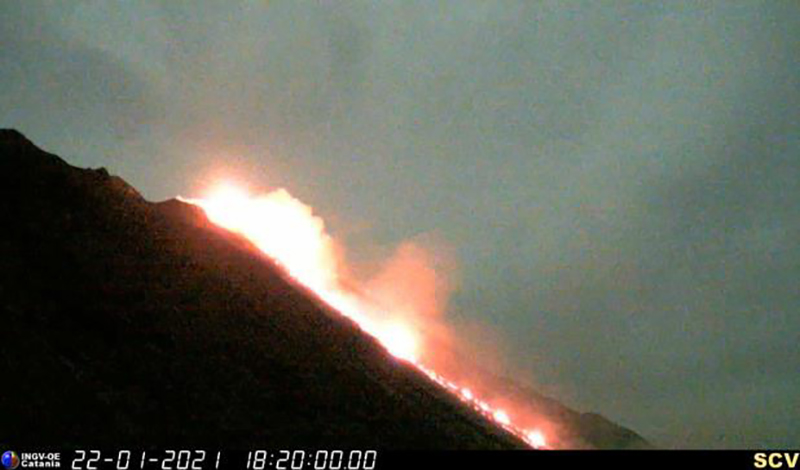 |
Figure 198. Webcam image of the effusive activity at Stromboli at 1920 (local time) on 22 January 2021. Image captured by the SCV surveillance camera. Courtesy of INGV. |
Similar explosive activity continued in February. The average explosion rates ranged from 5-28 per hour in the N crater and 1-6 per hour in the CS crater. The N1 vent continued to produce low-intensity explosions that ejected material less than 80 m high, and sometimes up to 250 m, that consisted of fine ash mixed with coarse lapilli and bombs. On the evening of 4 February the lava fountains exceeded 100 m above the vent. The N2 vent had stronger explosions that ejected coarse material 250 m high; intense and frequent spattering was also observed in this vent, particularly on 8, 10, and 13 February. Weak spattering was observed through 17 February. During 24-25 February observations were made by the HPHT Lab from INGV-Roma 1 and FlyEye Team of OE as part of the UNO Departmental Project. Drone images were taken to document the active vents and craters (figure 199). In addition, a Digital Surface Model (DSM) was created to map the summit craters (figure 200). Crater measurements showed that CS1 was greater than 90 m wide, CS2 was about 70 m, and CS3 has a diameter of 43 m. In the N crater, N1 and N2 measured 47 and 67 m in diameter, respectively.
 |
Figure 199. Drone images of the summit crater at Stromboli documenting the craters (yellow outline) and the location of the active vents (red dots). White gas-and-steam emissions were also recorded in these images. Courtesy of INGV (Rep. No. 09/2021, Stromboli, Bollettino Settimanale, 22/02/2021 - 28/02/2021, data emissione 02/03/2021). |
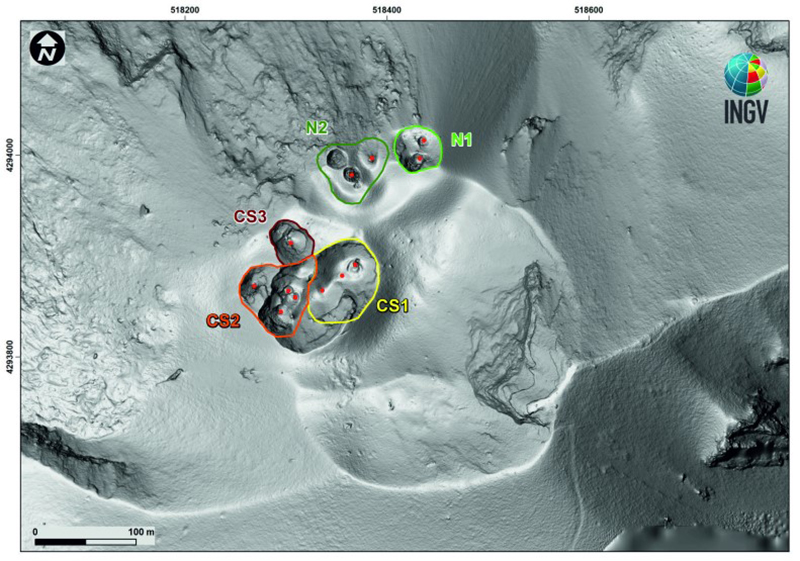 |
Figure 200. Digital Surface Model (DSM) of Stromboli’s summit crater area with a resolution of 10 cm. Each crater is outlined with a different color: CS1 (yellow), CS2 (orange), CS3 (dark red), N1 (light green), and N2 (dark green). The red dots represent active locations at the time of the survey. Courtesy of INGV (Rep. No. 11/2021, Stromboli, Bollettino Settimanale, 08/03/2021 - 14/03/2021, data emissione 16/03/2021). |
During the week of 22-28 February two active vents in the N crater produced explosions that ejected lapilli and bombs up to 100-120 m high. Four vents were visible in N2, one of which was a hornito near the edge of the N1 crater that was characterized by degassing. Only two of these four vents were active, and the resulting explosions were small and contained coarse material. INGV also reported an extensive sulfur deposit on the hornito and on the N1 vent. In the CS crater ash sometimes mixed with coarse material was ejected 250 m high. Three vents were identified in the CS1 crater: one was inactive, one was degassing, and the largest vent was characterized by spattering and ejecta. In the SW section (CS2), there were at least four active vents: a hornito that produced some explosions and ejected coarse material, two vents behind the hornito that produced simultaneous explosions and ash emissions, and a deep crater further N with a vent on the floor that was characterized by small explosions and gas emissions.
Strombolian explosions persisted in March, though at an overall lower rate compared to February: 2-14 per hour in the N crater and 1-8 per hour in the CS crater. The N1 vent continued to generate low-intensity explosions that ejected material 80-250 m high, accompanied by minor ash emissions, while the N2 vent had similar explosions that ejected mixed coarse material. In the CS crater coarse material mixed with ash was ejected 250 m above the crater. An episode of stronger explosive activity lasting 3 minutes and 30 seconds early on 1 March consisted of about 10 explosions in the summit area (figure 201). Three strong explosive pulses were detected starting at 0232. At 0233 a strong explosion ejected material 350 m above the crater that fell along the upper part of the Sciara in the W and toward the Pizzo in the E. Two simultaneous explosions at 0235 from the CS crater and N1 lasted 22 seconds, ending the sequence. Resulting ejecta was deposited along the Sciara del Fuoco and toward Pizzo.
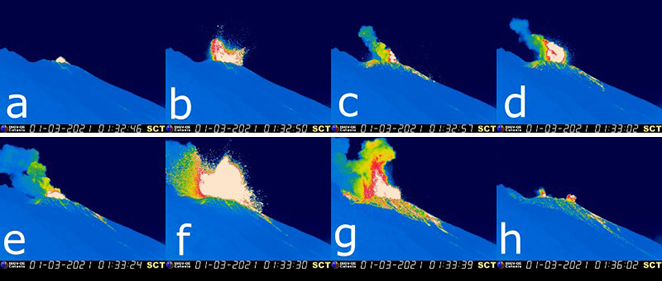 |
Figure 201. Thermal webcam images showing the explosive sequence at Stromboli on 1 March 2021 from 0232 (a) through 0236 (h) local time (the webcam timestampes are reported in UTC). Images captured by the SCT surveillance camera. Courtesy of INGV (Rep. No. 10/2021, Stromboli, Bollettino Settimanale, 01/03/2021 - 07/03/2021, data emissione 09/03/2021). |
Field observations were conducted on 31 March and 2-3 April by INGV staff to measure any changes in the summit crater and describe the activity. According to INGV, N1 showed two vents with low-to-medium explosions that ejected mainly coarse material mixed with ash. Two vents in one cone at N2 had little activity, but a hornito produced gas-and-steam emissions. CS1 has two vents adjacent to each other; the northernmost exhibited gas-and-steam emissions. The southernmost vent was occasionally explosive and ejected coarse material. CS2 contained three emission points with a SW-NE orientation, showing explosive activity of varying intensities and ejecting material of different sizes. CS3 had little explosive activity; sporadic modest explosions generated reddish ash. The average rate of explosions in the N crater was 2-18 per hour, and in the CS crater it was 1-7 per hour. N1 continued to eject coarse material (lapilli and bombs) up to 250 m high while N2 ejected fine ash mixed with coarse material. After 12 April both the intensity and volume of ejecta decreased in N1. The N2 vent showed low-intensity explosions and fine ejecta through 15 April; coarse material and weak spattering characterized 17 April. In the CS crater, at least three emission points were observed that generated explosions and ejected coarse material was mixed with medium-sized ash up to 250 m high.
Intermittent, low-power thermal activity was detected during January through April, according to the MIROVA Log Radiative Power graph using MODIS infrared satellite information (figure 202). During late January through early February, a cluster of stronger thermal anomalies were detected. Two thermal alerts were reported by the MODVOLC system on 21 January, around when the cluster of anomalies were detected by MIROVA. Sentinel-2 infrared satellite imagery showed a consistent thermal hotspot in both summit craters on clear days (figure 203).
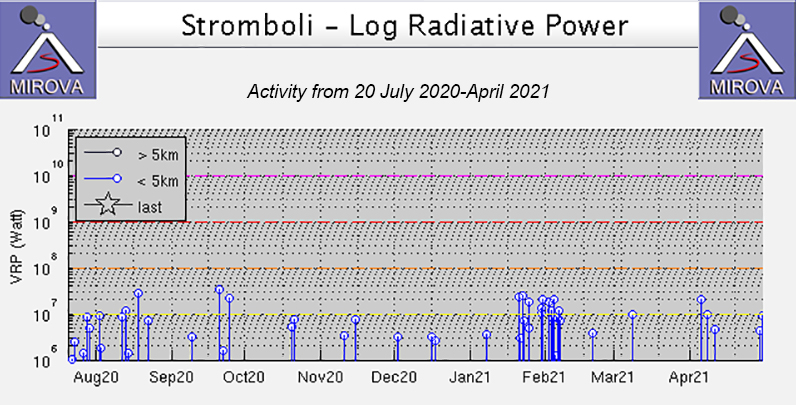 |
Figure 202. Intermittent low thermal activity at Stromboli was recorded by the MIROVA system (Log Radiative Power) from MODIS satellite data during January through April 2021; a cluster of stronger anomalies occurred during late January through early February. A single low-power anomaly was detected in early March, with four in April. Courtesy of MIROVA. |
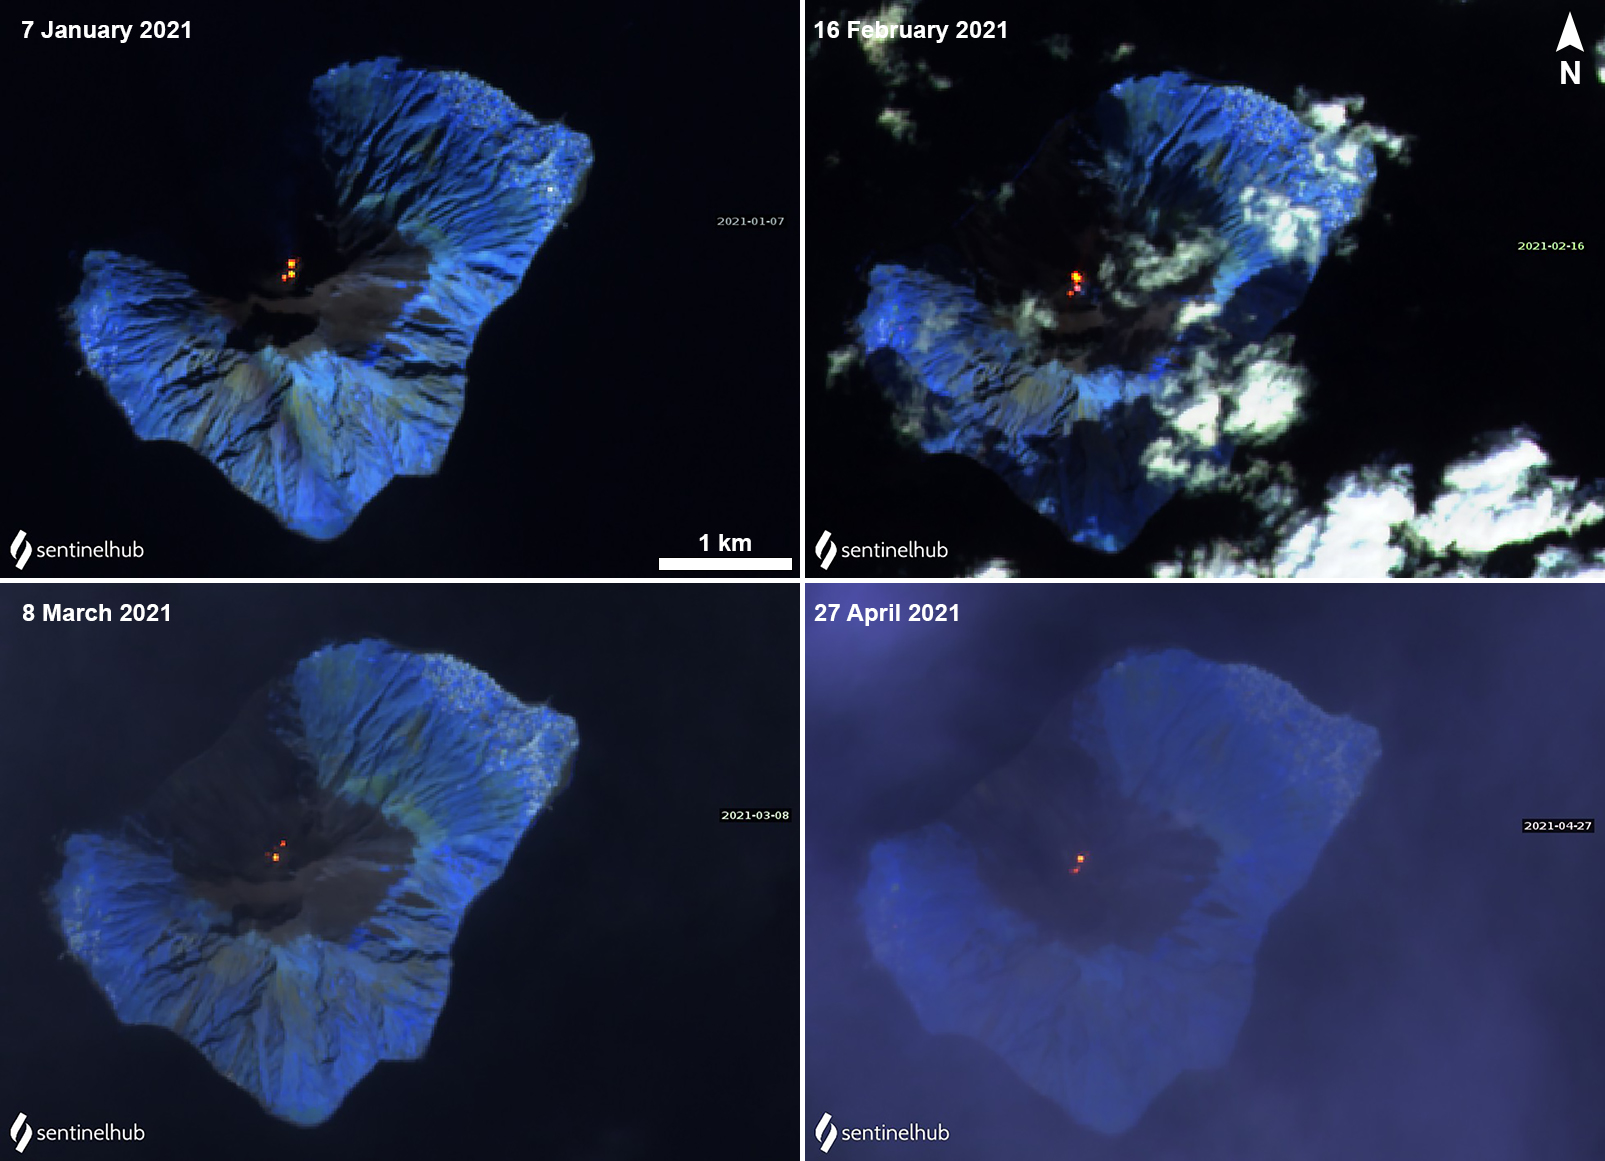 |
Figure 203. Persistent thermal anomalies (bright yellow-orange) at Stromboli were visible in Sentinel-2 infrared satellite imagery from both summit craters during January through April 2021. On 7 January (top left) and 16 February (top right) 2021 three thermal anomalies were visible in the summit area. By 8 March (bottom left) and 27 April (bottom right) only two anomalies were observed. Images with “Atmospheric penetration” (bands 12, 11, 8A) rendering. Courtesy of Sentinel Hub Playground. |
Geological Summary. Spectacular incandescent nighttime explosions at Stromboli have long attracted visitors to the "Lighthouse of the Mediterranean" in the NE Aeolian Islands. This volcano has lent its name to the frequent mild explosive activity that has characterized its eruptions throughout much of historical time. The small island is the emergent summit of a volcano that grew in two main eruptive cycles, the last of which formed the western portion of the island. The Neostromboli eruptive period took place between about 13,000 and 5,000 years ago. The active summit vents are located at the head of the Sciara del Fuoco, a prominent scarp that formed about 5,000 years ago due to a series of slope failures which extends to below sea level. The modern volcano has been constructed within this scarp, which funnels pyroclastic ejecta and lava flows to the NW. Essentially continuous mild Strombolian explosions, sometimes accompanied by lava flows, have been recorded for more than a millennium.
Information Contacts: Istituto Nazionale di Geofisica e Vulcanologia (INGV), Sezione di Catania, Piazza Roma 2, 95123 Catania, Italy, (URL: http://www.ct.ingv.it/en/); Hawai'i Institute of Geophysics and Planetology (HIGP) - MODVOLC Thermal Alerts System, School of Ocean and Earth Science and Technology (SOEST), Univ. of Hawai'i, 2525 Correa Road, Honolulu, HI 96822, USA (URL: http://modis.higp.hawaii.edu/); MIROVA (Middle InfraRed Observation of Volcanic Activity), a collaborative project between the Universities of Turin and Florence (Italy) supported by the Centre for Volcanic Risk of the Italian Civil Protection Department (URL: http://www.mirovaweb.it/); Sentinel Hub Playground (URL: https://www.sentinel-hub.com/explore/sentinel-playground).