Sarychev Peak
Russia
48.092°N, 153.2°E; summit elev. 1496 m
All times are local (unless otherwise noted)
Sarychev Peak forms the surface of Matua Island in the Kurile Islands with reported activity dating back to around 1765. Recent activity that started in May 2019 included ash and gas emission and elevated temperatures within the summit crater detected by satellite sensors, with the last reported activity being an ash plume reaching 2.7 km altitude on 10 August and thermal anomalies present until 7 October 2019 (BGVN 44:11). This bulletin summarizes activity during November 2019-April 2021 using reports by the Sakhalin Volcanic Eruption Response Team (SVERT) and the Kamchatka Volcanic Eruptions Response Team (KVERT), along with satellite data.
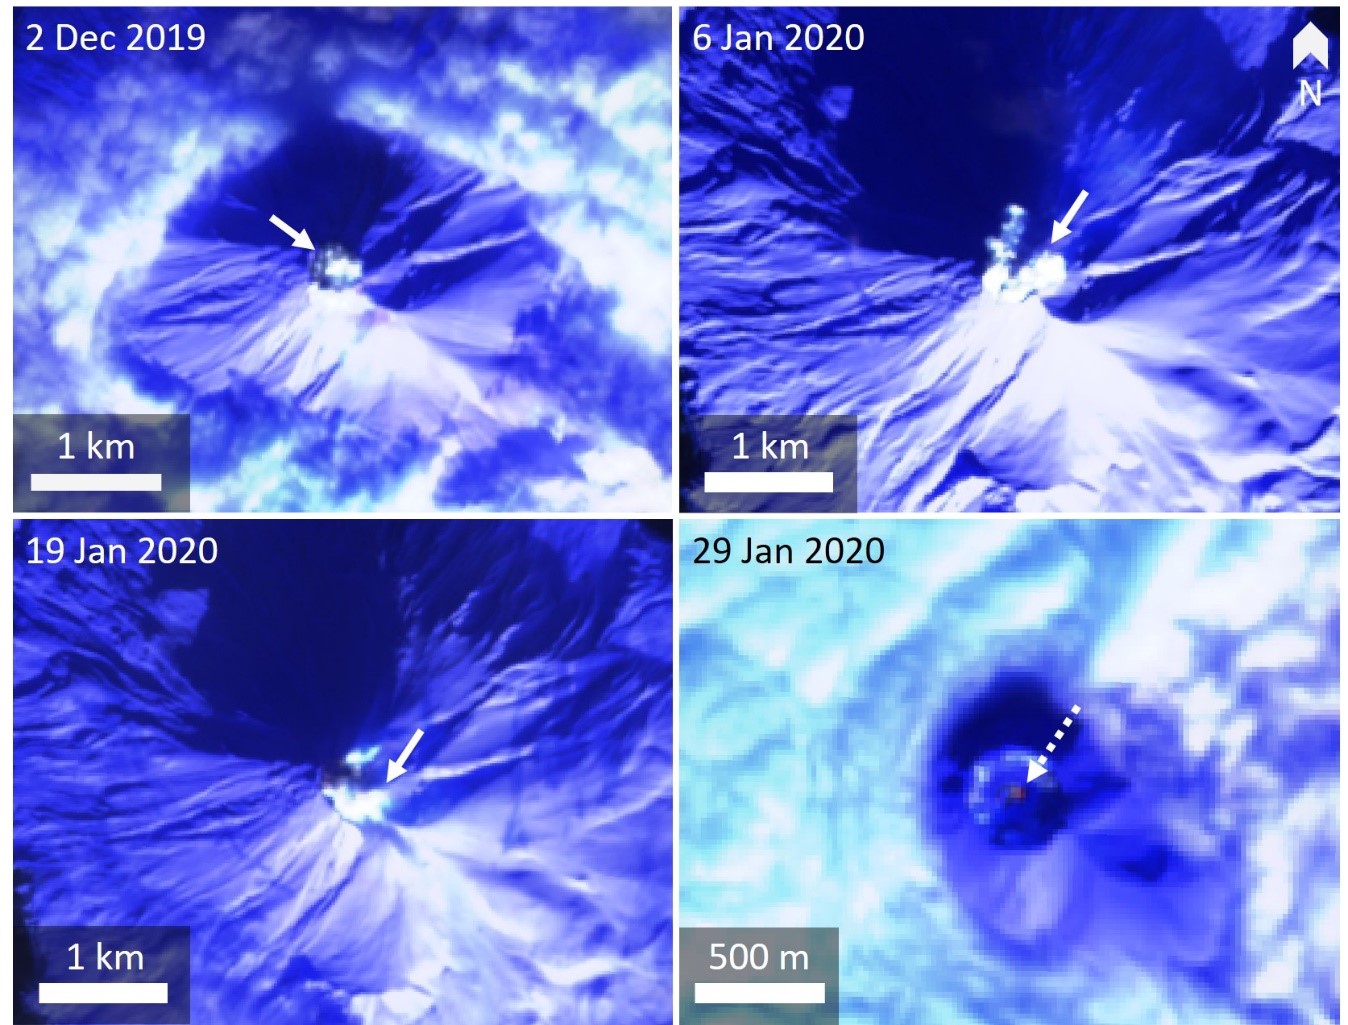
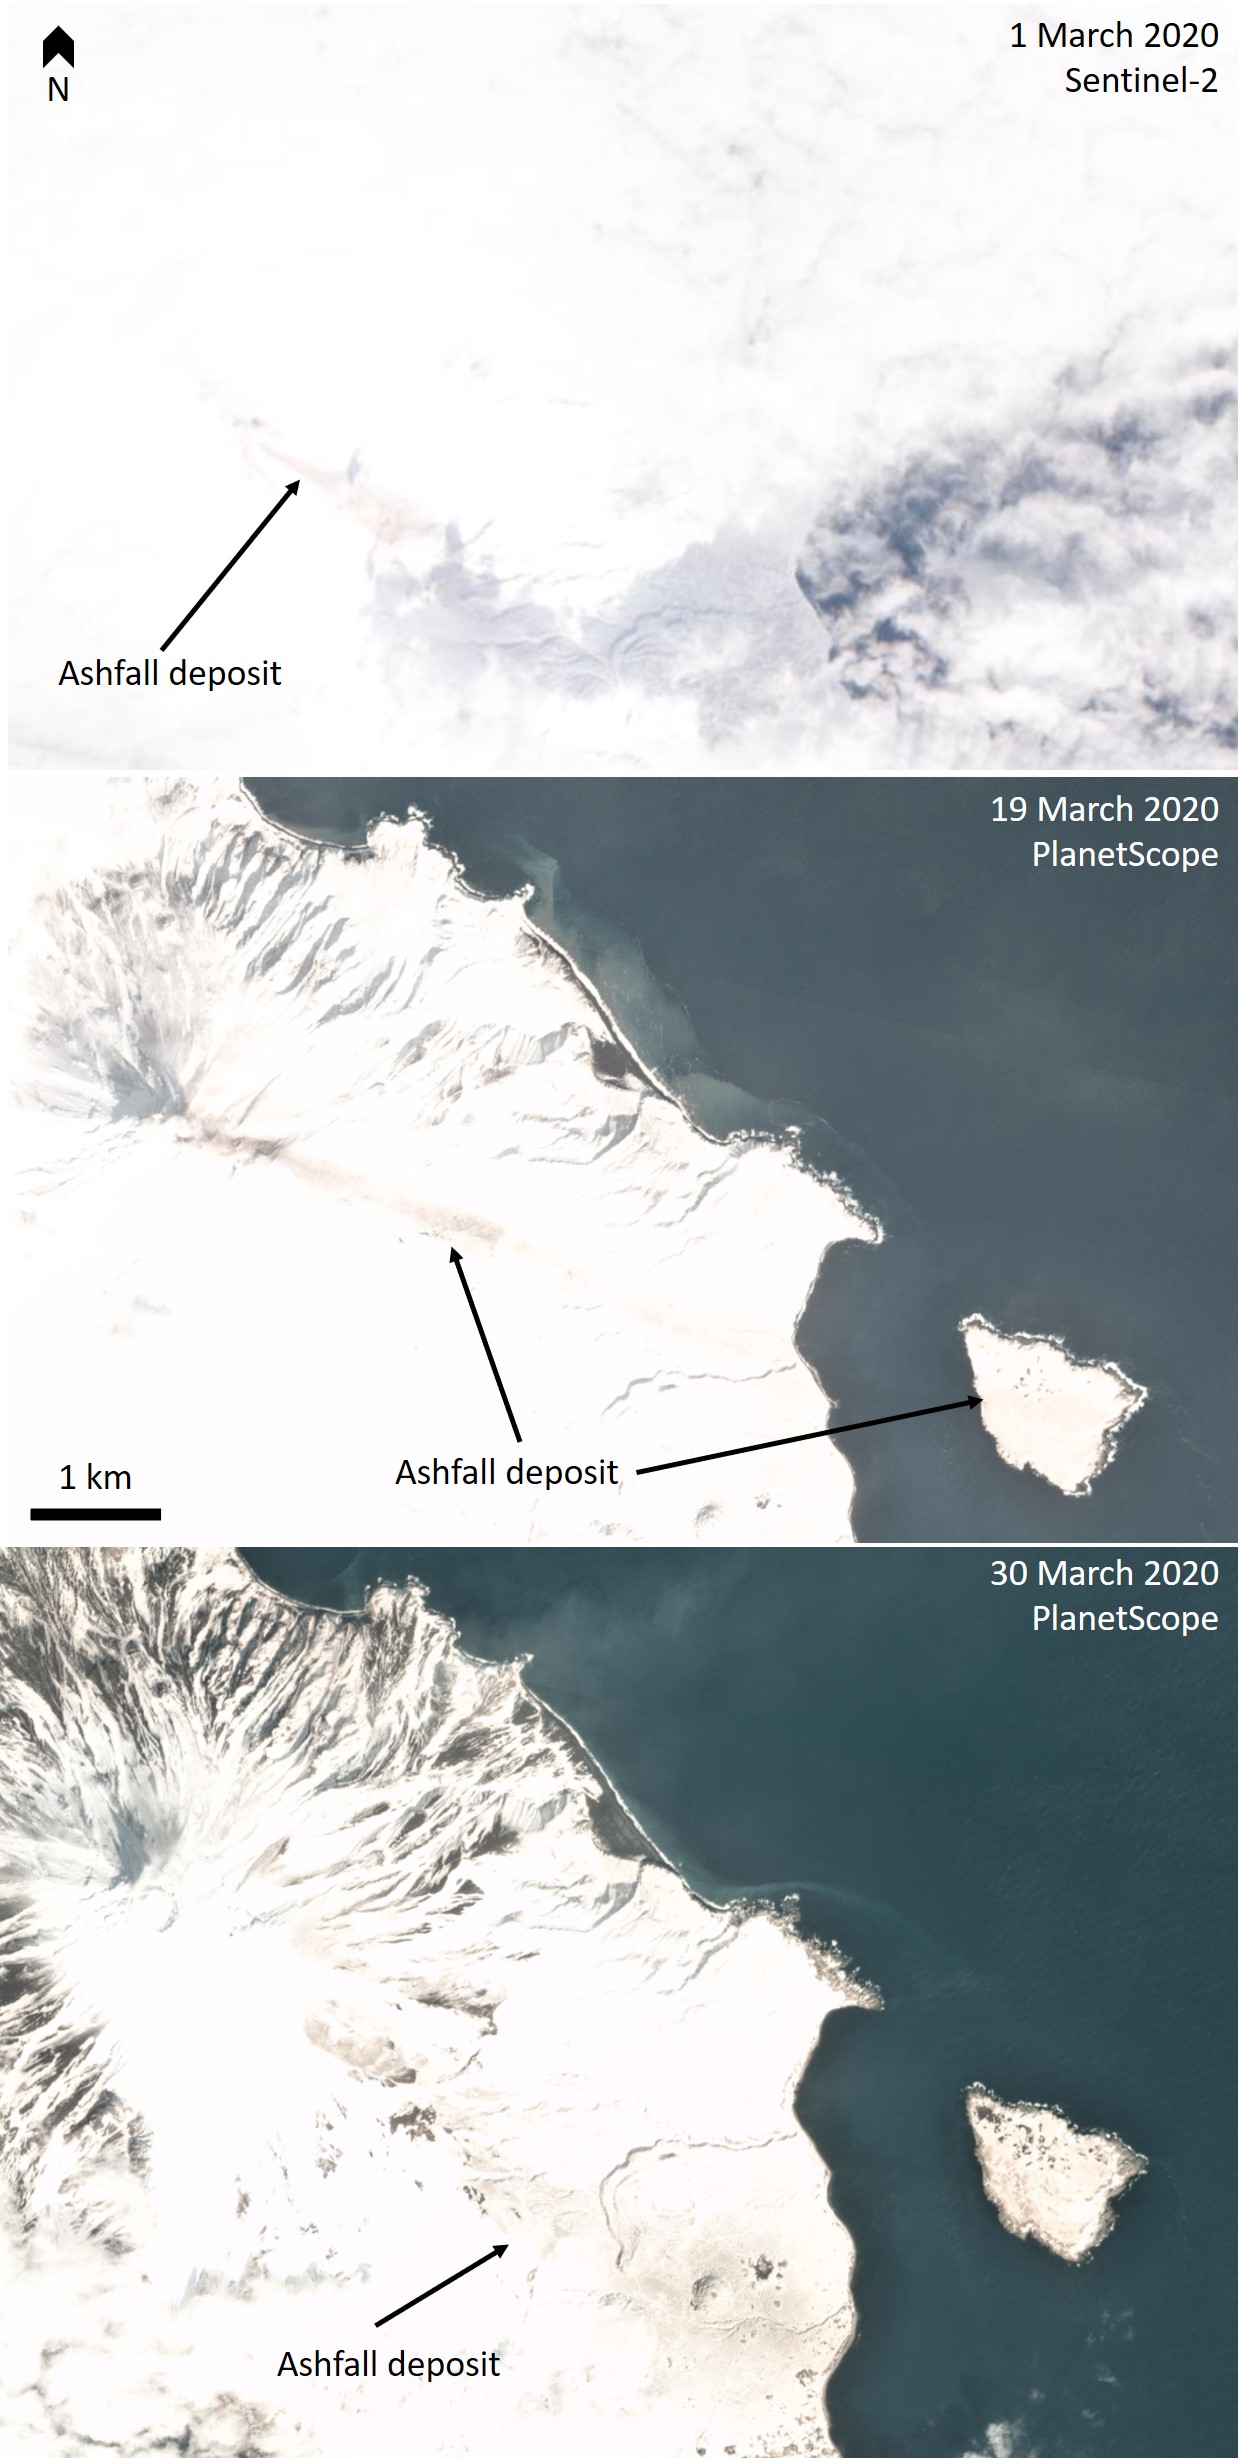
No cloud-free satellite images were found of the summit in November 2019, but Sentinel-2 satellite images showed weak gas-and-steam emissions on 2 and 20 December. Cloud-free Sentinel-2 images showed gas-and-steam emission through January 2020, and a thermal anomaly was detected in the crater on the 29th (figure 30). No clear satellite images of the summit area were found, but there is evidence of gas emission in February. Evidence of a new eruption is seen in satellite imagery of thin linear ash deposits across the snow on 1, 19, and 30 March 2020, all extending SE from the crater (figure 31). The crater was obscured by gas emissions on the 19th and a clear view of the crater floor showed no thermal anomaly on the 31st.
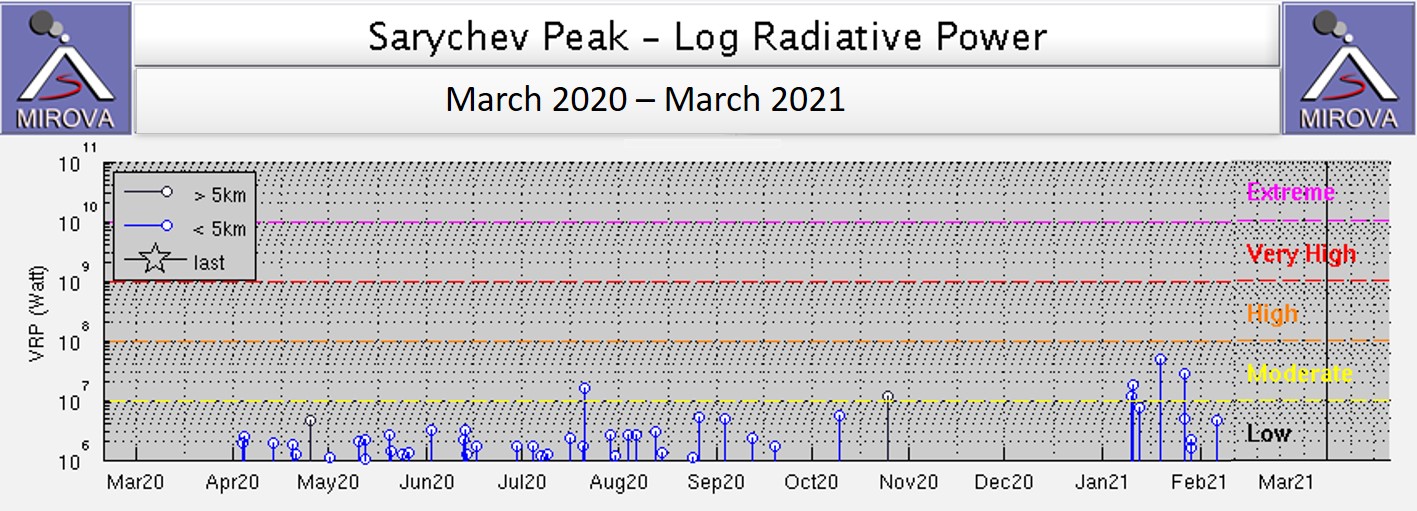
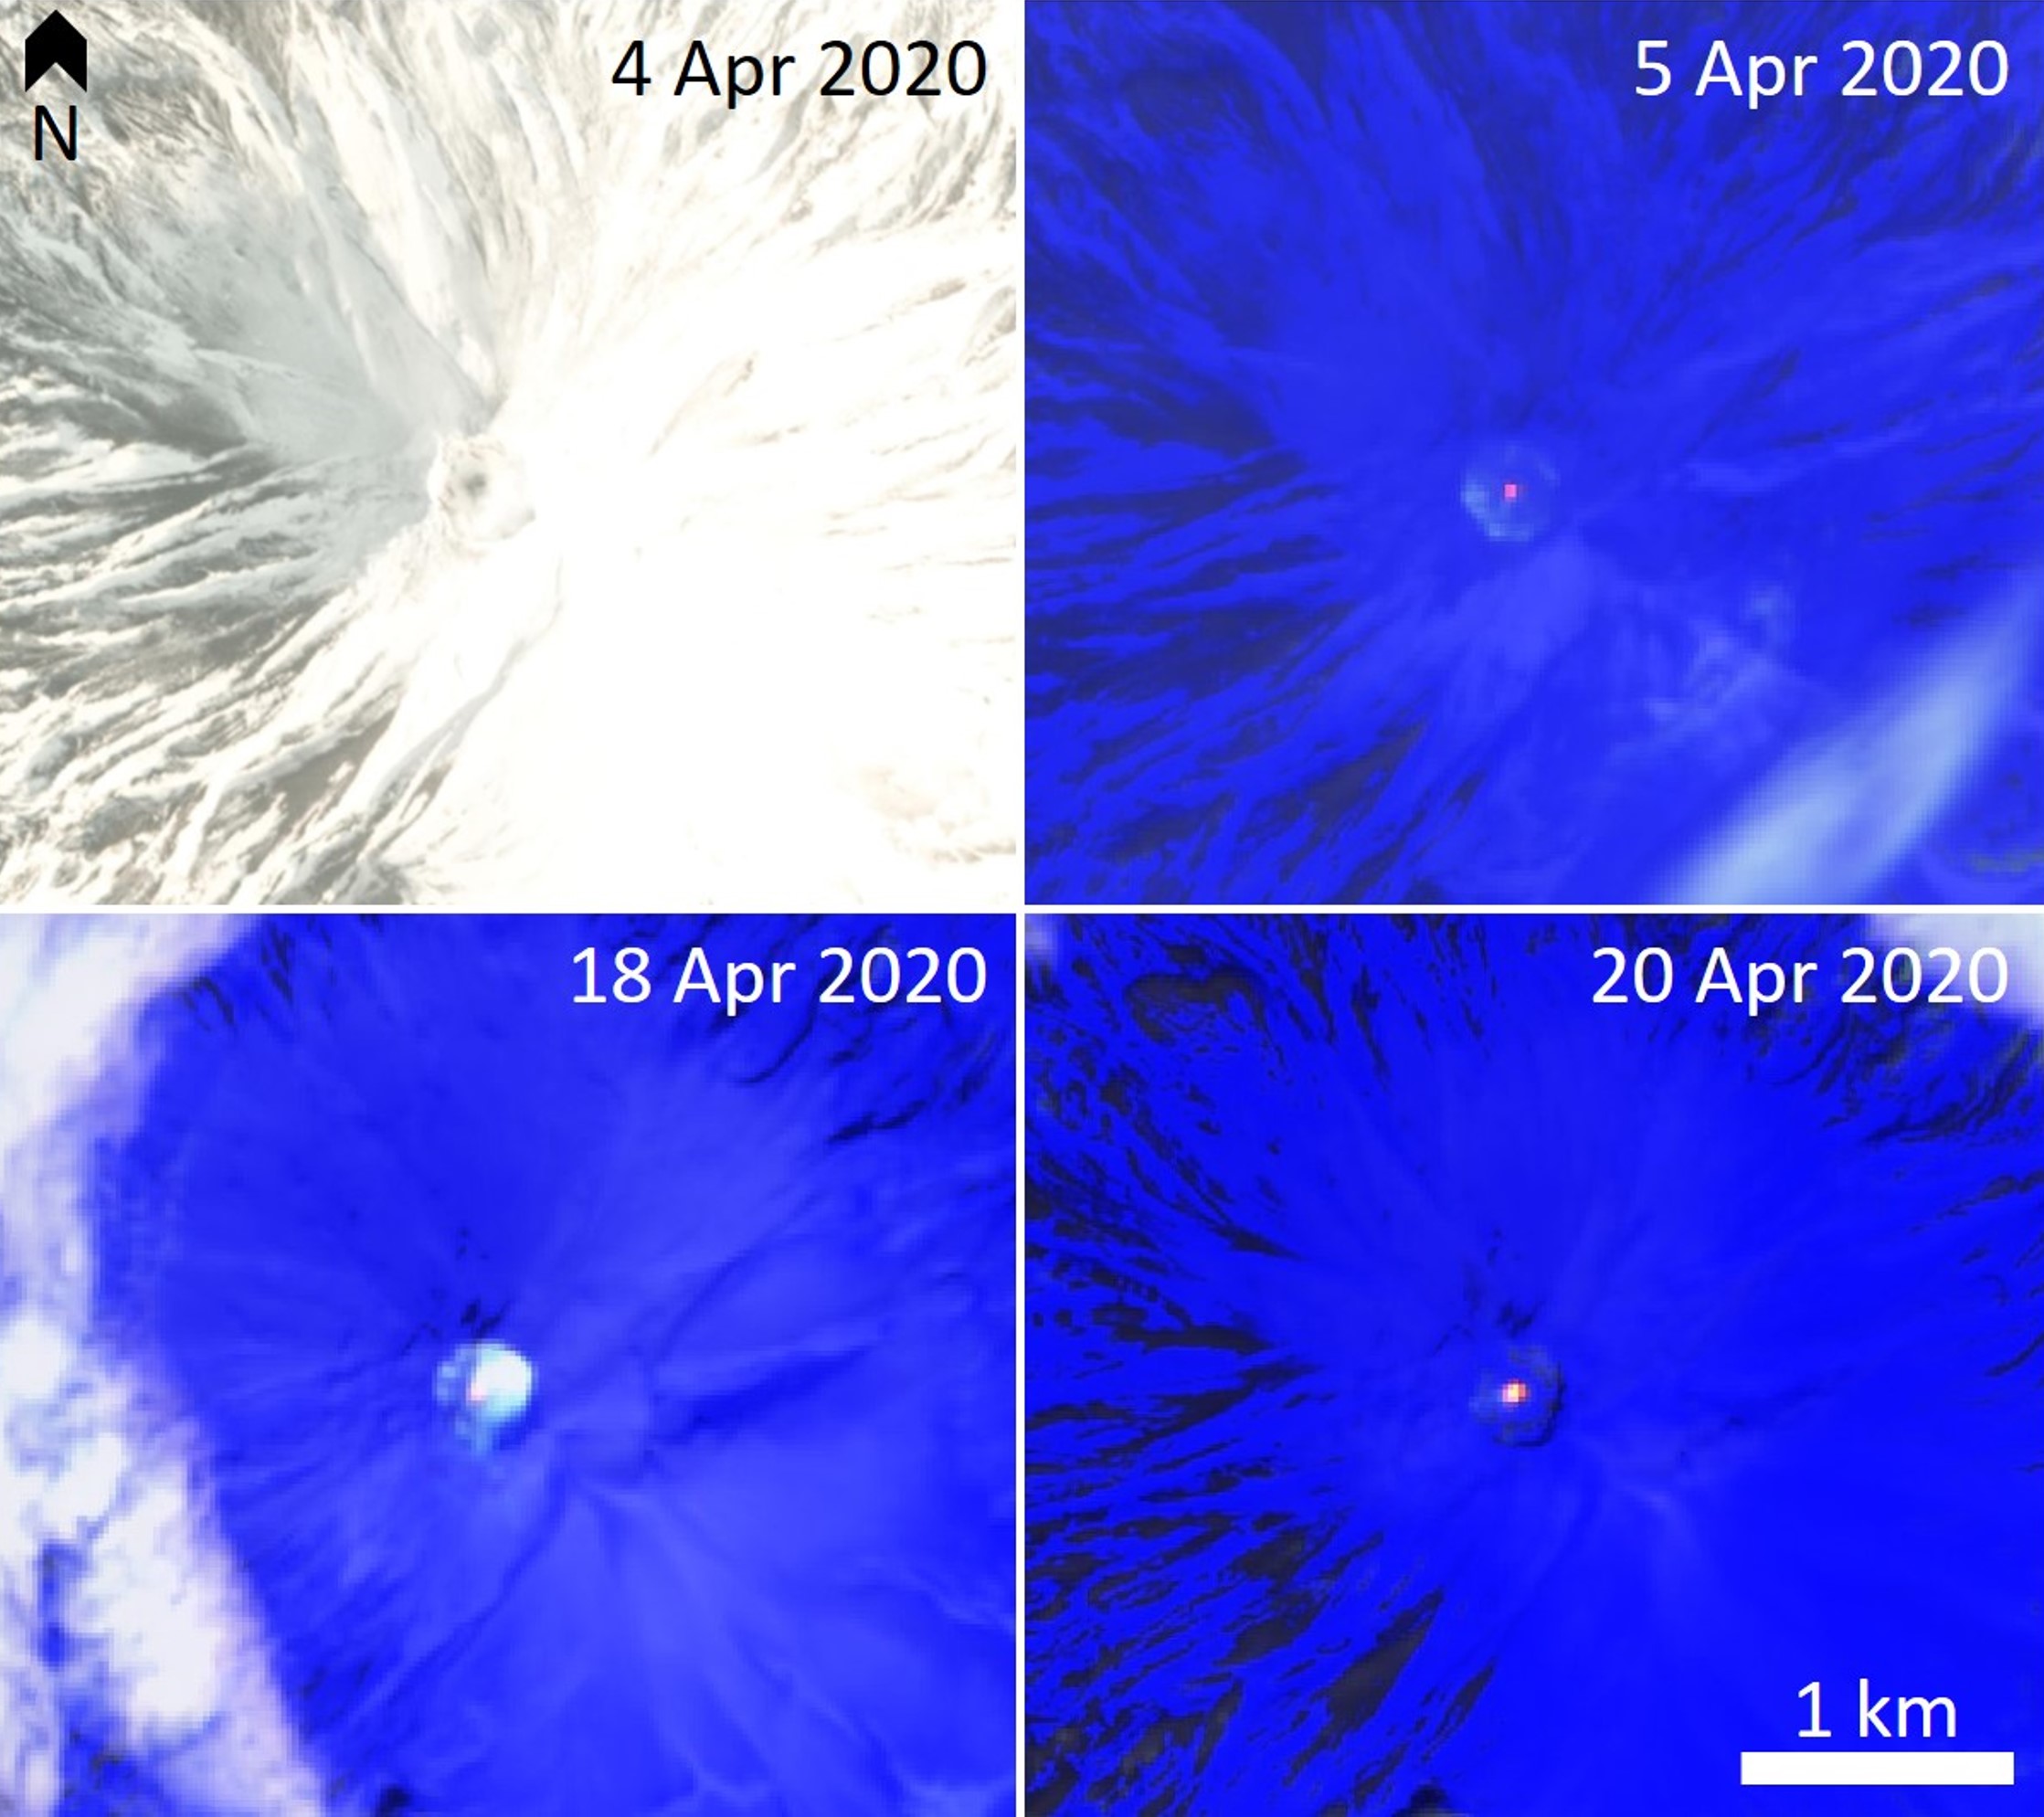
The MIROVA system began detecting elevated temperatures in early April 2020, which corresponded to the Sentinel-2 thermal sensor detecting high temperatures on the crater floor (figures 32 and 33). Satellite images also showed continued gas emissions, some days obscuring the view of the crater floor.
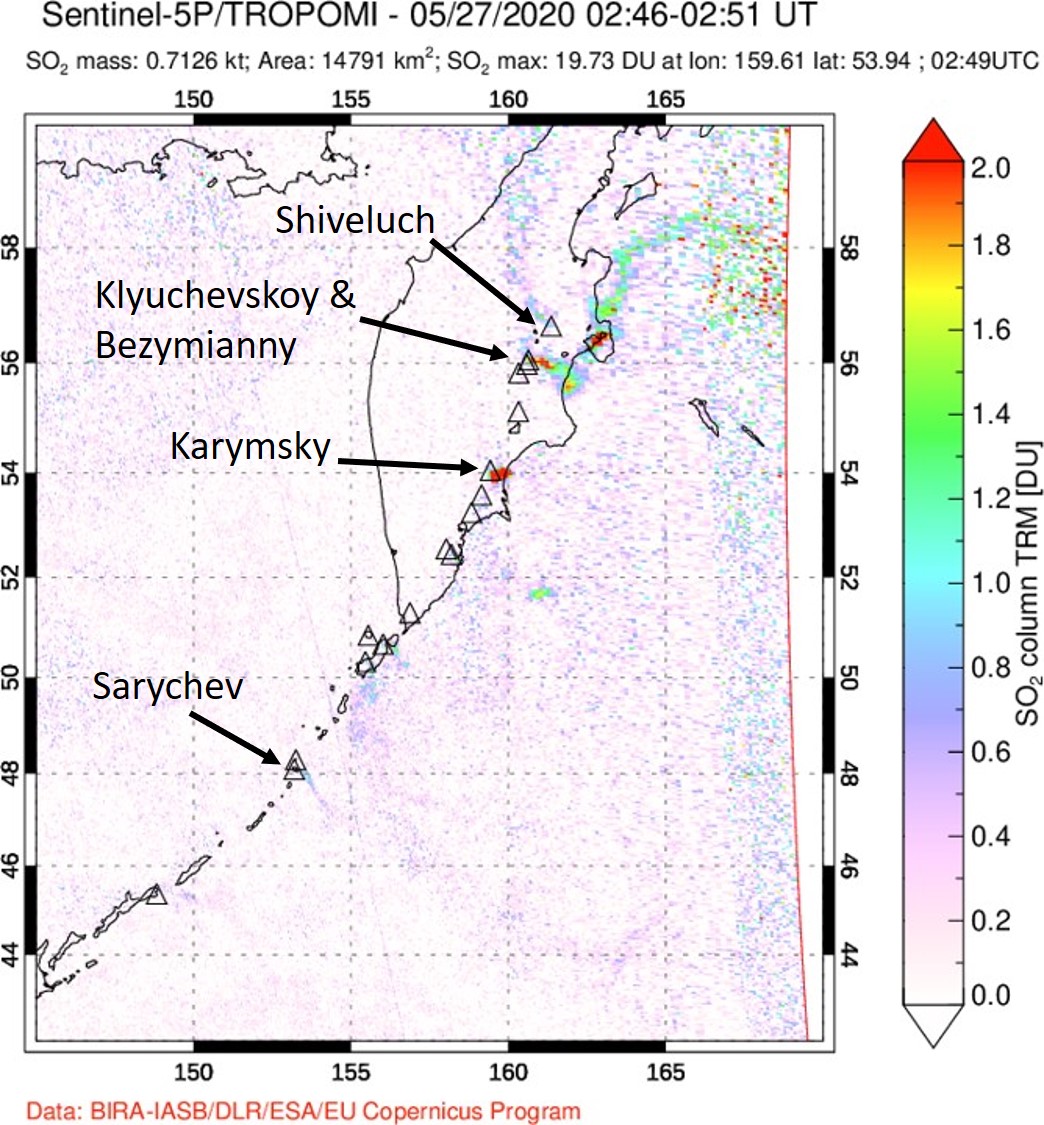
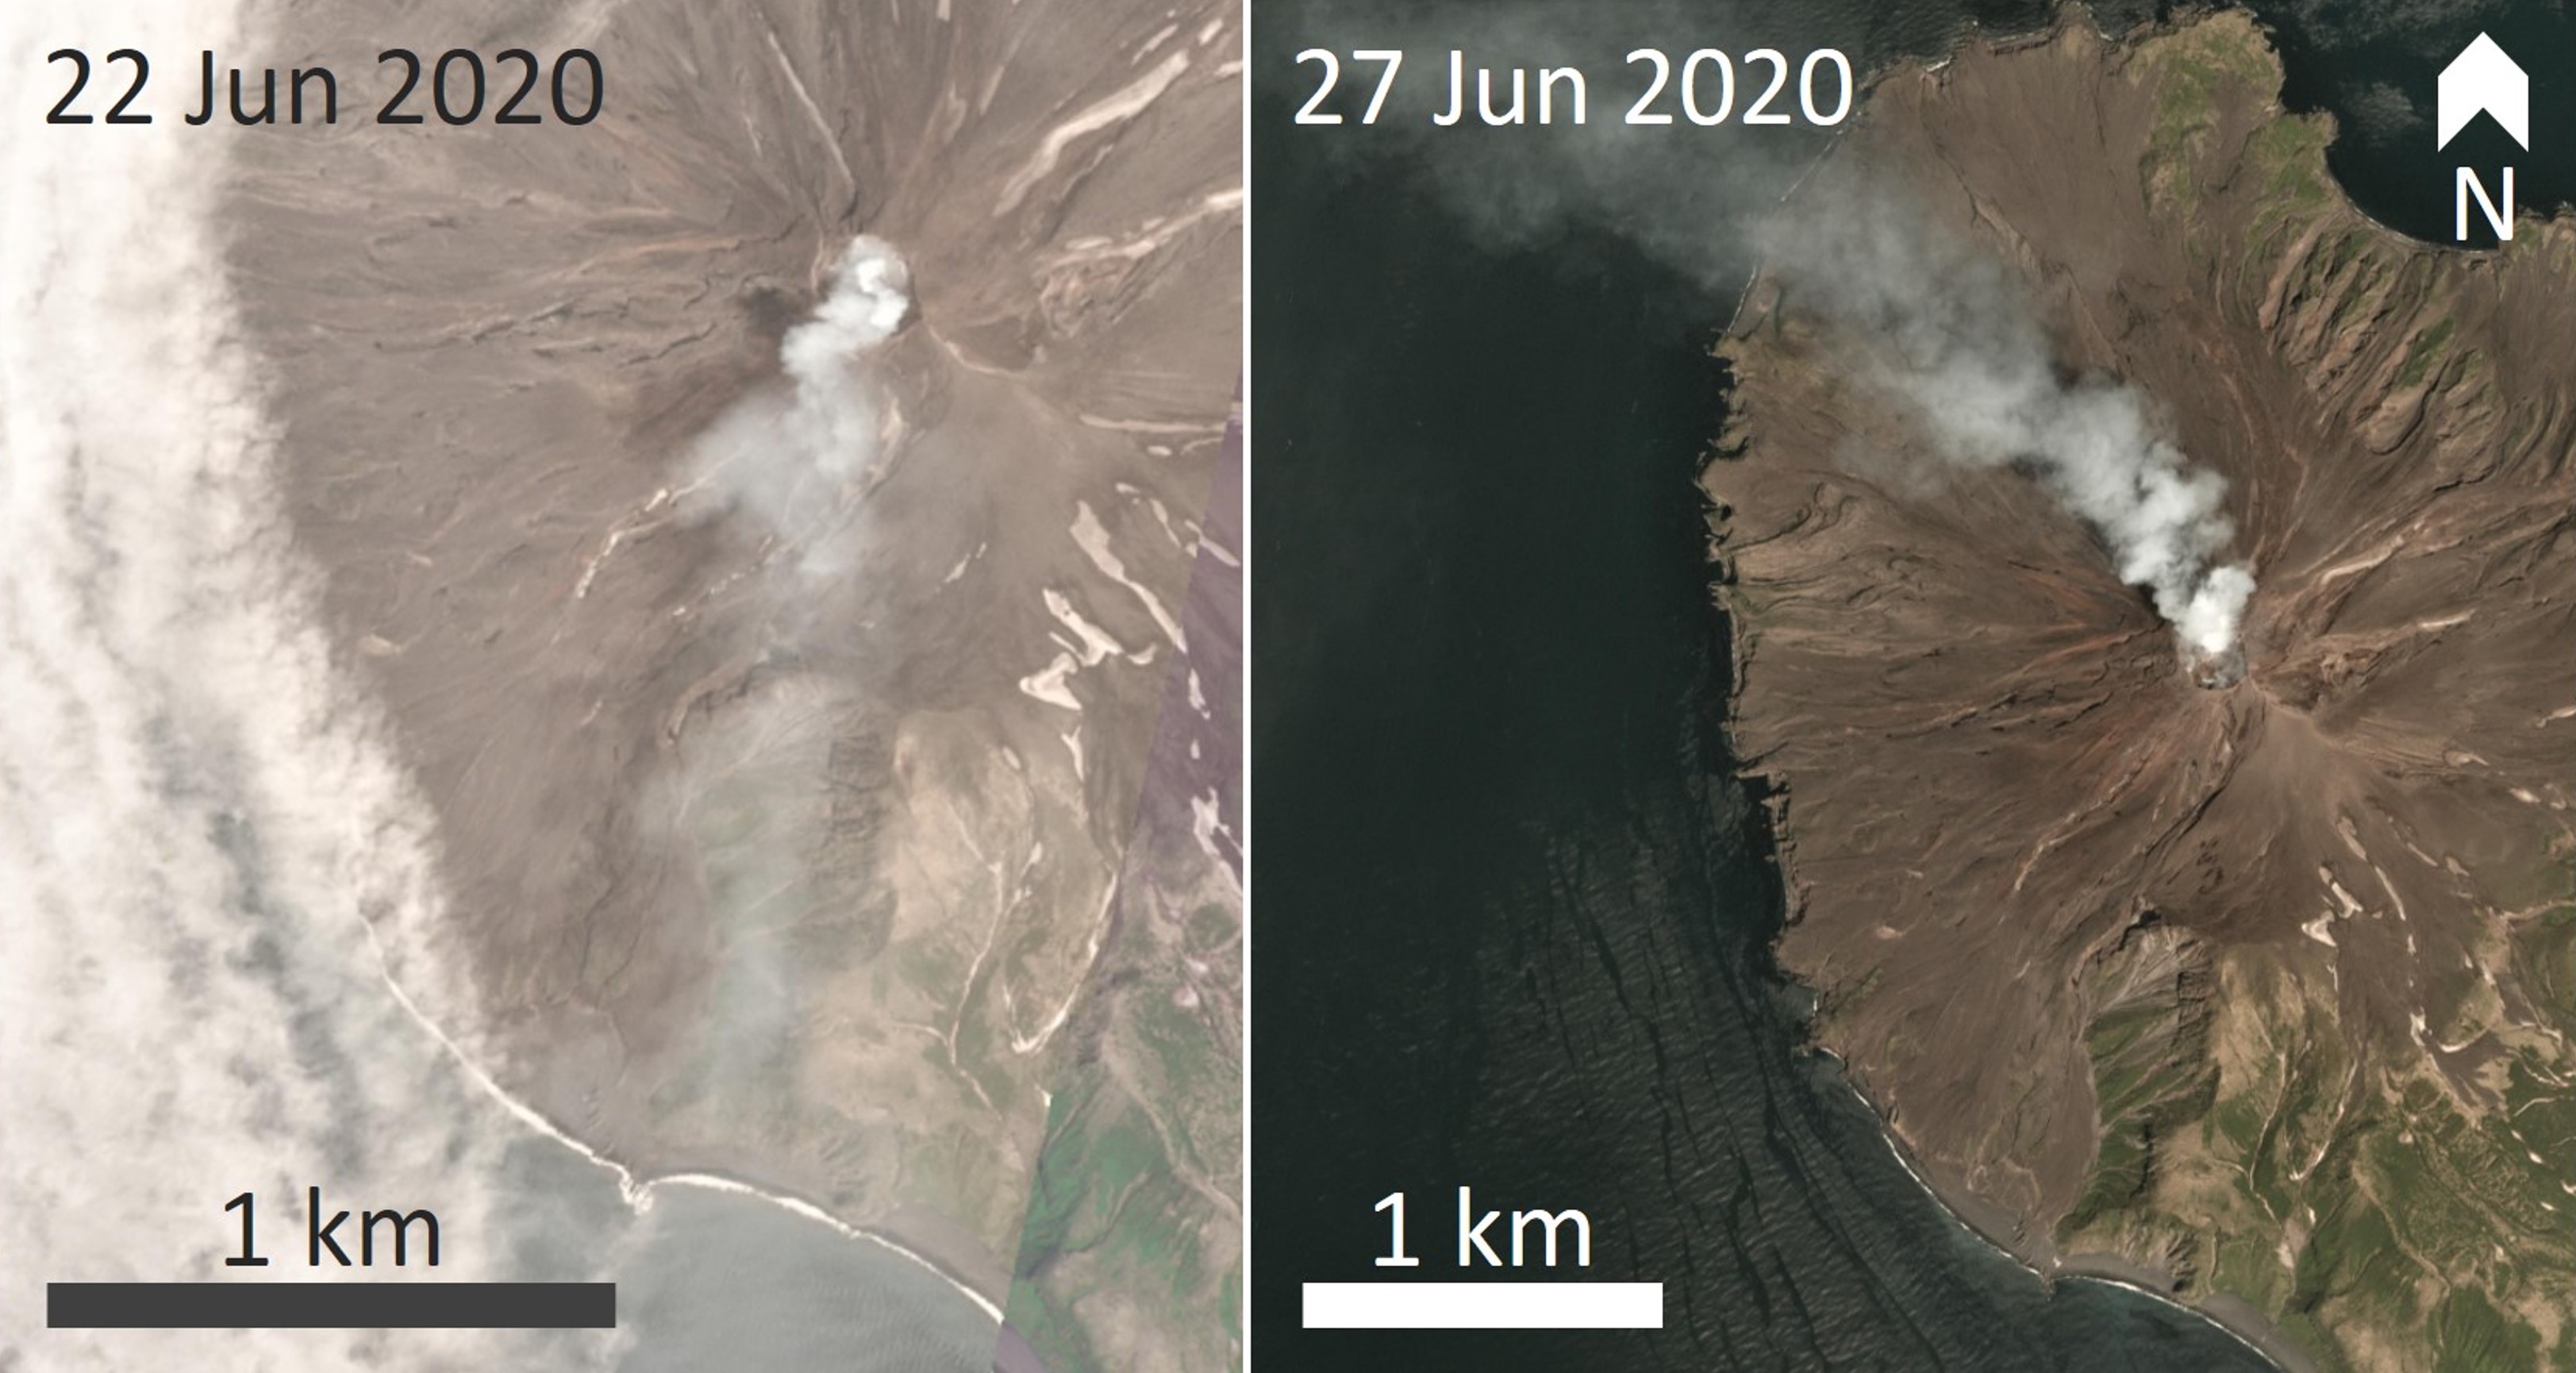
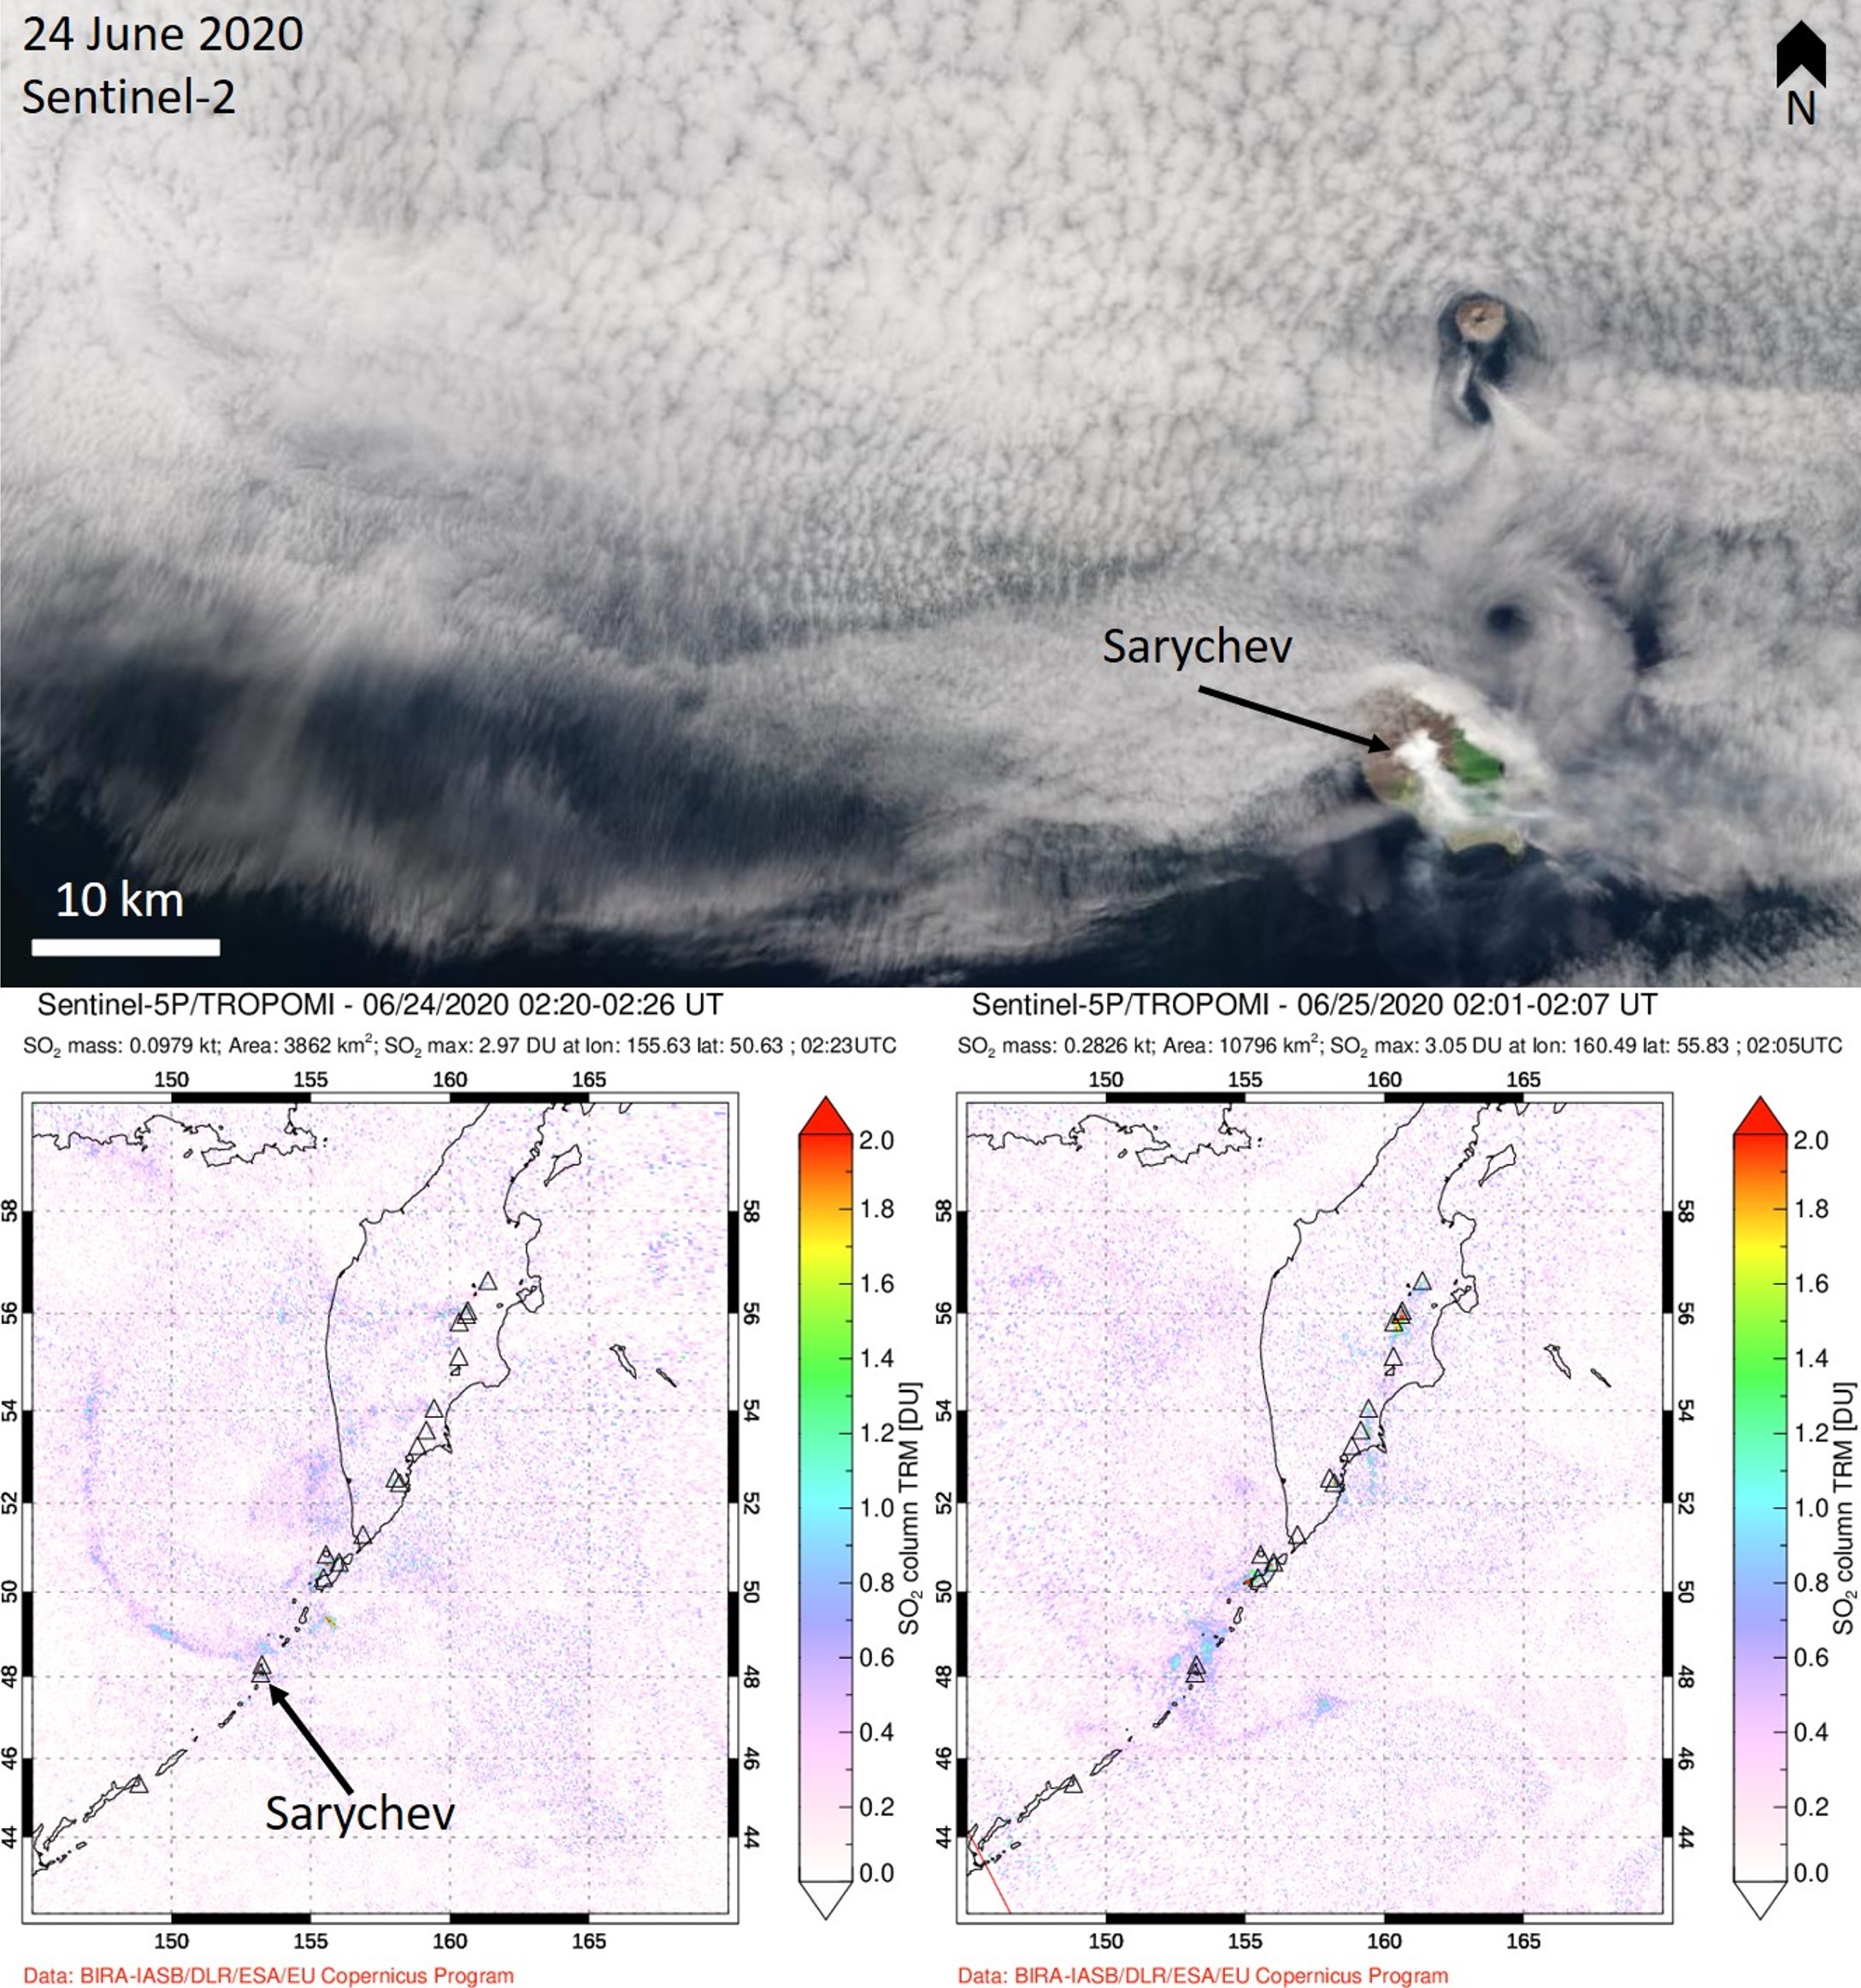
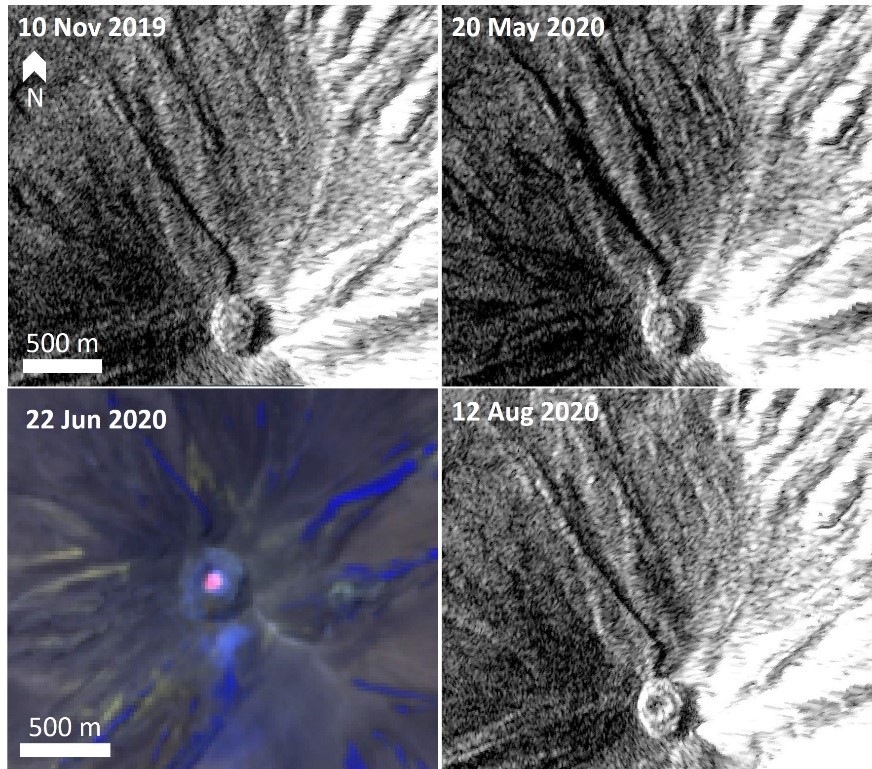
The thermal anomaly on the crater floor continued through May and June, with cloud-free images showing the same area of elevated temperature as the previous months. By 20 May 2019 data from Sentinel-1 Synthetic Aperture Radar (SAR) showed morphological change in the crater associated with the area of high temperature, and this change continued through June. The TROPOspheric Monitoring Instrument (TROPOMI) detected sulfur dioxide (SO2) content within the plume on 27 May (figure 34). Gas-and-steam emission also continued in June, with more substantial plumes visible on 22 and 27 June (figure 35). TROPOMI again detected SO2 on 24 and 25 June; the plume on 24 June was also visible in Sentinel-2 imagery (figure 36).
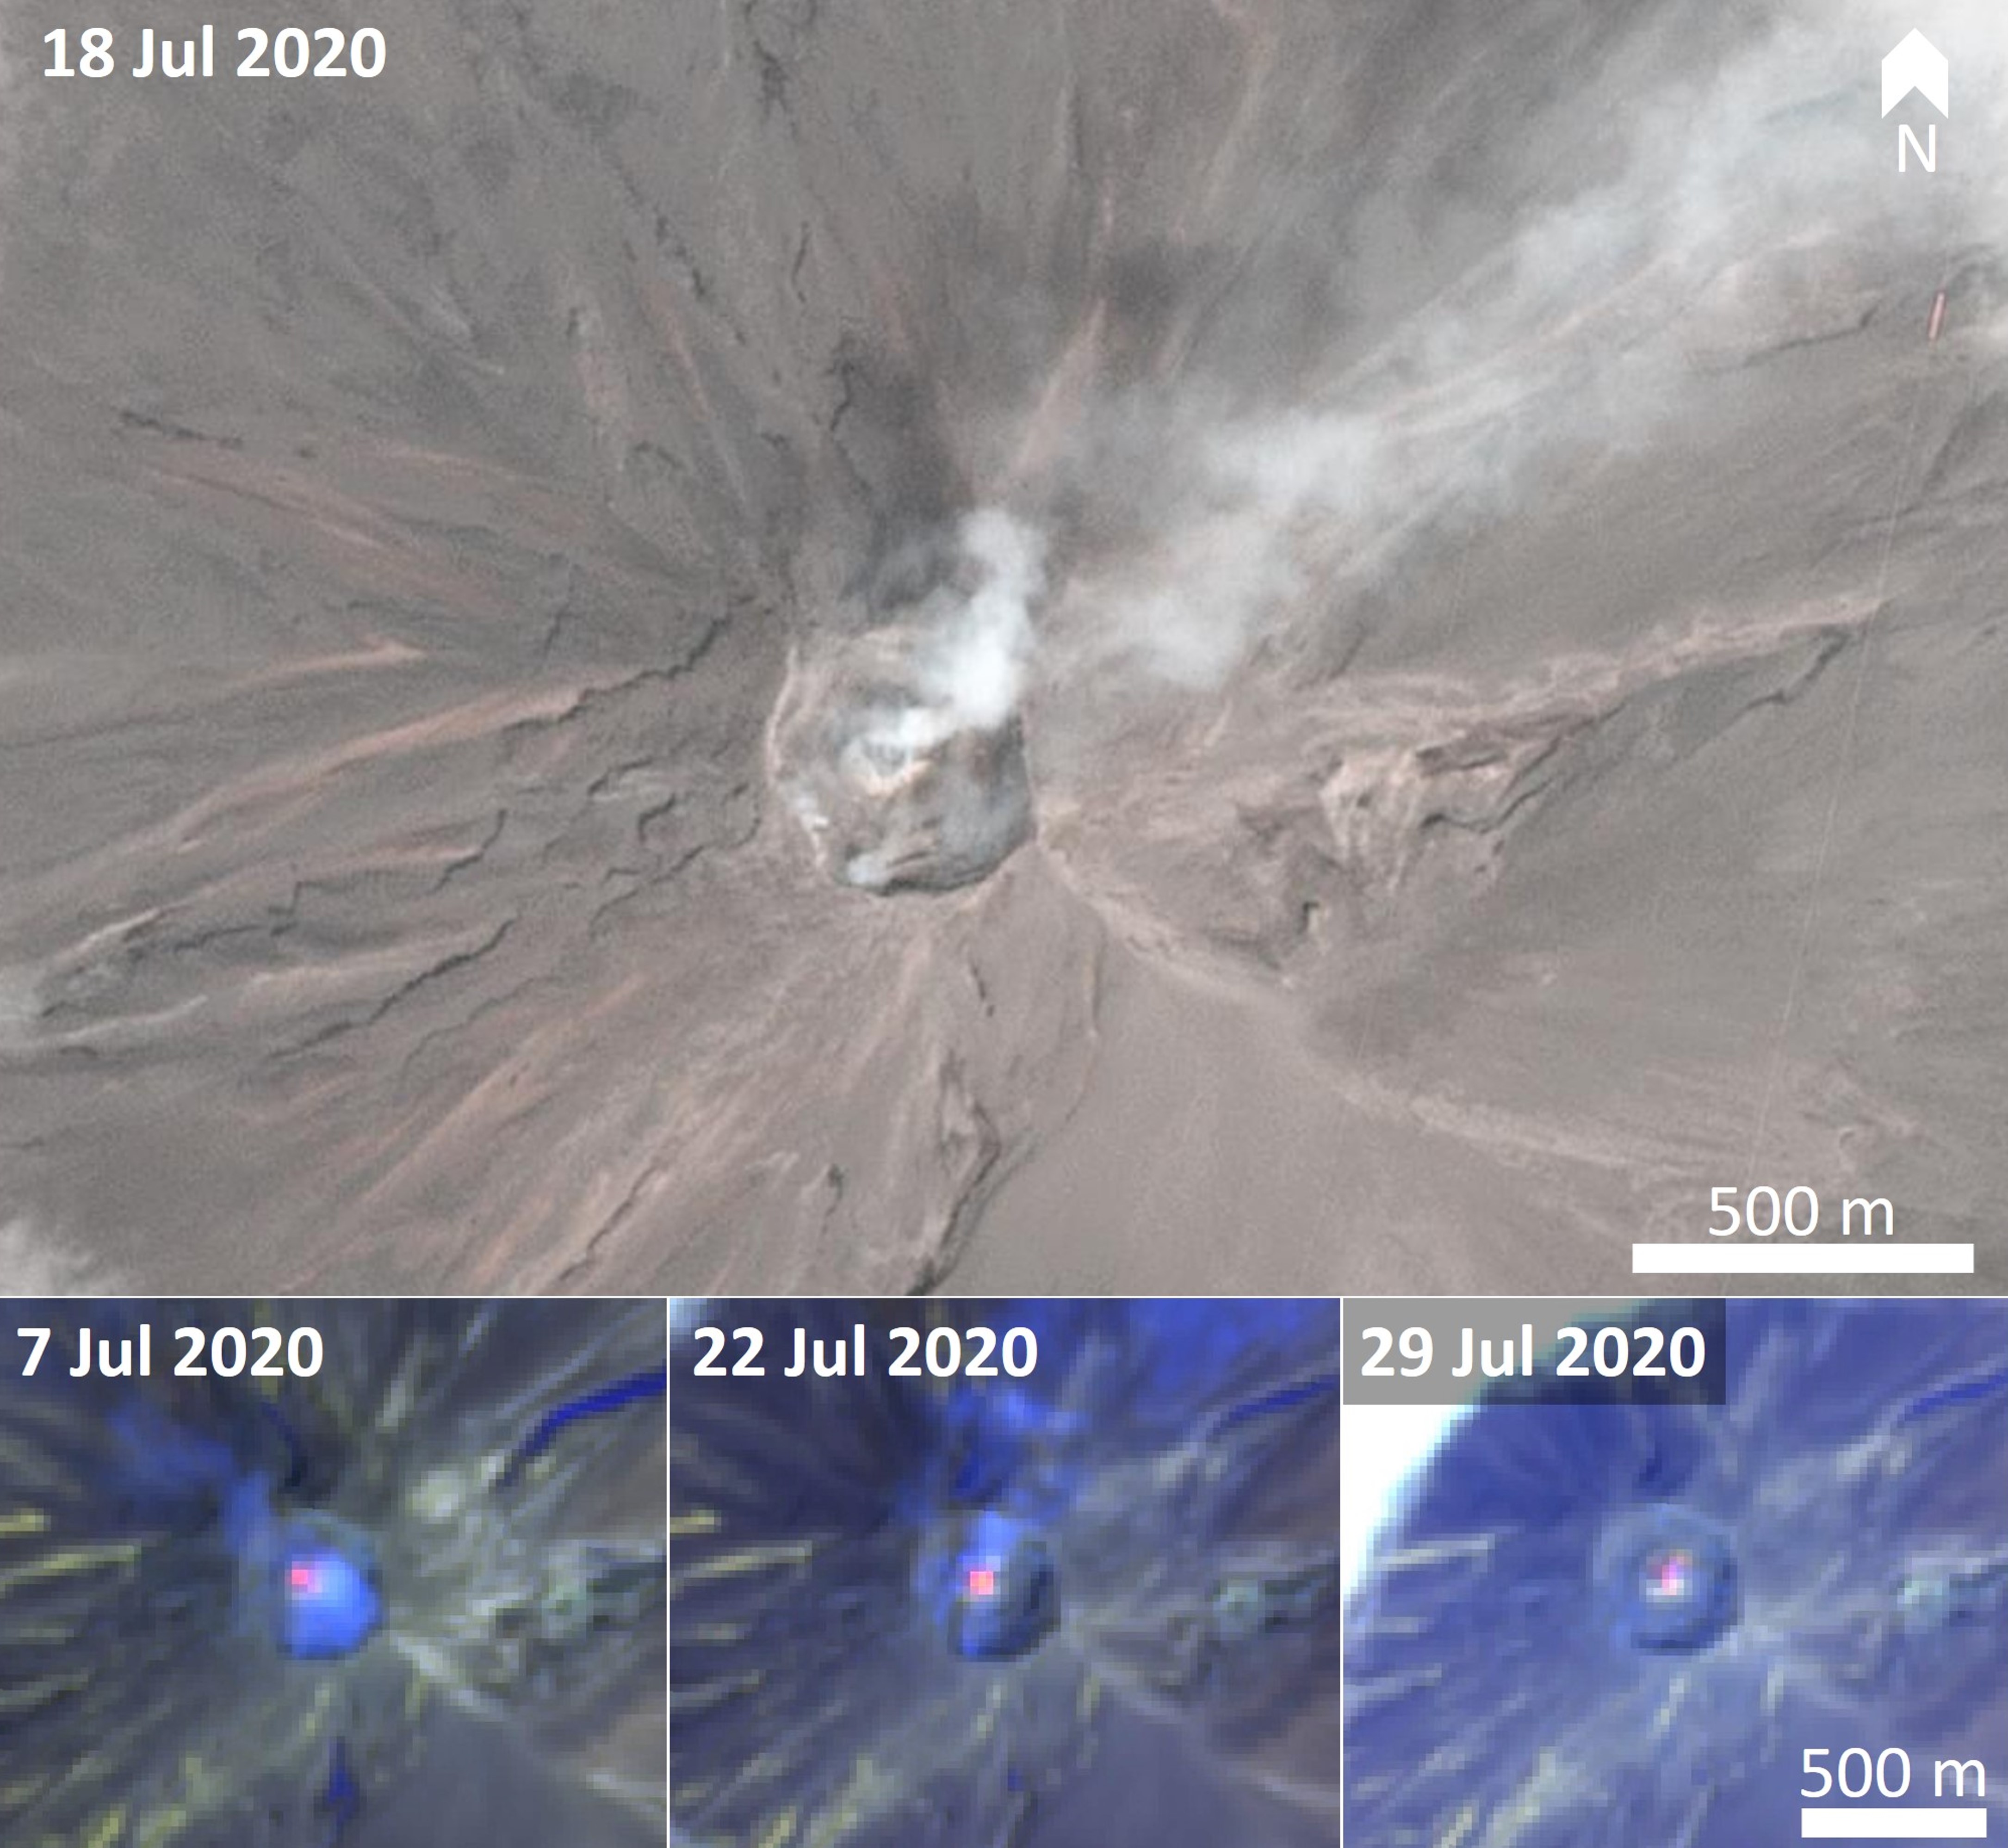
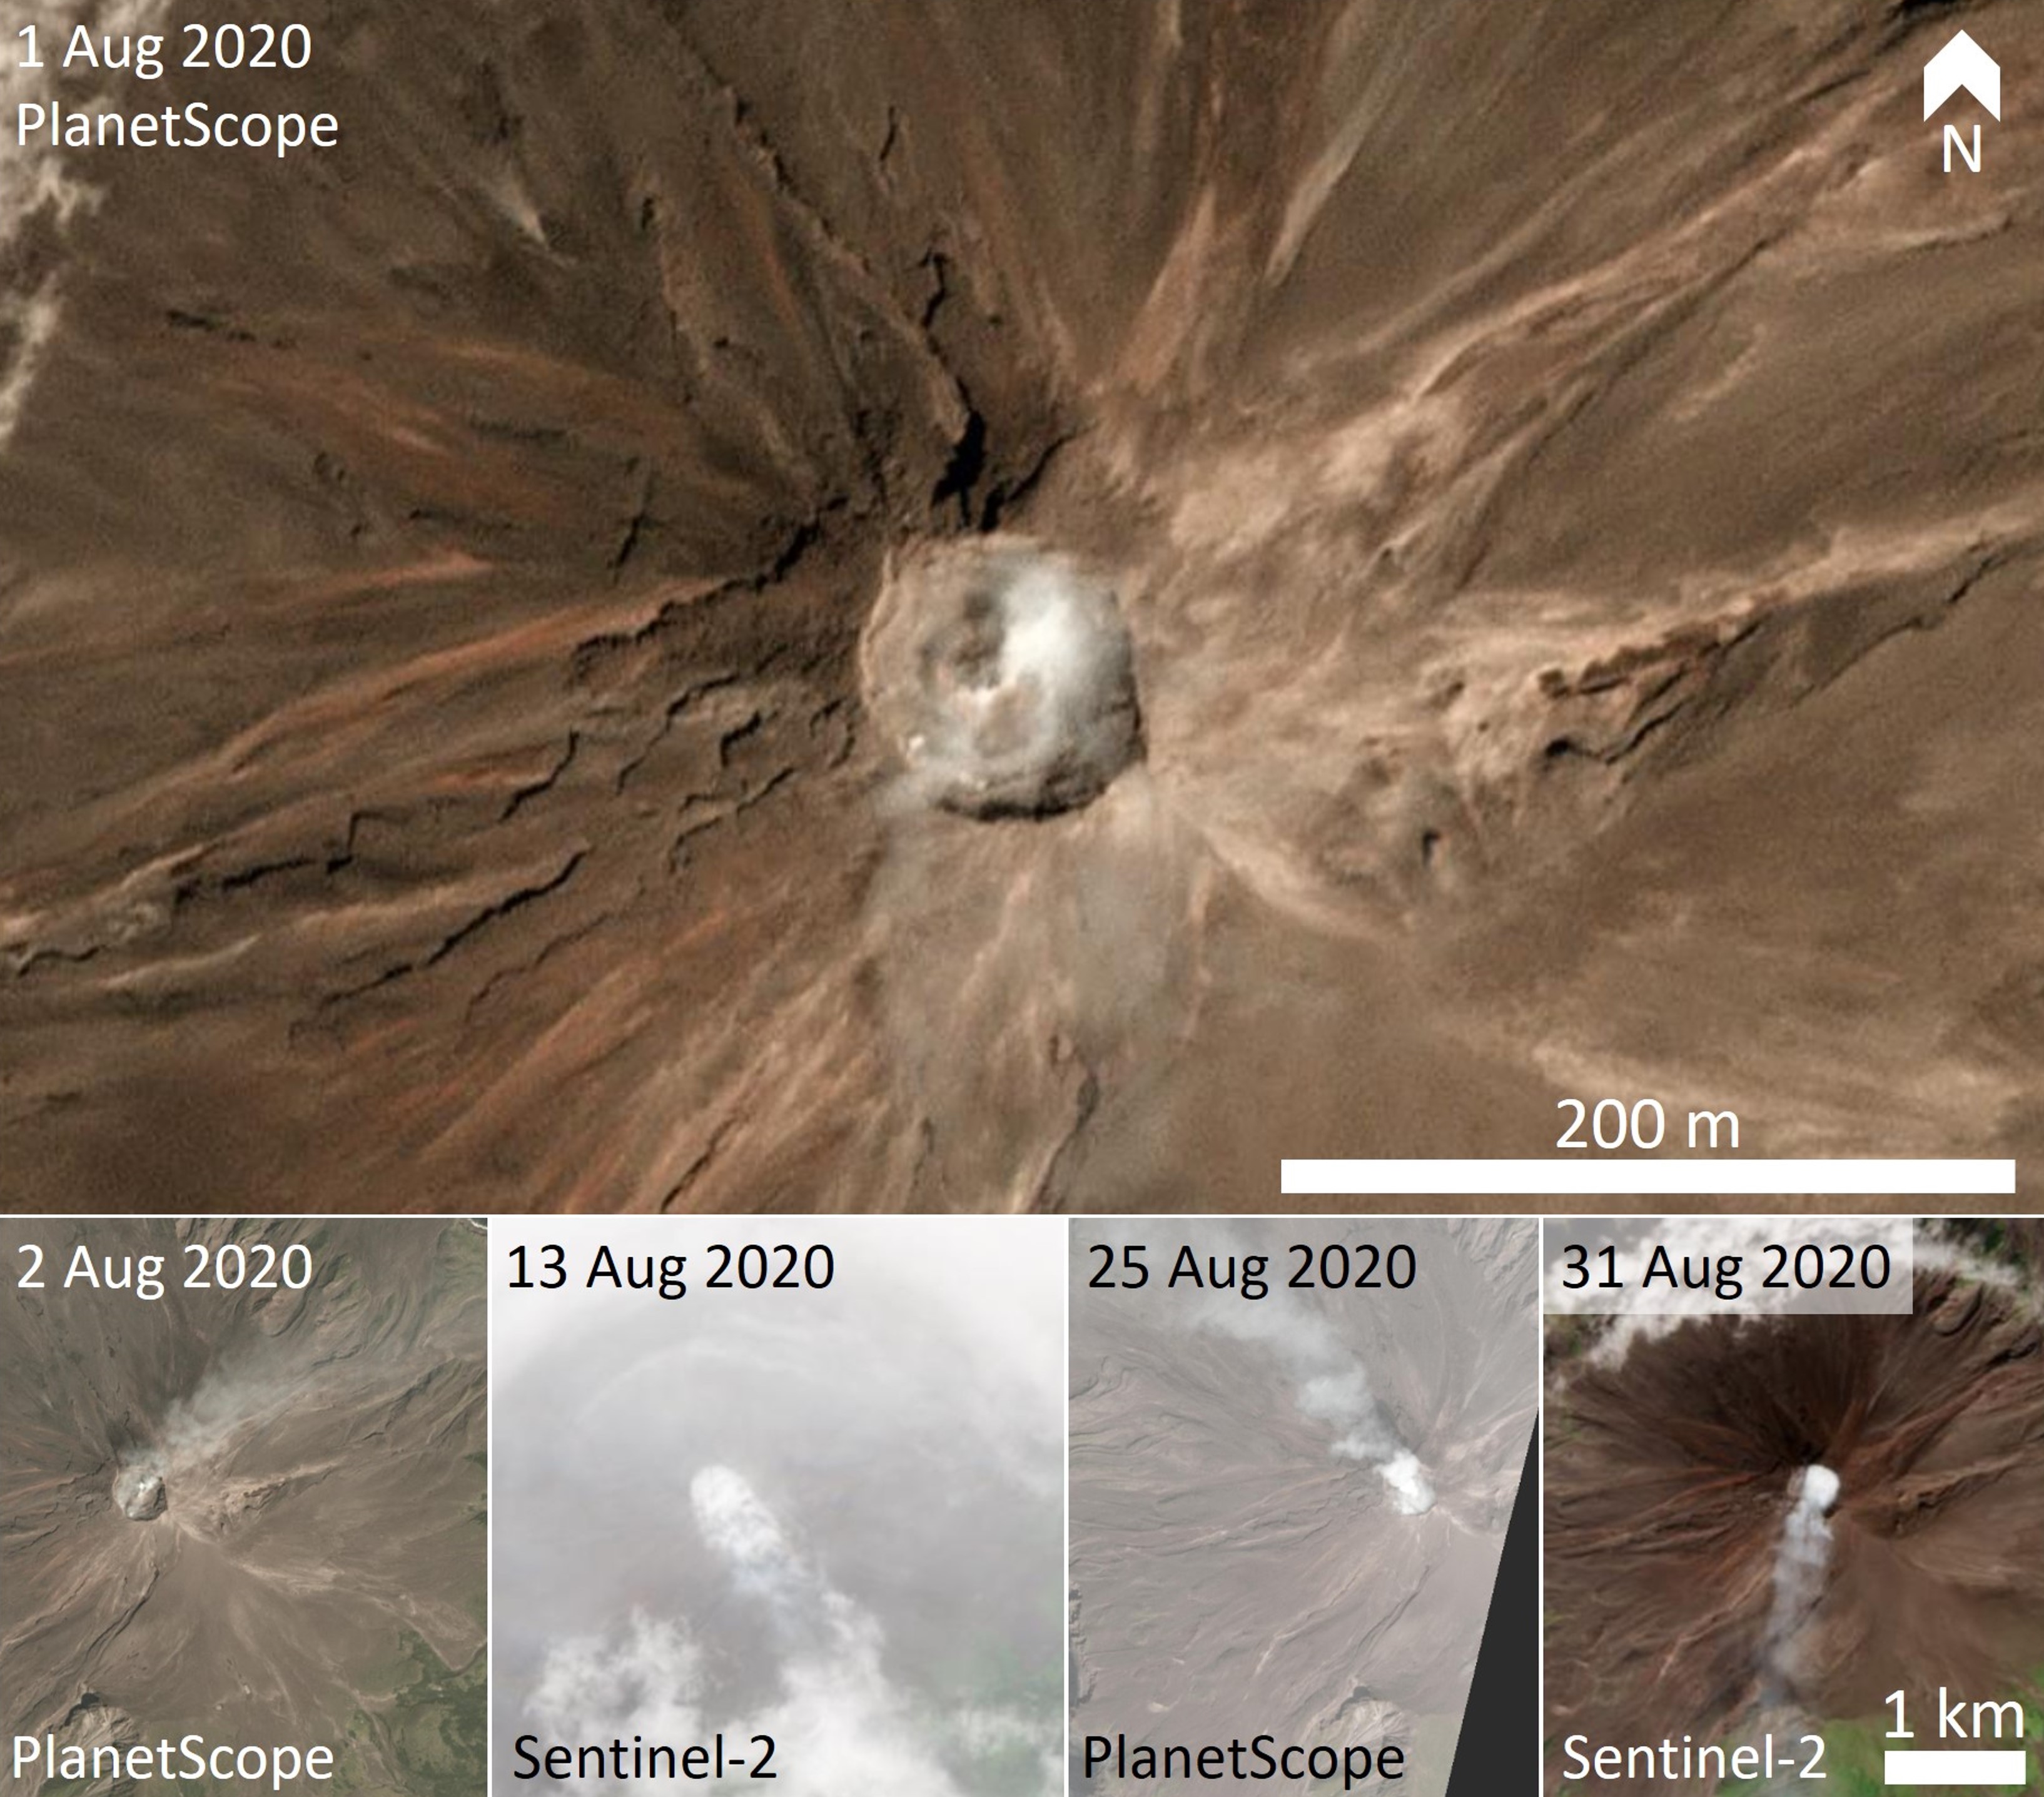
Throughout July satellite data show thermal emission and gas-and-steam emission, mostly within plumes dispersing from the summit crater in different directions and sometimes restricted to within the crater (figure 37). On 18 July a PlanetScope image showed lava extrusion in the crater, at the location of the elevated temperature. Sentinel-2 thermal satellite images showed weak thermal energy detected in the same location during August, and degassing continued (figure 38). By 12 August the deformation on the crater floor was clear in SAR data (figure 39), matching the PlanetScope and Sentinel-2 data. From 21 August through to 12 October there was a reduction in thermal energy detected in Sentinel-2 TIR data, with many days not having clear views of the crater floor. Plume emission continued throughout this time. There were no images showing elevated temperatures during November and December when clouds frequently covered the crater area, and there were also no anomalies detected by the MIROVA system.
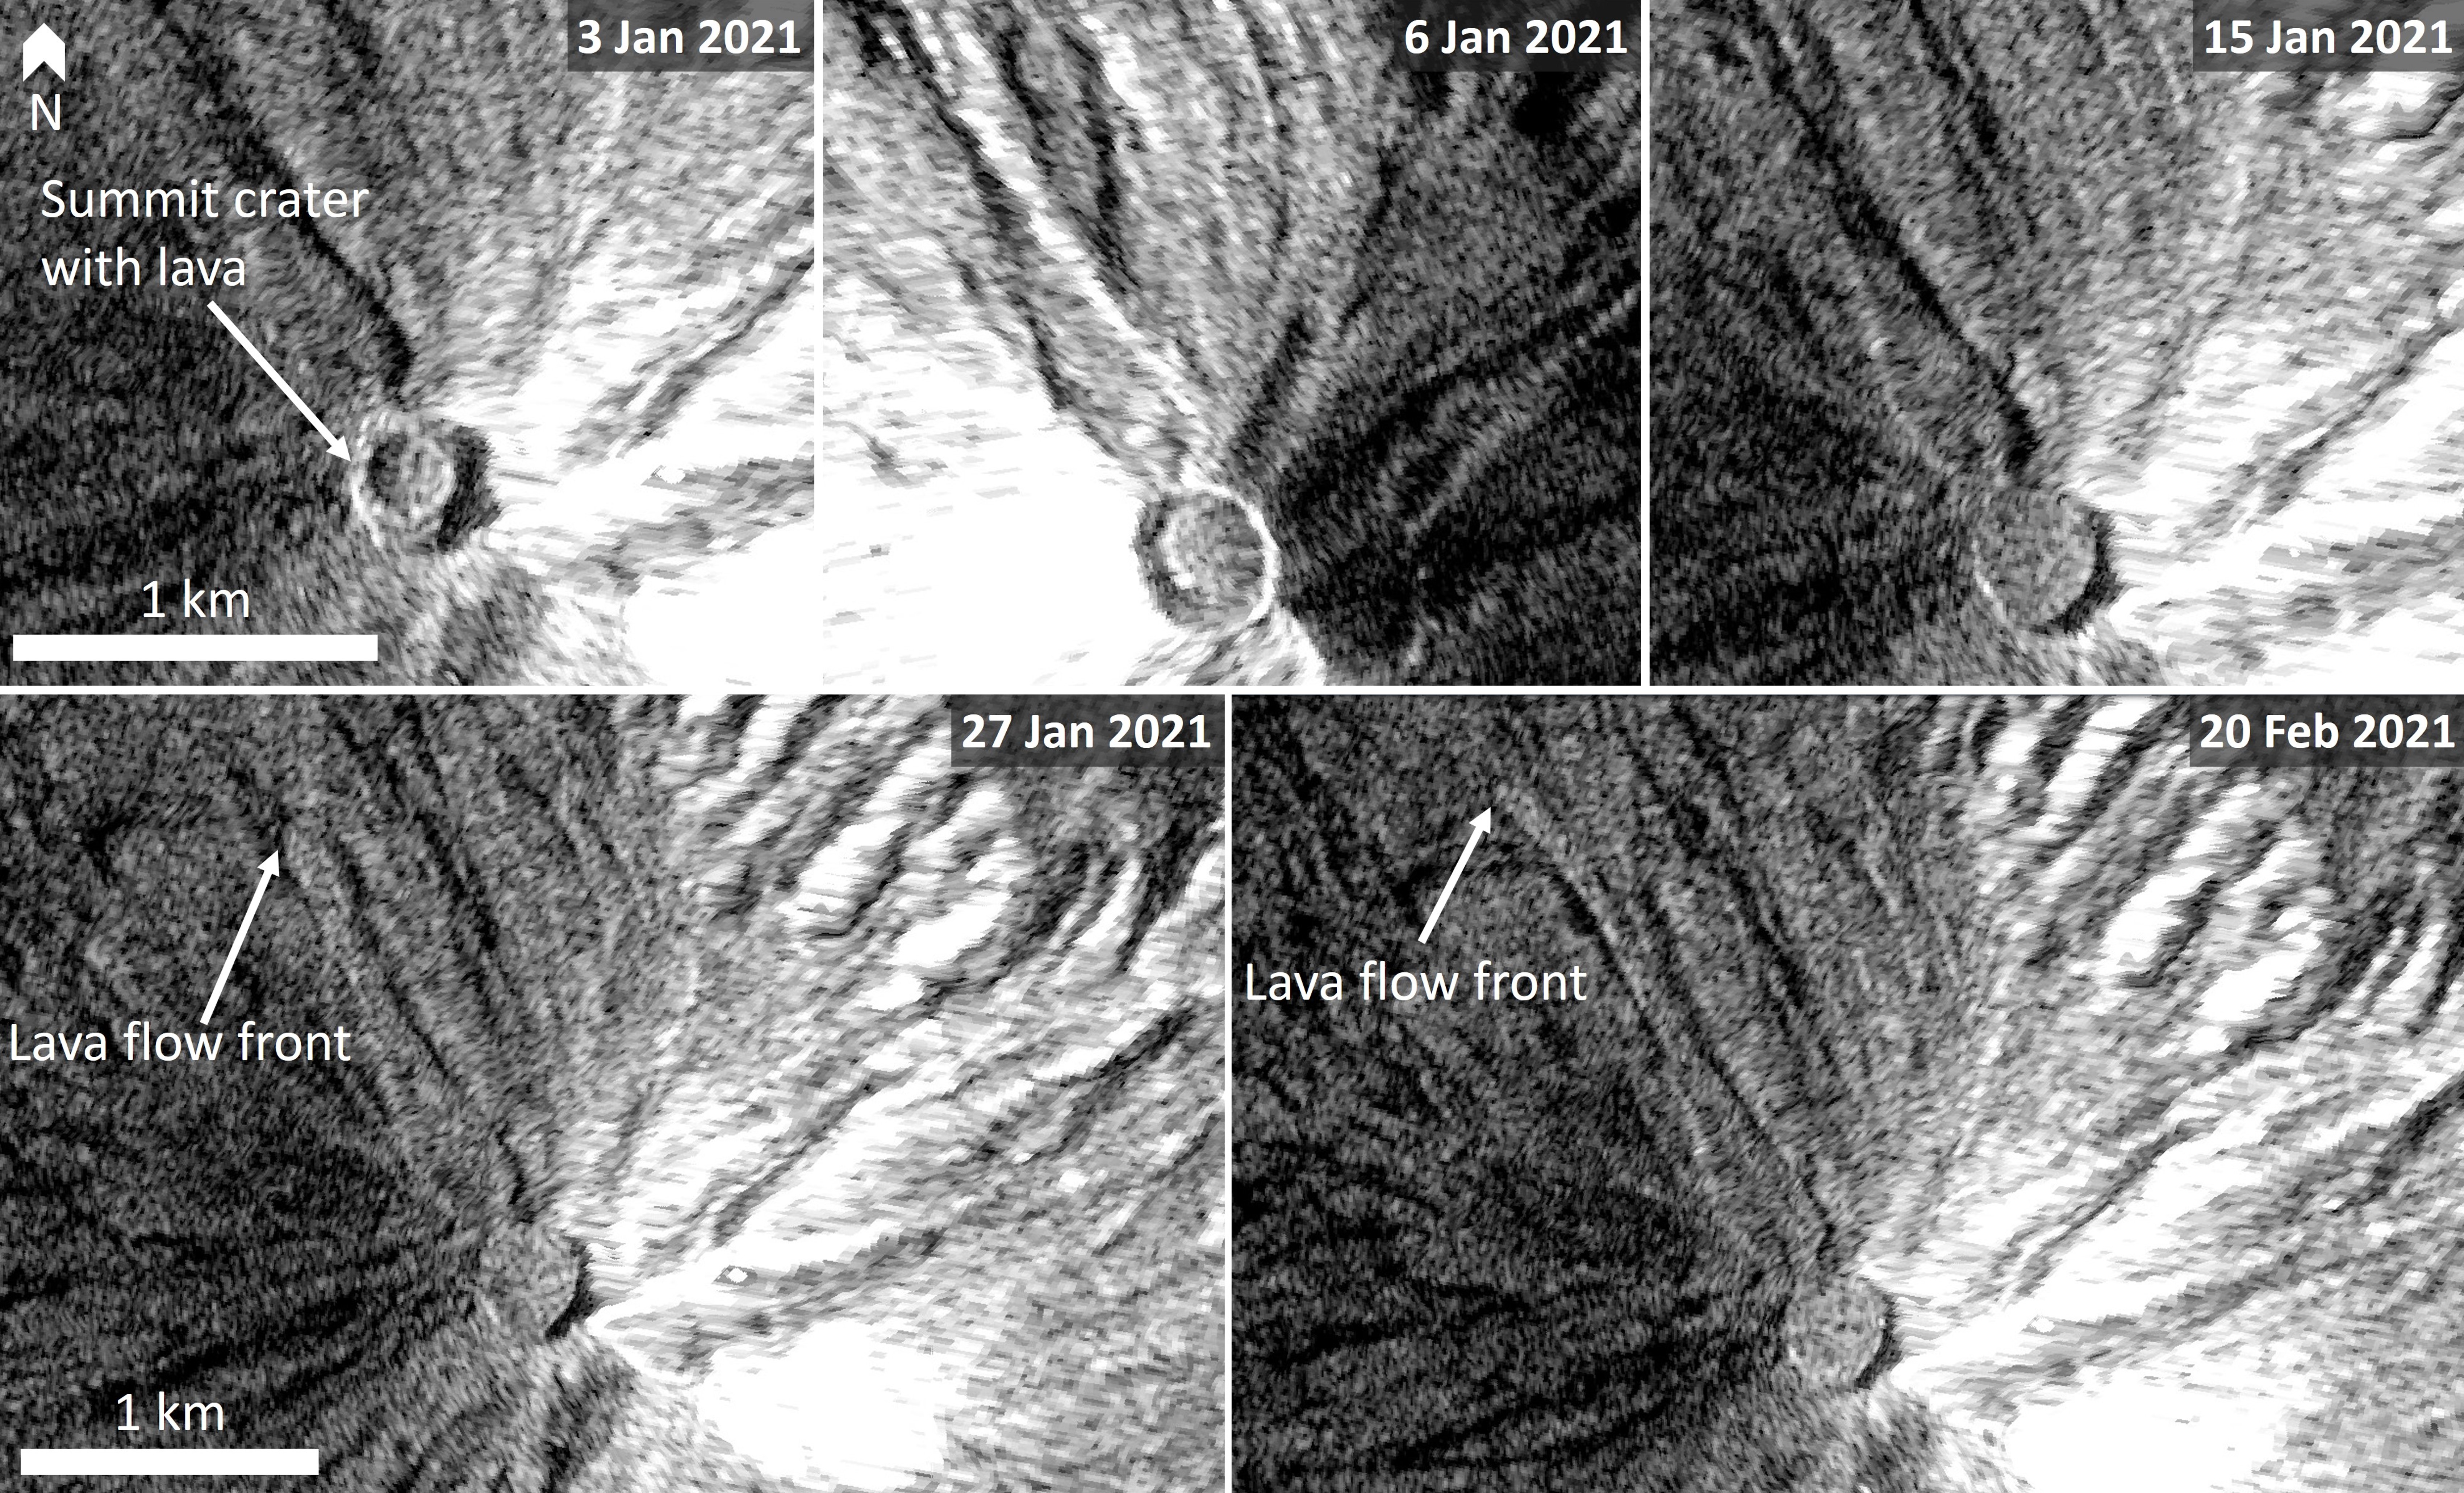
On 11 January 2021 KVERT released a Volcano Observatory Notice for Aviation (VONA) with an elevation of the Aviation Color Code from Green to Yellow. The temperature within the crater had increased above background levels by 79.8°?, indicating that renewed lava extrusion had begun in the crater on the 10th. A gas-and-steam plume extended 36 km NE on the 12th. On 15 January KVERT reported that moderate activity continued, including a gas-and-steam plume that extended 40 km NE. SAR data through January shows the lava volume increasing before flowing over the NW rim and down a preexisting channel on the flank (figure 40). KVERT reported that a lava flow on the northern flank had reached 400 m by the 20th. Lava extrusion with associated moderate gas and steam emission continued throughout the month.
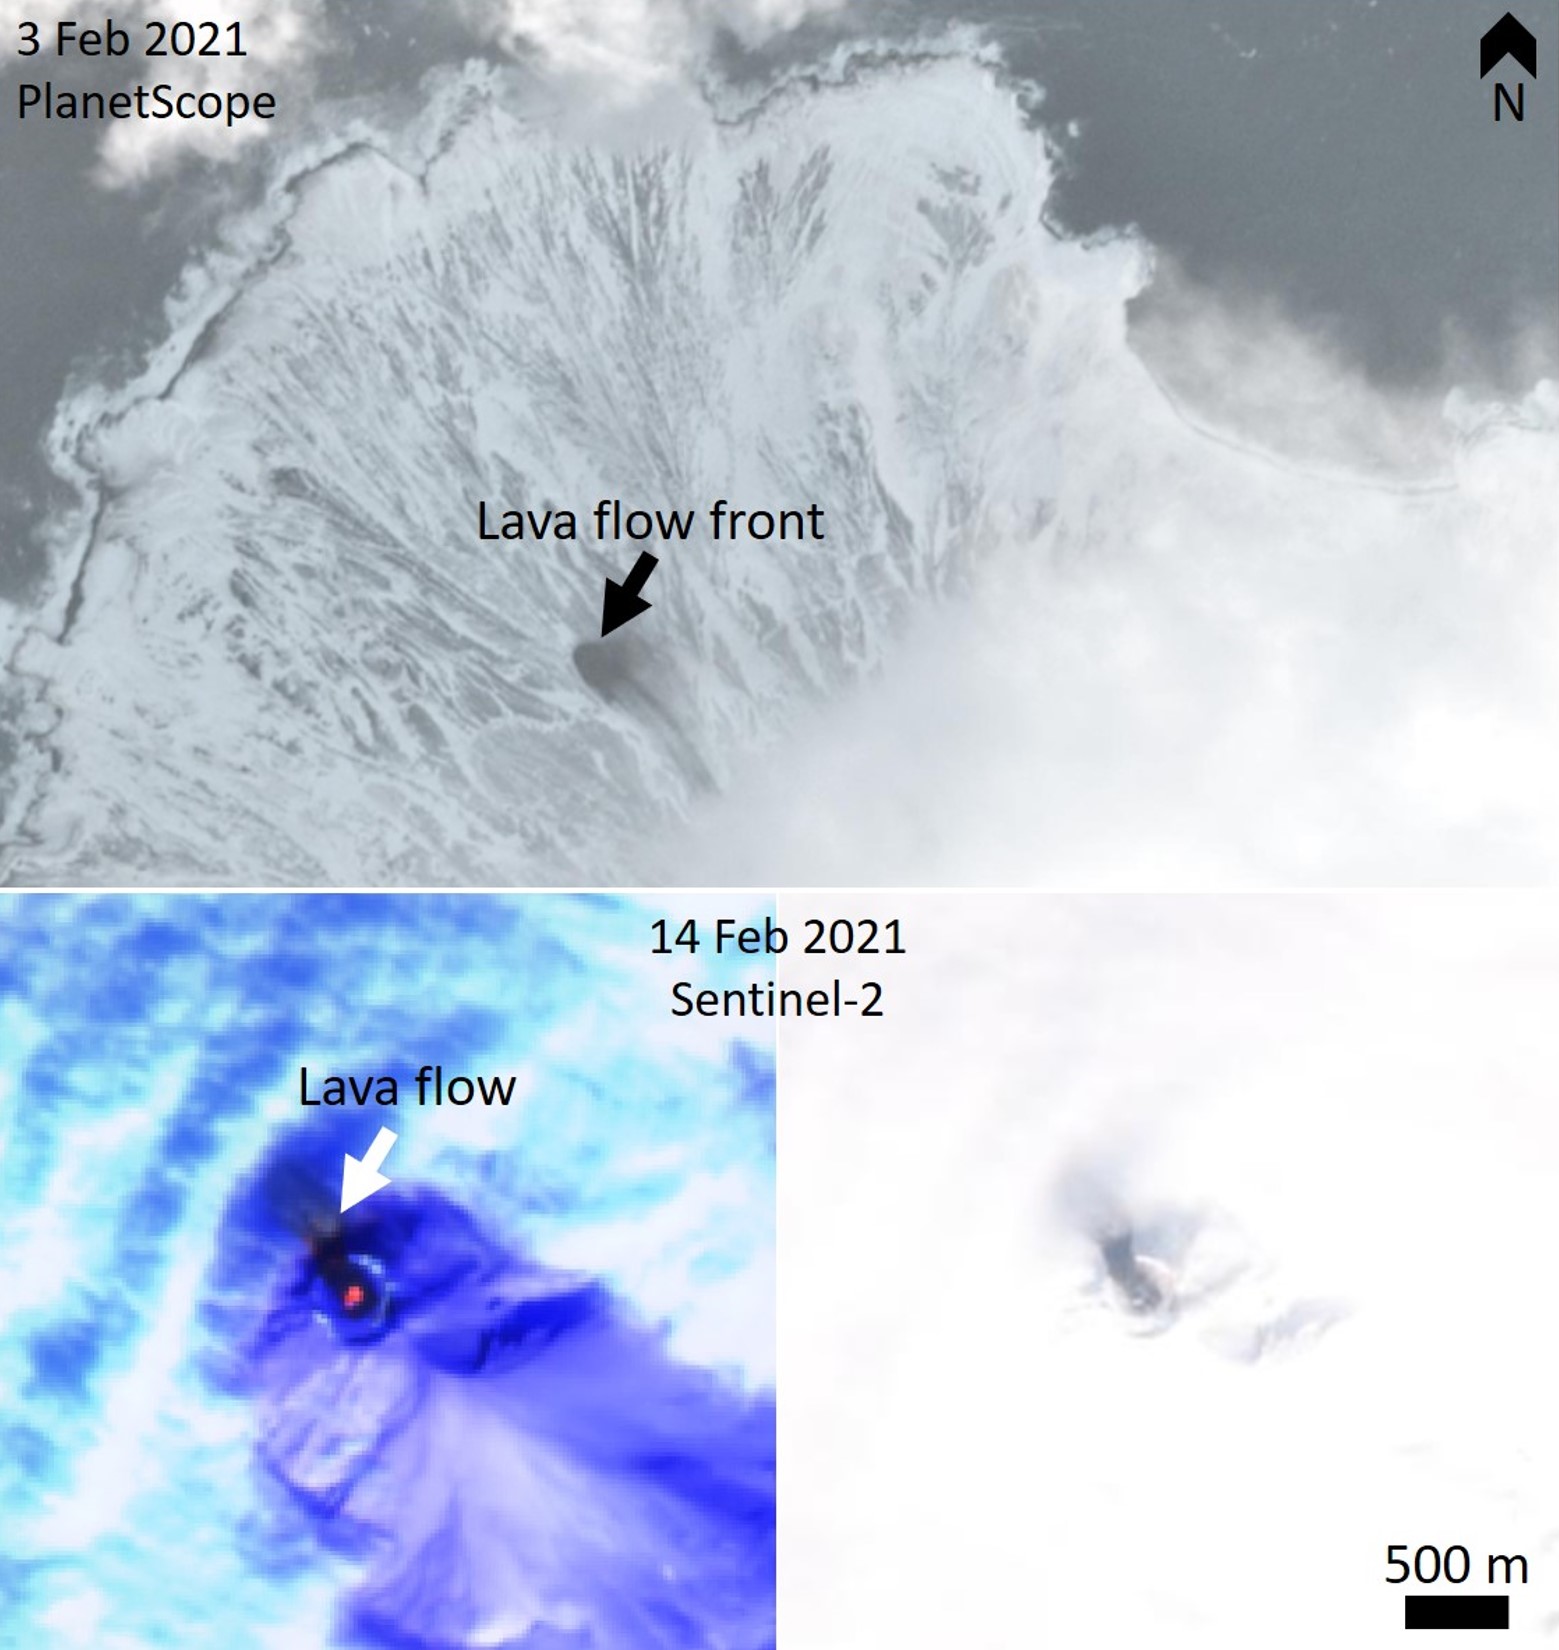
A 3 February satellite image of the NW flank showed that the lava flow front had reached approximately 1.9 km from the crater rim where it had overflowed (figure 41). The Aviation Color Code was lowered to Green on the 18th with KVERT reporting that the eruption had ended, though thermal anomalies and gas-and-steam emission continued.
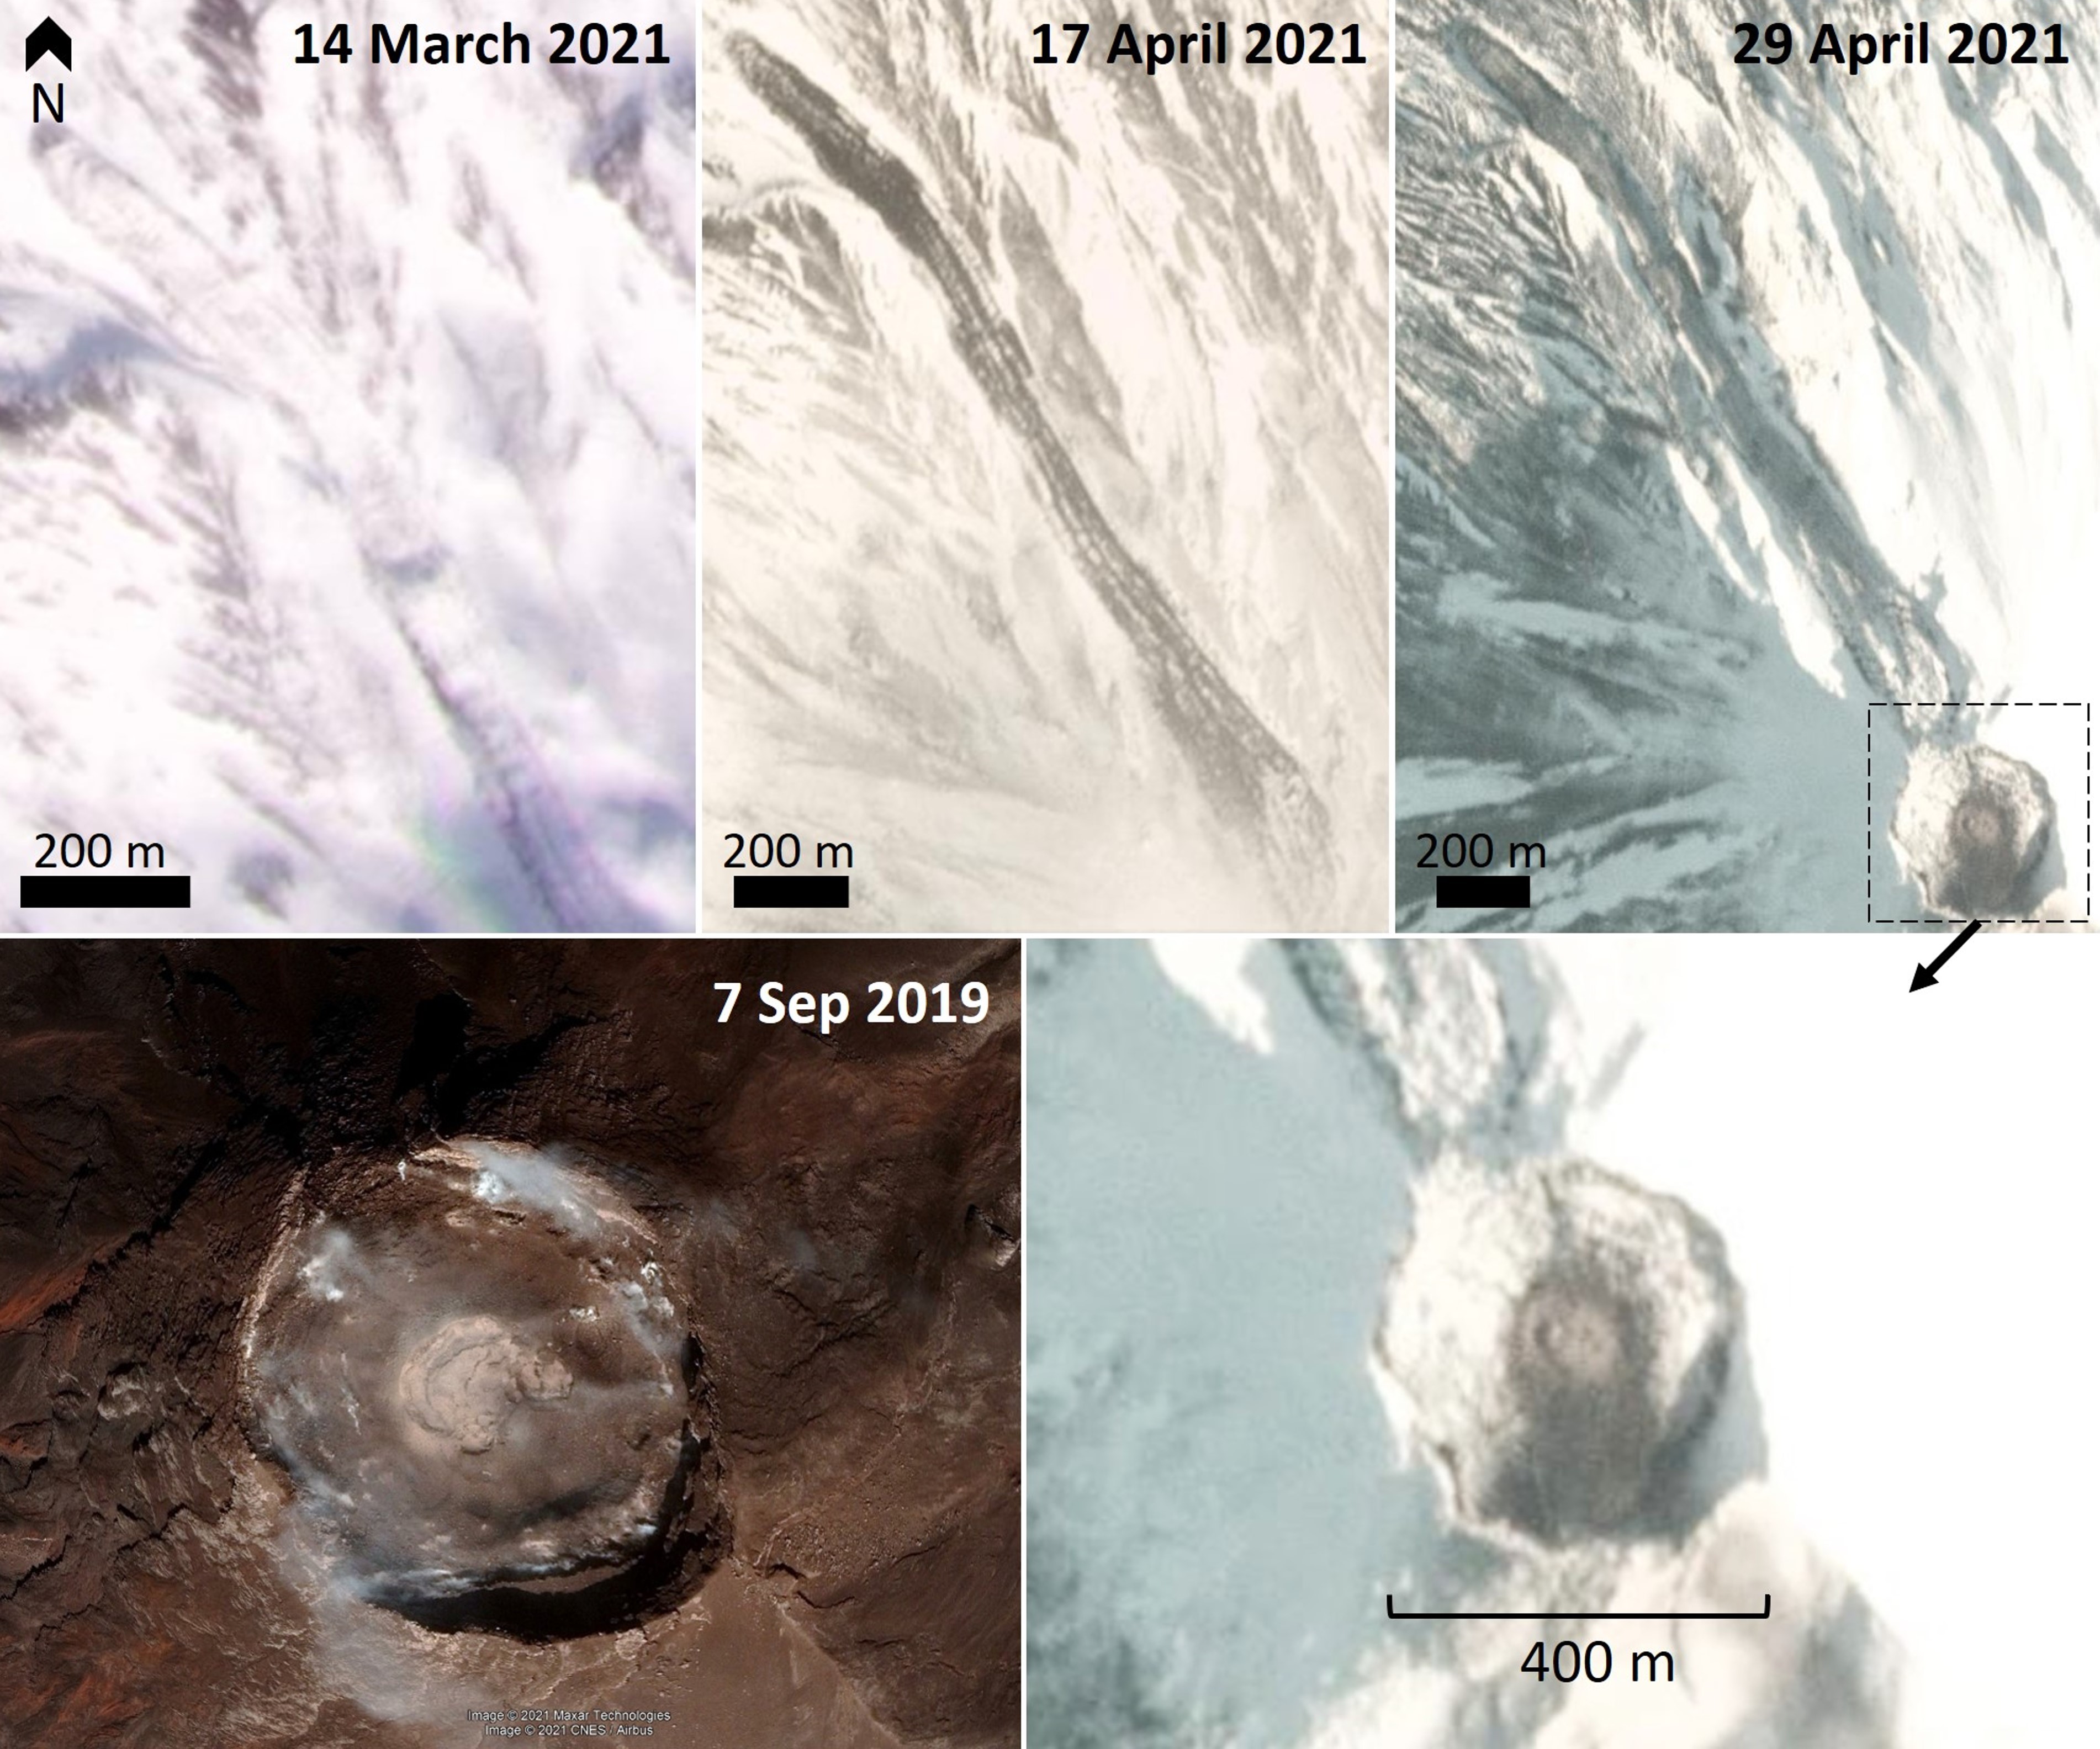
Satellite images of the lava flow acquired during March and April show the narrow lava lobe with pressure ridges and levees (figure 42). A comparison between a September 2019 satellite image and a clear 29 April 2021 image shows the change to the crater after the lava emplacement. The last Sentinel-2 image acquired within this period showing elevated temperatures within the crater was on 19 March and there was no more thermal energy detected by the MIROVA system by early February.
Geological Summary. Sarychev Peak, one of the most active volcanoes of the Kuril Islands, occupies the NW end of Matua Island in the central Kuriles. The andesitic central cone was constructed within a 3-3.5-km-wide caldera, whose rim is exposed only on the SW side. A dramatic 250-m-wide, very steep-walled crater with a jagged rim caps the volcano. The substantially higher SE rim forms the 1496 m high point of the island. Fresh-looking lava flows, prior to activity in 2009, had descended in all directions, often forming capes along the coast. Much of the lower-angle outer flanks of the volcano are overlain by pyroclastic-flow deposits. Eruptions have been recorded since the 1760s and include both quiet lava effusion and violent explosions. Large eruptions in 1946 and 2009 produced pyroclastic flows that reached the sea.
Information Contacts: Sakhalin Volcanic Eruption Response Team (SVERT), Institute of Marine Geology and Geophysics, Far Eastern Branch, Russian Academy of Science, Nauki st., 1B, Yuzhno-Sakhalinsk, Russia, 693022 (URL: http://www.imgg.ru/en/, http://www.imgg.ru/ru/svert/reports); Kamchatka Volcanic Eruptions Response Team (KVERT), Far Eastern Branch, Russian Academy of Sciences, 9 Piip Blvd., Petropavlovsk-Kamchatsky, 683006, Russia (URL: http://www.kscnet.ru/ivs/kvert/); Global Sulfur Dioxide Monitoring Page, Atmospheric Chemistry and Dynamics Laboratory, NASA Goddard Space Flight Center (NASA/GSFC), 8800 Greenbelt Road, Goddard, Maryland, USA (URL: https://so2.gsfc.nasa.gov/); MIROVA (Middle InfraRed Observation of Volcanic Activity), a collaborative project between the Universities of Turin and Florence (Italy) supported by the Centre for Volcanic Risk of the Italian Civil Protection Department (URL: http://www.mirovaweb.it/); Sentinel Hub Playground (URL: https://www.sentinel-hub.com/explore/sentinel-playground); Planet Labs, Inc. (URL: https://www.planet.com/); Google Earth (URL: https://www.google.com/earth/).