Report on Veniaminof (United States) — May 2021
Bulletin of the Global Volcanism Network, vol. 46, no. 5 (May 2021)
Managing Editor: Edward Venzke.
Edited by Kadie L. Bennis. Research and preparation by Paul Berger.
Veniaminof (United States) New eruption during February-April 2021 with ash plumes from summit and flank vents
Please cite this report as:
Global Volcanism Program, 2021. Report on Veniaminof (United States) (Bennis, K.L., and Venzke, E., eds.). Bulletin of the Global Volcanism Network, 46:5. Smithsonian Institution. https://doi.org/10.5479/si.GVP.BGVN202105-312070
Veniaminof
United States
56.17°N, 159.38°W; summit elev. 2507 m
All times are local (unless otherwise noted)
Veniaminof, located on the Alaskan Peninsula, is truncated by a steep-walled, 8 x 11 km, glacier-filled caldera that formed around 3,700 years ago. There have been 14 eruptions over the past 38 years. It is monitored by the Alaska Volcanic Observatory (AVO) and the Anchorage Volcanic Ash Advisory Center (VAAC). A new eruption began in late February 2021 after more than a year of inactivity following an eruption during September-December 2018 which included Strombolian activity, an 800-m-long lava flow, and minor ash emissions (BGVN 44:01). This latest eruption that began in late February 2021 included thermal activity from two vents and ended in early April 2021.
Observations during 2019-2020. According to AVO, eruptive activity had significantly declined by the end of December 2018, but unrest characterized by seismic events continued into January 2019. During 1-3 January seismic tremor was at a low level and surface temperatures were slightly elevated, indicative of cooling lava. On 4 January AVO reduced the Aviation Color Code (ACC) to Yellow (the third highest level on a four-color scale) and the Volcanic Alert Level (VAL) to Advisory after satellite images showed that the extent of the lava flow in the summit caldera had not changed since late December 2018 and thermal images showed greatly reduced intensity.
Seismic tremor and occasional weak gas-and-steam emissions continued through April 2019, along with weakly elevated surface temperatures. On 30 April AVO lowered the ACC to Green and the VAL to Normal following four months of decreasing unrest, though low-level tremor, slightly elevated surface temperatures, and weak gas-and-steam emissions continued. Pilot reports of gas-and-steam emissions on 1 August coincided with low-level tremor, but by 25 August activity had returned to background levels.
AVO did not report further indications of unrest until 18 June 2020, when there was an increase in seismicity. Periods of low-amplitude seismic tremor decreased in frequency during 19-20 June and were not detected by the 21st. Minimal activity continued through early August.
Activity during January-April 2021. Analysis of satellite, webcam, and regional infrasound data by AVO suggested that new eruptive activity occurred on 28 February 2021, initially characterized by increased sulfur dioxide emissions, followed by elevated surface temperatures. A small melt pit was forming in the glacier above the flank vent. At 0513 on 4 March infrasound sensors recorded a small explosion and subsequent continuous low-level ash emissions, prompting AVO to raise the ACC to Orange and the VAL to Watch. A low-level ash plume rose to an altitude less than 3 km and drifted SSE was visible in satellite and webcam images; minor ash deposits were visible at the summit. Weak emissions continued at least through 1048 that day. On 5 March sulfur dioxide emissions were visible in a webcam image.
Numerous small explosions were recorded during 6-7 March, some of which were heard and felt by residents in Perryville (35 km SE). Elevated surface temperatures were identified in satellite images, suggesting lava was at or near the surface. During clear weather days, low-level gas-and-ash plumes were visible in satellite and webcam data and observed by pilots. The plumes mainly stayed below an altitude of 3 km, but at times rose as high as 4.6 km and drifted 150 km NE. On 7 March satellite images showed that the emissions originated from a small cone in the summit caldera (figure 35). Additionally, lava was likely effusing under the intra-caldera glacier in an area on the flank about 1 km E of the summit. This area produced incandescence and strongly elevated surface temperatures, as well as a small gas-and-steam plume. During 8-9 March satellite images showed that a small gas-rich plume rose to 4.6 km altitude that extended about 10 km NE.
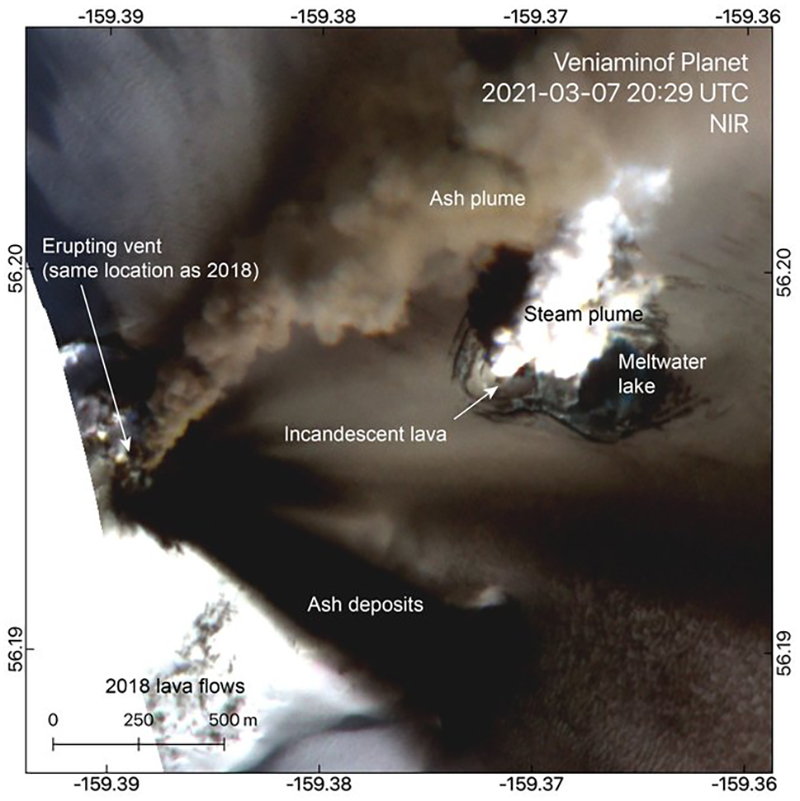 |
Figure 35. High-resolution satellite image of Veniaminof taken on 7 March 2021, showing an ash plume from the erupting vent near the summit and a steam plume from the lava-heated meltwater lake about 1 km E. Tephra was deposited at least 22 km SE and 14 km NE. Image by Hannah Dietterich; courtesy of AVO. |
Explosions during 9-10 March, as detected on geophysical networks, produced ash emissions that rose to an altitude of 2.1-3 km and drifted 200 km NE and SE (figure 36). Ash deposits on the snow were observed up to 20 km from the vent, and gas-and-steam plumes from both vents were visible from the air on 11 March (figure 37). Explosions and ash emissions declined to lower levels after these events, though new ash deposits within the caldera extending as far as 10 km SE were sometimes identified in satellite images. Lava continued to effuse under the intra-caldera glacier in an area on the flank about 1 km E of the cone’s summit. Elevated surface temperatures over this area were identified in infrared satellite data during most days, along with gas-and-steam plumes and a broadening collapse pit in the ice. Data from local seismic stations were back online by 12 March and showed elevated seismicity and tremor through 15 March. During 15-16 March gas-and-steam and-ash plumes were again identified in satellite images.
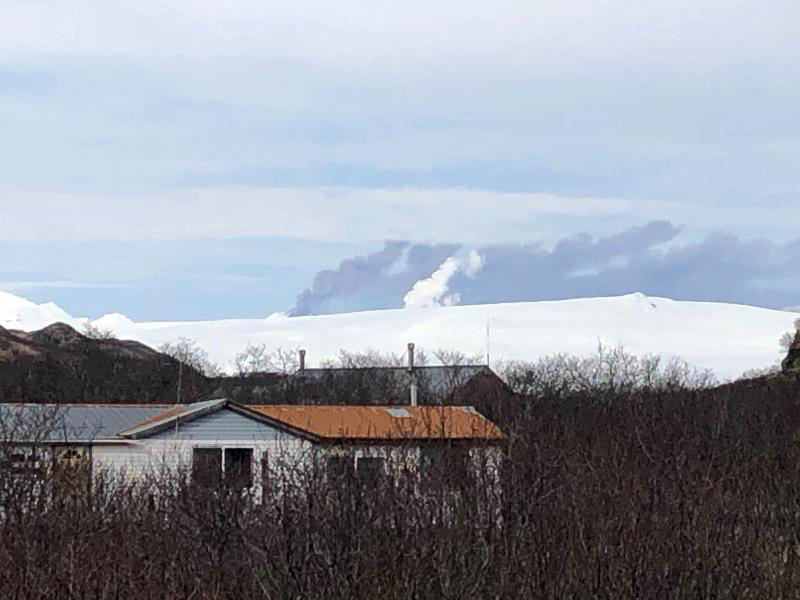 |
Figure 36. White gas-and-steam and ash emissions from Veniaminof, as viewed from Perryville (35 km SE) on 9 March 2021. Photo by Austin Shangin; courtesy of AVO. |
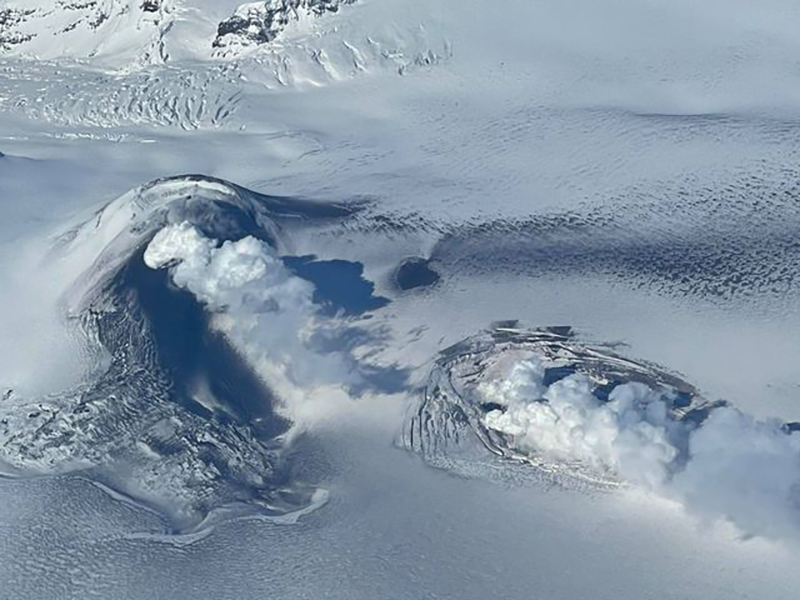 |
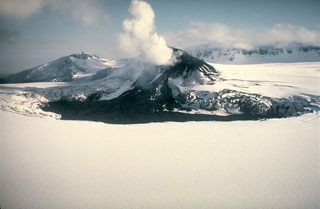
Figure 37. Photo of Veniaminof from an ACE Air flight taken on 11 March 2021 at 1330. Ash deposits (dark gray) and white gas-and-steam emissions were visible. Photo by Ben David Jacob; courtesy of AVO. |
Similar activity continued during 17-23 March. Low surface temperatures were visible in satellite images, along with gas-and-steam plumes; low-level tremor was recorded in local seismic data. During the morning of 21 March small explosions were identified using seismic data and infrasound sensors in Chignik Lagoon (55 km NE). A gas plume drifted SE at an altitude of 1.5 km. Weak explosions were detected again during 22-23 March (figure 38). Sulfur dioxide plumes were also identified in satellite data. Minor ash emissions rose hundreds of meters and rapidly dissipated, though on 23 March a pilot saw an ash plume rise to an altitude of 3 km. Satellite data during 22-23 March showed highly elevated surface temperatures and subsidence of the glacial ice over the flank vent where lava was discharging. Highly elevated surface temperatures were detected by the MODVOLC Thermal Alert System and in infrared satellite images, along with ash deposits on 23 March that were primarily confined to the summit and upper flanks; low-level tremor was also recorded.
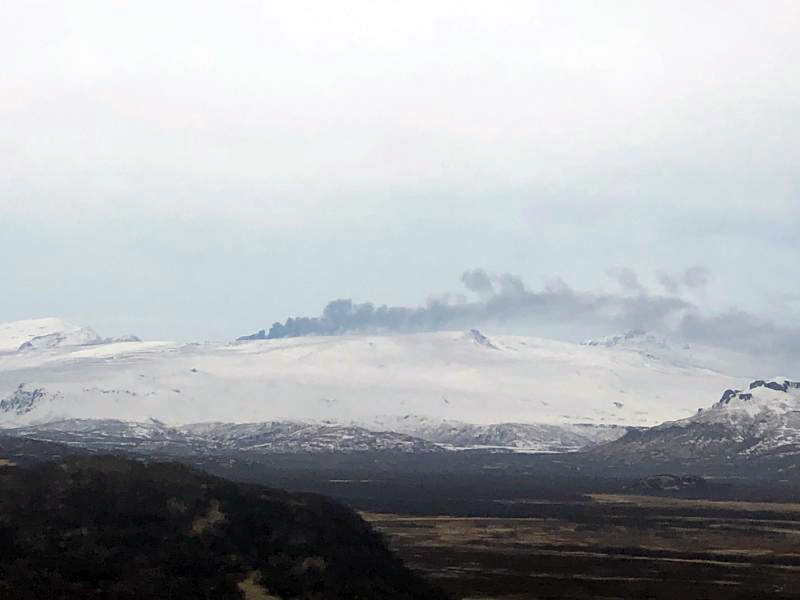 |
Figure 38. Ash emissions from Veniaminof as viewed from Perryville on 23 March 2021. Photo by Austin Shangin; courtesy of AVO. |
During 24 March explosions were recorded in local seismic data and with infrasound sensors; frequent explosive booming sounds (several per minute) were reported by residents in Perryville and Chignik Lagoon. Cloud cover prevented visual confirmation during this period of increased seismicity. On 25 March fresh ash deposits extending 10 km SE were observed on the summit caldera in satellite images. Satellite data also showed highly elevated surface temperatures at the summit and flank vent during clear weather days on 25, 28, and 29 March. Discrete, short-lived ash emissions were detected during the afternoon and evening of 27 March in images from the FAA webcam in Perryville. The intermittent events lasted several minutes and produced small ash clouds that rose less than 300 m above the vent and drifted SE. On 5 April low-level ash emissions were recorded by the webcam, resulting in tephra deposits to the SE. Eruptive and seismic activity declined after 5 April with no further reports through the end of the month.
Hotspots in March were observed on 10, 13, 15, 17, 22, 23, and 28 March, and were especially prominent on 23 March. No MODIS thermal anomalies were recorded by MODVOLC after 24 December 2018 until 10 March 2021, and none were recorded in April 2021. MIROVA (Middle InfraRed Observation of Volcanic Activity) analysis of MODIS satellite data showed a cluster of weak-to-moderate thermal anomalies during March 2021; three anomalies were detected during December 2020 and two during late January 2021 (figure 39). Sentinel-2 infrared satellite imagery showed a strong gray ash plume drifting NE on 9 March, accompanied by a weak thermal anomaly; thermal anomalies associated with both vents were clearly visible on 21 and 24 March (figure 40). AVO reported on 29 March that elevated surface temperatures were observed in overnight satellite images, which suggested that lava effusion was occurring from a flank vent into the caldera ice sheet. This activity continued to be reported through 3 April, though it was not reported that lava breached the surface. A weak thermal anomaly was visible on 30 April.
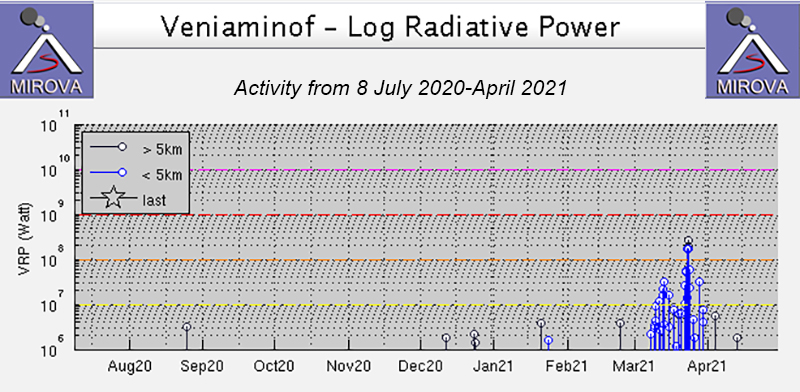 |
Figure 39. Plot showing a cluster of weak-to-moderate thermal anomalies at Veniaminof identified using MODIS data by the MIROVA system (Log Radiative Power) during 8 July 2020 through April 2021. Hotspots were concentrated in March 2021, many reaching a moderate to high range of thermal activity. Three weak anomalies were detected during December 2020 and two during late January 2021. Courtesy of MIROVA. |
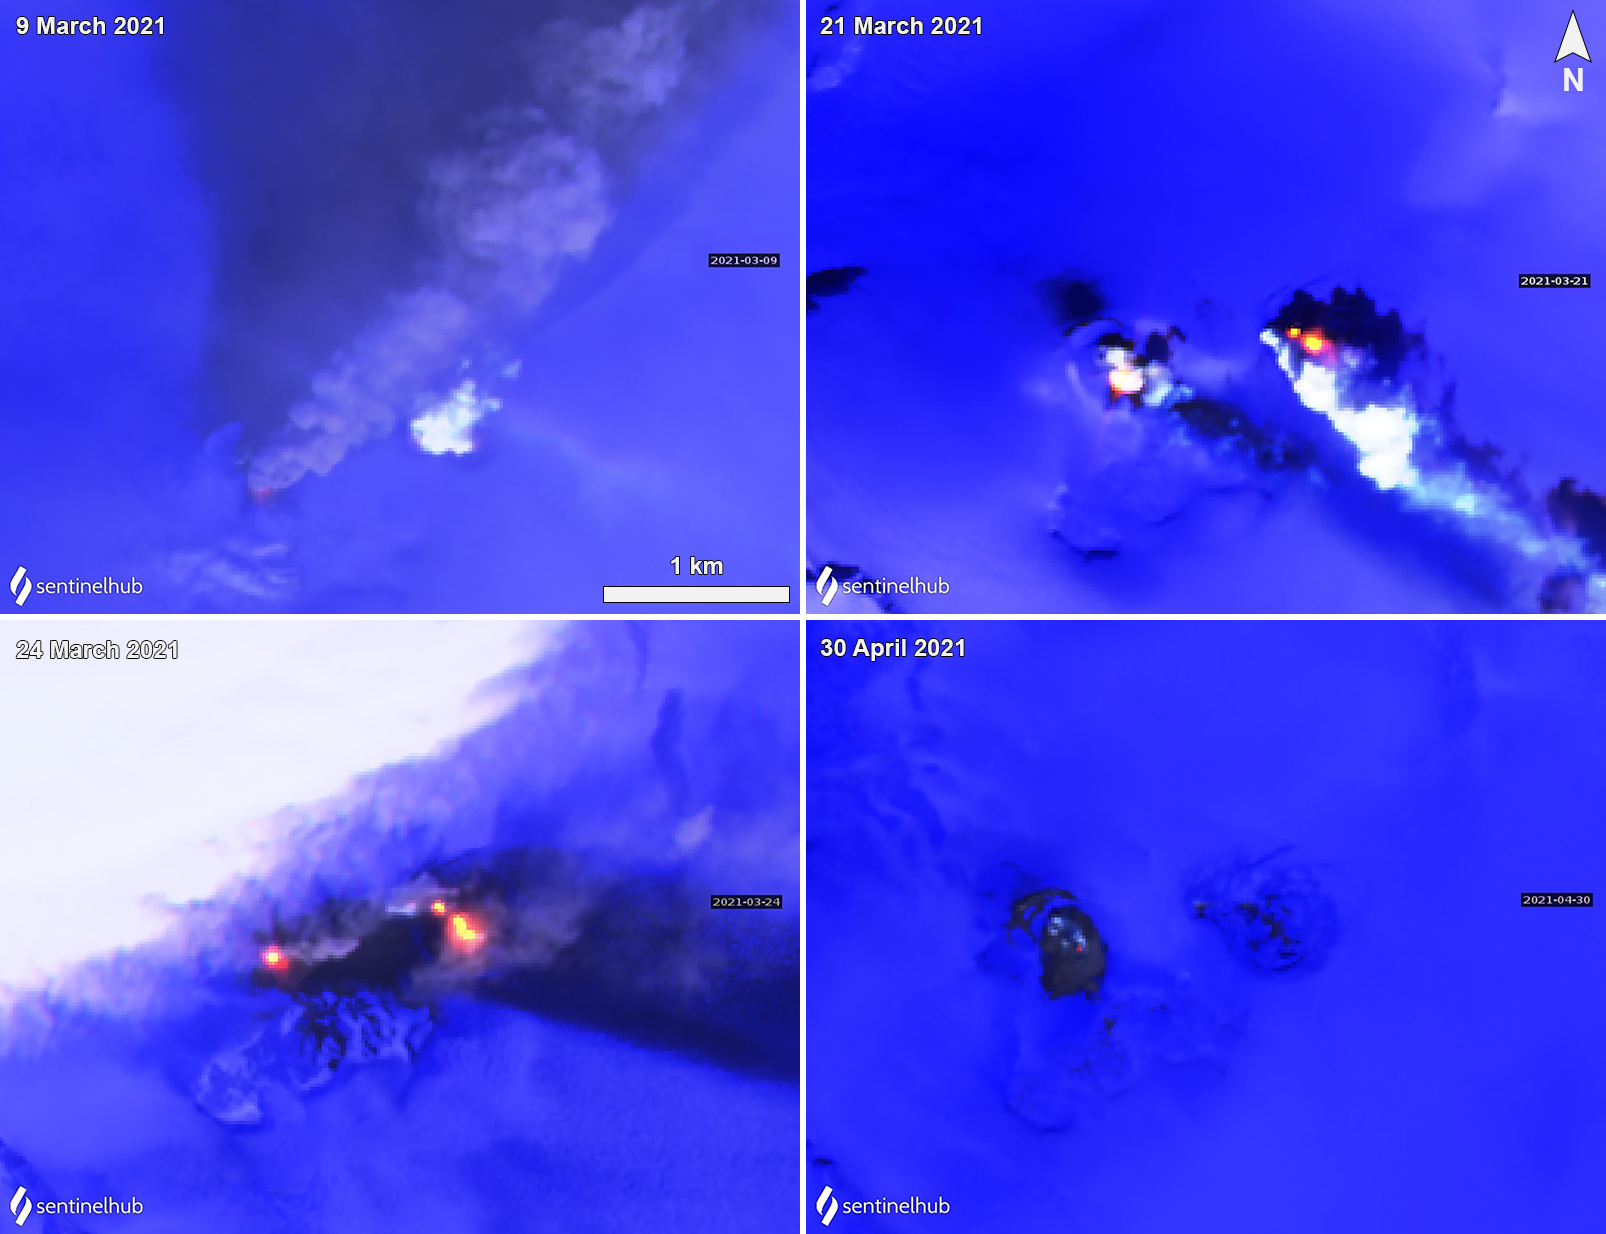 |
Figure 40. Sentinel-2 infrared satellite imagery showed a strong ash plume drifting NE from Veniaminof on 9 March 2021 (top left). Thermal anomalies were also visible in the summit crater on 21 and 24 March (top right and bottom left), which had decreased visibly by 30 April (bottom right). Sentinel-2 satellite images with “Atmospheric penetration” (bands 12, 11, 8A) rendering. Courtesy of Sentinel Hub Playground. |
Geological Summary. Veniaminof, on the Alaska Peninsula, is truncated by a steep-walled, 8 x 11 km, glacier-filled caldera that formed around 3,700 years ago. The caldera rim is up to 520 m high on the north, is deeply notched on the west by Cone Glacier, and is covered by an ice sheet on the south. Post-caldera vents are located along a NW-SE zone bisecting the caldera that extends 55 km from near the Bering Sea coast, across the caldera, and down the Pacific flank. Historical eruptions probably all originated from the westernmost and most prominent of two intra-caldera cones, which rises about 300 m above the surrounding icefield. The other cone is larger, and has a summit crater or caldera that may reach 2.5 km in diameter, but is more subdued and barely rises above the glacier surface.
Information Contacts: Alaska Volcano Observatory (AVO), a cooperative program of a) U.S. Geological Survey, 4200 University Drive, Anchorage, AK 99508-4667 USA (URL: https://avo.alaska.edu/), b) Geophysical Institute, University of Alaska, PO Box 757320, Fairbanks, AK 99775-7320, USA, and c) Alaska Division of Geological & Geophysical Surveys, 3354 College Rd., Fairbanks, AK 99709, USA (URL: http://dggs.alaska.gov/); Hawai'i Institute of Geophysics and Planetology (HIGP) - MODVOLC Thermal Alerts System, School of Ocean and Earth Science and Technology (SOEST), Univ. of Hawai'i, 2525 Correa Road, Honolulu, HI 96822, USA (URL: http://modis.higp.hawaii.edu/); MIROVA (Middle InfraRed Observation of Volcanic Activity), a collaborative project between the Universities of Turin and Florence (Italy) supported by the Centre for Volcanic Risk of the Italian Civil Protection Department (URL: http://www.mirovaweb.it/); Sentinel Hub Playground (URL: https://www.sentinel-hub.com/explore/sentinel-playground).