Report on Fagradalsfjall (Iceland) — October 2021

Bulletin of the Global Volcanism Network, vol. 46, no. 10 (October 2021)
Managing Editor: Edward Venzke.
Edited by Kadie L. Bennis.
Fagradalsfjall (Iceland) Lava fountaining and flows persist during May-September 2021
Please cite this report as:
Global Volcanism Program, 2021. Report on Fagradalsfjall (Iceland) (Bennis, K.L., and Venzke, E., eds.). Bulletin of the Global Volcanism Network, 46:10. Smithsonian Institution. https://doi.org/10.5479/si.GVP.BGVN202110-371032
Fagradalsfjall
Iceland
63.895°N, 22.258°W; summit elev. 250 m
All times are local (unless otherwise noted)
The Krýsuvík-Trölladyngja system is one of five volcanic systems along the Reykjanes Peninsula in Iceland. The system is characterized by a 50-km-long composite fissure swarm trending about N38°E and includes the shorter Fagradalsfjall and Krýsuvík fissure swarms. Seismicity in this area began on 24 February 2021 and continued to increase through March, causing some surface fractures. An orange glow observed on 19 March indicated the start of a fissure eruption near Fagradalsfjall in the Geldingadalur (also referred to as Geldingadalir) valley (see figure 1 in BGVN 46:05). Several fissure vents opened along a NE-SW trend during early- to mid-April 2021 (BGVN 46:05), accompanied by white gas-and-steam emissions, spatter, and lava fountains; flows began to fill Geldingadalur and eventually reached the Meradalir valley to the SE. This report covers activity from May through September 2021, describing persistent lava fountains and flows mainly from vent 5 (also referred to as the “main crater”), using information primarily from the Icelandic Meteorological Office, the Institute of Earth Sciences, Icelandic National Broadcasting Service, the University of Iceland, and various satellite data. The Aviation Color Code remained at Orange due to the lack of ash and tephra emissions.
Activity during May 2021. Lava fountaining and lava flows continued to be reported during May; by 1 May flows had traveled N in Meradalir, connecting to those that had previously descended into the valley. Fountaining from vent 5 was consistent until around 0000-0100 on 2 May, when IMO noted a that the fountaining changed to cycles of intense lava jetting and effusion, followed by periods of calm. Intense fountains rose 100-150 m high for periods of 8-12 minutes and gas plume with minor amounts of ash rising 440-540 m above the vent or 800-900 m altitude. Ejecta rose several hundred meters above the crater and could been seen from Reykjavik as the lava flows traveled in channels under the crater rim (figure 16). Ejecta ignited small vegetation fires on the hill S of the vent, causing a smoke plume. Intermittent lava field measurements were taken by the Institute of Earth Sciences at the University of Iceland, growing from a volume of 23 million cubic meters over 1.4 km2 on 4 May, to 143 million cubic meters over 4.6 km2 on 9 September (table 1).
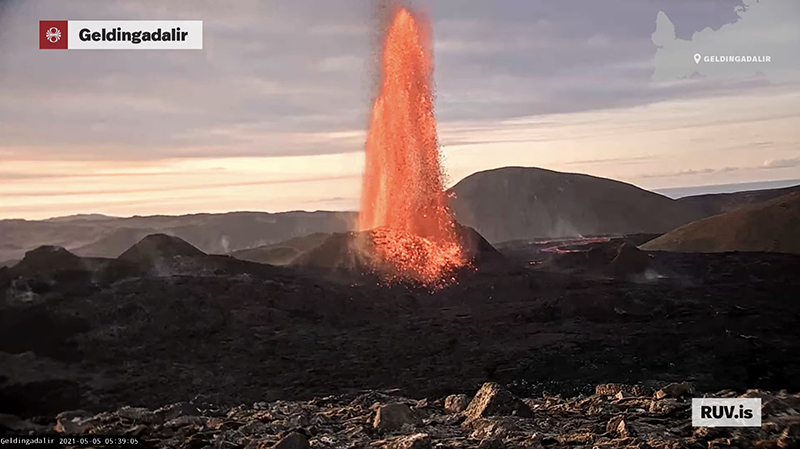 |
Figure 16. Webcam image of a high lava fountain from the Geldingadalur eruption at Krýsuvík-Trölladyngja on 5 May at 0539. A lava flow is visible in the background. Courtesy of RÚV. |
Table 1. Summary of the gradually increasing volume and area measurements taken during the Krýsuvík-Trölladyngja during May-September 2021. Courtesy of IMO and IES.
| Date | Volume of erupted lava (million m3) | Area covered by lava (km2) |
| 04 May 2021 | 23 | 1.4 |
| 12 May 2021 | 30 | 1.8 |
| 18 May 2021 | 38 | 2.1 |
| 02 Jun 2021 | 54 | 2.7 |
| 13 Jun 2021 | 63 | 3.2 |
| 26 Jun 2021 | 80 | 3.8 |
| 22 Jul 2021 | 96 | 4 |
| 27 Jul 2021 | 109 | 4.3 |
| 08 Aug 2021 | 119 | 4.4 |
| 09 Sep 2021 | 143 | 4.6 |
During the morning of 8 May a helicopter pilot reported that lava had begun to flow from the first vent in Geldingadalur. On 9 May seismic tremor confirmed that the fifth vent, which had become the “main” vent, had resumed lava fountaining in the morning. High jets of lava occurred every ten minutes, rising 300 m high. Some centimeter-sized tephra was found 1 km from the vent and minor tephra deposits were reported in the nearby town of Gríndavik; small vegetation fires were also ignited by falling pyroclasts up to hundreds of meters from the eruption site. By 10 May the fountains were rising 300-500 m high, resulting in lava spatter and ejecta; the higher fountains could be seen from Reykjavik. Webcams showed accompanying gas-and-steam plumes rising to 2 km altitude and SO2 measurements were 4,000-5,000 tons/day.
During 11-18 May the effusion rate was 10.8 m3/s, based on data from the University of Iceland and the Icelandic Institute of Natural History, a decrease in rate compared to the previous week of 12.9 m3/s. Fountains on 11 May again rose to 300 m and could be seen from the capital. Due to constant spatter, the cone height increased to 50 m. On 12 May a strong lava flow was reported in the Meradalir valley. Seven to eight lava fountain episodes every hour from vent 5 rose 100-300 m above the crater, depositing material nearby and causing some vegetation fires. Sections of the top walls of vent 5 collapsed into the crater on 17 May, which increased the lava flow significantly (figure 17); flows traveled into Geldingadalur, Meradalir, and S of Meradalir (also referred to as Syðri-Meradalir SE of vent 5).
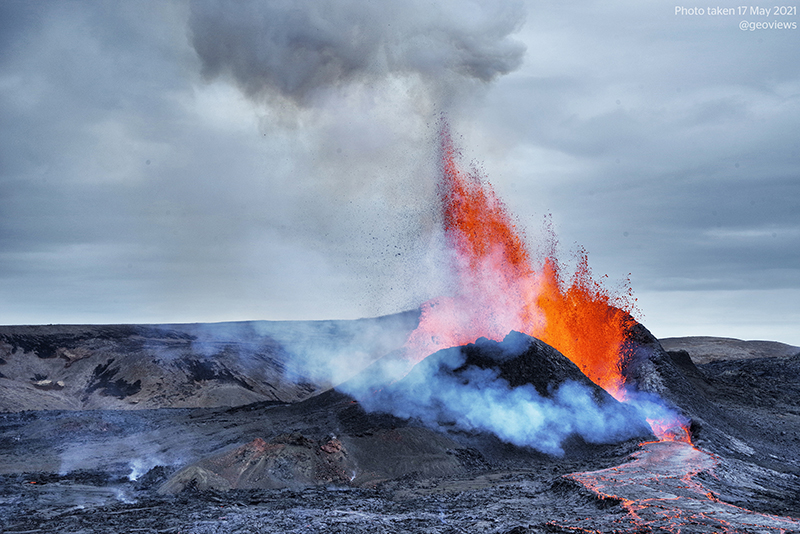 |
Figure 17. Photo of strong lava fountains rising 100-300 m high above vent 5 from the Geldingadalur eruption at Krýsuvík-Trölladyngja on 17 May 2021. A lava flow is visible in the foreground, accompanied by white gas-and-steam plumes. Courtesy of Benjamin Hennig, University of Iceland. |
By 18 May the area of the flow had grown to 2.06 km2 and had a total volume of 38 million cubic meters. Barriers were being constructed to prevent lava flowing into the Nátthaga (also known as Nátthagi) valley and possibly overtaking Highway 427 (Suðurstrandarvegur) to the S, protecting the road and buried fiberoptic cables; by 22 May the flow had broken past the E barrier and was about 2.5 km from the road. A DOAS (Differential Optical Absorption Spectrometer) traverse was made on 27 May that measured 48-58 kg/s of SO2. By 28 May only vent 5 remained active and remained characterized by cycles of lava fountains that reached 500 m; lava flows continued to travel into the Geldingadalur and Meradalir valleys and into the Nátthaga valley. Seismicity had also decreased on the Reykjanes peninsula, 90 of which were detected compared to the 200 that were detected the previous week. An estimated 31 hectares of vegetation had been burned by fires from lava and hot ejected material since early May, according to a report from the Icelandic National Broadcasting Service (RUV).
Activity during June 2021. Lava fountains and flows continued to be reported during June, the latter of which traveled through tubes and along the surface, with vent 5 as the primary source. Flow rate was comparable to the previous month, averaging 12-13 m3/s, based on measurements by University of Iceland scientists. Due to continued fountaining, observations showed that the opening at vent 5 was decreasing in size as the crater walls became thicker. During one period of stronger effusion fountains were rising as high as 20 m. Flows continued to advance in the Geldingadalur, Meradalir, and Nátthaga valleys; lava in the Nátthaga valley continued S in the direction of Highway 427. The leading edges of the flows ignited small vegetation fires. By 2 June the volume of effused lava was 54 million cubic meters and covered an area of 2.7 km2.
On 5 June lava began to advance W toward the S Meradalir valley. Lava at vent 5 vigorously splashed above the crater rim which led to an overflow on 10 June with several streams merging into a wide, fast-moving “lava fall” that collapsed parts of the crater rim. On 13 June lava began to flow over the S part of the Geldingadalur valley and over a hiking trail during the morning, which then became a narrow lava flow that turned E and entered the Nátthaga valley from the W wall, joining the larger advancing flow (figure 18). By 26 June the volume of erupted lava had increased to 80 million cubic meters and covered an area of 3.82 km2. The lava flow was 10-15 m thick in the Meradalir valley and 15 m thick in the Nátthaga valley to the S. Thickening was greatest, at 20 m, in the S and E part of the Geldingadalur valley. On 28 June the lava effusion stopped at the same time that volcanic tremor decreased to very low levels, which remained low through the following day. A DOAS traverse measurement showed that the SO2 flux was 50-85 kg/s. By 30 June tremor and lava effusion renewed and became more vigorous; gas-and-steam emissions continued from the main crater, accompanied by high SO2 values.
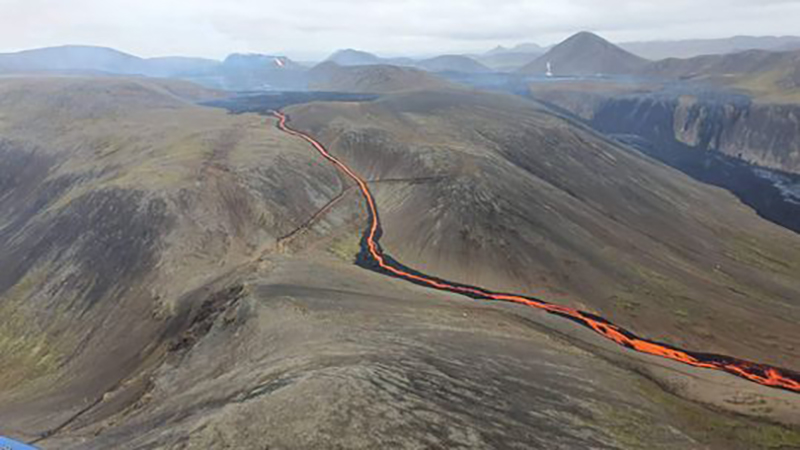 |
Figure 18. Photo of a lava flow at Krýsuvík-Trölladyngja traveling from Geldingadalur toward the Nátthaga valley on 13 June 2021. Courtesy of IMO. |
Activity during July 2021. The fissure eruption persisted through July with lava fountaining and overflows from vent 5. Occasional rim collapses produced minor ash plumes on 2 July, based on footage captured by a visitor. During 2-19 July the average lava effusion rate was 7.5 m3/s, which was notably lower than those during May and June. The total erupted volume had grown to 96 million cubic meters and covered an area of 4 km2. A long pause in activity was recorded around midnight on 5 July, which ended early on 7 July, as reflected in seismic data. On 17 July lava fountaining and overflows from vent 5 occurred at intervals of 10-15 hours, separated by intervals of 10-15 hours. IMO reported that lava was mostly accumulating in the Meradalir valley on the W slope and that no lava was flowing in the Geldingadalur, Nátthaga, and S Meradalir valleys during most of July. IMO generated several graphs to track the changes in the area of the lava flow field, the volume of erupted lava, and the rate of lava effusion through 27 July (figure 19). By 29 July there was a slight increase in the flow on the W slope of the Meradalir valley and thickened at a rate of 1 m/day.
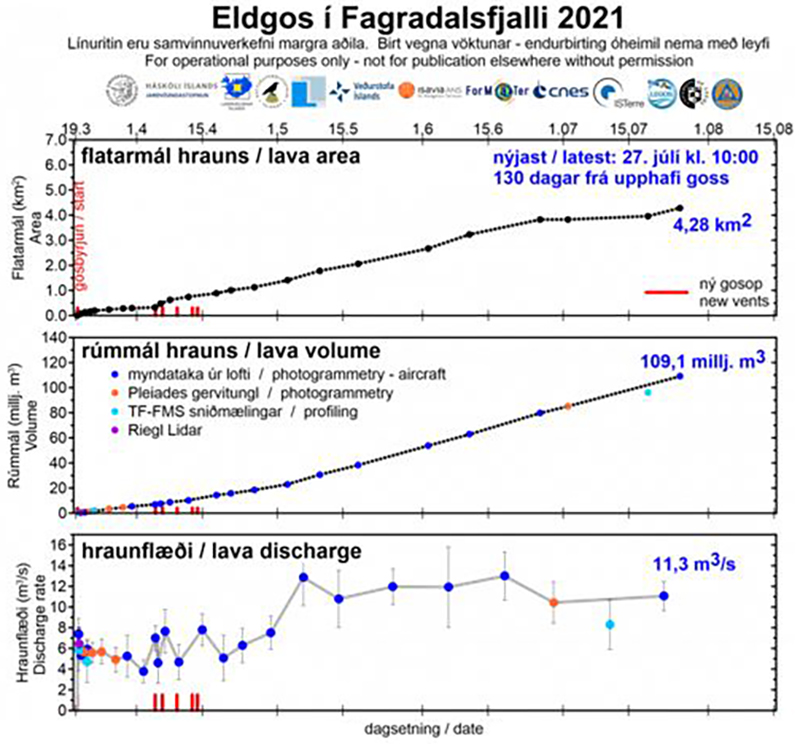 |
Figure 19. Graphs showing the evolution of the area (top), volume (middle) of lava, and rate of effusion (bottom) from 19 March through 27 July 2021 at Krýsuvík-Trölladyngja. By 27 July the area of lava was 4.28 km2, the volume of erupted lava was 109.1 million cubic meters, and the effusion rate was 11.3 m3/s. Courtesy of IMO. |
Activity during August 2021. Cycles of fountaining and overflows from vent 5 persisted during August; the lava flow continued to travel into the Meradalir valley and area to the W and did not advance in the Geldingadalur, Nátthaga, and S Meradalir valleys. According to photographs from IES captured on 8 August, the average lava effusion rate was 9.3 m3/s during the first half of the month, that covered an area of 4.4 km2 and had a total volume of 119 million cubic meters. A new vent first detected on 9 August was producing a lava flow. The new cone quickly grew due to constant and intense spattering, so that by 17 August it was about the same height as vent 5. A small lava flow overflowed the crater wall to the S toward Geldingadalur during the night on 10 August.
During 18-19 August new lava flows were reported overflowing the SW and NE crater rims, traveling S, E, and SE in the Geldingadalur and Meradalir valleys, frequently accompanied by gas-and-steam plumes (figure 20). A large collapse of the inner crater rim was observed in webcam images, which produced some ash emissions. Lava flowed into the S part of the Meradalir valley and down a slope into the Nátthaga valley in multiple branches on 26 August (figure 21). Observers noted that parts of the flows were turbulent and splashed above the flow surface; lava stopped advancing around 1600 as the eruption paused.
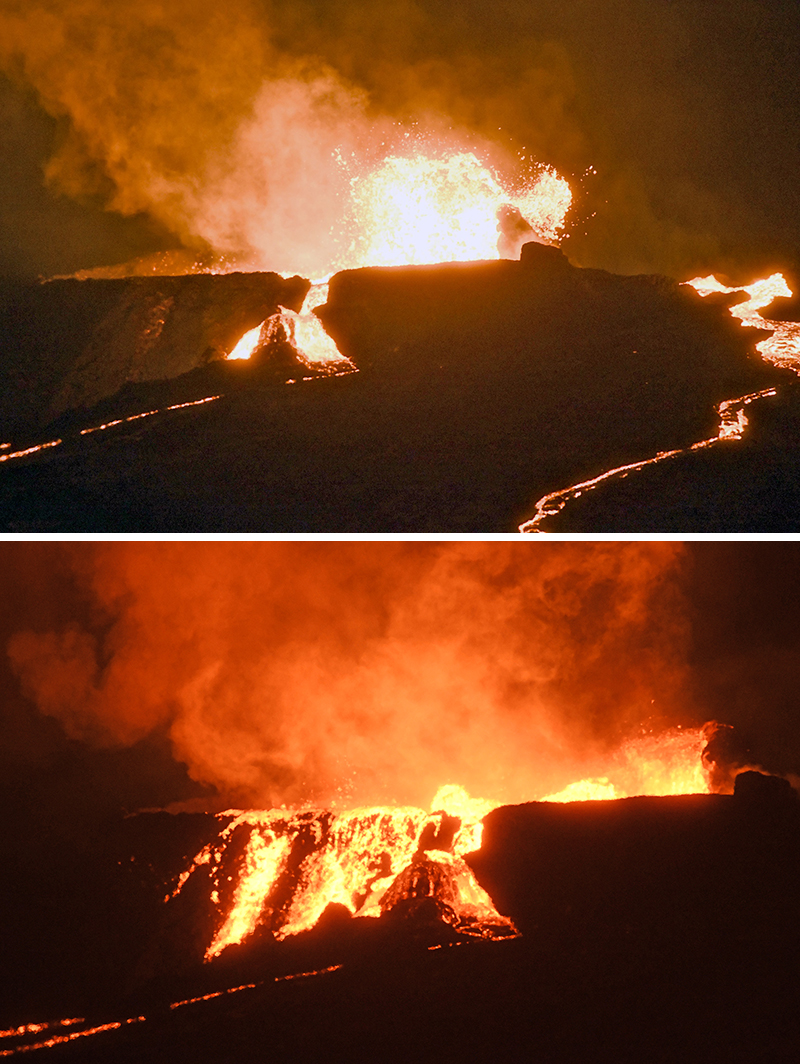 |
Figure 20. Photo of lava splashing over the NE (top) and SW (bottom) crater rim from the Geldingadalur eruption at Krýsuvík-Trölladyngja on 19 August 2021, accompanied by strong gas-and-steam emissions and lava flows advancing into the Geldingadalur, Meradalir, and southern Meradalir valleys. Courtesy of Ben Edwards, Dickinson College. |
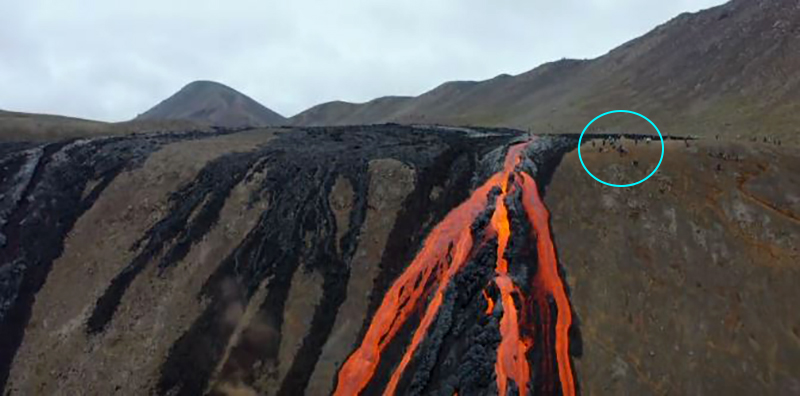 |
Figure 21. Drone image of lava flows from the Geldingadalur eruption at Krýsuvík-Trölladyngja descending into the southern part of Geldingadalur valley and toward Nátthaga on 26 August 2021. People on the right are shown for scale (blue circle). Courtesy of RÚV. |
Activity during September 2021. Activity had paused on 2 September, characterized primarily by gas-and-steam emissions that rose from the crater during 2-7 September. Aerial photography on 9 September showed that the area of the lava flow field had grown to 4.6 km2 and had a total erupted volume of 143 million cubic meters. The crater floor was visible and measured at least 70 m deep, with a deeper cavity or drainage that was sometimes visible. Activity picked up again on 11 September, which included increased RSAM values and low lava fountains that emerged from a few areas W of vent 5. Lava was also visible in the main vent. On 13 September fountains were visible for periods of 5-10 minutes and lava flows advanced in multiple directions; on 14 September lava had advanced N. During 14-15 September lava that was ponding in Geldingadalur fed a larger lava flow traveling into the S part of the valley, which then advanced E into the Nátthaga valley.
During 16-17 September lava continued to advance, moving over a hiking trail; around 1800 the flow rate decreased or paused, and only minor incandescence was visible from the vent, according to IMO (figure 22). By 17 September the area of the lava flow field was 4.8 km2 and had a volume of 151 million cubic meters. The average flow rate during 11-17 September was 16 m3/s. Parts of the lava field thickened in areas to the S of Geldingadalur and in the Nátthaga valley; some deflation was noted in areas N of Geldingadalur. On 27 September a seismic swarm was detected SW of Keilir (10 km NE of vent 5), at the N end of the dike intrusion; more than 6,000 earthquakes at depths of 5-6 km were detected by 4 October. A total of six fissures were mapped within the eruption site, but only vent 5 remained active through 2 October (figure 23).
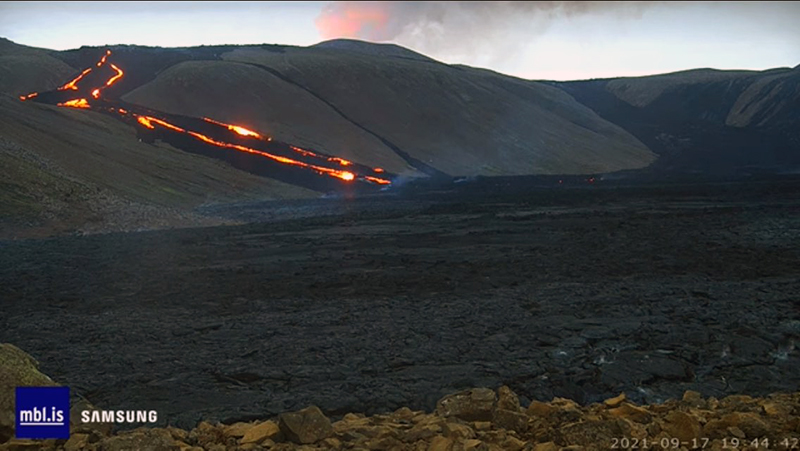 |
Figure 22. Webcam image of lava flows advancing into the Nátthaga valley on 17 September 2021 during the Geldingadalur eruption at Krýsuvík-Trölladyngja. Courtesy of Morgunblaðið (MBL). |
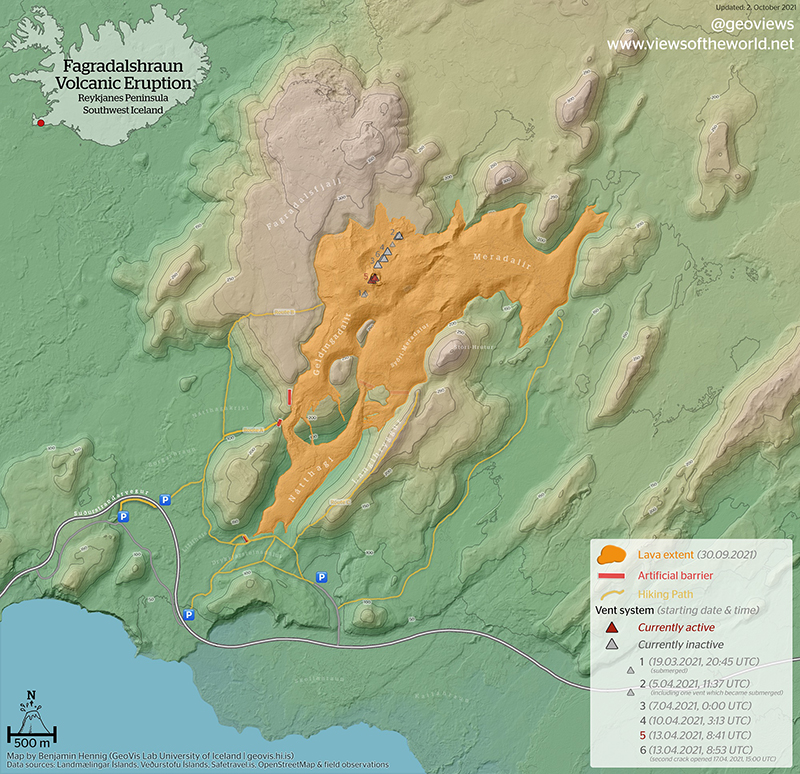 |
Figure 23. Map updated on 2 October 2021 showing the lava field of the Geldingadalur eruption at Krýsuvík-Trölladyngja, including the location of the active (red triangle) and inactive (gray triangles) fissures and the extent of the lava flows (orange color) in the Geldingadalur, Meradalir (including Syðri-Meradalir), and Nátthaga valleys. The red lines represent artificial barriers. Courtesy of Benjamin Hennig, University of Iceland. |
Satellite data. The NASA Global Sulfur Dioxide page, using data from the TROPOMI instrument on the Sentinel-5P satellite, showed distinct, strong sulfur dioxide plumes exceeding 2 DUs (Dobson Units) intermittently through the reporting period (figure 24). Strong thermal activity was detected in the MIROVA graph during late March through September 2021 due to the constant lava flows; the frequency declined slightly during June, mid-July, mid-August, and mid-September, but remained strong (figure 25). Similarly, Sentinel-2 infrared satellite images showed the direction of the lava flows during May through September on clear weather days that moved W, E, and S, often accompanied by white gas-and-steam plumes (figure 26).
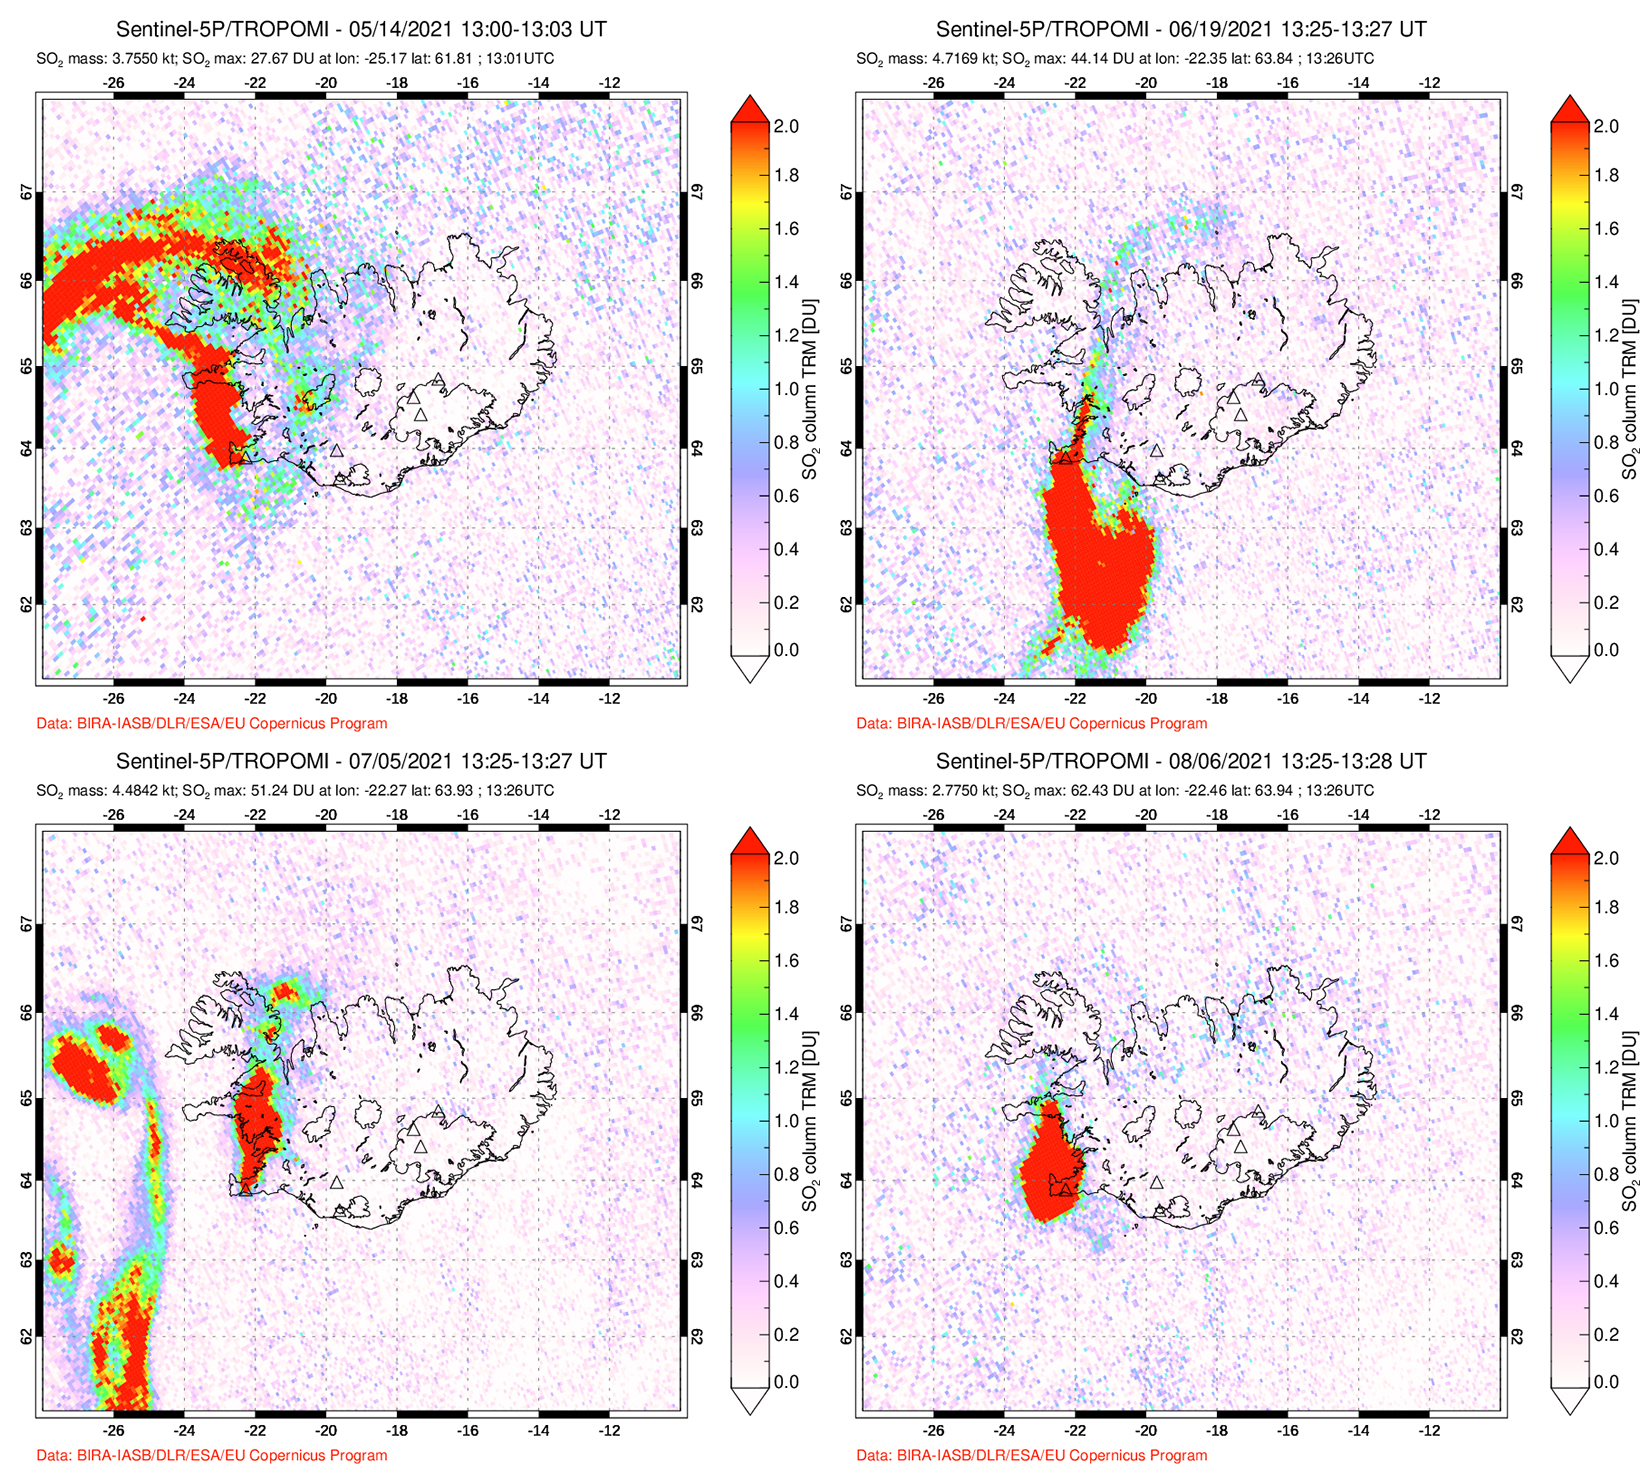 |
Figure 24. Intermittent distinct sulfur dioxide plumes that exceeded 2 DUs (Dobson Units) were detected above the Geldingadalur eruption at Krýsuvík-Trölladyngja, as shown on 14 May (top left), 19 June (top right), 5 July (bottom left), and 6 August (bottom right) 2021, based on data from the TROPOMI instrument on the Sentinel-5P satellite. Plumes drifted in different directions. Courtesy of the NASA Global Sulfur Dioxide Monitoring Page. |
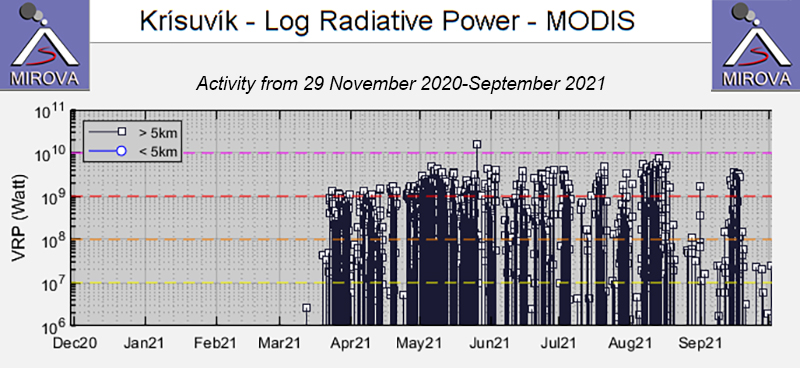 |
Figure 25. Strong thermal activity from the Geldingadalur eruption at Krýsuvík-Trölladyngja was detected in the MIROVA graph (Log Radiative Power) during late March through September 2021 due to the constant lava flows; the frequency declined slightly during June, mid-July, mid-August, and mid-September. Courtesy of MIROVA. |
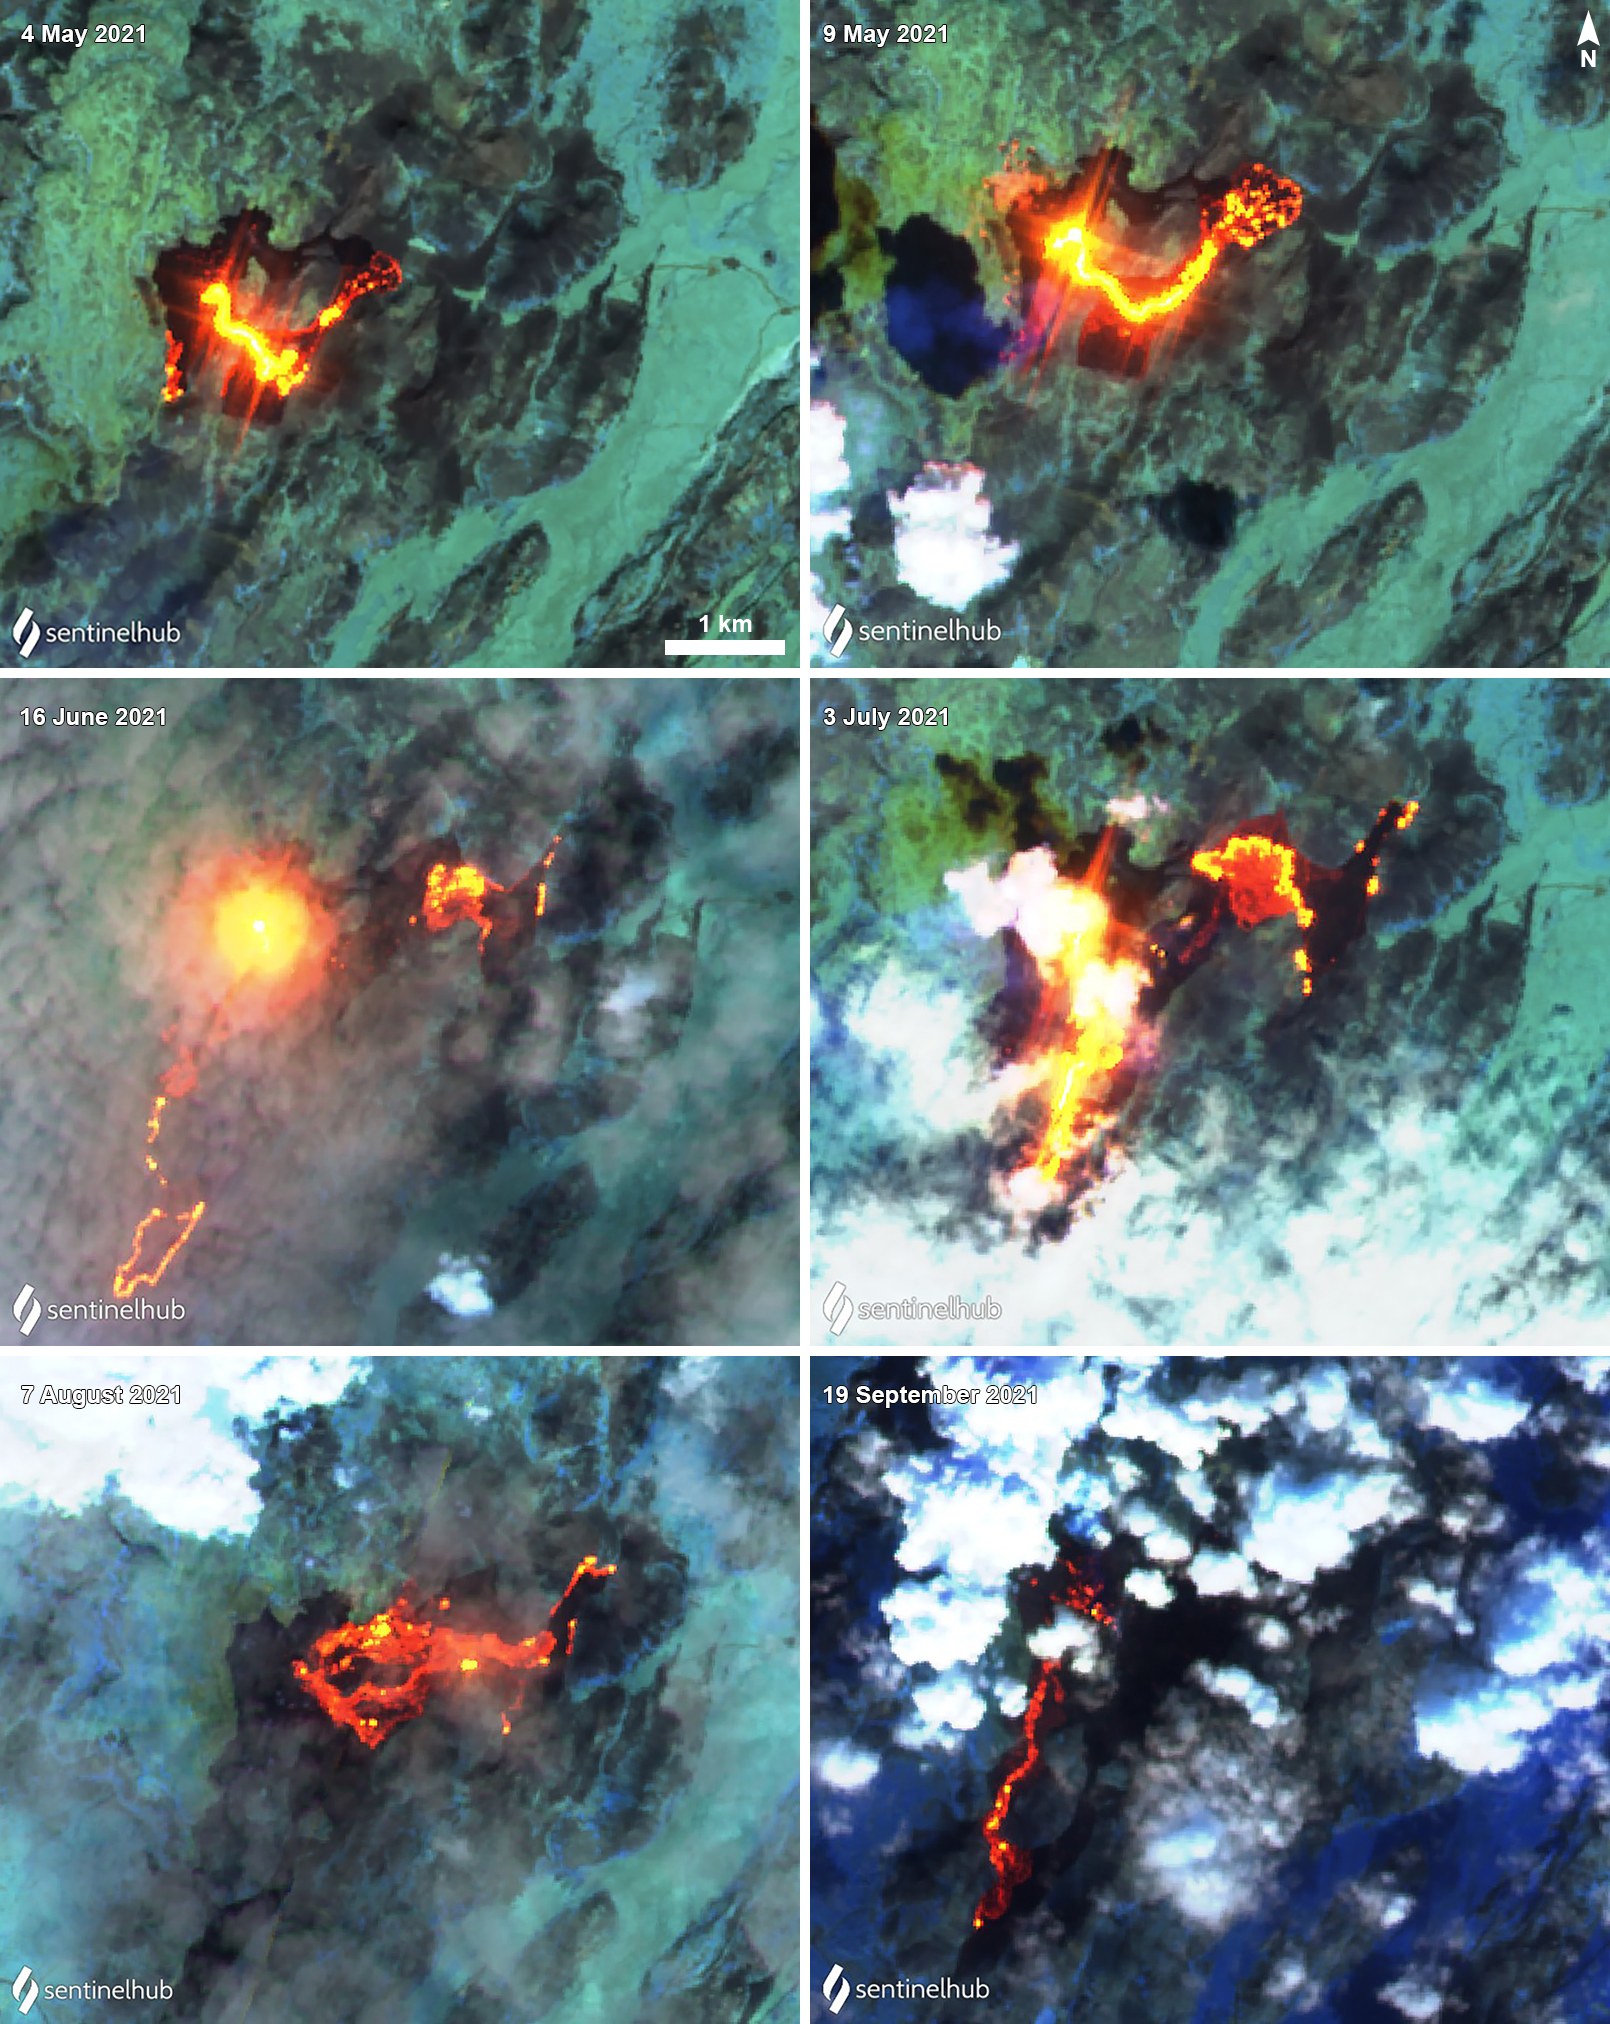 |
Figure 26. Sentinel-2 infrared satellite images show strong lava flows represented by thermal anomalies from the Geldingadalur eruption at Krýsuvík-Trölladyngja on 4 May (top left), 9 May (top right), 16 June (middle left), 3 July (middle right), 7 August (bottom left), and 19 September (bottom right) 2021. Sentinel-2 satellite images with “Atmospheric penetration” (bands 12, 11, 8A) rendering. Courtesy of Sentinel Hub Playground. |
Geological Summary. Although the Fagradalsfjall fissure swarm has previously been considered a split or secondary swarm of the Krýsuvík–Trölladyngja volcanic system, as of September 2022 Icelandic volcanologists managing the Catalogue of Icelandic Volcanoes made the decision to identify it as a distinct separate system. The recent eruptions and related reports have been reassigned here, and other content will be prepared and adjusted as appropriate.
Information Contacts: Icelandic Meteorological Office (IMO), Bústaðavegur 7-9 105 Reykjavík, Iceland (URL: http://en.vedur.is/); Institute of Earth Sciences, Sturlugata 7 101 Reykjavík, Iceland (URL: http://www.earthice.hi.is/); Icelandic National Broadcasting Service (RUV), Efstaleiti 1 150 Rekyjavík, Iceland (URL: http://www.ruv.is/); University of Iceland, Volcanology and Natural Hazard Group, Askja, Sturlugötu 7 101 Reykjavík, Iceland (URL: https://www.hi.is/); Icelandic Coast Guard, Skógarhlío 14 105 Reykjavík, Iceland (URL: www.lhg.is, https://www.facebook.com/Landhelgisgaeslan/); Morgunblaðið (MBL), Hádegismóum 2, 110 Reykjavík, Iceland (URL: https://www.mbl.is/frettir/); MIROVA (Middle InfraRed Observation of Volcanic Activity), a collaborative project between the Universities of Turin and Florence (Italy) supported by the Centre for Volcanic Risk of the Italian Civil Protection Department (URL: http://www.mirovaweb.it/); NASA Global Sulfur Dioxide Monitoring Page, Atmospheric Chemistry and Dynamics Laboratory, NASA Goddard Space Flight Center (NASA/GSFC), 8800 Greenbelt Road, Goddard MD 20771, USA (URL: https://so2.gsfc.nasa.gov/); Sentinel Hub Playground (URL: https://www.sentinel-hub.com/explore/sentinel-playground); Benjamin Hennig, University of Iceland, Sæmundargata 2 102 Reykjavík, Iceland (URL: https://english.hi.is/staff/ben, https://geoviews.net/); Ben Edwards, Dickinson College, P.O. Box 1773, Carlisle, PA 17013, USA (URL: https://blogs.dickinson.edu/edwardsb/).