Report on Pavlof (United States) — August 2022
Bulletin of the Global Volcanism Network, vol. 47, no. 8 (August 2022)
Managing Editor: Edward Venzke.
Research and preparation by Paul Berger.
Pavlof (United States) Weak ash explosions, small lava flows, and lahars during November 2021-July 2022
Please cite this report as:
Global Volcanism Program, 2022. Report on Pavlof (United States) (Venzke, E., ed.). Bulletin of the Global Volcanism Network, 47:8. Smithsonian Institution.
Pavlof
United States
55.417°N, 161.894°W; summit elev. 2493 m
All times are local (unless otherwise noted)
A new eruptive period at Pavlof began on 5 August 2021 (BGVN 46:11), with intermittent minor ash explosions, low-level ash emissions, seismic tremor, and weak thermal activity. This activity continued through at least July 2022 along with lava effusion and lahars. The volcano, one of the most consistently active on the Alaskan Peninsula, is monitored remotely by the Alaska Volcano Observatory (AVO) using local seismic and infrasound sensors, satellite data, web cameras, and remote infrasound and lightning networks. During November 2021-July 2022, the Aviation Color Code remained at Orange and the Volcano Alert Level remained at Watch, the second highest level for both. Weather clouds often prevented satellite and webcam views.
According to AVO reports, during November 2021-July 2022 there were frequently weak explosions detected in seismic and infrasound data; minor ash emissions rose a few hundred feet above the vent and quickly dissipated near the summit, as observed in satellite and webcam images. Recent ballistic ejecta were sometimes visible on the upper flanks. Consistent with the explosions and lava effusion, seismic tremor was recorded throughout the reporting period. In addition, AVO reported sustained high to moderately elevated surface temperatures near the summit associated with the lava effusion were recorded at least through July.
Based on AVO reports, lava effusion in the form of fountaining, spatter, and small lava flows from the SE vent continued through at least July. AVO reports described the lava flows as short and sometimes sporadic. Lahars that were first reported on 10 November 2021 eventually extended down the ESE flank for several kilometers, not quite to the base of the volcano.
In November 2021 weak intermittent ash explosions generated minor ash emissions that rose a few hundred feet above the vent. On 8 November a small lava flow was first noted in satellite data near a vent on the volcano’s upper SE flank that had by 11 November extended 200 m below the vent (figure 21). Occasional periods of lava fountaining from the vent began on 14 November. By then, a small cone of hot unstable spatter and rock debris had formed. Occasional collapse of parts of the cone sent hot granular flows of rock debris several hundred meters down the flank that melted the snow and ice and produced variable amounts of meltwater, which began to incorporate loose debris on the flank to form lahars less than 2 m deep. During early December numerous explosions were detected, but then explosions became intermittent during the rest of the month. Weak ash emissions rose to an altitude no higher than about 3 km, about 500 m above the summit. Flows were up to 200 m long through December.
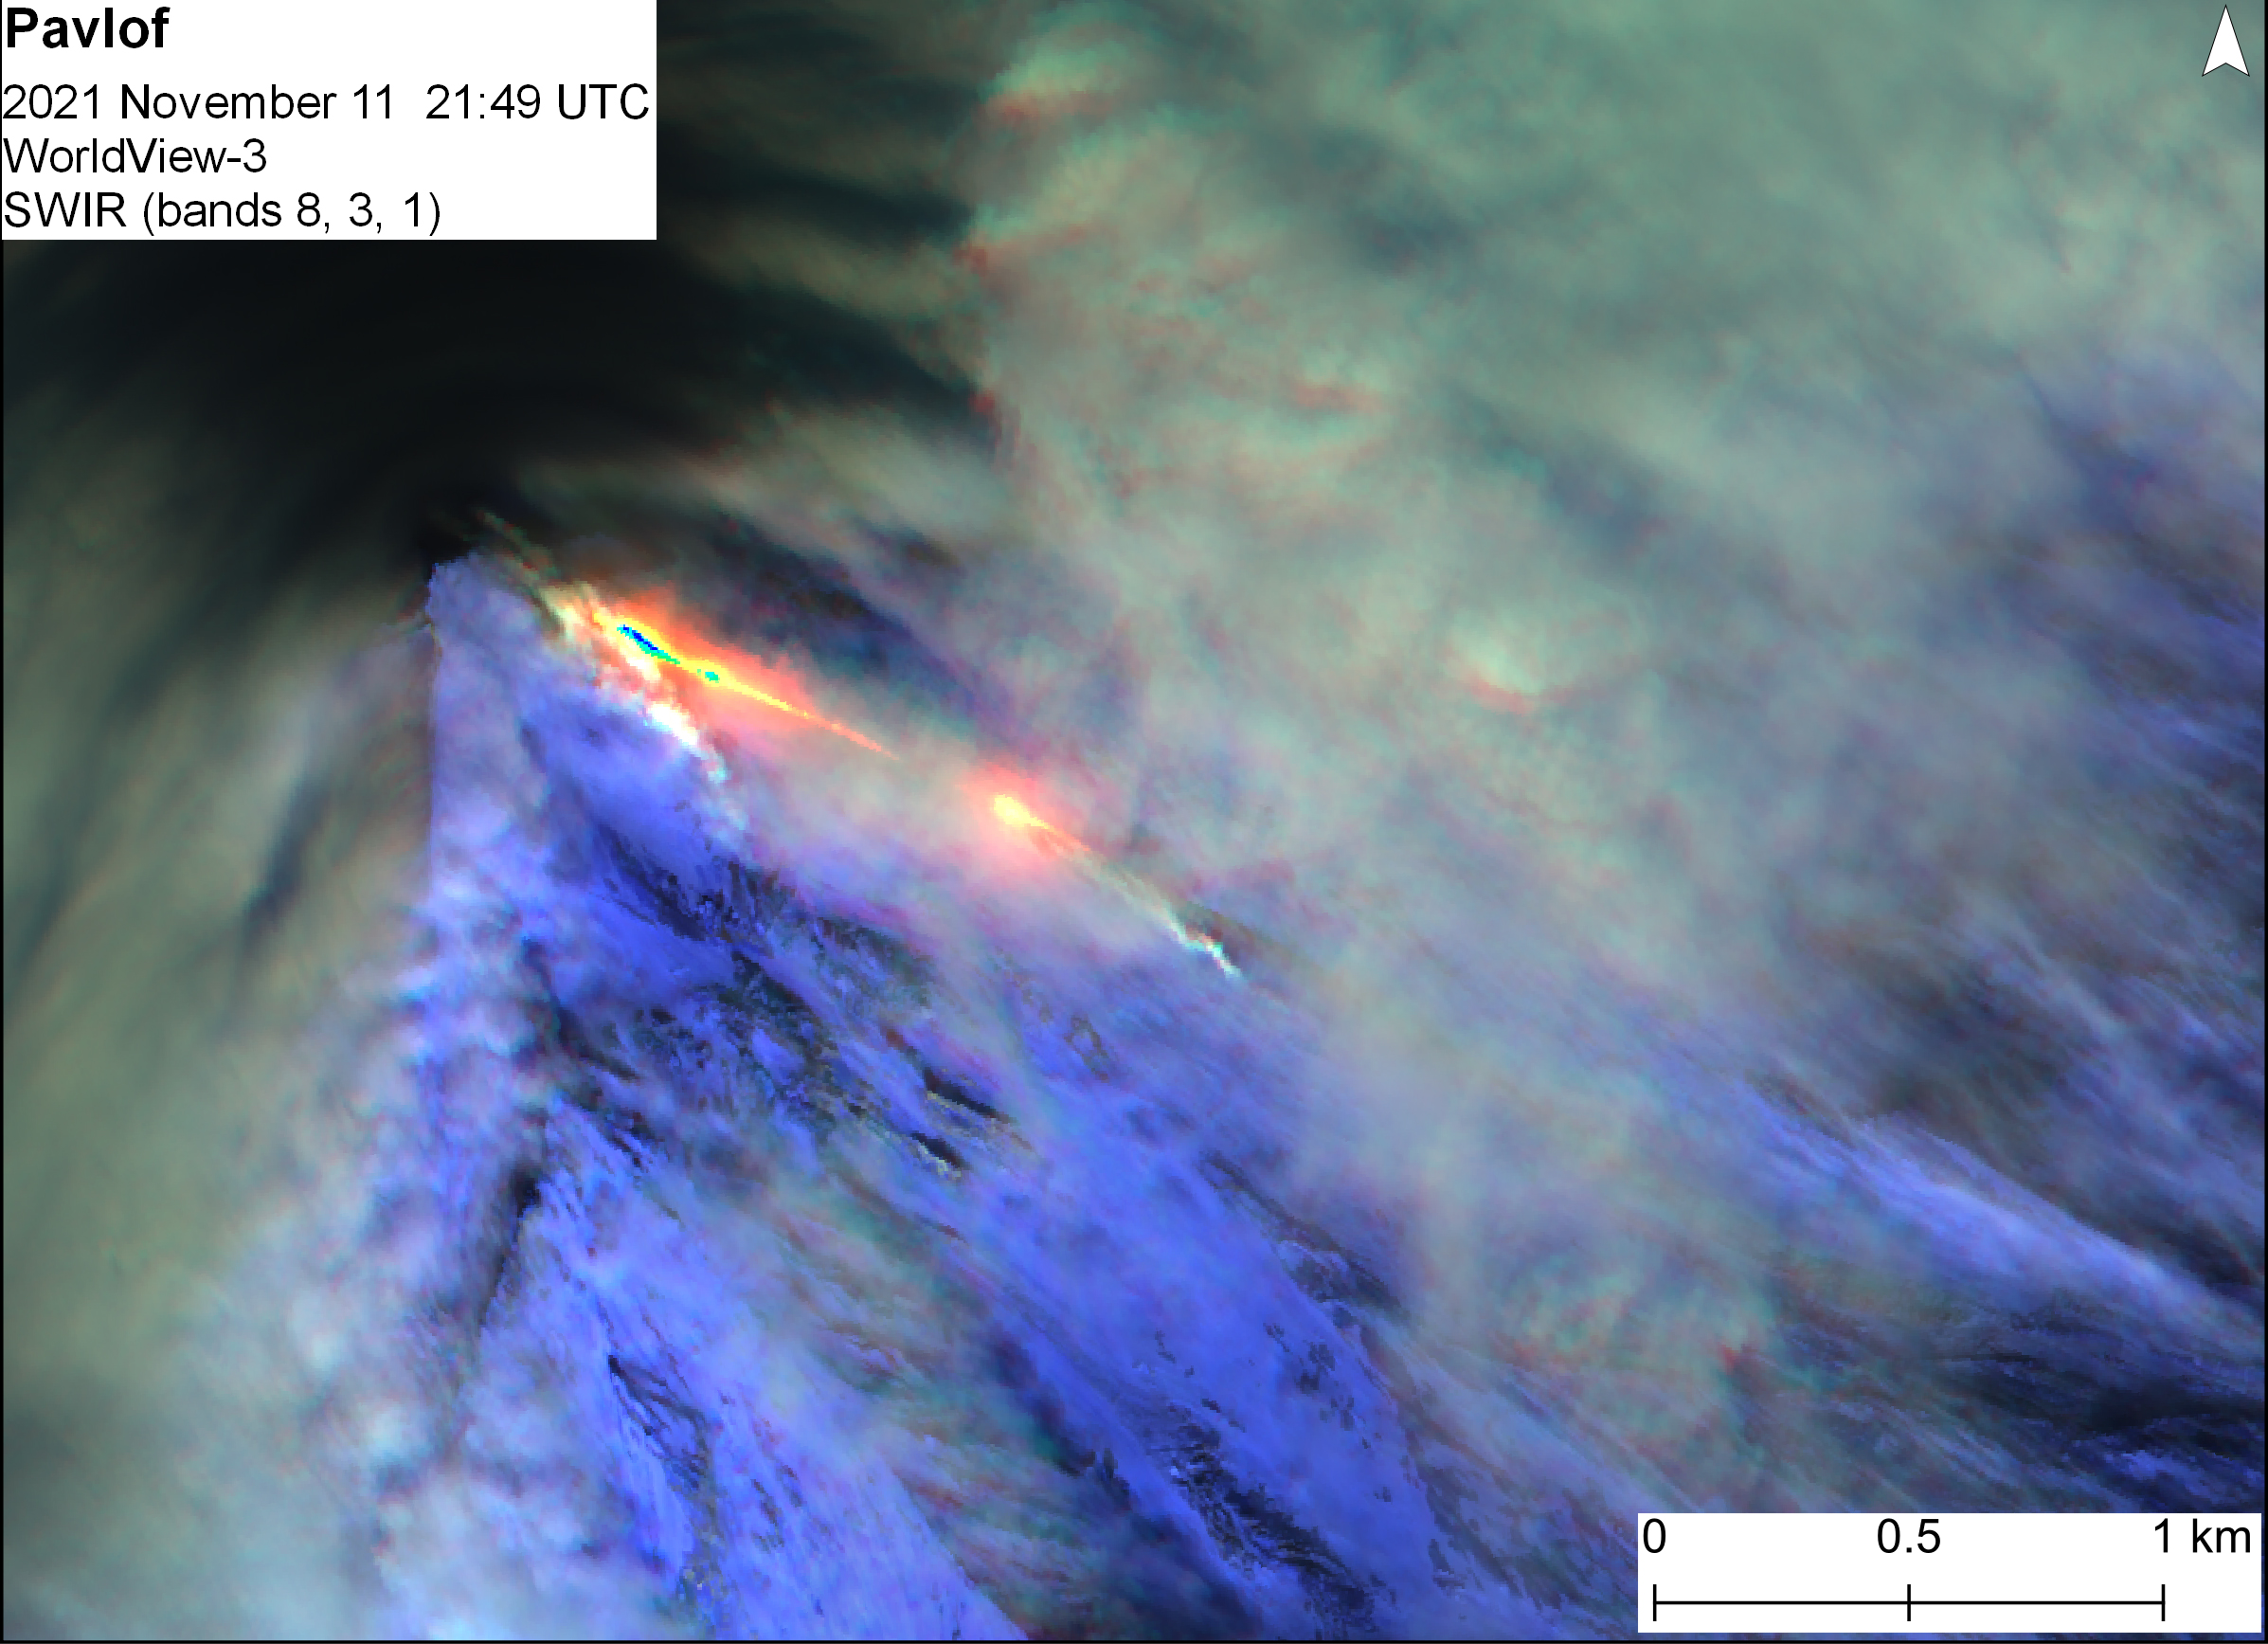 |
Figure 21. WorldView-3 false color short-wave infrared satellite image of Pavlof on 11 November 2021, showing lava flow and steam emission. SWIR rendering (bands 8, 3, 1). Prepared by M. Loewen, courtesy of AVO. |
Lava flows were 300 m long in first week of January, after which satellite-based radar showed a widening of the vent. Satellite images on 19 January showed lava extending downslope 1.3 km and a new flow branch developing (figure 22). Explosions were detected again on 19 January (figure 23), 22 January, 24 February, and 28 February 2022. Robust steam emissions were observed in webcam images during mid-January.
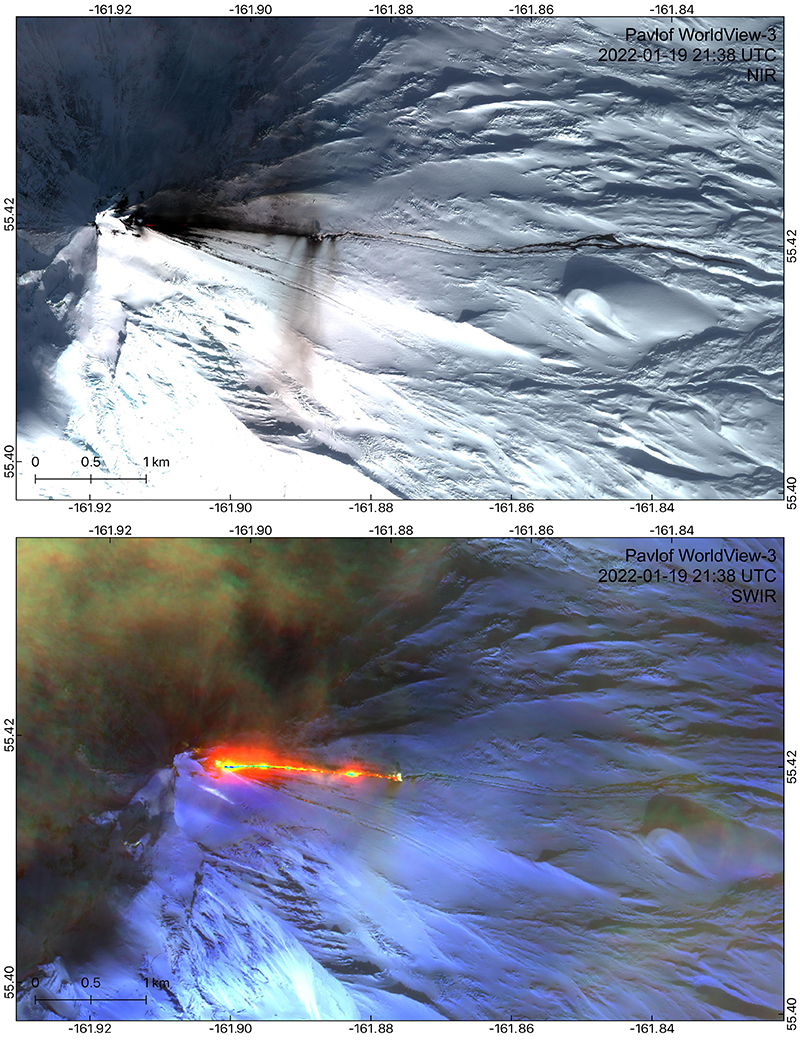 |
Figure 22. WorldView-3 visible (top) and false color short-wave infrared (bottom) satellite images of Pavlof on 19 January 2022. A lava flow extends 1.3 km E from a vent on the E flank. Lava has melted the snow and ice and produced lahars that extend beyond the lava flow up to 4.4 km E of the vent. Minor ash deposits are also visible as dark streaks on the snow. Prepared by H. Dietterich, courtesy of AVO. |
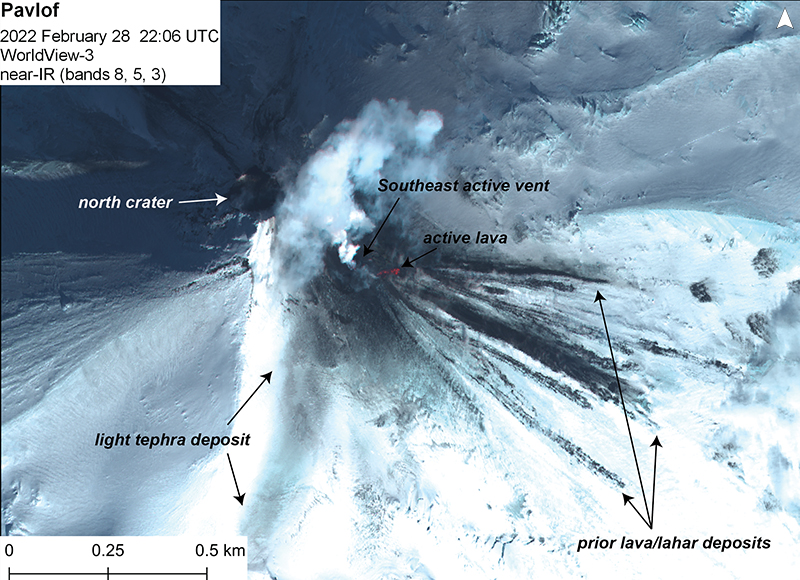 |
Figure 23. WorldView-3 false color near-infrared satellite image of Pavlof on 28 February 2022 showing a small area of active lava near the E vent, previous lava flow and lahar deposits to the E and SE, and a minor ash deposit to the S. Prepared by M. Loewen, courtesy of AVO. |
Infrasound instruments detected occasional small explosions in early March, and satellite images sometimes showed minor ash deposits covering snow near the vent. Explosions became more numerous in mid-March, then decreased towards the end of the month, with no ash emissions seen during the latter part of the month. However, steaming from the vent was observed, along with a weak gas plume. Sulfur dioxide emissions were visible in satellite images during 24-26 March. Two small explosions were detected in local and regional infrasound data during 23-24 March and one was recorded during 26-27 March.
Weak explosive activity was detected during 31 March and 2-3 April with low-level plumes visible in the mornings, though satellite and webcam views were mostly obscured by clouds. Seismic tremor and elevated surface temperatures were detected almost daily during April. Possible minor lava effusion was visible in satellite images on 6 April, and a few small explosions were recorded each day during 6-9 April. Low-level ash emissions were visible in webcam and satellite images during 6-7 April, and satellite images captured ash and pyroclastic flow deposits extending at most 1.5 km from the vent and short lava flows on 9 April. Steam emissions from the vent were visible during 8-10 April. A short lava flow had descended the E flank during 26-28 April and was about 500 m long. Steaming from the active vent was visible during 30 April-2 May.
The lava flow from the E vent was 500 m long by 8 May. Daily elevated surface temperatures were identified in satellite images consistent with the effusion of short lava flows on the upper flank through 31 May. An active flow that was 650 m long was visible in satellite images during 28-29 May. No explosions or ash emissions were detected during May and June 2022. Sulfur dioxide emissions were detected in satellite data on 12 June. Lava flows up to 500 m long were observed through 10 June, and then up to 615 m long on 24 June and 1 July. On 7 July three small explosions were detected, although ash emissions were not observed. Thereafter, minor explosions were detected daily, and weak ash emissions rose as high as 500 m above the summit. Sulfur dioxide emissions were detected on 26 July.
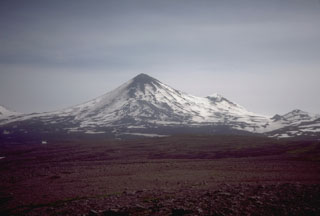
Geological Summary. The most active volcano of the Aleutian arc, Pavlof is a Holocene stratovolcano that was constructed along a line of vents extending NE from the Emmons Lake caldera. Pavlof and Pavlof Sister to the NE form a dramatic pair of symmetrical, glacier-covered stratovolcanoes that overlook Pavlof and Volcano bays. Little Pavlof is a smaller cone on the SW flank of Pavlof volcano, near the rim of Emmons Lake caldera. Unlike Pavlof Sister, eruptions have frequently been reported from Pavlof, typically Strombolian to Vulcanian explosive eruptions from the summit vents and occasional lava flows. The active vents lie near the summit on the north and east sides. The largest recorded eruption took place in 1911, at the end of a 5-year-long eruptive episode, when a fissure opened on the N flank, ejecting large blocks and issuing lava flows.
Information Contacts: Alaska Volcano Observatory (AVO), a cooperative program of a) U.S. Geological Survey, 4200 University Drive, Anchorage, AK 99508-4667 USA (URL: https://avo.alaska.edu/), b) Geophysical Institute, University of Alaska, PO Box 757320, Fairbanks, AK 99775-7320, USA, and c) Alaska Division of Geological & Geophysical Surveys, 3354 College Rd., Fairbanks, AK 99709, USA (URL: http://dggs.alaska.gov/).