Report on Sangay (Ecuador) — September 2022
Bulletin of the Global Volcanism Network, vol. 47, no. 9 (September 2022)
Managing Editor: Edward Venzke.
Edited by Kadie L. Bennis.
Sangay (Ecuador) Daily explosions, avalanches, ash plumes, and crater incandescence during January-August 2022
Please cite this report as:
Global Volcanism Program, 2022. Report on Sangay (Ecuador) (Bennis, K.L., and Venzke, E., eds.). Bulletin of the Global Volcanism Network, 47:9. Smithsonian Institution.
Sangay
Ecuador
2.005°S, 78.341°W; summit elev. 5286 m
All times are local (unless otherwise noted)
Sangay is located east of the Andean crest and is the southernmost of Ecuador’s volcanoes. Frequent activity has included pyroclastic flows, lava flows, ash plumes, and lahars, which date back to 1628. The current eruption began in March 2019 and has more recently consisted of explosions, incandescent lava flows, and ash plumes (BGVN 47:02). This report covers activity during January through August 2022 and describes similar events of daily explosions, incandescent avalanches, ash plumes, and thermal activity, based on information from Ecuador's Instituto Geofísico, Escuela Politécnica Nacional (IG-EPN), Servicio Nacional de Gestión de Riesgos y Emergencias (SNGRE), the Washington Volcanic Ash Advisory Center (VAAC), and various satellite data.
During January through August 2022, IG-EPN reported daily explosions, gas-and-steam and ash plumes that rose 1.4-7 km above the crater, and frequent crater incandescence, often accompanied by incandescent block avalanches of material descending the flanks of the volcano. The highest ash plume occurred on 8 February that drifted NW and resulted in ashfall in several towns. Explosions occurred nearly every day, ranging from 0 to 959, the most of which occurred on 26 July; according to IG-EPN late July into August experienced the greatest number of daily explosions compared to previous months (figure 128). The average number of explosions was 103, with the highest average number of explosions occurring during July (table 11).
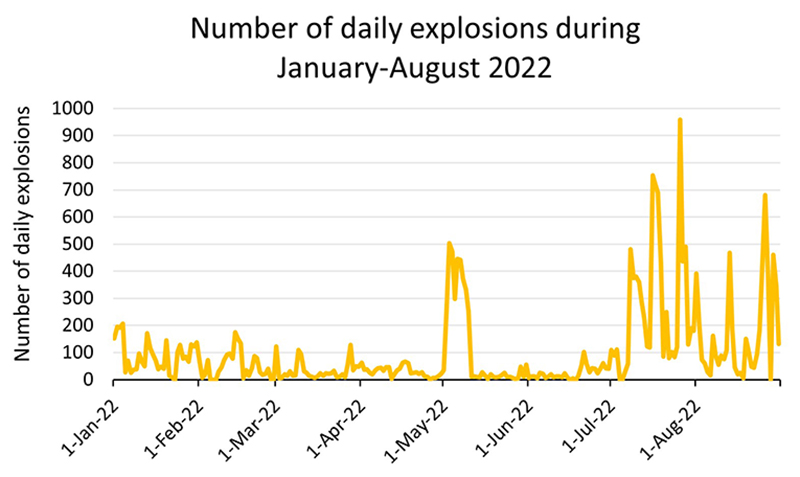 |
Figure 128. Graph showing the number of daily explosions at Sangay during January through August 2022. Data courtesy of IG-EPN (January-August 2022 daily reports). |
Table 11. Monthly summary of explosions and plume heights recorded at Sangay during January through August 2022. Data courtesy of IG-EPN (January-August 2022 daily reports).
| Month | Average number of explosions per day | Max plume height above the crater rim (m) |
| Jan 2022 | 92 | 2,000 |
| Feb 2022 | 59 | 7,000 |
| Mar 2022 | 33 | 1,400 |
| Apr 2022 | 30 | 2,000 |
| May 2022 | 121 | 1,500 |
| Jun 2022 | 26 | 1,500 |
| Jul 2022 | 291 | 2,000 |
| Aug 2022 | 171 | 3,500 |
Activity during January consisted of daily explosions, from 8-207 per day and gas-and-steam emissions containing a small amount of ash that rose as high as 2,000 m above the volcano on 8 January and drifted W and NW. According to the Washington VAAC, several satellite-based images showed ash emissions rising 570-2,070 m above the crater and drifting in several directions, the higher of which occurred on 20 January. Near daily long-period (LP) and tremor events were also reported. During the morning of 8 January crater incandescence was visible. IG reported that on 15 January at 1615 the SAGA seismic station recorded two lahars. Crater incandescence and material was captured in a webcam image on the morning of 18 January (figure 129). On 30 January an ash plume rose 1.5 km above the crater and drifted ESE (figure 130). As a result, according to SNGRE, ash fall was detected in the city of Macas (40 km SE), Morona, and Sucúa (50 km SE), all of which is in the Morona-Santiago province. Slight ashfall was reported in San Isidro the next day on 31 January.
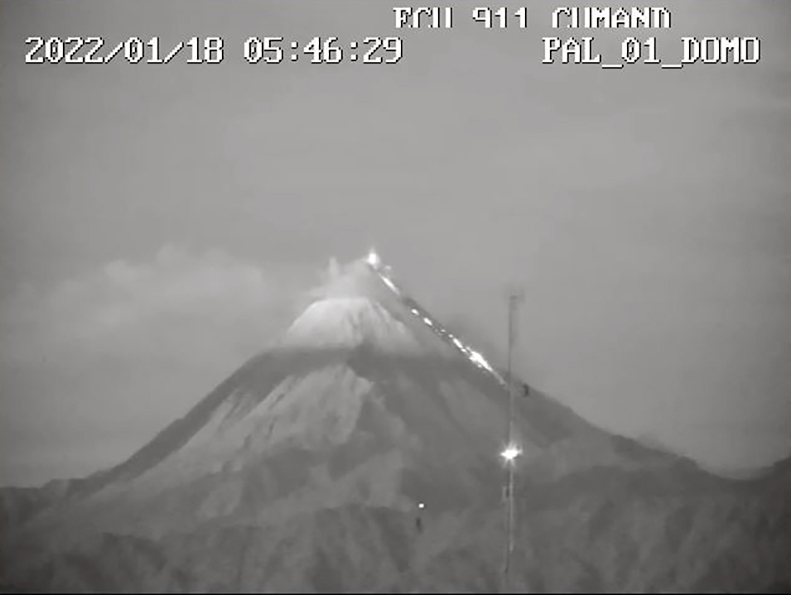 |
Figure 129. Summit incandescence and material descending the flank of Sangay was visible from the ECU 911 webcam at 0546 on 18 January 2022. Courtesy of IG-EPN Daily report. |
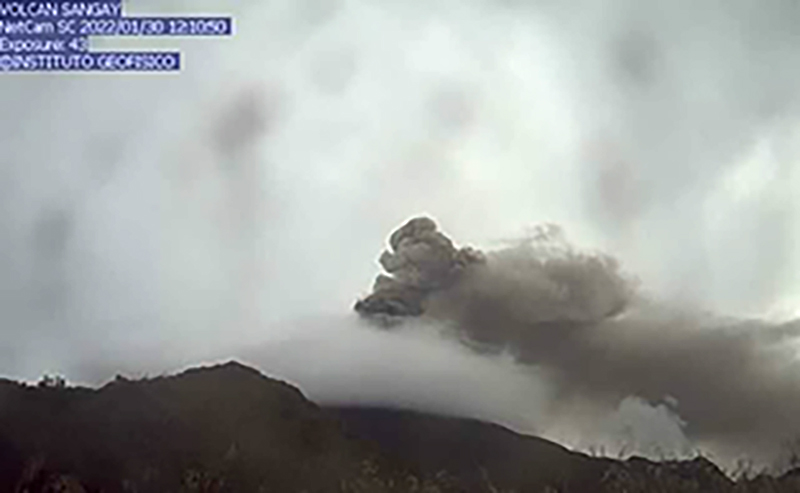 |
Figure 130. A gas-and-ash plume rising above the summit crater of Sangay at 0710 on 30 January 2022. The plume drifted ESE and rose as high as 1.5 km above the crater. Courtesy of IG-EPN Daily report. |
Similar activity continued during February, with 0-174 daily explosions and gas-and-ash plumes rising 570-7 km above the crater, the latter of which occurred on 8 February. The area around the volcano was often cloudy, making surface activity difficult to see. LP and tremor events also persisted nearly every day. Satellite surveillance from the Washington VAAC reported that ash emissions rose as high as 4 km above the crater and drifted NW on 8 February. During the early morning of 4 February minor ashfall was reported in Cebadas (35 km NW) and Palmira (45 km W). According to a VAAC alert on 5 February an ash emission was visible at the summit crater accompanied by blocks on the S flank. On 8 February at 0430, a GOES-16 satellite image showed an ash cloud reaching more than 7 km above the crater and drifting NW (figure 131). Reports from the SNGRE and Volcano Observers Network of Ecuador confirmed ashfall in the Chimborazo province (80 km NW), including Riobama, Colta, Guamote, Bolívar, Las Naves, Los Ríos, and Mocache. During the night of 8 February explosions were reported, which resulted in an incandescent avalanche of material. Two lahars were detected during 11 February, one during 13 February, and one during 14 February. Light ashfall was reported by SNGRE in Guamote (40 km W), though the volcano was obscured by clouds on 11 February. A webcam video near Macas showed that there was an incandescent lava flows visible at night on 13 February as a result of explosions at the summit crater. Ten volcano-tectonic events were reported during 22 February.
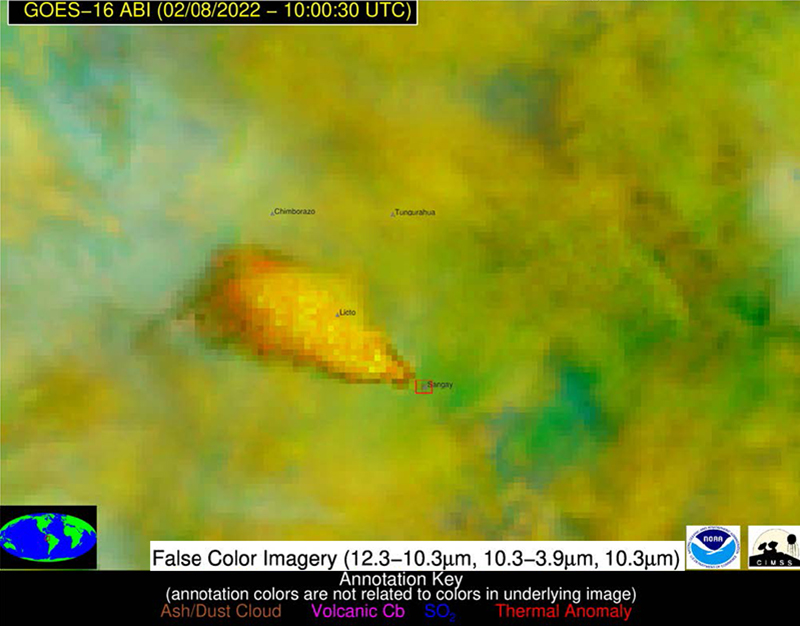 |
Figure 131. GOES-16 satellite image showing a strong ash emissions drifting NW from Sangay on 8 February 2022. Sangay is highlighted by the red box and the ash plume is the darker orange color. Courtesy of IG-EPN Daily report. |
During March, 4-128 explosions were dectected per day, and gas-and-ash plumes rose as high as 1.4 km above the crater. Frequent LP and tremor events were also detected frequently throughout the month. The weather was often cloudy, which prevented clear views of the summit crater. According to the Washington VAAC, ash emissions rose 570-1,170 m above the summit crater and drifted in different directions. The Sentinel-5P satellite using TROPOMI data occasionally reported sulfur dioxide data throughout the month, ranging from 34.7 tons/day to 2,465 tons/day. During the night of 8 and 15 March crater incandescence was visible in webcam images (figure 132). There was a lahar detected on 14 March that lasted 1 hour and 30 minutes. One lahar was detected on 20 March, two occurred on 22 March, two on 25 March, one on 27 March, and one on 29 March. An explosion and crater incandescence were visible on 30 March and an accompanying ash plume rose as high as 870 m and drifted W and SW (figure 133).
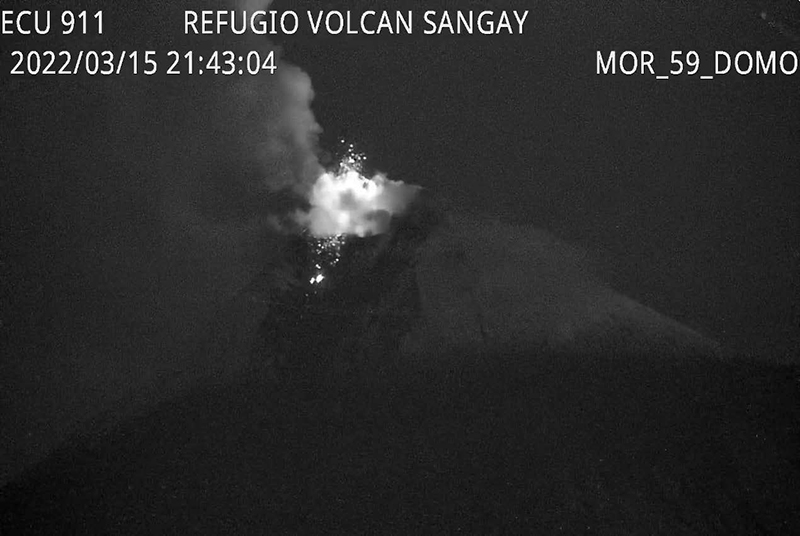 |
Figure 132. Webcam image of Sangay showing an incandescent explosion during the night of 15 March 2022. Incandescent material was deposited on the flank of the volcano, accompanied by an ash plume. Courtesy of IG-EPN Daily report. |
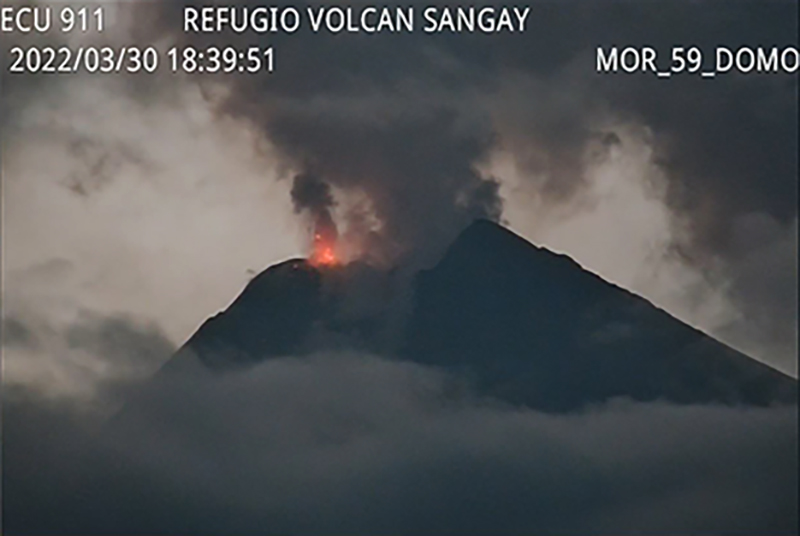 |
Figure 133. Webcam image showing an incandescent explosion and accompanying ash plume rising above Sangay on 30 March 2022 using the ECU 911 webcam. Courtesy of IG-EPN Daily report. |
During April, there were 1-66 daily explosions. Gas-and-ash emissions rose 700-2,000 m above the crater. According to data from the Washington VAAC, gas-and-ash emissions rose 570-2,070 m above the crater and drifted in various directions. Sulfur dioxide based on TROPOMI data ranged from 15.5 tons/day to 2,169 tons/day. During 31 March to 1 April several explosions were detected with incandescent blocks rolling down the flanks of the volcano (figure 134). Frequent LP and tremor events occurred throughout the month. During the night of 1 and 5 April minor ashfall was reported in Guamote and Palmira, respectively by ROVE (Volcano Observers Network). A lahar was detected on 9, 10, 13, 14, 19, 21, 27, 28, 29 April, based on seismic signals that IG recorded; two lahars were detected on 15 April and three lahars occurred on 30 April. During the early morning of 11 April Strombolian explosions were observed. Light ashfall was observed in Chauzán (40 km W), according to ROVE on 13 April; in addition, crater incandescence was visible at the volcano.
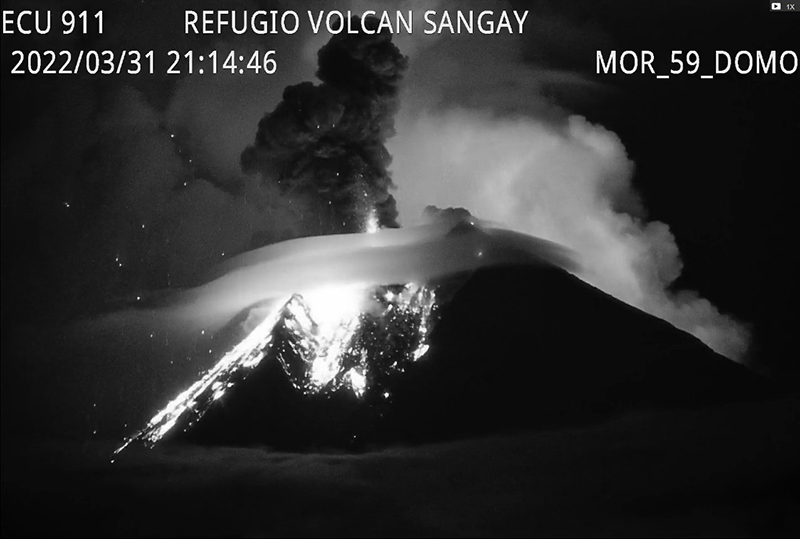 |
Figure 134. Image from the ECU 911 webcam showing several incandescent explosions at Sangay during the night of 31 March 2023. Incandescent blocks of material descended the flanks as a result. Courtesy of IG-EPN Daily report. |
Activity continued during May. The number of daily explosions increased to 3-503 per day compared to the previous month. Gas-and-ash emissions rose 500-1,500 m above the crater, though cloudy weather often obscured clear views of the summit. The largest number of explosions occurred on 3 May (503). Occasional LP and tremor-type events were also reported during the month. According to data from the Washington VAAC, gas-and-ash emissions rose 570-2,370 m above the crater and drifted in different directions. Sulfur dioxide measurements from TROPOMI data ranged from 19 tons/day to 430 tons/day. A total of two lahars were detected at 2315 on 3 May and 1030 on 4 May. Another lahar occurred at 1100 on 5 May and on 12 May. Two lahars were reported on 13, 17, 26, 27 May and one on 14, 15, 16, 18, 29 May. Three reports of ashfall were issued, starting at 0754 on 25 May, based on observations in Chauzan and Ichubamba.
In June, daily explosions ranged from 4-101 per day. Gas-and-ash plumes rose 300-1,500 m above the crater and drifted in different directions, though clouds often obscured the view of the summit. The Washington VAAC reported that gas-and-ash emissions rose 570-2,370 m above the crater. The Sentinel-5P satellite using TROPOMI data recorded 17 tons/day to 413 tons/day of sulfur dioxide. Lahars were generated on 8, 9, 11, 12, 23, 26 June based on seismic station signals. During 15-16 June a thin ash cloud rose 1.4 km above the crater and drifted WSW. As a result, there were reports of ashfall in Retén Ichubamba (35 km NW). On 21 June a lahar was observed, in addition to a gas-and-ash plume that rose 1 km above the crater that drifted W. A volcano-tectonic earthquake was also detected that day, along with 97 LP-type events and 83 emission tremor-type events. During 26-27 June a gas-and-ash plume rose 1.4 km above the crater and drifted W and SW, according to IG (figure 135).
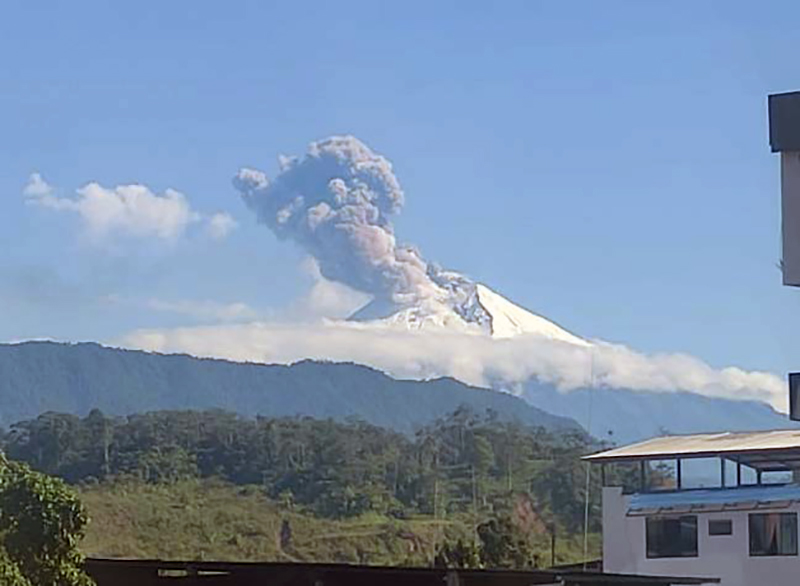 |
Figure 135. Photo of Sangay with a gas-and-ash plume rising 1.4 km above the crater at 0910 at 27 June 2022. Courtesy of Luis Castillo, IG-EPN Daily report. |
A high number of daily explosions occurred during July, with 27-959 per day. Gas-and-ash plumes rose 700-2,000 m above the crater, though clouds often prevented clear views of the summit. The Washington VAAC issued volcanic ash notices each day that reported ash emissions rising 570-2,400 m above the summit. TROPOMI data recorded 87 tons/day to 302 tons/day of sulfur dioxide. Frequent LP and emission tremor events continued to be recorded. Lahars were recorded on 3, 5, 8, 9, 11, and 20 July, according to the SAGA seismic station. On 7 July there were 480 explosions detected, and ash emissions rose 870-1,170 m above the crater and drifted W. A volcano-tectonic-type event was also detected. During the night of 7 July, a webcam image showed an explosion and incandescent material on the SE flank of the volcano (figure 136). On 16 July gas-and-ash emissions rose 1 km above the crater and drifted NW. Though the summit was mostly cloudy throughout the day, ECU 911 webcam images showed a Strombolian explosion and incandescent material descending the SE flank (figure 137). No reports of ashfall were made.
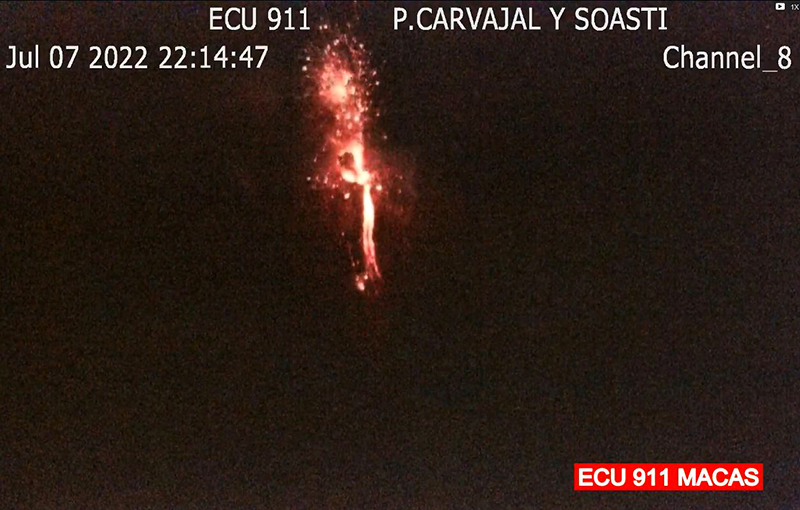 |
Figure 136. Incandescent material was observed on the SE flank of Sangay at 2214 on 7 July, based on the ECU 911 webcam. Courtesy of IG-EPN Daily report. |
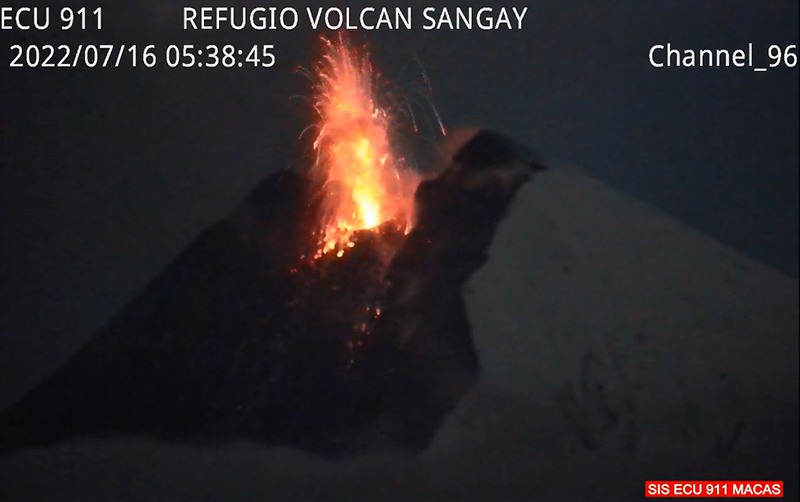 |
Figure 137. ECU 911 webcam image showing a Strombolian explosions and incandescent material descending the SE flank of Sangay at 0538 on 16 July. Courtesy of IG-EPN Daily report. |
On 18 July there were 689 explosions detected, though weather made it difficult to observe any surface activity. During 19 July the Washington VAAC reported that ash emissions rose 570-870 m above the summit and drifted W. As a result, light ashfall was reported in Alausí, according to SNGRE and ROVE. During the night of 21 July the ECU 911 webcam showed continuous incandescent explosive activity, in addition to an avalanche of incandescent material on the SE flank. There were 959 explosions detected on 26 July, accompanied by gas-and-ash emissions that rose 500 m above the crater and drifted W. According to IG, there were 23 lahars detected during 26 and 27 July. During the morning of 29 July an incandescent avalanche of material was visible on the SE flank. There were reports of explosion-like noises and window vibrations during the morning of 31 July from residents in the towns of Nabón, San Fernando, Guayaquil, Samborondón, and Salitre. Additionally, SNGRE reported that ashfall was detected in Guayaquil, Samborondon, Duran, Salitre, and Daule.
Strong-to-moderate activity continued into August, with 4-680 daily explosions and gas-and-ash plumes that rose 500-3,500 m above the crater, though the summit was often obscured by clouds. The Washington VAAC reported ash emissions as high as 870-2,060 m above the crater. Sulfur dioxide measurements ranged from 17 tons/day to 1,730 tons/day. Occasional LP and emission events occurred throughout the month. On 3 August there were reports of noises coming from the volcano according to residents in Molleturo. Lahars were detected in seismic signals on 5, 9-10, 20, and 29 August. During the evening of 9 August crater incandescence was visible, accompanied by blocks rolling down the flanks of the volcano (figure 138). Ashfall was observed over the SAGA station 5 km SW of the volcano.
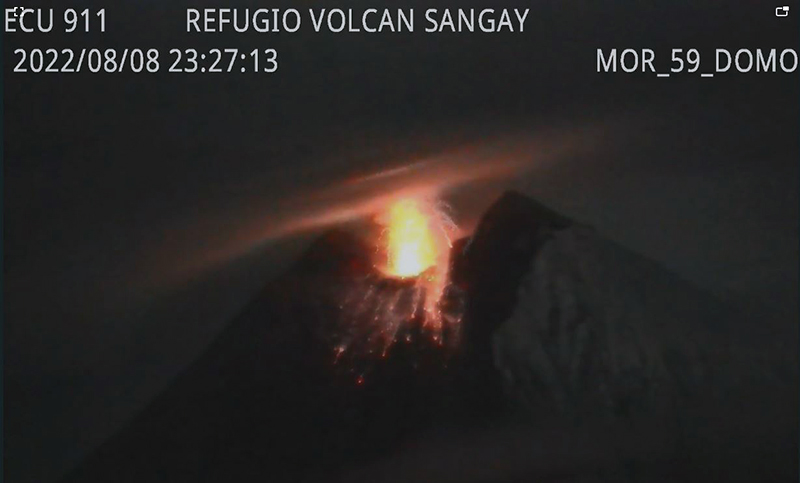 |
Figure 138. Image from the ECU 911 webcam showing crater incandescence at Sangay at 2327 on 8 August 2022. Courtesy of IG-EPN Daily report. |
Surface activity increased on 12 August, which consisted of low altitude ash emissions (less than 2 km above the crater), and an ash cloud that extended W and SW across Chimborazo, Bolivar, Cañar, Azuay, and Guayas. There were reports of ashfall in the provinces of Chimborazo (Cebadas, Palmira, Chunchi, and Alausí) and Guayas (Guayaquil, Milagro, and Samborondón). A new lava flow was observed on the SE flank, which was visible in ECU 911 webcam and satellite images. Sounds were audible in several places in the Guayas province, and it was possible to see incandescence from Macas. A strong ash plume rose more than 3.5 km above the crater on 14 August that drifted SW (figure 139). Ashfall was also reported on 14 August in Chauzán San Alfonso in the province of Chimborazo.
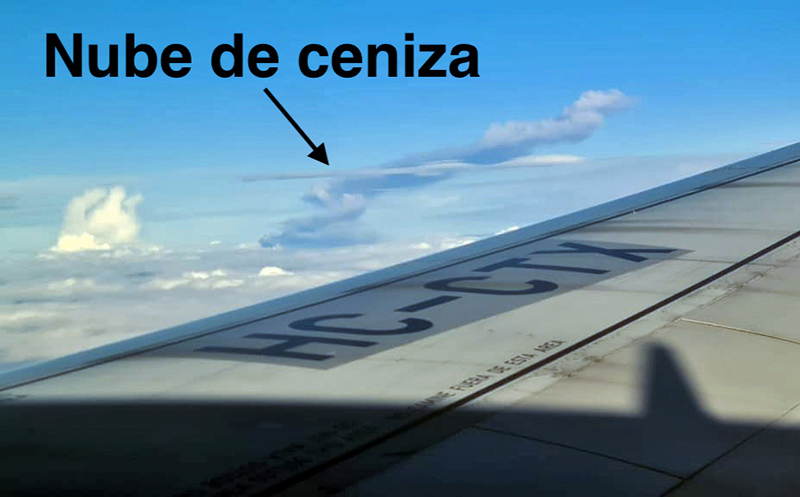 |
Figure 139. Photo of an ash plume rising more than 3.5 km above the crater of Sangay at 1730 on 14 August 2022. Courtesy of IG-EPN Daily report. |
On 16 August several continuous gas-and-steam and ash emissions rose higher than 2 km above the crater and drifted mainly W. Ashfall was reported by ROVE in Pancun Ichubamba, Guamote, and Chimborazo. Similar activity occurred into the next day, with ashfall confirmed in Cebadas, Palmira, Sibambe, Tixán, Multitud, Chauzan, and Atapo Santa Cruz in the province of Chimborazo. During the night of 17 August SNGRE reported light ashfall in Alausí (Achupallas, Multitud, Sibambe and Tixán) and Guamote (Cebadas and Palmira). During the early morning of 19 August SNGRE reported light ashfall in Guamote (Cebadas and Palmira). During the night of 23 August crater incandescence was visible with blocks descending the E flank. On 26 August there were 680 explosions detected, which was accompanied by ash emissions that rose 870 m above the crater, according to the Washington VAAC.
Beginning around August 2021, the Sentinel-2 MODIS Thermal Volcanic Activity graph provided by the MIROVA system showed persistent strong thermal signatures in and near the summit area through November 2022 (figure 140). According to the MODVOLC Thermal Alerts system, there were 375 hotspots detected during the reporting period: 81 in January, 61 in February, 72 in March, 21 in April, 56 in May, 35 in June, 27 in July, and 22 in August. These were likely due to frequent incandescence block avalanches that affected the flanks of the volcano, which were occasionally visible in Sentinel-2 infrared satellite imagery, which were seen affecting the N flank during January through June 2022 (figure 141). Frequent, strong sulfur dioxide plumes were also captured by the TROPOMI instrument on the Sentinel-5P satellite; many of these plumes exceeded 2 Dobson Units (DUs) and drifted in different directions (figure 142).
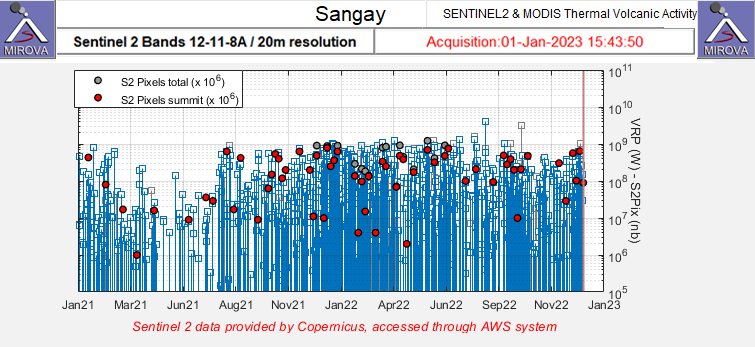 |
Figure 140. Thermal activity at Sangay was relatively strong due to intermittent incandescent block avalanches on the flanks. Strong thermal activity (red dots) persisted from August 2021 through November 2022, as recorded by the Sentinel-2 MODIS Thermal Volcanic Activity data (bands 12, 11, 8A). Courtesy of MIROVA. |
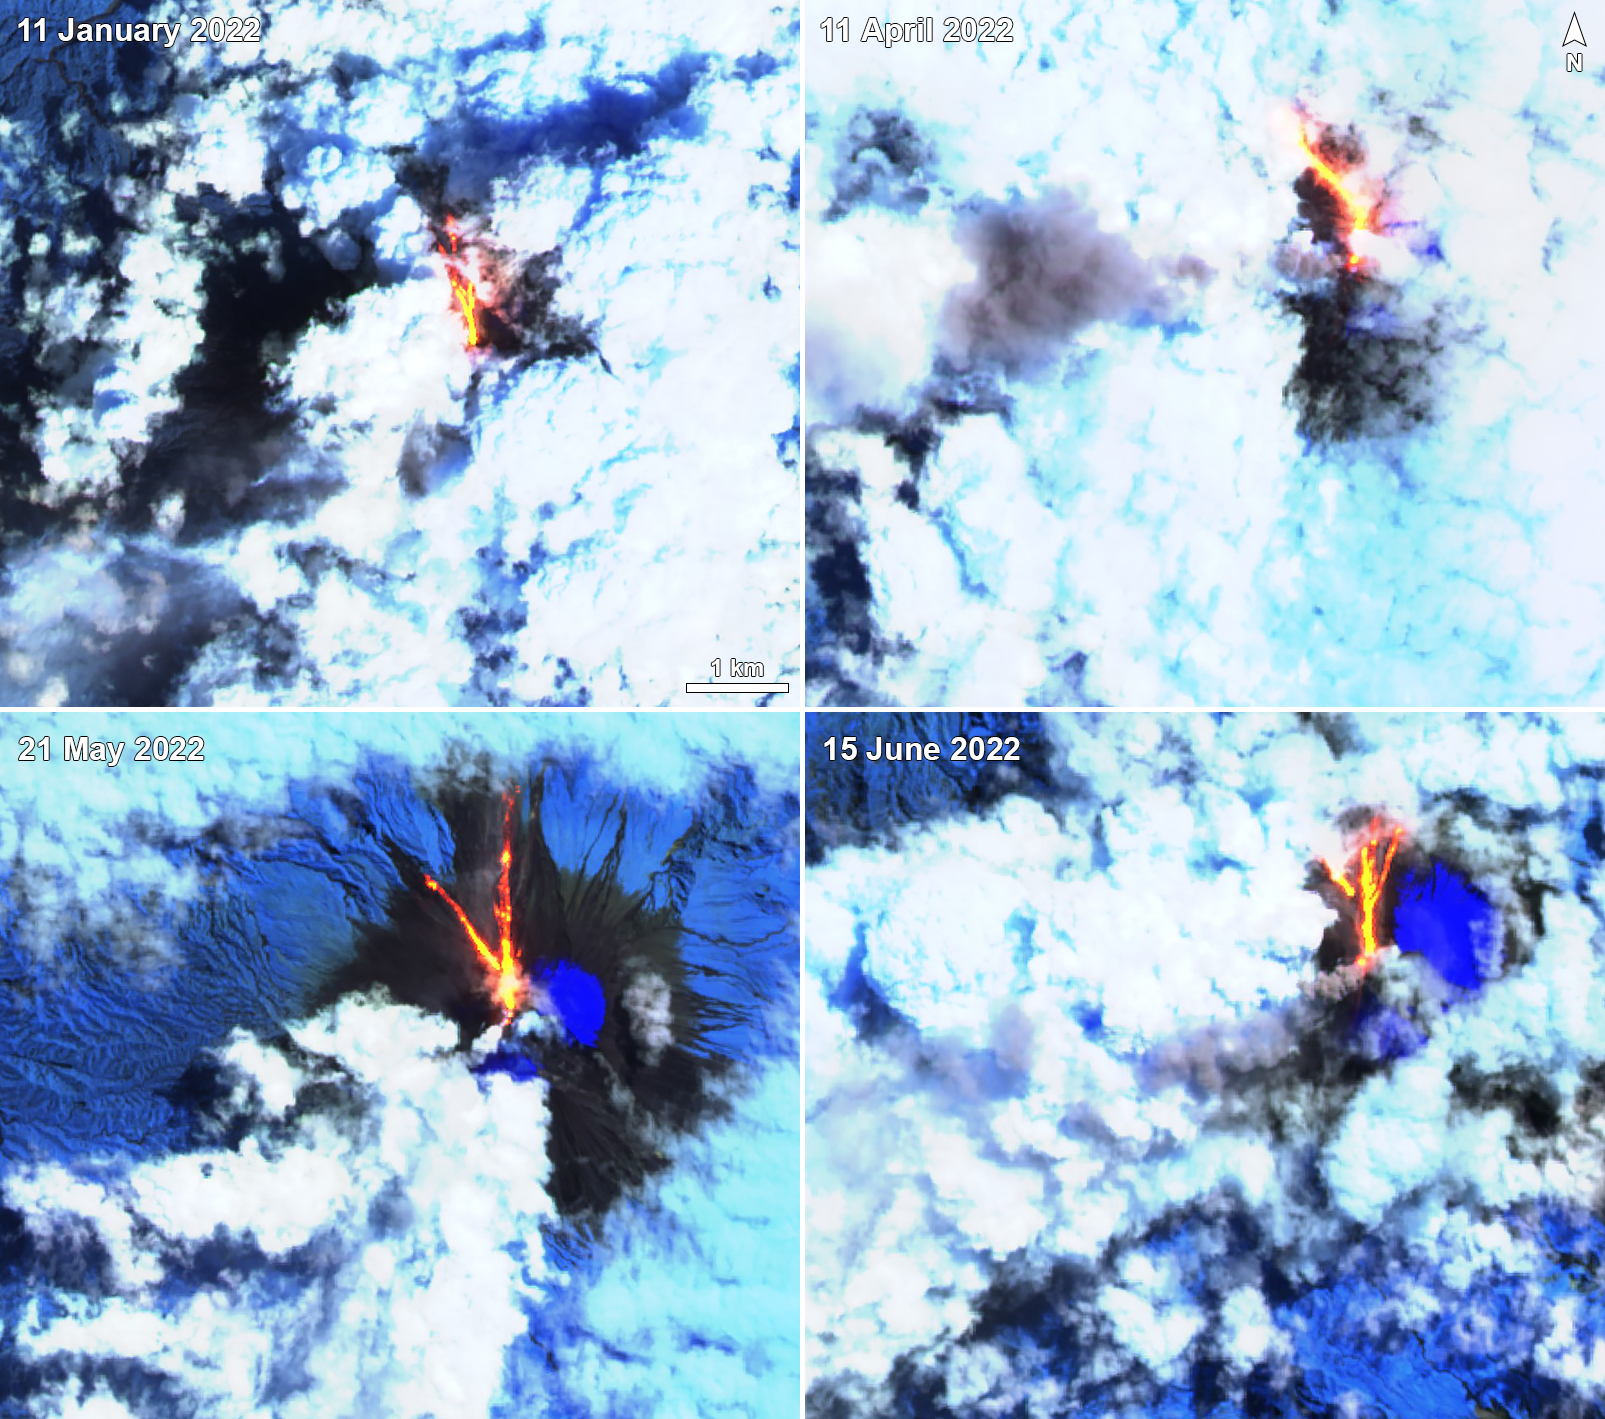 |
Figure 141. Strong thermal activity was reflected in these Sentinel-2 infrared satellite images of Sangay on 11 January 2022 (top left), 11 April (top right), 21 May (bottom left), and 15 June (bottom right). Incandescent block avalanches shown here mainly descended the N flanks of the volcano. Images use Atmospheric penetration rendering (bands 12, 22, 8A). Courtesy of Sentinel Hub Playground. |
 |
Figure 142. Strong sulfur dioxide plumes originated from Sangay throughout the reporting period, as shown here on 2 January 2022 (top left), 6 February (top middle), 17 March (top right), 5 April (bottom left), 21 June (bottom middle), and 29 July (bottom right). Each of these plumes exceed 2 Dobson Units (DUs) and drift in different directions. Sangay is located toward the bottom of the satellite images with sulfur dioxide plumes; Colombia’s Nevado del Ruiz is the topmost symbol that also frequently emits sulfur dioxide. Data is from the TROPOMI instrument on the Sentinel-5P satellite. Courtesy of NASA Global Sulfur Dioxide Monitoring Page. |
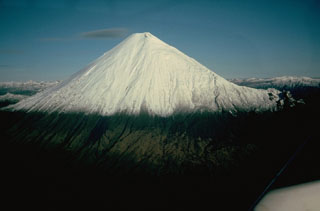
Geological Summary. The isolated Sangay volcano, located east of the Andean crest, is the southernmost of Ecuador's volcanoes and its most active. The steep-sided, glacier-covered, dominantly andesitic volcano grew within the open calderas of two previous edifices which were destroyed by collapse to the east, producing large debris avalanches that reached the Amazonian lowlands. The modern edifice dates back to at least 14,000 years ago. It towers above the tropical jungle on the east side; on the other sides flat plains of ash have been eroded by heavy rains into steep-walled canyons up to 600 m deep. The earliest report of an eruption was in 1628. Almost continuous eruptions were reported from 1728 until 1916, and again from 1934 to the present. The almost constant activity has caused frequent changes to the morphology of the summit crater complex.
Information Contacts: Instituto Geofísico, Escuela Politécnica Nacional (IG-EPN), Casilla 17-01-2759, Quito, Ecuador (URL: http://www.igepn.edu.ec/); Servicio Nacional de Gestion de Riesgos y Emergencias (SNGRE), Samborondón, Ecuador (URL: https://www.gestionderiesgos.gob.ec/); Washington Volcanic Ash Advisory Center (VAAC), Satellite Analysis Branch (SAB), NOAA/NESDIS OSPO, NOAA Science Center Room 401, 5200 Auth Rd, Camp Springs, MD 20746, USA (URL: www.ospo.noaa.gov/Products/atmosphere/vaac, archive at: http://www.ssd.noaa.gov/VAAC/archive.html); MIROVA (Middle InfraRed Observation of Volcanic Activity), a collaborative project between the Universities of Turin and Florence (Italy) supported by the Centre for Volcanic Risk of the Italian Civil Protection Department (URL: http://www.mirovaweb.it/); Hawai'i Institute of Geophysics and Planetology (HIGP) - MODVOLC Thermal Alerts System, School of Ocean and Earth Science and Technology (SOEST), Univ. of Hawai'i, 2525 Correa Road, Honolulu, HI 96822, USA (URL: http://modis.higp.hawaii.edu/); Sentinel Hub Playground (URL: https://www.sentinel-hub.com/explore/sentinel-playground); NASA Global Sulfur Dioxide Monitoring Page, Atmospheric Chemistry and Dynamics Laboratory, NASA Goddard Space Flight Center (NASA/GSFC), 8800 Greenbelt Road, Goddard MD 20771, USA (URL: https://so2.gsfc.nasa.gov/).