Report on Villarrica (Chile) — October 2022
Bulletin of the Global Volcanism Network, vol. 47, no. 10 (October 2022)
Managing Editor: Edward Venzke.
Edited by Kadie L. Bennis.
Villarrica (Chile) Ongoing seismicity, gas-and-steam emissions, and crater incandescence during March-September 2022
Please cite this report as:
Global Volcanism Program, 2022. Report on Villarrica (Chile) (Bennis, K.L., and Venzke, E., eds.). Bulletin of the Global Volcanism Network, 47:10. Smithsonian Institution.
Villarrica
Chile
39.42°S, 71.93°W; summit elev. 2847 m
All times are local (unless otherwise noted)
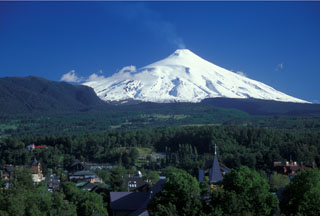
Villarrica, located in central Chile, consists of a presently active 2-km-wide caldera that formed about 3,500 years ago, located at the base of the active cone. Eruptions dating back to 1558 have been characterized by mild-to-moderate explosive activity with occasional lava effusion. The current eruption period began in December 2014 and has recently included low-level activity and incandescence from lava in in the summit crater, gas-and-steam emissions, and sulfur dioxide emissions. This reporting period covers activity during March-September 2022 describing seismicity, gas-and-steam plumes, and nighttime incandescence. Information for this report primarily comes from the Southern Andes Volcano Observatory (Observatorio Volcanológico de Los Andes del Sur, OVDAS), part of Chile's National Service of Geology and Mining (Servicio Nacional de Geología y Minería, SERNAGEOMIN) and satellite data.
Seismicity during March 2022 consisted of a continuous tremor signal with relatively low RSAM energy values. There were three volcano-tectonic (VT) seismic events, as many as 4,774 long-period (LP) events, and 19 tremor (TR) events were recorded. Occasional gas-and-steam emissions rose as high as 900 m on 11 March. Sulfur dioxide data was obtained by the Differential Absorption Optical Spectroscopy Equipment (DOAS), corresponding to the Los Nevados and Tralco stations that were installed 10 km ENE and 6 km ESE from the active crater, respectively. The average value of sulfur dioxide emissions was 391 ± 107 tons per day (t/d); the maximum daily value was 826 t/d on 20 March; according to SERNAGEOMIN, these values were relatively low. An analysis of Sentinel-2 satellite images showed that six thermal anomalies occurred in the crater on 4, 9, 11, 16, 24, and 31 March.
Similar low activity continued during April. The continuous tremor signal was detected, and there were seven VT-type seismic events associated with rock fracturing events, 9,993 LP-type events that were associated with fluid dynamics in the volcanic system, and 89 TR-type events. The DOAS data showed that the average value of sulfur dioxide emissions was 337 ± 72 t/d, with a maximum daily value of 621 t/d on 5 April. Thermal anomalies were visible in Sentinel-2 satellite images on 8, 13, 15, 18, 28, and 30 April. Intermittent gas-and-steam emissions rose as high as 1.1 km on 16 April.
Low seismicity during May consisted of a continuous tremor, three VT-type events, 7,287 LP-type events, and 335 TR-type events. Gas-and-steam emissions continued to occur, rising as high as 940 m on 10 May. The average value of sulfur dioxide emissions decreased to 260 ± 45 t/d compared to the previous month, with a maximum daily value of 715 t/d on 7 May. There were seven thermal anomalies visible in Sentinel-2 satellite images on 3, 5, 10, 13, 15, 18, and 25 May. Nighttime incandescence was observed beginning on 25 May and continued through the end of the month (figure 117).
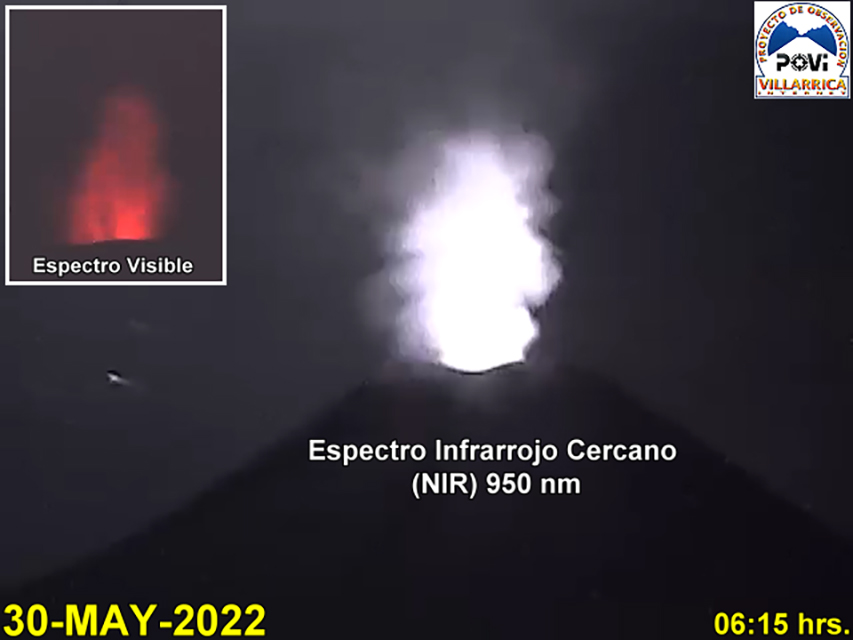 |
Figure 117. Near-infrared webcam image showing nighttime crater incandescence at Villarrica at 0615 on 30 May 2022. Courtesy of POVI. |
During June continuous tremor, 12 VT-type events, 6,411 LP-type events, and 188 TR-type events were detected throughout the month. Due to weather conditions, sulfur dioxide was only measured on one day; on 25 June the average value was 1,075 t/d. Three thermal anomalies were detected in Sentinel-2 satellite images on 9, 12, and 17 June. Based on surveillance cameras, frequent gas-and-steam emissions rose as high as 800 m on 21 June. Nighttime incandescence was notably strong during 25 June.
Seismicity persisted during July; a continuous tremor signal was detected, in addition to 15 VT-type seismic events, 5,720 LP-type events, and 12 TR-type events. Surveillance cameras recorded regular degassing in the area, and a 1-km-high gas-and-steam column was reported on 14 July. Nighttime incandescence was recorded throughout the month. Sulfur dioxide measurements were taken on three days of the month due to weather conditions; on 31 July the average value was 3,668 t/d, which SERNAGEOMIN reported was within normal levels. Two thermal anomalies were detected in the crater area on 14 and 29 July.
Seismic activity during August was characterized by 9 VT-type events, 1,449 LP-type events, and 2 TR-type events. There was a notable increase in the average value of sulfur dioxide emissions of 2,524 ± 386 t/d, with a maximum daily value of 5,304 t/d on 11 August. According to SERNAGEOMIN, these values were above the levels that are considered normal. The Sentinel-2 satellite captured a total of 5 thermal anomalies in imagery on 1, 3, 8, 21, and 29 August. Constant degassing persisted, rising as high as 340 m on 28 August. During clear weather days, nighttime incandescence was also observed.
Similar activity continued during September. Seismicity was characterized by 11 VT-type events, 1,718 LP-type events, and 2 TR-type events throughout the month. The average value of sulfur dioxide emissions was 2,010 ± 432 t/d, with a maximum daily value of 4,806 t/d on 5 September; these values were still considered above average. There was a total of six thermal anomalies detected in Sentinel-2 satellite imagery on 2, 5, 10, 12, 27, and 30 September. Frequent gas-and-steam emissions were captured in webcam images, with a maximum plume rising as high as 400 m above the crater on 24 September. Nighttime incandescence was also visible on clear weather days. During late September gas-and-steam emissions occasionally contained some amount of pyroclasts, which were deposited near the crater rim.
Infrared MODIS satellite data processed by MIROVA (Middle InfraRed Observation of Volcanic Activity) detected low thermal activity once during early April, twice during mid-and-late May, seven times during August, and five times during September (figure 118). Small but consistent thermal anomalies were visible at the crater in Sentinel-2 infrared satellite imagery throughout the reporting period (figure 119).
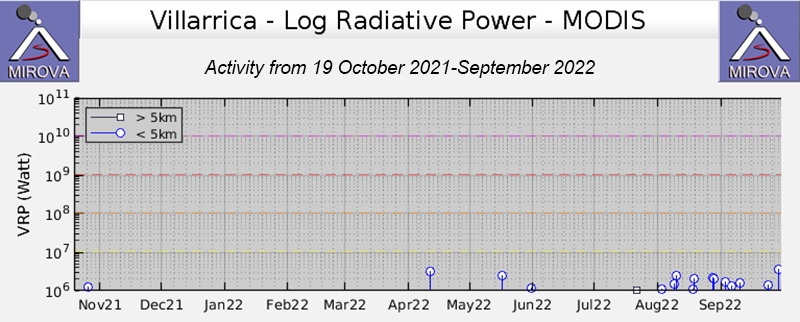 |
Figure 118. Graph of low-power thermal anomalies (Log Radiative Power) at Villarrica from the MIROVA system during October 2021-September 2022. A single thermal anomaly was detected during early April, two during mid-to-late May, seven times during August, and five times during September. Courtesy of MIROVA. |
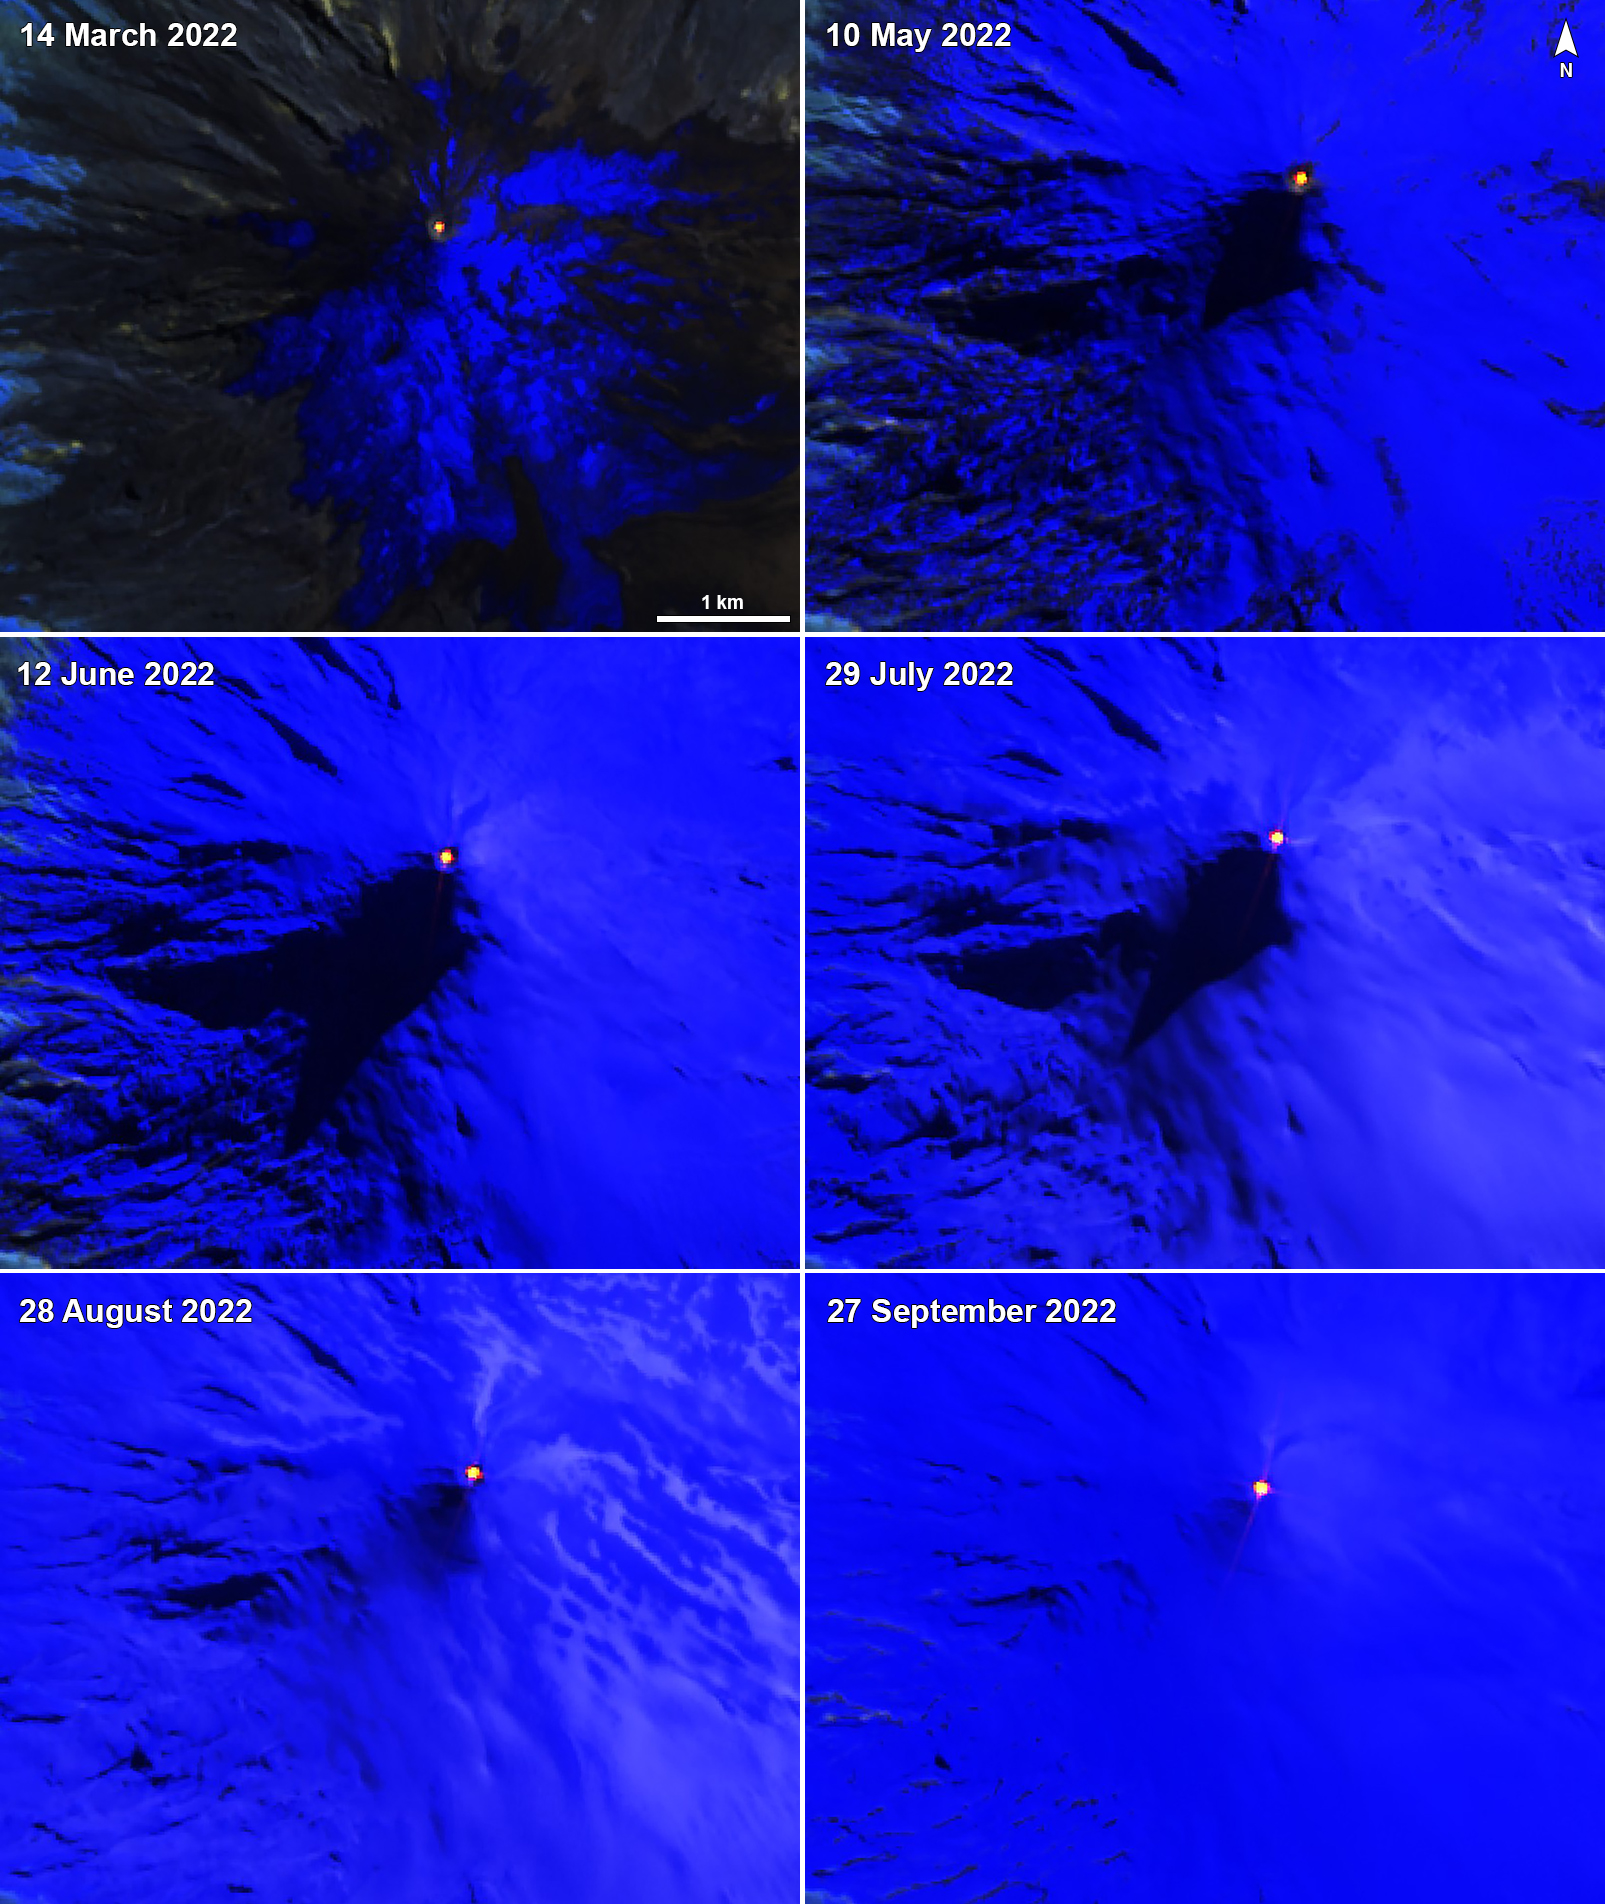 |
Figure 119. Consistent thermal anomalies in the summit crater of Villarrica were visible in Sentinel-2 infrared satellite images on 14 March 2022 (top left), 10 May 2022 (top right), 12 June 2022 (middle left), 29 July 2022 (middle right), 28 August 2022 (bottom left), and 27 September 2022 (bottom right) on clear weather days. Images use Atmospheric penetration rendering (bands 12, 11, 8a). Courtesy of Sentinel Hub Playground. |
Geological Summary. The glacier-covered Villarrica stratovolcano, in the northern Lakes District of central Chile, is ~15 km south of the city of Pucon. A 2-km-wide caldera that formed about 3,500 years ago is located at the base of the presently active, dominantly basaltic to basaltic andesite cone at the NW margin of a 6-km-wide Pleistocene caldera. More than 30 scoria cones and fissure vents are present on the flanks. Plinian eruptions and pyroclastic flows that have extended up to 20 km from the volcano were produced during the Holocene. Lava flows up to 18 km long have issued from summit and flank vents. Eruptions documented since 1558 CE have consisted largely of mild-to-moderate explosive activity with occasional lava effusion. Glaciers cover 40 km2 of the volcano, and lahars have damaged towns on its flanks.
Information Contacts: Servicio Nacional de Geología y Minería (SERNAGEOMIN), Observatorio Volcanológico de Los Andes del Sur (OVDAS), Avda Sta María No. 0104, Santiago, Chile (URL: http://www.sernageomin.cl/); Proyecto Observación Villarrica Internet (POVI) (URL: http://www.povi.cl/); MIROVA (Middle InfraRed Observation of Volcanic Activity), a collaborative project between the Universities of Turin and Florence (Italy) supported by the Centre for Volcanic Risk of the Italian Civil Protection Department (URL: http://www.mirovaweb.it/); Sentinel Hub Playground (URL: https://www.sentinel-hub.com/explore/sentinel-playground).