Report on Atmospheric Effects (1980-1989) — May 1983

Atmospheric Effects (1980-1989)
Scientific Event Alert Network Bulletin, vol. 8, no. 5 (May 1983)
Managing Editor: Lindsay McClelland.
Atmospheric Effects (1980-1989) Aerosol cloud remains strong
Please cite this report as:
Global Volcanism Program, 1983. Report on Atmospheric Effects (1980-1989) (McClelland, L., ed.). Scientific Event Alert Network Bulletin, 8:5. Smithsonian Institution.
Atmospheric Effects (1980-1989)
All times are local (unless otherwise noted)
The following paragraph is from Alan Strong. "Stratospheric aerosols from El Chichón continue to produce offsets in satellite measurements of sea-surface temperatures. NOAA has used these offsets to monitor the month-to-month evolution of the aerosol cloud over the northern and southern hemispheres. Revised analyses agree well with data from the Solar Mesospheric Explorer satellite and show spreading S of the equator by June 1982, followed by a more extensive southward push during August, when the northern limit of the aerosols was rarely beyond 30°N. During autumn, material began diffusing northward over the Pacific Ocean and by December was extensive over North America. The NOAA 7 satellite measurements continued to show large sea surface temperature offsets (i.e. high aerosol concentrations) into January, but by February this higher-latitude material appeared to migrate away from North America over the North Pacific. In April, although some material was indicated between 10°S and 20°N, with some increases being seen in the southern hemisphere, the highest concentrations appeared to be north of 50°N over the Pacific."
David Hofmann reported that data from a balloon launched at Palestine, Texas (31.6°N, 96.5°W) on 16 May showed a peak concentration of about 5.2 particles (larger than 0.15 µm) per cm3 at about 20 km altitude. Remnants of the extensive cloud of tiny aerosols first detected above Wyoming 28 January were encountered between 25 km and the upper limit of reliable data collection at 35 km altitude, peaking at 12 particles per cm3 at 30 km. Background at this altitude is about 1-2 particles per cm3. Similar concentrations of these tiny particles were measured from Laramie, Wyoming 25 May. The larger (> 0.15 µm) aerosols were again centered at about 20 km altitude. Concentrations of 7.3/cm3 were detected, more than in Texas nine days earlier, but slightly less than January-February peak values of 8-10/19cm3 over Wyoming.
Lidar observations from Fukuoka, Japan showed a slight decrease in both the altitude and density of the strongest layer of El Chichón aerosols in early May. From Mauna Loa, Hawaii a new layer that straddled the troposphere/stratosphere boundary (tropopause heights during May lidar measurements were 15.6-15.9 km) was first noted 11 May between 15.2 and 16.5 km altitude and was quite strong during the next observation 25 May, ranging from 13-16.4 km. This layer was weaker during subsequent lidar measurements, but some material was still present at these altitudes 8 June. The new material slightly boosted the integrated backscatter over Mauna Loa, but little change was noted in aerosol layers higher in the stratosphere.
JMA has collected pyrheliometer data from a number of stations since 1959. A marked increase in atmospheric turbidity has been evident since autumn 1982 in the combined data (figure 3), while data from individual locations shows effects beginning earlier at southern stations (figure 4).
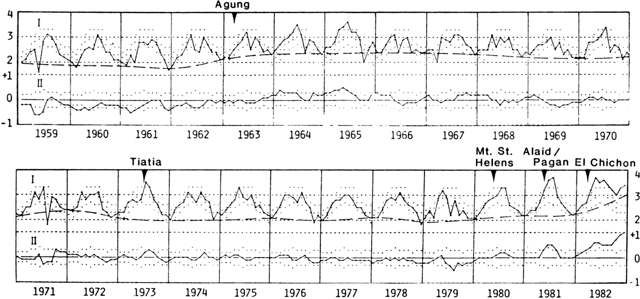 |
Figure 3. Variations in atmospheric turbidity over Japan, 1959-1982, comparing the effects of several large eruptions in two plots. The increase after the El Chichón eruption is substantially larger than those following major explosive events at Tiatia, Agung, St. Helens, Alaid, and Pagan. I) Monthly minimum turbidity coefficients (connected by solid line) from pyrheliometer observations at JMA stations were used to reduce local tropospheric effects. The dashed line connects winter values only; T. Yamauchi cautions that abundant water vapor over Japan during the summer might disturb turbidity observations. Three other points are also plotted for each month: the middle point, of "normal" value, is the mean of the 1959-1982 minimum values for that month; the upper and lower points define the range of one standard deviation from that "normal" value. II) The 3-month running means of deviations form the "normal" value are connected by the solid line. The dots again show one standard deviation for each month. The abnormally high turbidity after several of the large eruptions, especially El Chichón, is emphasized by this plot. Courtesy of Toshio Fujita and Toyotaro Yamauchi. |
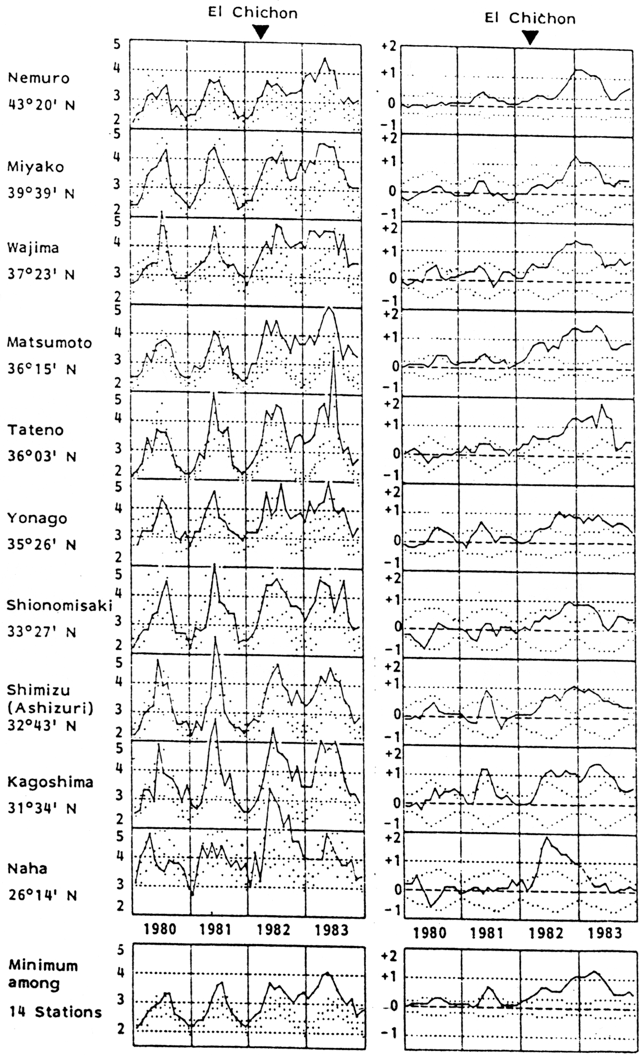 |
Figure 4. Atmospheric turbidity measured at ten stations in Japan, 1980-83, comparing the cloud from El Chichón with those produced by eruptions from St. Helens, Alaid, and Pagan. Note that El Chichón aerosols were first detected at the southernmost stations, nearest in latitude to the volcano. Left: monthly minimum (solid lines) of Feussner-Dubois' turbidity factor (t0) from pyroheliometer observations (at 0900, 1200, and 1500 local time) by JMA stations. The middle dot is the mean minimum monthly value, 1951-1980; the top and bottom dots define one standard deviation from the mean. Right: the solid line shows the deviation of the 3-month running mean of the monthly minimum turbidity factor (t0) from the 1951-1980 mean monthly minimum. Dots again mark a range of one standard deviation. Courtesy of Toyotaro Yamauchi and H, Shimura. |
José Caburian reported gaudy dawns and twilights in the Philippines in early 1983. Dawns and twilights at low latitudes are usually relatively brief, but colors have been observed for an hour or more before sunrise and after sunset. From Jeddah, Saudi Arabia, Edward Brooks observed pale dawn and twilight colors 22-25 April but on the 26th, colors were present only in the sky N of the sunrise and sunset points. Late dawn and early dusk colors were visible 27-28 April, indicating aerosols at lower altitudes, but material at higher altitudes produced colors long before sunrise 29 April-1 May and well after sunset 29 April. Bands of aerosols were observed early 1 May and late 2 May. Only late dawn colors were seen 4-5 May but NNE-SSW bands of aerosols were present early on the 5th. Overcast weather limited observations 7-10 May but little color was apparent through breaks in the clouds. Two-stage dawns, indicative of aerosols in both the lower stratosphere and at higher altitudes, were seen 11-12 May; early dawn on the 12th was fiery red, and long dark NNW-SSE bands of aerosols were visible nearer to sunrise. Only late dawn colors were noted 13-15 May, but there were broad N-S bands of aerosols on the 14th. Sunrises and sunsets were nearly colorless 16-19 May, but brilliant 2-stage dawns and twilights with N-S bands of aerosols occurred 20-21 May. Long crepuscular rays extended to 30° above the horizon early 21 May. Fred Schaaf noted that twilight effects at Millville, New Jersey continued to diminish in April and early May. An aureole around the sun remained prominent on some days, although it was far weaker than in previous months. A Bishop's Ring of 20-30° radius was visible for 1 or more hours before sunset in late April. From a good viewing site 22 April, Schaaf observed 10 minutes of purple light that faded at 5-10° altitude at 1910 local time, indicating material only to roughly 9.5-13 km altitude.
Information Contacts: A. Strong, NOAA/NESDIS; T. Yamauchi, JMA; T. Fujita, Meteorological Research Inst., Japan; D. Hofmann, Univ. of Wyoming; E. Brooks, Saudi Arabia; F. Schaaf, Millville NJ; J. Caburian, Manila, Philippines; T. DeFoor, MLO; M. Hirono, Kyushu Univ., Japan.