Report on Rabaul (Papua New Guinea) — May 1987
Scientific Event Alert Network Bulletin, vol. 12, no. 5 (May 1987)
Managing Editor: Lindsay McClelland.
Rabaul (Papua New Guinea) August 1985-March 1987 summarized; May seismicity low
Please cite this report as:
Global Volcanism Program, 1987. Report on Rabaul (Papua New Guinea) (McClelland, L., ed.). Scientific Event Alert Network Bulletin, 12:5. Smithsonian Institution. https://doi.org/10.5479/si.GVP.SEAN198705-252140
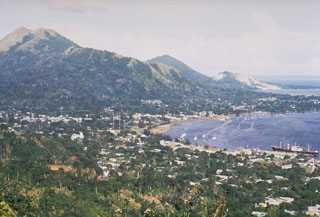
Rabaul
Papua New Guinea
4.2459°S, 152.1937°E; summit elev. 688 m
All times are local (unless otherwise noted)
Seismicity continued at a very low level, with 84 events recorded in May. Of the seven events that could be located, two were outside the caldera NE of the city of Rabaul, an unusual location. Ground deformation remained low with generally less than 10 µrad of tilt recorded and no significant changes in electronic distance measurements.
August 1985-March 1987: Post-crisis activity. "When the 1983-85 seismo-deformation crisis ended in July 1985, it was uncertain whether Rabaul would enter a period of sustained quiescence or would continue to show signs of unrest. In the 20 months since July 1985, the caldera demonstrated that it remains restless and showed some unusual behaviour.
"The variation in the monthly totals of caldera earthquakes in the post-crisis period (figure 7) indicates intervals of both very low and moderately high seismicity. However, the seismic energy release amounted to only 7.5 x 10¹⁵ ergs (compared to 2 x 10¹⁹ ergs in the 1983-85 crisis period). The pattern of earthquake locations between August 1985 and March 1987 (figure 8) shows that most events also took place immediately S of the entrance to Greet Harbour, an area that had previously been seismically quiet.
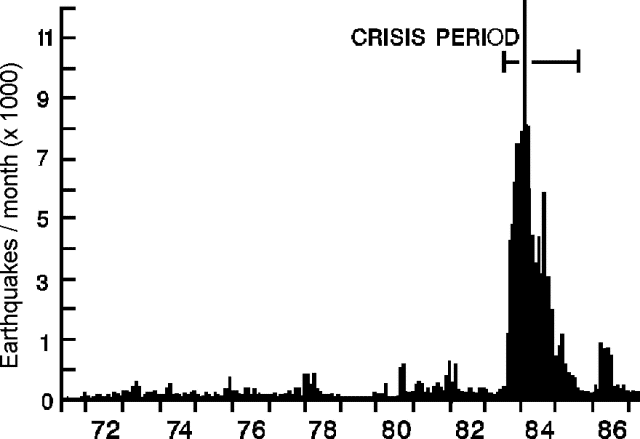 |
Figure 7. Monthly caldera earthquake totals at Rabaul, 1971-87. |
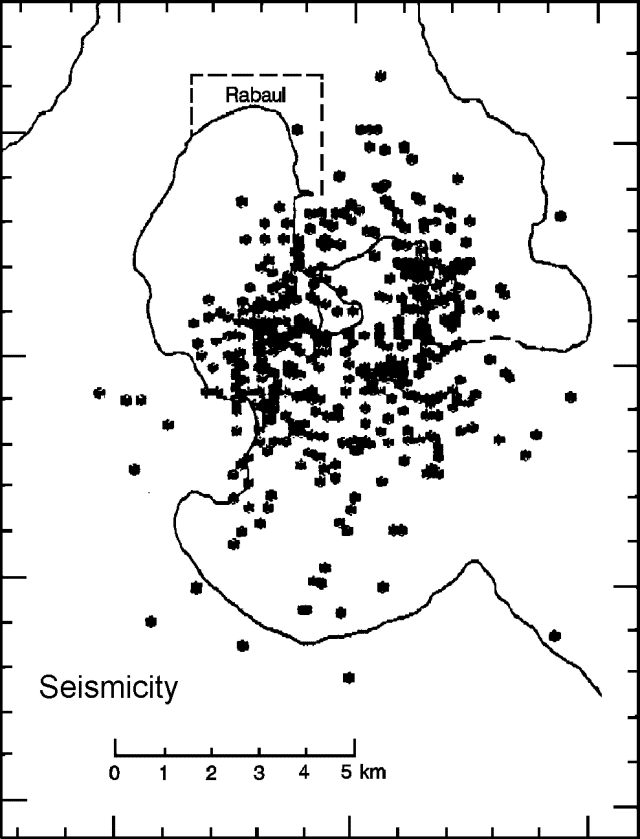 |
Figure 8. Rabaul seismicity, August 1985-March 1987. |
"The pattern of ground deformation in the post-crisis period has been dominated by events at the mouth of Greet Harbour. All monitored parameters of ground deformation indicated net inflation in the area. The greatest measured uplift was 49 mm at the S and SE coasts of Matupit Island (figure 9). Measurements of horizontal distance (figure 10) showed that the largest changes were expansions of 62 and 42 mm across the mouth of Greet Harbour. Tilt measurements (figure 5) showed a similar inflationary pattern with changes of 81 and 71 µrad in the same area. "N of Greet Harbour, subsidence occurred in the post-crisis period. Figure 4 shows that the greatest change was -13 mm on the N shore of Greet Harbour. Changes in horizontal distance and tilt vectors in the area between Sulphur Creek and the head of Greet Harbour were consistent with this subsidence (figure 5).
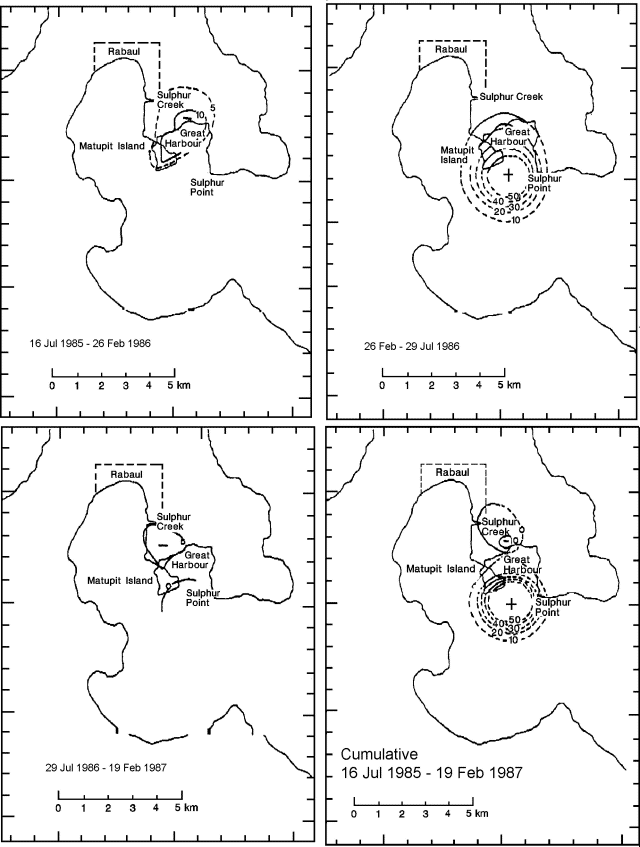 |
Figure 9. Elevation changes at Rabaul (mm) during 16 July 1985-26 February 1986 (top left), 26 February-29 July 1986 (top right), 29 July 1986-19 February 1987 (bottom left), and cumulative values fro 16 July 1985 to 19 February 1987 (bottom right). Courtesy of RVO. |
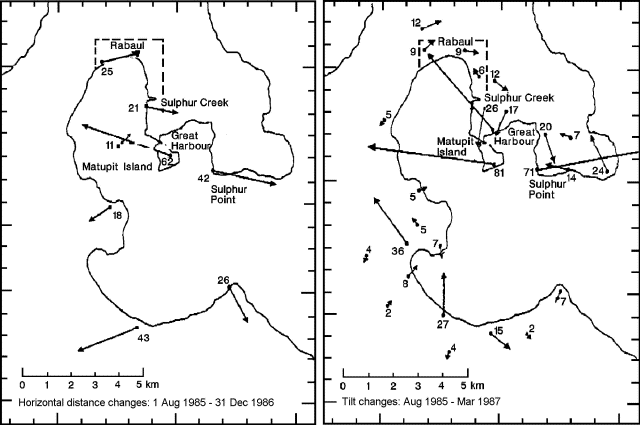 |
Figure 10. Rabaul horizontal distance changes (left, in millimeters, August 1985 to December 1986) and tilt changes (right, in µrad, August 1985 to March 1987). |
"When the post-crisis period is examined in detail, a somewhat complex pattern of activity is revealed, which can be divided into three periods: August 1985-March 1986, April-July 1986 and August 1986-March 1987.
August 1985-March 1986: Post-crisis subsidence and weak seismicity."This was a period of generally weak activity in which monthly earthquake totals varied between 48 and 317 (average 166); 1,330 earthquakes were recorded in the 8-month period. Only a small fraction were large enough to be located. Most of these events originated from the caldera seismic zone, but no particular concentrations of activity are evident. There were no caldera earthquakes of M 2.0 or greater, and the seismic energy release was less than 5 x 10¹³ ergs.
"Ground deformation is indicated by levelling measurements. In contrast to previous patterns of ground deformation, between 1971 and July 1985, subsidence took place at nearly all of the benchmarks surveyed between Rabaul town and Matupit Island (figure 9). The largest falls occurred on Matupit Island (-17 mm) and near the NW shore of Greet Harbour (-13 mm).
April-July 1986: Renewed inflation and seismicity. "A significant increase in seismicity was noted in April 1986 (figure 7) when almost 1,800 caldera earthquakes were recorded. This higher level of activity persisted until July 1986, with 6,183 earthquakes recorded in this 4-month period. The average monthly totals of events from April-July 1986 was 1,456 but, unlike previous periods of increased activity, no seismic crises occurred. Most of the events were located on faults bounding the caldera, but a number occurred within the central part of the caldera block. These events appeared to be of different character than the normal caldera fault zone events in being emergent, of lower frequency, and ~50% longer duration. This may not be a real source difference but an effect of a different path from source to the seismic stations. The strongest caldera earthquake during this period was an ML 2.7 event on 13 April, and the total seismic energy release was 2.3 x 10¹⁵ ergs.
"The increased seismicity was accompanied by a new phase of inflationary ground deformation. The pattern of deformation shows progressively greater uplift southwards from the town of Rabaul to Matupit Island (figure 9). The greatest measured change was 50 mm at the S and SE coasts of Matupit Island. Other levelling measurements suggest that the Sulphur Point area was uplifted ~25-30 mm in this period. Although this pattern of deformation resembles that recorded during 1983-85, the deformation in 1986 accumulated steadily and did not include crisis-induced offsets.
"The levelling data for this period can be compared with the theoretical effect due to a point source. The best fit of calculated to observed uplift indicates a source at 1.9 km depth ~1 km SE of Matupit Island with a maximum uplift of 67 mm. If the uplift is due to a volume increase at the source, its magnitude would be ~1.5 x 10⁶ m3, assuming that the source volume change is equivalent to the volume of the surface deformation. The ratio of vertical and horizontal movements in this period is consistent with that expected from a point source of deformation.
August 1986-March 1987: Seismicity declines; irregular deformation. "Activity declined in August 1986, and a generally low level of activity persisted to the end of this period. Monthly earthquake counts (figure 7) ranged between 316 and 78 (average 209), and the total number of events was 1,673 for the 8 months. Although earthquake counts were low, there was proportionally a greater number of stronger events than in the preceding period (April-July 1986), which resulted in greater seismic energy release (5.2 x 10¹⁵ ergs). Nearly all of this energy release was due to a series of earthquakes on 25-26 November (max ML 3.0). The pattern of earthquake locations in this period resembles that of April-July 1986, in which most events originated from the E and W segments of the caldera seismic zone, but a number occurred within the central part of the caldera block.
"Rates of ground deformation were lower than in April-July 1986. Curious spatial and temporal patterns of both uplift and subsidence were recorded. Between July and October 1986, uplift took place at Matupit Island (maximum 8 mm), while subsidence of a few millimeters occurred around the NW shore of Greet Harbour. From October 1986 to February 1987, subsidence was recorded at all occupied bench marks between the town of Rabaul and Matupit Island. The overall pattern of elevation changes is shown in figure 9, where net uplift of a few centimeters is indicated at the S and SE extremities of Matupit Island, and subsidence occurred between Matupit Island and Sulphur Creek (max fall of 10 mm). The change in the trend of deformation at Matupit Island may have been associated with the 25-26 November earthquakes.
Discussion. "Post-crisis activity has shown both familiar and unusual characteristics. The magnitude of the April-July 1986 inflationary event was similar to that of many of the inflationary episodes associated with crises in the 1983-85 period. However, no seismic crises occurred April-July 1986 and no strong or moderately strong caldera earthquakes were recorded. Comparison of the April-July 1986 uplift measurements with a point source model suggests that the source of the ground deformation was the same as the one active 1971-85.
"An unusual feature of the pattern of ground deformation in the post-crisis period was subsidence of parts of the caldera. Only two other instances of subsidence in the caldera are known since 1971, in 1975 and 1982. Although the magnitudes of the post-crisis subsidence events were small, their moderating effect on the gross deformation pattern may be symptomatic of a change to significantly lower long-term rates of caldera deformation. From 1971-83, the average rate of uplift on Matupit Island was ~100 mm/year. For the post-crisis period, the average uplift rate has been ~30 mm/year.
"Another unusual feature of the post-crisis period was the change in the ratio of vertical to horizontal ground deformation. In the 1983-85 crisis period the greatest measured uplift was 767 mm at the SE coast of Matupit Island. The greatest measured horizontal distance change in this period, also on Matupit Island, was 395 mm. Thus the ratio of vertical to horizontal distance change in the period was ~2:1. Figures 9 and 10 show that for the post-crisis period, vertical and horizontal distance changes again were greatest on Matupit Island, but horizontal deformation was larger than uplift; 49 mm of uplift and 62 mm of horizontal movement yielded a ratio of 1:1.3. The significance of this change is uncertain although it could represent a change in the deformation source or mechanism. While the April-July 1986 inflationary event had the characteristics of deformation due to a point source, the preceding and following periods were marked by a peculiar combination of subsidence or minor localized uplift with expansionary horizontal movements.
"The main features of the post-crisis seismicity were the absence of seismic crises and the increase in caldera earthquake durations. This is unusual because increased earthquake durations were previously associated with seismic crises. The increase in earthquake durations took place in April 1986 when seismicity increased generally. The increased durations appear to reflect a change in the spatial distribution of seismicity. Prior to April 1986, most of the caldera earthquakes originated from movements on the faults bounding the caldera block. However, since April 1986, a larger proportion of the caldera earthquakes have occurred within the caldera block.
"In general, low rates of seismicity and ground deformation from mid-1985 indicate that the magma bodies within the caldera have stabilized considerably since the 1983-85 crisis period. However, the subtle variations in this recent activity demonstrate that the caldera is a dynamic system with behaviour that is difficult to predict, and needs to be monitored carefully even when it appears to be quiet."
Geological Summary. The low-lying Rabaul caldera on the tip of the Gazelle Peninsula at the NE end of New Britain forms a broad sheltered harbor utilized by what was the island's largest city prior to a major eruption in 1994. The outer flanks of the asymmetrical shield volcano are formed by thick pyroclastic-flow deposits. The 8 x 14 km caldera is widely breached on the east, where its floor is flooded by Blanche Bay and was formed about 1,400 years ago. An earlier caldera-forming eruption about 7,100 years ago is thought to have originated from Tavui caldera, offshore to the north. Three small stratovolcanoes lie outside the N and NE caldera rims. Post-caldera eruptions built basaltic-to-dacitic pyroclastic cones on the caldera floor near the NE and W caldera walls. Several of these, including Vulcan cone, which was formed during a large eruption in 1878, have produced major explosive activity during historical time. A powerful explosive eruption in 1994 occurred simultaneously from Vulcan and Tavurvur volcanoes and forced the temporary abandonment of Rabaul city.
Information Contacts: C. McKee, P. Lowenstein, and J. Mori, RVO.