Report on Atmospheric Effects (1980-1989) — November 1987

Atmospheric Effects (1980-1989)
Scientific Event Alert Network Bulletin, vol. 12, no. 11 (November 1987)
Managing Editor: Lindsay McClelland.
Atmospheric Effects (1980-1989) Lowest aerosol values since 1981
Please cite this report as:
Global Volcanism Program, 1987. Report on Atmospheric Effects (1980-1989) (McClelland, L., ed.). Scientific Event Alert Network Bulletin, 12:11. Smithsonian Institution.
Atmospheric Effects (1980-1989)
All times are local (unless otherwise noted)
Lidar data from Mauna Loa, Hawaii continued to show a gradual decline in stratospheric aerosols (figure 49). Integrated backscattering on 24 November was the lowest measured since the 1982 increases associated with the eruptions of El Chichón and the "Mystery Cloud" (probably from the initial explosive phase of the December 1981-January 1982 Nyamuragira eruption in Zaire). Values measured in Virginia and Germany remained relatively stable. The low integrated backscattering recorded 9 October off the coast of North Carolina was attributed at least partly to the high tropopause that night.
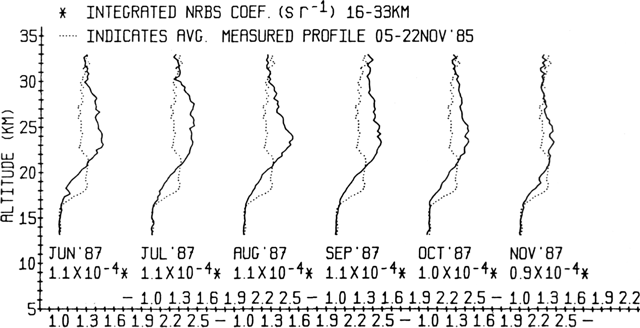 |
Figure 49. Average monthly lidar profiles from Mauna Loa, Hawaii, June-November 1987. The dotted line superimposed on each profile represents the average 5-22 November 1985 data, before the arrival of Ruiz aerosols. |
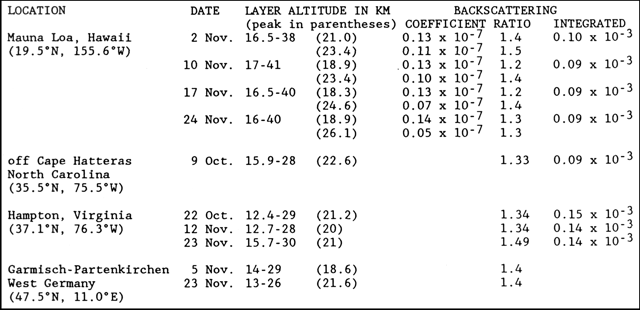 |
Figure 50. Lidar data from various locations, showing altitudes of aerosol layers during October-November 1987. Note that some layers have multiple peaks. Data from the Cape hatteras area are from a NASA airborne mission taking correlative measurements with the SAGE II satellite. Backscattering ratios are for the ruby wavelength of 0.69 µm. Integrated values show total backscatter, expressed in steradians-1, integrated over 300-m intervals from 16-33 km at Mauna Loa and from the tropopause to 30 km at Hampton, Virginia and the NASA airborne mission. Altitudes of maximum backscattering ratios and coefficients are shown for each layer at Mauna Loa. The 22 October and 12 November data from Hampton replace previously published values. |
Information Contacts: William Fuller, NASA Langley Research Center, Hampton, VA 23665 USA; Thomas DeFoor, Mauna Loa Observatory, P. O. Box 275, Hilo, HI 96720 USA; Horst Jäger, Fraunhofer-Institut für Atmosphärische Umweltforschung, Kreuzeckbahnstrasse 19, D-8100 Garmisch-Partenkirchen, West Germany.