Report on Atmospheric Effects (1980-1989) — August 1989

Atmospheric Effects (1980-1989)
Scientific Event Alert Network Bulletin, vol. 14, no. 8 (August 1989)
Managing Editor: Lindsay McClelland.
Atmospheric Effects (1980-1989) New aerosols, possibly from July Santiaguito explosion
Please cite this report as:
Global Volcanism Program, 1989. Report on Atmospheric Effects (1980-1989) (McClelland, L., ed.). Scientific Event Alert Network Bulletin, 14:8. Smithsonian Institution.
Atmospheric Effects (1980-1989)
All times are local (unless otherwise noted)
Lidar data from Utah and Hawaii, and unusual sunsets seen from Colorado, indicated that a small new aerosol layer has been injected into the lower stratosphere. The strongest effects were observed from Salt Lake City, Utah (41°N, 112°W) 4-6 August (figure 68) by lidar equipment generally used for monitoring cirrus clouds in the upper troposphere. A slight enhancement may have been present 7 August, but no additional stratospheric aerosols have been detected over Utah since then. Strong red sunsets were seen in the area at the beginning of August and some faint aerosol-like cloud bands were also visible in daylight. Richard Keen saw a bright salmon-pink twilight from Golden, Colorado (39.75°N, 105.25°W) the evening of 4 August. The colors peaked at a solar depression angle of 4°, and horizontal striations were visible. Keen had not observed unusual twilights since early 1986.
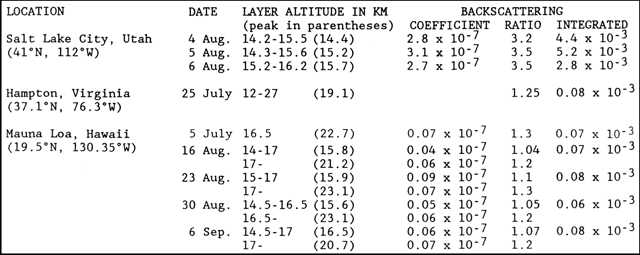 |
Figure 68. Lidar data from various locations, showing altitudes of aerosol layers during July-September 1989. Backscattering ratios are all for the ruby wavelength of 0.69 µm. Only bases of higher altitude layers at Mauna Loa are shown. Because of different sampling parameters, the very preliminary data from Salt Lake City are not directly comparable to those from other locations. A 75-m sampling interval was used, and 3-4 ten-shot averages were combined to yield the results shown. Integrated values show total backscatter, expressed in steradians-1, integrated over 300-m intervals from 16-33 km at Mauna Loa. |
Meteorological analysis at the University of Utah suggested that the aerosols had been carried to the area by a strong subtropical jet stream, and that the same material had probably been over Hawaii around 1 August. Equipment problems at Mauna Loa, Hawaii had prevented lidar observations since 5 July, but when observations resumed there on 16 August, a very small aerosol layer was detected within a double tropopause. A somewhat stronger layer was detected on the aerosol profile 23 August, and a small amount of apparently new material was detected again 30 August and 6 September. No new material was evident at Hampton, VA on 25 July. Instrument problems prevented additional data collection there as of early September.
The source of the new aerosol material was uncertain, but University of Utah meteorologists suggested that Central America was the most likely recent source. The plume produced by the strong 19 July explosion of Santiaguito was reported to have reached only about 4 km above the vent (approximate elevation 2,500 m). However, wind shearing of the plume was distinctly visible. Its lower portion, which contained the bulk of the ash and reached 4 km above the vent, moved NW, while a less dense upper portion was carried SE. Analyses of radiosonde data, newly available photographs from a different viewpoint (Llano del Pinal), and weather satellite information are planned, and may allow better characterization of cloud dynamics.
Observations of the February and August 1989 lunar eclipses indicate no significant new aerosol layers (figure 69). Richard Keen made brightness estimates of the 17 August eclipse by comparing the reduced brightness of the moon seen in reversed binoculars with the actual brightness of stars. Although a thunderstorm obscured the eclipse at mid-totality, 15 minutes before the end of totality the moon's visual magnitude was -2.0, 0.2 magnitudes fainter than predicted by the model in Keen, 1983 [citation in 11:3]. The observed minus calculated residual yields a globally averaged volcanic aerosol vertical optical thickness of only 0.005, which, within the probable error of the method, is zero. Data from Mauna Loa, Hawaii also document a continuing decline in the aerosol content of the stratosphere. A small irregular increase in stratospheric aerosols following the November 1985 eruption of Ruiz is superimposed on the gradual decay of the much larger El Chichón aerosol erupted in 1982. No large new injections of volcanic material are evident on the Mauna Loa records since 1985.
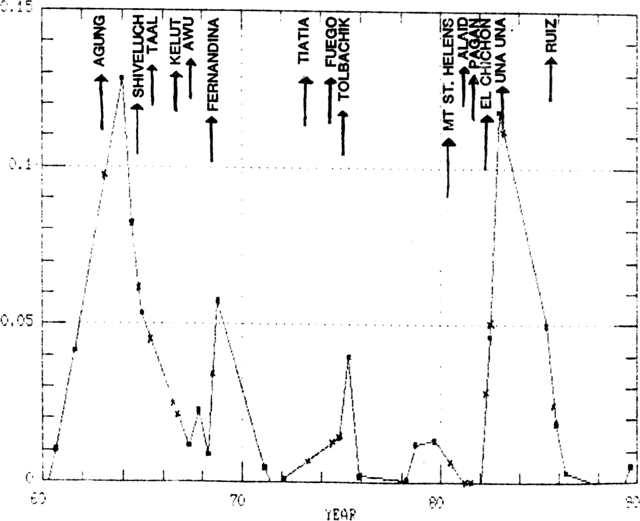 |
Figure 69. Global volcanic aerosol optical thickness derived from lunar eclipse observations, 1960-89. Arrows show some major explosive eruptions. Courtesy of Richard Keen. |
Further Reference. Sassen, K., and Horel, J., 1990, Polarization Lidar and synoptic analyses of an unusual volcanic aerosol cloud: Journal of the Atmospheric Sciences, v. 24, p. 2881-2889.
Information Contacts: Ken Sassen, Dept. of Meteorology, University of Utah, Salt Lake City, UT 84112 USA; Thomas DeFoor, Mauna Loa Observatory, P.O. Box 275, Hilo, HI 96720 USA; Richard Keen, 34296 Gap Road, Golden, CO 80403 USA; William I. Rose, Dept. of Geology and Geological Engineering, Michigan Technological University, Houghton, MI 49931 USA; Mary Osborn, NASA Langley Research Center, Hampton, VA 23665 USA.