RVO reported that white vapor emissions from Bamus were observed during 1000-1130 on 12 July. The emissions were forceful and slightly gray in color at 1110. The vapor plume drifted SSE.
Source: Rabaul Volcano Observatory (RVO)
Forceful vapor emission seen on 12 July 2006
According to the Papua New Guinea Department of Mining (DOM), reports coming from Bialla Local Level Government (LLG) indicated that Bamus showed signs of unusual activity. At 1010 on 12 July 2006 observers saw white vapor coming out at the summit. The emission was forceful at about 1110 that day, with a tint of gray color in the emission. The vapor-rich plume blew inland to the SSE. No ashfall was reported.
Officials from Bialla LLG together with a DOM observer witnessed the activity, as did Max Benjamin from Walindi Resort (~ 40-50 km away). Benjamin called the Rabaul Volcano Observatory to report the activity. No satellite-detected thermal anomalies at the volcano were reported by the MODIS website for this time frame.
Information Contacts: Steve Saunders and Herman Patia, Rabaul Volcanological Observatory (RVO), Department of Mining, Private Mail Bag, Port Moresby Post Office, National Capitol District, Papua, New Guinea.
2006: July
RVO reported that white vapor emissions from Bamus were observed during 1000-1130 on 12 July. The emissions were forceful and slightly gray in color at 1110. The vapor plume drifted SSE.
Source: Rabaul Volcano Observatory (RVO)
Reports are organized chronologically and indexed below by Month/Year (Publication Volume:Number), and include a one-line summary. Click on the index link or scroll down to read the reports.
Strong seismicity along a NNE-trending zone; two magnitude 5.0 events
"Strong seismicity took place near Bamus during February. The seismicity started on the 2nd when almost 100 events were recorded (maximum ML 5.8 [but see 15:3]). In the following days the activity waned, but began to increase on the 8th. Seismicity peaked between the 10th and the 15th, when ~1,400 events were recorded, including three earthquakes of M 5.8-6.0. Activity declined irregularly during the following 10 days, but began increasing again on the 25th. During the second peak of activity, between the 25th and the 28th, ~880 events were recorded including two earthquakes of M 5.0. Activity declined again at the end of the month.
"Inspections of Bamus were carried out on 13 and 16 February. Rockfalls had occurred at many places on the volcano, apparently associated with the seismicity. Temperatures in solfataric areas on the summit tholoid remained low (<15°C) however. A temporary seismograph network, operated in the area between 13 and 16 February, enabled locations of some earthquakes to be calculated. Epicenters were distributed in a 10-km-long NNE-trending zone that included the S flanks of Bamus. Focal depths ranged between 0 and 23 km. The seismicity was continuing in early March and was being monitored primarily by the permanent seismograph at Ulawun Volcano."
Information Contacts: C. McKee, RVO.
Strong earthquake swarm, then somewhat decreased seismicity
"Seismicity. . . continued throughout March, although at a milder level after the 5th. Following intense February seismicity that involved 83 earthquakes of ML >=4.0, eight of ML >=5.0, and one of ML >=6.0, activity was strong again 3-5 March. More than 720 earthquakes (two of ML = 5.0-5.1 and 10 of ML >=4.5) were recorded before seismicity decreased to 20-50 events/day of small-moderate magnitude. The energy released by the February-March seismicity was relatively large, 1.22 x 10²¹ ergs (figure 1).
 |
Figure 1. Daily number of earthquakes (bars) and cumulative energy release (circles) near Bamus, February-March 1990. Magnitudes (ML) of larger events are given over earthquake count bars. Courtesy of RVO. |
"An inspection of the Bamus area was carried out on 6 March. Rockfalls had occurred at many places on the volcano and in the limestone ranges to the S. However, no change was observed in the temperatures of the solfataric areas on the summit tholoid (which remained at <=15°C).
"Temporary seismograph networks were operated in the area 13-16 February and 6-8 March. Earthquake locations defined a broad 15-km-long seismic zone trending NNE that extended from the Nakanai Mountains to the S flank of Bamus (figure 2). Within this zone was a concentration of locations trending ENE near the S foot of Bamus. Earthquake focal depths ranged from 0 to 23 km.
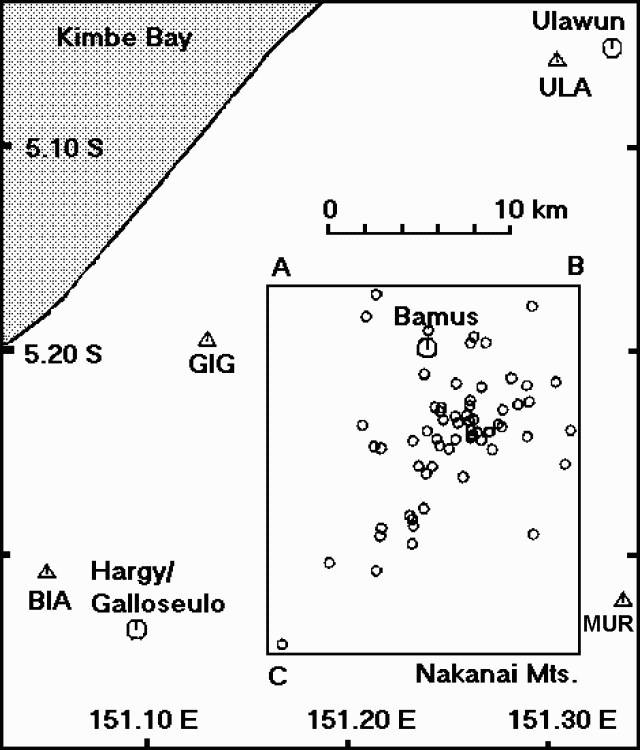 |
Figure 2. Epicenters of seismic events at Bamus, 13-16 February and 6-8 March 1990. Courtesy of RVO. |
"Cross-sections . . . (figure 3) suggest that the main cluster of earthquakes defines an ENE-trending near-vertical fault. This orientation is consistent with the structural pattern evident in the Miocene limestone immediately S of, and underlying, Bamus.
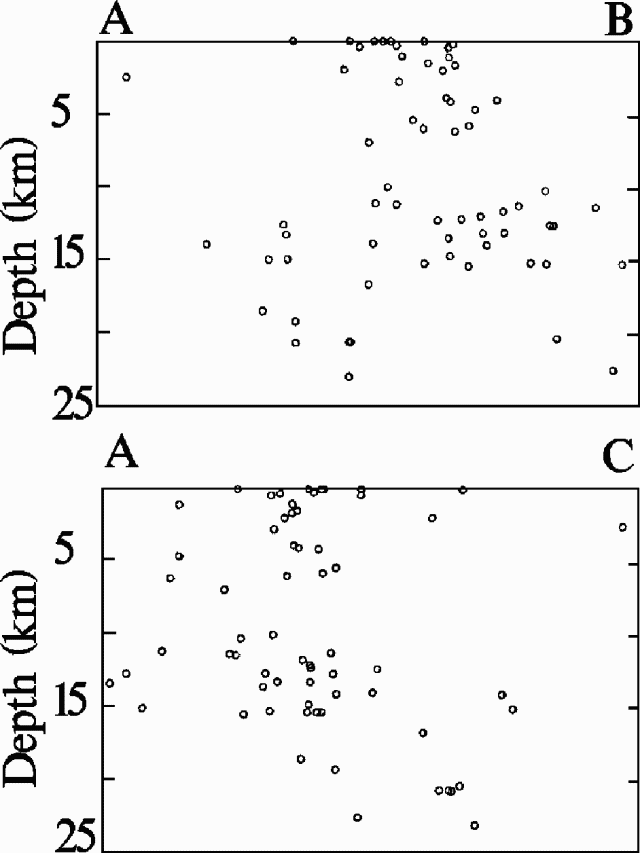 |
Figure 3. Focal depths of seismic events near Bamus during 13-16 February and 6-8 March 1990 projected along lines A-B (top) and A-C (bottom). Horizontal scale (and thus vertical exaggeration) changes from A-B to A-C. Courtesy of RVO. |
"The cause of this seismicity remains uncertain. Its ongoing fluctuating character, and the fact that its swarms include but do not occur in response to larger earthquakes, could be consistent with magmatic injection. On the other hand, ML 5-6 earthquakes are uncommon for magmatic events. Analysis of the magnitude/frequency distribution of the earthquakes shows that the 'b' value is ~1, which is indicative of tectonic earthquake sequences. The seismicity was continuing in early April and was being monitored primarily by the permananent seismograph at Ulawun."
Information Contacts: I. Itikarai, P. de Saint-Ours, and C. McKee, RVO.
Vigorous February-early March seismicity declines
"Seismic activity . . . decreased markedly in April. Following a period of intense activity in early March, the frequency of occurrence and magnitude of earthquakes decreased gradually, with only 27 events of ML >=3 recorded in April (from a total of 200 events picked up by the Ulawun station, 25 km away). Event frequency ranged between 2 and 7/day. Two isolated earthquakes of ML 5.6 and 4.2 occurred on the 26th."
Information Contacts: P. de Saint-Ours, and C. McKee, RVO.
Seismicity decreases to near background
"Seismic activity from near the southern foot of Bamus virtually died out in May. There were only 97 events recorded, of which 15 were of ML >=3 (largest event, ML 3.8)."
Information Contacts: P. de Saint-Ours and C. McKee, RVO.
Forceful vapor emission seen on 12 July 2006
According to the Papua New Guinea Department of Mining (DOM), reports coming from Bialla Local Level Government (LLG) indicated that Bamus showed signs of unusual activity. At 1010 on 12 July 2006 observers saw white vapor coming out at the summit. The emission was forceful at about 1110 that day, with a tint of gray color in the emission. The vapor-rich plume blew inland to the SSE. No ashfall was reported.
Officials from Bialla LLG together with a DOM observer witnessed the activity, as did Max Benjamin from Walindi Resort (~ 40-50 km away). Benjamin called the Rabaul Volcano Observatory to report the activity. No satellite-detected thermal anomalies at the volcano were reported by the MODIS website for this time frame.
Information Contacts: Steve Saunders and Herman Patia, Rabaul Volcanological Observatory (RVO), Department of Mining, Private Mail Bag, Port Moresby Post Office, National Capitol District, Papua, New Guinea.
|
|
||||||||||||||||||||||||||
There is data available for 4 confirmed eruptive periods.
1886 ± 8 years Confirmed Eruption (Explosive / Effusive) VEI: 3 (?)
| Episode 1 | Eruption (Explosive / Effusive) | |||||||||||||||||||||||||||||
|---|---|---|---|---|---|---|---|---|---|---|---|---|---|---|---|---|---|---|---|---|---|---|---|---|---|---|---|---|---|
| 1886 ± 8 years - Unknown | Evidence from Observations: Reported | ||||||||||||||||||||||||||||
|
List of 4 Events for Episode 1
|
|||||||||||||||||||||||||||||
1650 ± 50 years Confirmed Eruption (Explosive / Effusive)
| Episode 1 | Eruption (Explosive / Effusive) | |||||||||||||||||||
|---|---|---|---|---|---|---|---|---|---|---|---|---|---|---|---|---|---|---|---|
| 1650 ± 50 years - Unknown | Evidence from Isotopic: 14C (uncalibrated) | ||||||||||||||||||
|
List of 2 Events for Episode 1
|
|||||||||||||||||||
0270 BCE ± 50 years Confirmed Eruption (Explosive / Effusive)
| Episode 1 | Eruption (Explosive / Effusive) | |||||||||||||||||||
|---|---|---|---|---|---|---|---|---|---|---|---|---|---|---|---|---|---|---|---|
| 0270 BCE ± 50 years - Unknown | Evidence from Isotopic: 14C (uncalibrated) | ||||||||||||||||||
|
List of 2 Events for Episode 1
|
|||||||||||||||||||
0350 BCE ± 75 years Confirmed Eruption (Explosive / Effusive)
| Episode 1 | Eruption (Explosive / Effusive) | |||||||||||||||||||
|---|---|---|---|---|---|---|---|---|---|---|---|---|---|---|---|---|---|---|---|
| 0350 BCE ± 75 years - Unknown | Evidence from Isotopic: 14C (uncalibrated) | ||||||||||||||||||
|
List of 2 Events for Episode 1
|
|||||||||||||||||||
This compilation of synonyms and subsidiary features may not be comprehensive. Features are organized into four major categories: Cones, Craters, Domes, and Thermal Features. Synonyms of features appear indented below the primary name. In some cases additional feature type, elevation, or location details are provided.
Synonyms |
| South Son | Sudsohn |
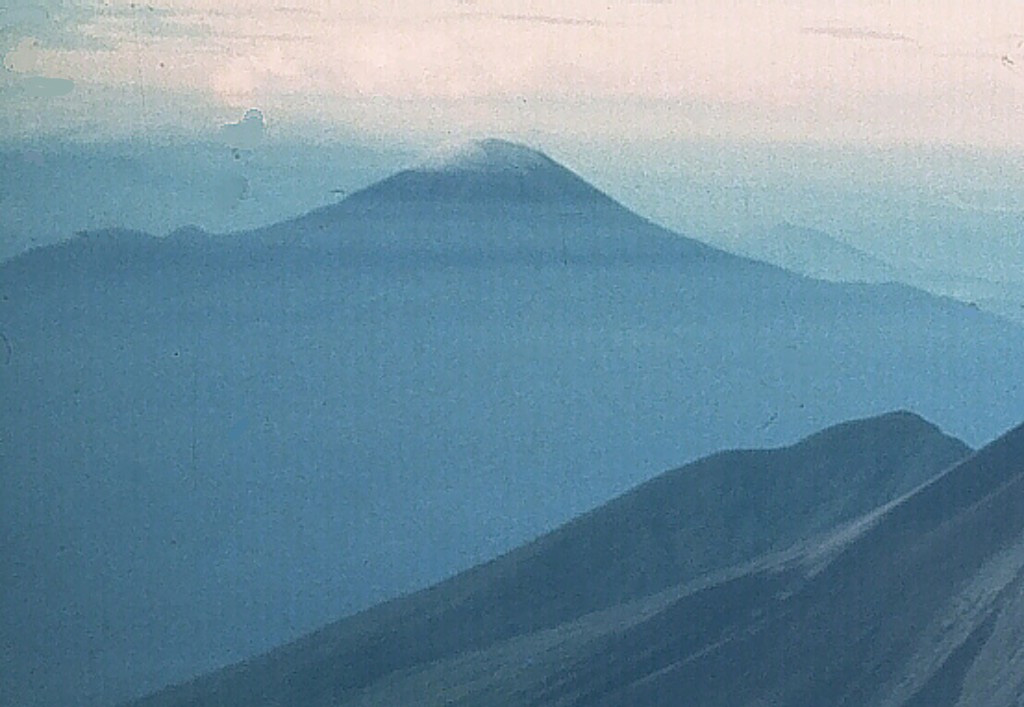
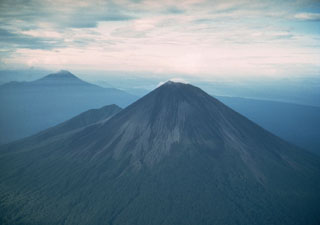 The symmetrical Ulawun is one of Papua New Guinea's most frequently active volcanoes. Ulawun and Bamus volcano (upper left) are the two highest volcanoes of the Bismarck Archipelago, and are known as the Father and South Son volcanoes, respectively. The upper 1,000 m of Ulawun is unvegetated. Historical eruptions date back to the beginning of the 18th century.
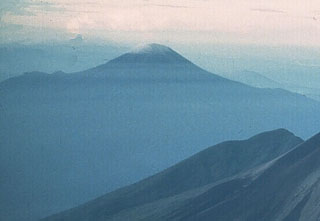 Bamus is seen here from the NE beyond the upper slopes of Ulawun. These two volcanoes are the highest in the 1,000-km-long Bismarck volcanic arc. Bamus is covered by rainforest and contains a summit crater filled with a lava dome. A smaller cone is located on the S flank, and a prominent 1.5-km-wide crater with two small adjacent cones is situated halfway up the SE flank.
There are no samples for Bamus in the Smithsonian's NMNH Department of Mineral Sciences Rock and Ore collection.
| Copernicus Browser | The Copernicus Browser replaced the Sentinel Hub Playground browser in 2023, to provide access to Earth observation archives from the Copernicus Data Space Ecosystem, the main distribution platform for data from the EU Copernicus missions. |
| MIROVA | Middle InfraRed Observation of Volcanic Activity (MIROVA) is a near real time volcanic hot-spot detection system based on the analysis of MODIS (Moderate Resolution Imaging Spectroradiometer) data. In particular, MIROVA uses the Middle InfraRed Radiation (MIR), measured over target volcanoes, in order to detect, locate and measure the heat radiation sourced from volcanic activity. |
| MODVOLC Thermal Alerts | Using infrared satellite Moderate Resolution Imaging Spectroradiometer (MODIS) data, scientists at the Hawai'i Institute of Geophysics and Planetology, University of Hawai'i, developed an automated system called MODVOLC to map thermal hot-spots in near real time. For each MODIS image, the algorithm automatically scans each 1 km pixel within it to check for high-temperature hot-spots. When one is found the date, time, location, and intensity are recorded. MODIS looks at every square km of the Earth every 48 hours, once during the day and once during the night, and the presence of two MODIS sensors in space allows at least four hot-spot observations every two days. Each day updated global maps are compiled to display the locations of all hot spots detected in the previous 24 hours. There is a drop-down list with volcano names which allow users to 'zoom-in' and examine the distribution of hot-spots at a variety of spatial scales. |
|
WOVOdat
Single Volcano View Temporal Evolution of Unrest Side by Side Volcanoes |
WOVOdat is a database of volcanic unrest; instrumentally and visually recorded changes in seismicity, ground deformation, gas emission, and other parameters from their normal baselines. It is sponsored by the World Organization of Volcano Observatories (WOVO) and presently hosted at the Earth Observatory of Singapore.
GVMID Data on Volcano Monitoring Infrastructure The Global Volcano Monitoring Infrastructure Database GVMID, is aimed at documenting and improving capabilities of volcano monitoring from the ground and space. GVMID should provide a snapshot and baseline view of the techniques and instrumentation that are in place at various volcanoes, which can be use by volcano observatories as reference to setup new monitoring system or improving networks at a specific volcano. These data will allow identification of what monitoring gaps exist, which can be then targeted by remote sensing infrastructure and future instrument deployments. |
| Volcanic Hazard Maps | The IAVCEI Commission on Volcanic Hazards and Risk has a Volcanic Hazard Maps database designed to serve as a resource for hazard mappers (or other interested parties) to explore how common issues in hazard map development have been addressed at different volcanoes, in different countries, for different hazards, and for different intended audiences. In addition to the comprehensive, searchable Volcanic Hazard Maps Database, this website contains information about diversity of volcanic hazard maps, illustrated using examples from the database. This site is for educational purposes related to volcanic hazard maps. Hazard maps found on this website should not be used for emergency purposes. For the most recent, official hazard map for a particular volcano, please seek out the proper institutional authorities on the matter. |
| IRIS seismic stations/networks | Incorporated Research Institutions for Seismology (IRIS) Data Services map showing the location of seismic stations from all available networks (permanent or temporary) within a radius of 0.18° (about 20 km at mid-latitudes) from the given location of Bamus. Users can customize a variety of filters and options in the left panel. Note that if there are no stations are known the map will default to show the entire world with a "No data matched request" error notice. |
| UNAVCO GPS/GNSS stations | Geodetic Data Services map from UNAVCO showing the location of GPS/GNSS stations from all available networks (permanent or temporary) within a radius of 20 km from the given location of Bamus. Users can customize the data search based on station or network names, location, and time window. Requires Adobe Flash Player. |
| DECADE Data | The DECADE portal, still in the developmental stage, serves as an example of the proposed interoperability between The Smithsonian Institution's Global Volcanism Program, the Mapping Gas Emissions (MaGa) Database, and the EarthChem Geochemical Portal. The Deep Earth Carbon Degassing (DECADE) initiative seeks to use new and established technologies to determine accurate global fluxes of volcanic CO2 to the atmosphere, but installing CO2 monitoring networks on 20 of the world's 150 most actively degassing volcanoes. The group uses related laboratory-based studies (direct gas sampling and analysis, melt inclusions) to provide new data for direct degassing of deep earth carbon to the atmosphere. |
| Large Eruptions of Bamus | Information about large Quaternary eruptions (VEI >= 4) is cataloged in the Large Magnitude Explosive Volcanic Eruptions (LaMEVE) database of the Volcano Global Risk Identification and Analysis Project (VOGRIPA). |
| EarthChem | EarthChem develops and maintains databases, software, and services that support the preservation, discovery, access and analysis of geochemical data, and facilitate their integration with the broad array of other available earth science parameters. EarthChem is operated by a joint team of disciplinary scientists, data scientists, data managers and information technology developers who are part of the NSF-funded data facility Integrated Earth Data Applications (IEDA). IEDA is a collaborative effort of EarthChem and the Marine Geoscience Data System (MGDS). |

