Submarine lava flow and hydrothermal plumes
A submarine eruption along the Juan de Fuca Ridge (JDFR) was detected in late June 1993 by the NOAA using hydrophones. Plumes and a lava flow were subsequently identified by research ships along the Coaxial Segment (figure 1), located ~435 km W of the Oregon coast.
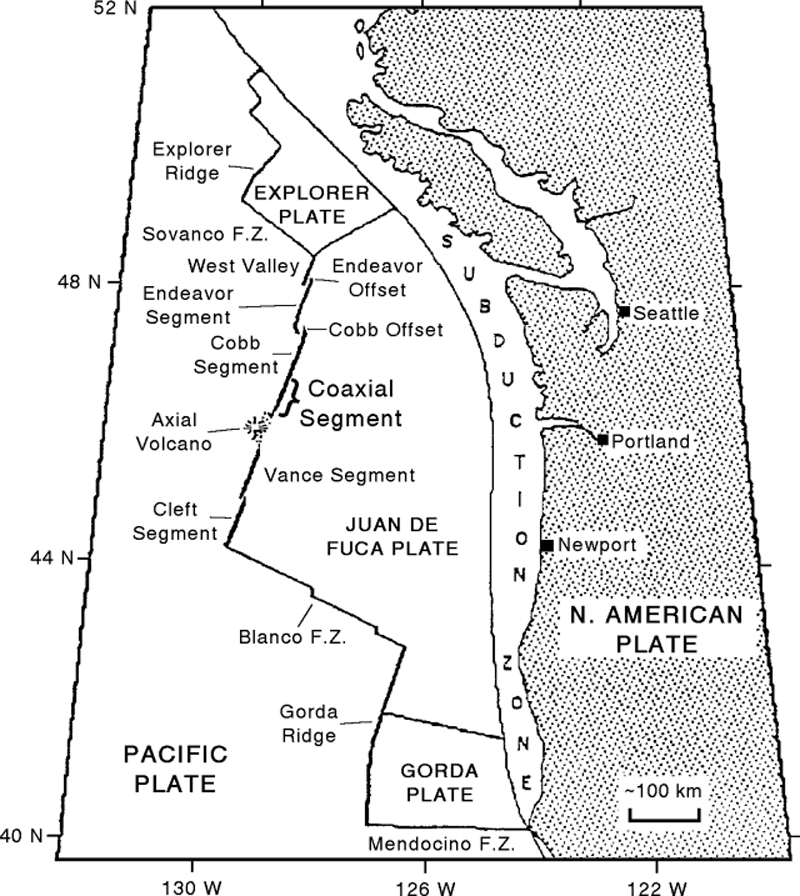 |
Figure 1. General plate tectonic map of the NE Pacific Ocean showing the North American, Pacific, Explorer, Juan de Fuca, and Gorda plates. The Coaxial Segment is just N of Axial Volcano along the Juan de Fuca Ridge. Courtesy of Bill Chadwick, NOAA. |
On 26 June a burst of low-magnitude and low-frequency (1-30 Hz) T-phase seismicity (~31 events in the first hour) was accompanied by what appeared to be harmonic tremor near the terminus of the N rift zone of Axial Volcano (a hot-spot volcano adjacent to the ridge) near 46.23°N, 129.83°W. Activity migrated ~37 km NNE over the next two days, with the final locus of activity near 46.52°N, 129.60°W. Another swarm of events occurred on 4 July; activity then declined to a few minor events/day. All T-phase activity was probably below the threshold of land-based seismometers, mb < 2.5, though some events may have been larger. Real-time monitoring of the Juan de Fuca Ridge by the NOAA Vents T-Phase Project had begun only four days earlier, on 22 June, using the U.S. Navy Sound Surveillance System (SOSUS). The raw data are transferred to NOAA's Newport, Oregon labs, where time-versus-frequency plots for selected locations are continuously displayed and monitored.
Scientists aboard the Canadian Survey Ship Tully performed Conductivity-Temperature-Depth (CTD)/transmissometer casts on 1-3 July between 46.20°N and 46.55°N, primarily along the W ridge of a large graben where the NE flank of Axial Volcano merges into the JDFR. A transmissometer is a device that measures the amount of particulate matter in the water by shining a light across a short distance and measuring the amount of light received at the other end. Plumes can be mapped in this way independent of temperature anomalies. Plumes were found along the central axis of the graben, extending between approximately 46.33°N and 46.50°N, in close agreement with the T-phase locations. Strong plumes within several hundred meters of the seafloor (bottom depth ~2,400 m) were detected at 46.50°N, 129.59°W, and there was an intense plume at 1,700-1,800 m depth, at least 700 m above the bottom.
On 9 July, the NOAA Ship Discoverer arrived at the site with a full suite of instrumentation, including CTD/transmissometer, chemical scanner, SeaBeam, seafloor volcanic system monitors (rumbleometers), and the Canadian remotely operated vehicle system, ROPOS, equipped with acoustic and differential GPS navigation. The next day, Discoverer's first cast, at 46.50°N, 129.60°W, confirmed the presence of both deep and shallow plumes. Plumes were identified on the basis of thermal and light-attenuation anomalies, as well as large anomalies in dissolved Mn and Fe using a continuously sensing in-situ chemical scanner. Over the next several days, two along-axis, several cross-axis tow-yos, and several vertical CTD casts were completed. The term "tow-yo" describes the process of alternately lowering and raising the CTD instrumentation during the tow, making a saw-toothed survey through the water column. This allows measurement of the upper and lower boundaries of plumes, as well as their lateral extent in two dimensions. The first along-axis CTD tow mapped the large plumes along the segment and above the N swarm area on 12 July.
Lower plumes, extending 39 km along the axis from 46.23°N to 46.57°N, were characterized by temperature anomalies as high as 0.07°C centered ~150-200 m above the seafloor; in some places the temperature anomalies extended within 10 m of the seafloor (generally the closest approach height of the CTD). Upper plumes were well-defined by temperature, light-attenuation, and chemical anomalies, with a maximum rise height of ~800 m and a maximum temperature anomaly of at least 0.18°C. The upper plumes were first found near 46.50°N and later near 46.27°N, and appeared to have a distinct layered structure, perhaps indicative of separate injections of hydrothermal fluid. Although these plumes have rise heights and temperatures similar to the megaplumes discovered over the Cleft Segment of the JDFR (~160 km S at 44.5-45.0°N) in 1986 and 1987, their volume appears much smaller, only several kilometers along and across axis. Preliminary results indicate dissolved Mn and Fe anomalies in the upper plumes exceeding those found in the 1986 and 1987 megaplumes. The well-defined N edge of the plumes approximates the extent of the T-phase swarm area. The S boundary of the plumes is more diffuse, but there is a fairly distinct diminishment at about 46.23°N, approximately the boundary of the S swarm.
Preliminary analysis of radon-222 in plume samples taken on 12 and 19 July shows a distinct decrease in values for the upper plume, supporting the presumption that they were produced by powerful but short-lived hydrothermal discharges and were not resupplied by continuous venting. Radon-222 estimates for the cessation of the hydrothermal event that produced these upper plumes range from 28 June to 1 July, or 2-5 days after the initial T-phase activity. The lower-plume radon-222 values did not decrease between sampling, indicating that they were sustained by continuous venting in mid-July.
The most intense hydrothermal activity was from the center of the axial valley over about 46.52°N. Because of the coincidence between the T-phase swarms and the hydrothermal activity, this area was chosen for detailed study with the remotely operated vehicle ROPOS. The dive traversed the valley floor from E to W and encountered sediment-free, glassy lava on the W-facing slope of a ridge just N of a small, older seamount centered at 46.52°N, 130.59°W. Subsequent traverses over the ENE-oriented lava ridge revealed it to be ~300 m wide and at least 1,500 m long. A 100-m-wide zone centered over the crest was venting warm water through interstices of unfractured pillow and lobate lava flows. Water temperatures were up to 13°C, and the chemical scanner measured high levels of Fe and Mn in the vent fluids. The S end of the lava ridge was within a graben imaged by the ROPOS's Mesotech sonar system. The next ROPOS dive started at the S terminus of the lava ridge and continued S along the trend defined by the ridge crest. An actively venting fracture system was crossed on every subsequent traverse across this trend, extending 6.5 km S to 46.47°N, with water temperatures up to 23°C. The fracture system crosses a lava plateau that bisects the axial valley.
Basalt samples from the recent flow are very fresh-looking lobate to pillowed types. Upper glass selvages are up to 2.5 cm thick and are sparsely plagioclase-phyric. The glass selvages have no sediment cover (except in areas of hydrothermal discharge) and exhibit a shiny iridescent surface. Some of the samples have surficial staining (probably elemental sulfur) as the result of contact with hydrothermal fluids.
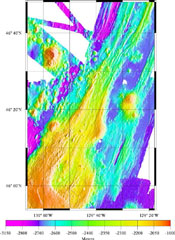
The volcanic zone of the Coaxial Segment between 46.10°N and 46.65°N was resurveyed with SeaBeam multibeam sonar. By the time data collection and analysis were complete, a new lava flow had been located with ROPOS at 46.52°N, 129.58°W. The extent of the new lava flow corresponds very closely to an area of depth change identified between SeaBeam surveys. Comparison of the new survey and the 1981 and 1991 SeaBeam surveys showed a depth change of about 30 m. Onshore processing of the data is still in progress, but no other depth changes had been confirmed by 20 Aug; there could be other new lava flows that are below the detection level of SeaBeam. Except for bacterial filaments, the young lava flow was devoid of sessile organisms, whereas adjacent old lavas hosted many non-vent animals.
Information Contacts: C. Fox, W. Chadwick, R. Embley, and R. Dziak, NOAA Vents T-phase Project.
The Global Volcanism Program has no Weekly Reports available for CoAxial Segment.
Reports are organized chronologically and indexed below by Month/Year (Publication Volume:Number), and include a one-line summary. Click on the index link or scroll down to read the reports.
Submarine lava flow and hydrothermal plumes
A submarine eruption along the Juan de Fuca Ridge (JDFR) was detected in late June 1993 by the NOAA using hydrophones. Plumes and a lava flow were subsequently identified by research ships along the Coaxial Segment (figure 1), located ~435 km W of the Oregon coast.
|
Figure 1. General plate tectonic map of the NE Pacific Ocean showing the North American, Pacific, Explorer, Juan de Fuca, and Gorda plates. The Coaxial Segment is just N of Axial Volcano along the Juan de Fuca Ridge. Courtesy of Bill Chadwick, NOAA. |
On 26 June a burst of low-magnitude and low-frequency (1-30 Hz) T-phase seismicity (~31 events in the first hour) was accompanied by what appeared to be harmonic tremor near the terminus of the N rift zone of Axial Volcano (a hot-spot volcano adjacent to the ridge) near 46.23°N, 129.83°W. Activity migrated ~37 km NNE over the next two days, with the final locus of activity near 46.52°N, 129.60°W. Another swarm of events occurred on 4 July; activity then declined to a few minor events/day. All T-phase activity was probably below the threshold of land-based seismometers, mb < 2.5, though some events may have been larger. Real-time monitoring of the Juan de Fuca Ridge by the NOAA Vents T-Phase Project had begun only four days earlier, on 22 June, using the U.S. Navy Sound Surveillance System (SOSUS). The raw data are transferred to NOAA's Newport, Oregon labs, where time-versus-frequency plots for selected locations are continuously displayed and monitored.
Scientists aboard the Canadian Survey Ship Tully performed Conductivity-Temperature-Depth (CTD)/transmissometer casts on 1-3 July between 46.20°N and 46.55°N, primarily along the W ridge of a large graben where the NE flank of Axial Volcano merges into the JDFR. A transmissometer is a device that measures the amount of particulate matter in the water by shining a light across a short distance and measuring the amount of light received at the other end. Plumes can be mapped in this way independent of temperature anomalies. Plumes were found along the central axis of the graben, extending between approximately 46.33°N and 46.50°N, in close agreement with the T-phase locations. Strong plumes within several hundred meters of the seafloor (bottom depth ~2,400 m) were detected at 46.50°N, 129.59°W, and there was an intense plume at 1,700-1,800 m depth, at least 700 m above the bottom.
On 9 July, the NOAA Ship Discoverer arrived at the site with a full suite of instrumentation, including CTD/transmissometer, chemical scanner, SeaBeam, seafloor volcanic system monitors (rumbleometers), and the Canadian remotely operated vehicle system, ROPOS, equipped with acoustic and differential GPS navigation. The next day, Discoverer's first cast, at 46.50°N, 129.60°W, confirmed the presence of both deep and shallow plumes. Plumes were identified on the basis of thermal and light-attenuation anomalies, as well as large anomalies in dissolved Mn and Fe using a continuously sensing in-situ chemical scanner. Over the next several days, two along-axis, several cross-axis tow-yos, and several vertical CTD casts were completed. The term "tow-yo" describes the process of alternately lowering and raising the CTD instrumentation during the tow, making a saw-toothed survey through the water column. This allows measurement of the upper and lower boundaries of plumes, as well as their lateral extent in two dimensions. The first along-axis CTD tow mapped the large plumes along the segment and above the N swarm area on 12 July.
Lower plumes, extending 39 km along the axis from 46.23°N to 46.57°N, were characterized by temperature anomalies as high as 0.07°C centered ~150-200 m above the seafloor; in some places the temperature anomalies extended within 10 m of the seafloor (generally the closest approach height of the CTD). Upper plumes were well-defined by temperature, light-attenuation, and chemical anomalies, with a maximum rise height of ~800 m and a maximum temperature anomaly of at least 0.18°C. The upper plumes were first found near 46.50°N and later near 46.27°N, and appeared to have a distinct layered structure, perhaps indicative of separate injections of hydrothermal fluid. Although these plumes have rise heights and temperatures similar to the megaplumes discovered over the Cleft Segment of the JDFR (~160 km S at 44.5-45.0°N) in 1986 and 1987, their volume appears much smaller, only several kilometers along and across axis. Preliminary results indicate dissolved Mn and Fe anomalies in the upper plumes exceeding those found in the 1986 and 1987 megaplumes. The well-defined N edge of the plumes approximates the extent of the T-phase swarm area. The S boundary of the plumes is more diffuse, but there is a fairly distinct diminishment at about 46.23°N, approximately the boundary of the S swarm.
Preliminary analysis of radon-222 in plume samples taken on 12 and 19 July shows a distinct decrease in values for the upper plume, supporting the presumption that they were produced by powerful but short-lived hydrothermal discharges and were not resupplied by continuous venting. Radon-222 estimates for the cessation of the hydrothermal event that produced these upper plumes range from 28 June to 1 July, or 2-5 days after the initial T-phase activity. The lower-plume radon-222 values did not decrease between sampling, indicating that they were sustained by continuous venting in mid-July.
The most intense hydrothermal activity was from the center of the axial valley over about 46.52°N. Because of the coincidence between the T-phase swarms and the hydrothermal activity, this area was chosen for detailed study with the remotely operated vehicle ROPOS. The dive traversed the valley floor from E to W and encountered sediment-free, glassy lava on the W-facing slope of a ridge just N of a small, older seamount centered at 46.52°N, 130.59°W. Subsequent traverses over the ENE-oriented lava ridge revealed it to be ~300 m wide and at least 1,500 m long. A 100-m-wide zone centered over the crest was venting warm water through interstices of unfractured pillow and lobate lava flows. Water temperatures were up to 13°C, and the chemical scanner measured high levels of Fe and Mn in the vent fluids. The S end of the lava ridge was within a graben imaged by the ROPOS's Mesotech sonar system. The next ROPOS dive started at the S terminus of the lava ridge and continued S along the trend defined by the ridge crest. An actively venting fracture system was crossed on every subsequent traverse across this trend, extending 6.5 km S to 46.47°N, with water temperatures up to 23°C. The fracture system crosses a lava plateau that bisects the axial valley.
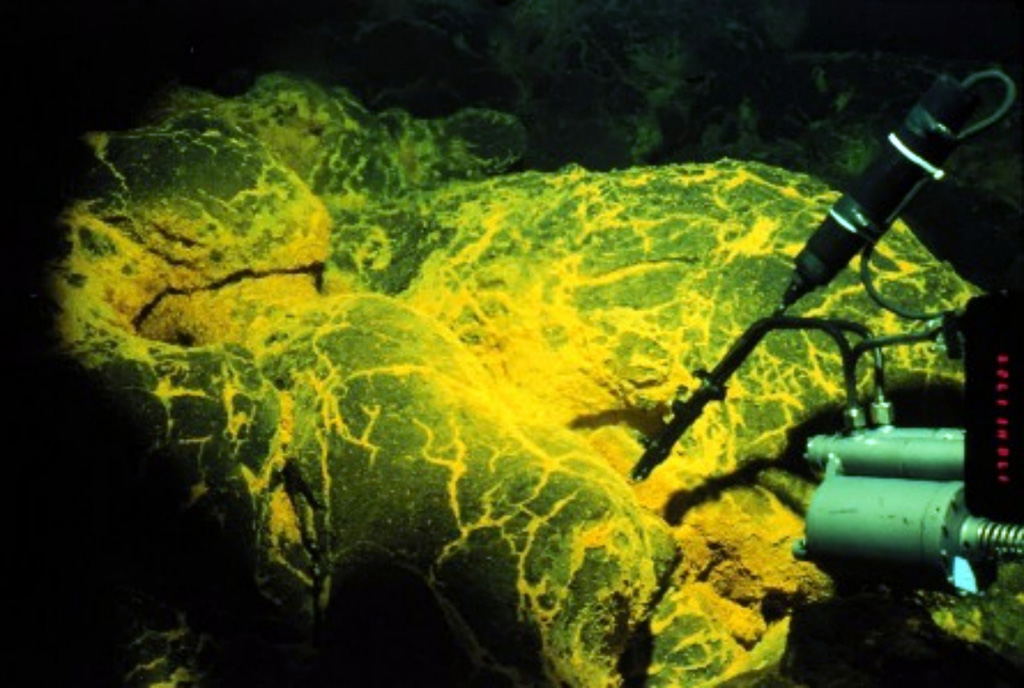
Basalt samples from the recent flow are very fresh-looking lobate to pillowed types. Upper glass selvages are up to 2.5 cm thick and are sparsely plagioclase-phyric. The glass selvages have no sediment cover (except in areas of hydrothermal discharge) and exhibit a shiny iridescent surface. Some of the samples have surficial staining (probably elemental sulfur) as the result of contact with hydrothermal fluids.
The volcanic zone of the Coaxial Segment between 46.10°N and 46.65°N was resurveyed with SeaBeam multibeam sonar. By the time data collection and analysis were complete, a new lava flow had been located with ROPOS at 46.52°N, 129.58°W. The extent of the new lava flow corresponds very closely to an area of depth change identified between SeaBeam surveys. Comparison of the new survey and the 1981 and 1991 SeaBeam surveys showed a depth change of about 30 m. Onshore processing of the data is still in progress, but no other depth changes had been confirmed by 20 Aug; there could be other new lava flows that are below the detection level of SeaBeam. Except for bacterial filaments, the young lava flow was devoid of sessile organisms, whereas adjacent old lavas hosted many non-vent animals.
Information Contacts: C. Fox, W. Chadwick, R. Embley, and R. Dziak, NOAA Vents T-phase Project.
|
|
||||||||||||||||||||||||||
There is data available for 2 confirmed eruptive periods.
1993 Jun 26 - 1993 Jul 4 (?) Confirmed Eruption (Explosive / Effusive) VEI: 0
| Episode 1 | Eruption (Explosive / Effusive) | N end CoAxial segment, Juan de Fuca Ridge | ||||||||||||||||||
|---|---|---|---|---|---|---|---|---|---|---|---|---|---|---|---|---|---|---|---|
| 1993 Jun 26 - 1993 Jul 4 (?) | Evidence from Observations: Reported | ||||||||||||||||||
|
List of 2 Events for Episode 1 at N end CoAxial segment, Juan de Fuca Ridge
|
|||||||||||||||||||
1986 Jul 2 ± 5 years ± 182 days Confirmed Eruption (Explosive / Effusive) VEI: 0
| Episode 1 | Eruption (Explosive / Effusive) | CoAxial segment, Juan de Fuca Ridge | ||||||||||||||||||
|---|---|---|---|---|---|---|---|---|---|---|---|---|---|---|---|---|---|---|---|
| 1986 Jul 2 ± 5 years ± 182 days - Unknown | Evidence from Observations: Reported | ||||||||||||||||||
|
List of 2 Events for Episode 1 at CoAxial segment, Juan de Fuca Ridge
|
|||||||||||||||||||
This compilation of synonyms and subsidiary features may not be comprehensive. Features are organized into four major categories: Cones, Craters, Domes, and Thermal Features. Synonyms of features appear indented below the primary name. In some cases additional feature type, elevation, or location details are provided.
Cones |
||||
| Feature Name | Feature Type | Elevation | Latitude | Longitude |
| Cage volcano | Shield volcano | |||
 The linear NE-SW-trending CoAxial Segment (center) of the Juan de Fuca Ridge is located about 435 km W of the Oregon coast. It lies NE of Axial volcano, which is in the bottom-left of this map. A submarine eruption along the CoAxial segment detected by acoustic hydrophones in June 1993 produced thermal plumes and a new lava flow. Bathymetric surveys indicated that one or more additional sea floor lava extrusions took place nearby sometime between 1981-82 and 1991.
 During a 1993 ROPOS ROV (Remotely Operated Vehicle) dive on the CoAxial Segment along the Juan de Fuca Ridge a new lava flow was discovered on the sea floor. It was still hot and venting warm water (up to 50°C), and was 2.5 km long and 300 m wide. Bright yellow sediment patches indicated the presence of iron-reducing bacteria in the vent fluids. The CoAxial segment is located about 435 km W of the Oregon coast, NE of Axial volcano.
There are no samples for CoAxial Segment in the Smithsonian's NMNH Department of Mineral Sciences Rock and Ore collection.
| Copernicus Browser | The Copernicus Browser replaced the Sentinel Hub Playground browser in 2023, to provide access to Earth observation archives from the Copernicus Data Space Ecosystem, the main distribution platform for data from the EU Copernicus missions. |
| MIROVA | Middle InfraRed Observation of Volcanic Activity (MIROVA) is a near real time volcanic hot-spot detection system based on the analysis of MODIS (Moderate Resolution Imaging Spectroradiometer) data. In particular, MIROVA uses the Middle InfraRed Radiation (MIR), measured over target volcanoes, in order to detect, locate and measure the heat radiation sourced from volcanic activity. |
| MODVOLC Thermal Alerts | Using infrared satellite Moderate Resolution Imaging Spectroradiometer (MODIS) data, scientists at the Hawai'i Institute of Geophysics and Planetology, University of Hawai'i, developed an automated system called MODVOLC to map thermal hot-spots in near real time. For each MODIS image, the algorithm automatically scans each 1 km pixel within it to check for high-temperature hot-spots. When one is found the date, time, location, and intensity are recorded. MODIS looks at every square km of the Earth every 48 hours, once during the day and once during the night, and the presence of two MODIS sensors in space allows at least four hot-spot observations every two days. Each day updated global maps are compiled to display the locations of all hot spots detected in the previous 24 hours. There is a drop-down list with volcano names which allow users to 'zoom-in' and examine the distribution of hot-spots at a variety of spatial scales. |
|
WOVOdat
Single Volcano View Temporal Evolution of Unrest Side by Side Volcanoes |
WOVOdat is a database of volcanic unrest; instrumentally and visually recorded changes in seismicity, ground deformation, gas emission, and other parameters from their normal baselines. It is sponsored by the World Organization of Volcano Observatories (WOVO) and presently hosted at the Earth Observatory of Singapore.
GVMID Data on Volcano Monitoring Infrastructure The Global Volcano Monitoring Infrastructure Database GVMID, is aimed at documenting and improving capabilities of volcano monitoring from the ground and space. GVMID should provide a snapshot and baseline view of the techniques and instrumentation that are in place at various volcanoes, which can be use by volcano observatories as reference to setup new monitoring system or improving networks at a specific volcano. These data will allow identification of what monitoring gaps exist, which can be then targeted by remote sensing infrastructure and future instrument deployments. |
| Volcanic Hazard Maps | The IAVCEI Commission on Volcanic Hazards and Risk has a Volcanic Hazard Maps database designed to serve as a resource for hazard mappers (or other interested parties) to explore how common issues in hazard map development have been addressed at different volcanoes, in different countries, for different hazards, and for different intended audiences. In addition to the comprehensive, searchable Volcanic Hazard Maps Database, this website contains information about diversity of volcanic hazard maps, illustrated using examples from the database. This site is for educational purposes related to volcanic hazard maps. Hazard maps found on this website should not be used for emergency purposes. For the most recent, official hazard map for a particular volcano, please seek out the proper institutional authorities on the matter. |
| IRIS seismic stations/networks | Incorporated Research Institutions for Seismology (IRIS) Data Services map showing the location of seismic stations from all available networks (permanent or temporary) within a radius of 0.18° (about 20 km at mid-latitudes) from the given location of CoAxial Segment. Users can customize a variety of filters and options in the left panel. Note that if there are no stations are known the map will default to show the entire world with a "No data matched request" error notice. |
| UNAVCO GPS/GNSS stations | Geodetic Data Services map from UNAVCO showing the location of GPS/GNSS stations from all available networks (permanent or temporary) within a radius of 20 km from the given location of CoAxial Segment. Users can customize the data search based on station or network names, location, and time window. Requires Adobe Flash Player. |
| DECADE Data | The DECADE portal, still in the developmental stage, serves as an example of the proposed interoperability between The Smithsonian Institution's Global Volcanism Program, the Mapping Gas Emissions (MaGa) Database, and the EarthChem Geochemical Portal. The Deep Earth Carbon Degassing (DECADE) initiative seeks to use new and established technologies to determine accurate global fluxes of volcanic CO2 to the atmosphere, but installing CO2 monitoring networks on 20 of the world's 150 most actively degassing volcanoes. The group uses related laboratory-based studies (direct gas sampling and analysis, melt inclusions) to provide new data for direct degassing of deep earth carbon to the atmosphere. |
| Large Eruptions of CoAxial Segment | Information about large Quaternary eruptions (VEI >= 4) is cataloged in the Large Magnitude Explosive Volcanic Eruptions (LaMEVE) database of the Volcano Global Risk Identification and Analysis Project (VOGRIPA). |
| EarthChem | EarthChem develops and maintains databases, software, and services that support the preservation, discovery, access and analysis of geochemical data, and facilitate their integration with the broad array of other available earth science parameters. EarthChem is operated by a joint team of disciplinary scientists, data scientists, data managers and information technology developers who are part of the NSF-funded data facility Integrated Earth Data Applications (IEDA). IEDA is a collaborative effort of EarthChem and the Marine Geoscience Data System (MGDS). |

