Report on Witori (Papua New Guinea) — January 2003
Bulletin of the Global Volcanism Network, vol. 28, no. 1 (January 2003)
Managing Editor: Edward Venzke.
Witori (Papua New Guinea) Slow lava effusion within the caldera continues through January 2003
Please cite this report as:
Global Volcanism Program, 2003. Report on Witori (Papua New Guinea) (Venzke, E., ed.). Bulletin of the Global Volcanism Network, 28:1. Smithsonian Institution. https://doi.org/10.5479/si.GVP.BGVN200301-252080
Witori
Papua New Guinea
5.5745°S, 150.5161°E; summit elev. 724 m
All times are local (unless otherwise noted)
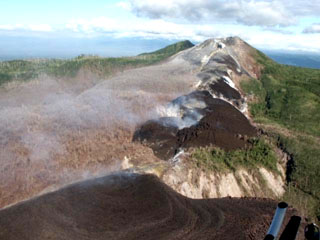
The eruption that began at Pago on 3 August 2002 (BGVN 27:07-27:09 and 27:12) continued through at least early February 2003. The Rabaul Volcano Observatory (RVO) reported that slow effusion of the lava flow from the northwestern-most vent continued. The flow was still contained within the Witori Caldera. An aerial inspection on 10 December confirmed that the lava was still moving. Besides the continuing lava flow, a weak glow was observed on the night of 28 December and rumbling noises were heard for a very short period on 9 January. Rumblings noises were also reported on 4 and 9 February.
Small volcano-tectonic earthquakes continued at background levels. Variable amounts of white vapor were released from the vents. During late December and January the northwestern-most vent was releasing some bluish vapor, indicative of continuing eruption of lava from the same vent. Some booming noises were reported on 22 January from the summit area. As of 24 January 2003, reports of browning vegetation on the S part of the volcano had not been investigated due to logistical problems. However, RVO stated that a likely cause was volcanic plumes containing sulfur gases blowing to the S and SE and affecting vegetation. Ground deformation showed a lack of significant changes during December. This contrasts with the period between the start of the eruption on 3 August and the beginning of November when complex and significant movements were recorded.
MODVOLC Thermal Alerts, 2001-2002. Throughout 2001 and 2002, thermal alerts for Pago occurred only during August-December 2002 (figure 17). This period was characterized by continuous thermal anomalies first detected on 6 August at 1030 and growing to several pixels in size. At this time the anomaly consisted of a single alert-pixel with an alert ratio of -0.31. At 2250 MODIS detected five alert-pixels with a maximum alert ratio of -0.35. The alert ratio of the anomaly rose to a peak on 8 August at 1015 when a single alert-pixel had an alert ratio of -0.035.
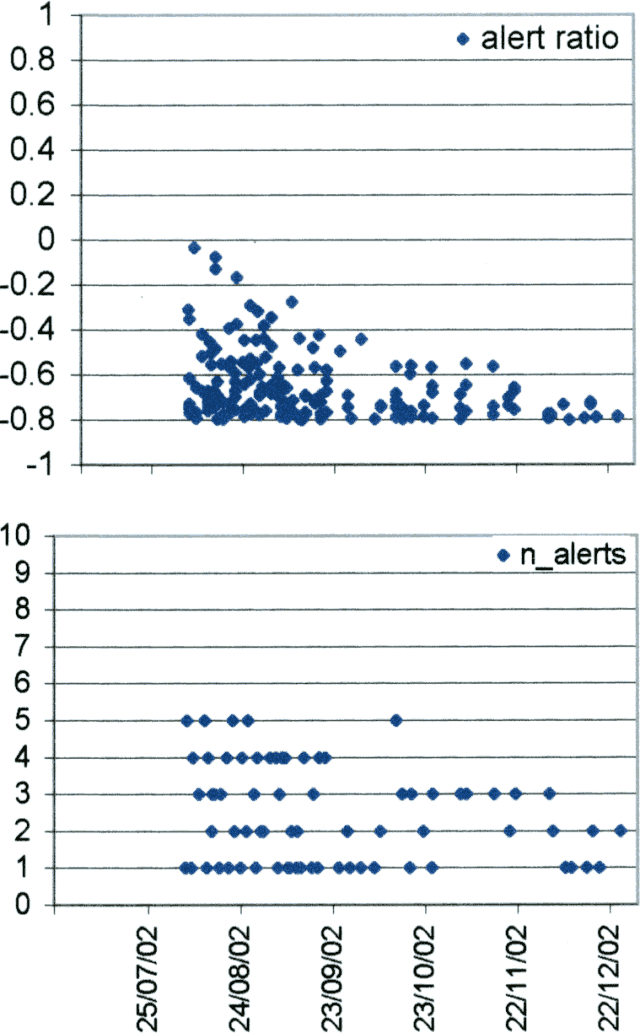 |
Figure 17. MODIS detected alerts on Pago during 2001-2002. Courtesy of Diego Coppola and David Rothery, The Open University. |
After that, during August detected alerts on Pago gradually decreased. On 15 August the anomaly consisted of three alert-pixels with a maximum alert ratio of -0.077, and on 22 August two alert-pixels were detected with maximum alert ratio of -0.167. The RVO reported that the eruption continued with low levels of activity during August and was characterized by the ejection of ash clouds (BGVN 27:08). The earliest date reported for lava effusion is 9 August (BGVN 27:07).
On 26 August MODIS detected five alert-pixels with a maximum alert ratio of -0.291. The anomaly decreased on 29 August when only one alert-pixel was detected (alert ratio -0.318), but had expanded by 31 August to two alert-pixels with a maximum alert ratio of -0.382, and by 2 September to four alert-pixels with a maximum alert ratio of -0.345. This series of anomalies is evidently related to lava erupted from the craters NW of the central cone during 25 August to 3 September (BGVN 27:08), during which lava flowed NE and then SW after reaching the caldera wall. The coordinates of the alert-pixels throughout the eruption were dispersed between the active vent and the caldera wall in a pattern consistent with this description (figure 18).
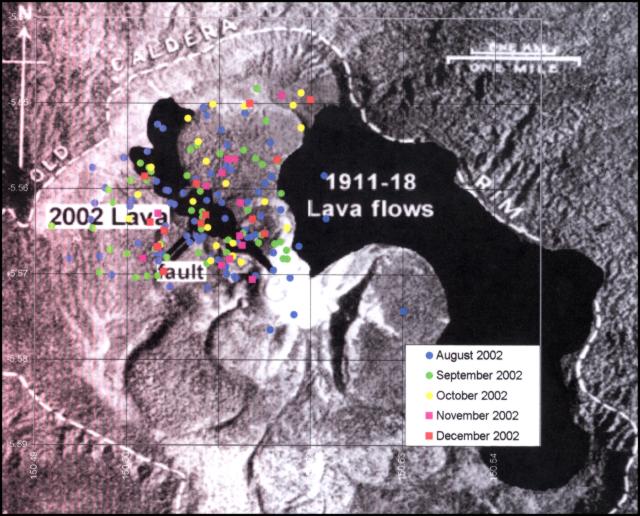 |
Figure 18. Locations of alert-pixels on Pago during 2001-2002. Courtesy of Diego Coppola and David Rothery, The Open University. |
On 9 September MODIS detected a single pixel anomaly with an alert ratio of -0.275. This anomaly was probably related to the explosion(s) that produced a 1.5-km-high ash-and-steam plume visible on satellite images on 7 and 8 September (BGVN 27:08). During September and October the alert ratio became lower and varied between one and five pixels. The relatively high alert ratio of -0.441 on 2 October was probably related to continuous lava flows in the NE portion of a fissure system inside the caldera, reported by the RVO (BGVN 27:09). MODIS detected continuous anomalies during October-December 2002, attributed to continuing lava effusion. Another alert was recorded on 15 January 2003.
Geological Summary. The active Pago cone has grown within the Witori caldera (5.5 x 7.5 km) on the northern coast of central New Britain contains the active Pago cone. The gently sloping outer caldera flanks consist primarily of dacitic pyroclastic-flow and airfall deposits produced during a series of five major explosive eruptions from about 5,600 to 1,200 years ago, many of which may have been associated with caldera formation. Pago cone may have formed less than 350 years ago; it has grown to a height above the caldera rim, and a series of ten dacitic lava flows from it covers much of the caldera floor. The youngest of these was erupted during 2002-2003 from vents extending from the summit nearly to the NW caldera wall. The Buru caldera cuts the SW flank.
Information Contacts: Ima Itikarai, Rabaul Volcano Observatory (RVO), PO Box 386, Rabaul, E.N.B.P., Papua New Guinea; Diego Coppola and David A. Rothery, Department of Earth Sciences, The Open University, Milton Keynes, MK7 6AA, United Kingdom.