Report on Asamayama (Japan) — April 2009
Bulletin of the Global Volcanism Network, vol. 34, no. 4 (April 2009)
Managing Editor: Richard Wunderman.
Asamayama (Japan) The forecasted, 2 February 2009 eruption and waning eruptions into May
Please cite this report as:
Global Volcanism Program, 2009. Report on Asamayama (Japan) (Wunderman, R., ed.). Bulletin of the Global Volcanism Network, 34:4. Smithsonian Institution. https://doi.org/10.5479/si.GVP.BGVN200904-283110
Asamayama
Japan
36.406°N, 138.523°E; summit elev. 2568 m
All times are local (unless otherwise noted)
As we previously reported (BGVN33:12), Asama erupted in January and February 2009. As reported there, scientists noted that sulfur-dioxide fluxes suddenly rose during late 2008 from more than two years of very low values, that yellow sublimates subsequently appeared, and that thin ash fell on the rim of the summit crater by 21 January. Our statement that high seismicity began 1 January 2009 is clarified in this report, where we present long-baseline seismic data. A larger eruption followed on 2 February, reaching 2 km above the summit and dropping minor ash on parts of Tokyo (~140 km SE of the vent) and beyond.
This report begins with a brief mention of a satellite image from the 2004 eruption, and then continues with descriptions of the 2009 behavior chronicled in a previous report (BGVN33:12). Much of this information has come from the Japan Meteorological Agency (JMA). Translations of those detailed and informative reports from the original Japanese were provided by Yukio Hayakawa.
Satellite image of 2004 activity. An annotated satellite image not included in Bulletin reports on the 2004 eruption (BGVN29:08, 29:10; 30:01; 30:02) has come to light (figure 35). On 16 September 2004, a plume at ~3,700 m altitude (indicated on the figure in aviation parlance as "FL120," flight level 12,000 feet) traveled due S leaving a thin ash deposit.
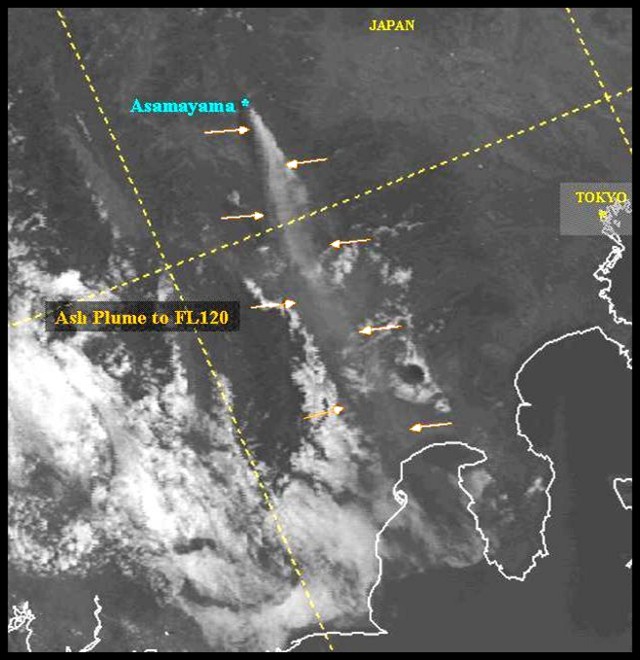 |
Figure 35. An annotated satellite image showing a 2004 Asama ash and steam plume at 0017 UTC on 16 September 2004. Enhanced Defense Meteorological Satellite Program (DMSP) visual imagery. Note dashed lines of latitude and longitude and the outlines of the coast of Honshu Island. This and at least seven other images were prepared by Charles Holliday and staff around that time. Image courtesy of US Air Force Weather Agency (AFWA). |
Multi-year eruptions and seismicity.Seismicity recorded at Asama between June 2002 and February 2009 (figure 36) included a number of different types of signals (figure 37). Eruptions are indicated by arrows of variable length corresponding to very small to medium eruptions as they occurred during 2003, 2004, 2008, and 2009.
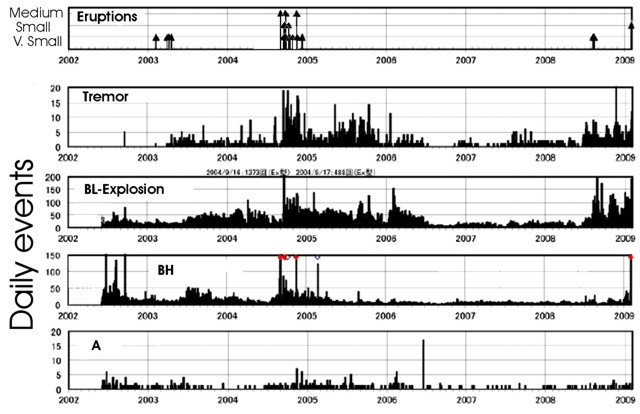 |
Figure 36. Asama eruptions and seismic data recorded from June 2002 through 2 February 2009 depicted in a series of five panels. The top panel shows eruptions (arrows) sorted into the size categories of very small, small, and medium (represented by respective arrow lengths). The second panel down shows the daily number of volcanic tremor events. The third through fifth panels show, respectively, daily numbers of earthquakes of types BL-Explosion, BH, and A. Courtesy of JMA. |
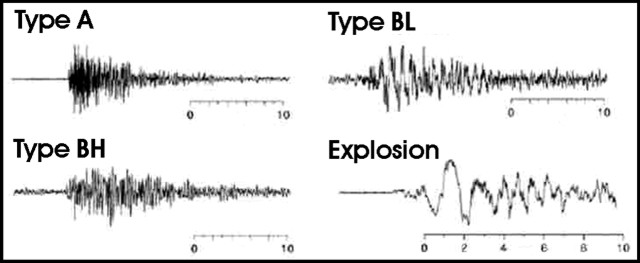 |
Figure 37. Typical seismic signals of four types of earthquakes seen at Asama during June 2002-February 2009. Scales show time in seconds. Courtesy of JMA. |
As brief background, seismic signals at volcanoes are often described using some common terms (Minakami, 1960; McNutt, 2000). Tremor consists of semi-continuous signal with durations of minutes to days or longer. Tremor's dominant frequencies are 1-5 Hz (often 2-3 Hz). Many investigators have concluded that tremor is akin to a series of low-frequency earthquakes occurring every few seconds. Explosion earthquakes accompany explosions and feature compressional, first P-wave arrivals. Some of the explosion energy enters the air where it travels much more slowly than through rocks, propagating as an acoustic wave that may be recorded by microphones or barographs. This air wave also couples back into the ground, allowing detection by a seismometer.
B-type earthquakes sometimes lack clear S waves, generally feature low frequency signals, but may include high-frequency signals as well. The types BL and BH respectively stand for low- and high-frequency (but the two types may also grade from one to the other).
Type A earthquakes are also called tectonic and volcano-tectonic. Their signals display clear P- and S-wave arrivals and are often thought to represent processes such as slip on a fault or breaking rock associated with intrusions.
Prior to the 2009 eruptions, tremor had been somewhat elevated at times during the latter half of 2007 and more consistently during the latter half of 2008. BL-Explosion earthquakes became scarce during late 2006, and from then until about mid-2008 they fluctuated to occasionally somewhat higher daily numbers. After mid-2008, these BL-Explosion earthquakes grew dramatically in number, peaking with the 2009 eruption. This pattern was similar to seismicity associated with the September 2004 eruption.
BH earthquakes generally stood at background after mid-2006 until just before the 2008 eruption. In the middle to latter months of 2008 they again grew, often remaining elevated until the start of 2009, when they increased still further.
Type-A earthquakes remained consistently small in number through 2007 onwards until their numbers peaked suddenly 2 February 2009. They were, however, present on more days approaching the 2009 eruptions.
The 2004, 2008, and 2009 eruptions included conspicuous increases in tremor, BL-Explosion earthquakes, and to some extent, BH earthquakes. Least diagnostic were type-A earthquakes, though they were present on more days with approach to the point of the 2009 eruption.
The predicted 2 February 2009 eruption.Sufficient precursory data were available for JMA to confidently announce the elevation of the hazard status to Level 3 (on a scale where the highest level is 5) at 1300 on 1 February 2009. In discussing the situation at a meeting around that time, a JMA officer said that an eruption similar to that of 2004 would take place within 2 days. Accordingly, authorities closed a vulnerable, 7-km stretch of Oni-oshi highway. It reopened the day after the 2 February eruption.
The volcano is heavily instrumented, and those maintained by JMA's Asamayama observatory are shown on figure 38. Precursory data used as a basis for the forecast included seismicity (figure 36), sulfur-dioxide fluxes (BGVN33:12), and tilt (e.g., figure 39).
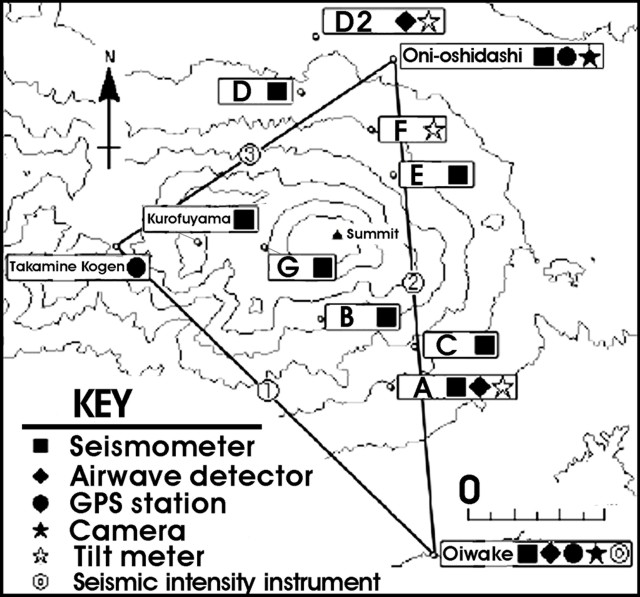 |
Figure 38. A sketch map showing Asama monitoring instrumentation discussed in 2009 JMA reports. Note the stations F, A, and D, points for collecting tilt data presented in figure 39. The contour interval is 200 m. The mountain hut is 0.7 km W of station G. The settlement Oiwake (near map's S edge) is now part of Karuizawa city. The station Oiwake is the site of JMA's Karuizawa weather station. (Oiwake is an ancient settlement located on the route between Kyoto and Edo (Tokyo), a path in use during the Edo period, 4,000-100 years ago). Courtesy of JMA. |
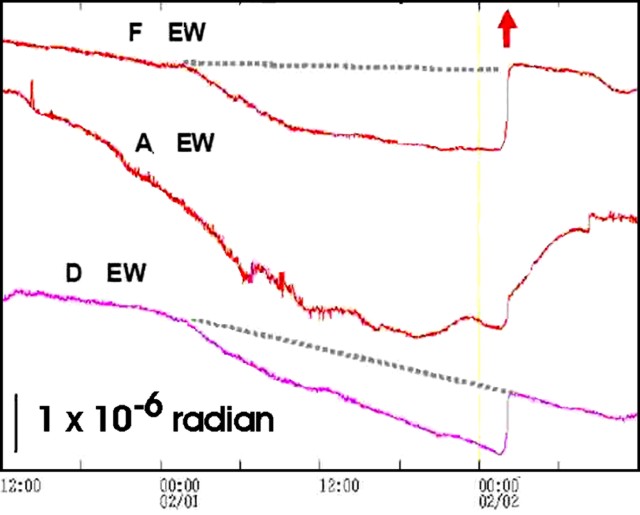 |
Figure 39. Tilt versus time at three Asama stations (F, A, and D) undergoing strong tilt excursions that helped scientists predict the 2 February eruption. The x-axis covers from 1200 on 31 January to 1200 on 2 February; the time of eruption (0151) indicated by heavy arrow at top. Clear tilt excursions (all in the EW direction) started roughly mid-day on 31 January at station A, and early on 1 February at stations F and D. At or shortly after the eruptions tilt excursions rebounded and made sudden shifts back towards their previous trends. Stations D and F returned most directly to their previous trends. With respect to time after the eruption, station A's excursions, though increasingly less extreme, continued for hours. Courtesy of JMA. |
In accord with JMA's precursory warnings, representatives of Komoro City decided to close the mountain hut 2 km W of the summit. The afternoon of 1 February, the resident and official observer there, Keisuke Kanda, readied the hut for closure. After that, he went to bed, planning to climb down the mountain the next morning. At the time of the eruption (0151) he neither felt nor heard any disturbance. At 0200 (about 9 minutes after the eruption began), he was awakened by his ringing cell phone.
The eruption that started at 0151 on 2 February generated a plume that rose to 2,000 m above the summit (to an altitude of ~ 4.6 km). Volcanic bombs were thrown to the N as far as 1 km. An air wave observed at Oiwake, 8 km SSE, had a pressure of 7 Pa. For comparison, the eruption of 1 September 2004 had a recorded air wave of 205 Pa. Cities recording ashfall included Karuizawa, Kamogawa, Tomioka, Chichibu, and in the broader Tokyo metropolitan area, Kawasaki, and Yokohama.
Aviation sources suggested that the 2 February eruption only lasted until 0800 (that is equivalent to 1 February during 1651-2300 UTC). Charles Holliday noted airport weather data. Downtown, at Tokyo International Airport (RJTT), meteorologists reported 'Volcanic Ash Cloud' during 0530-0636 on 2 February. Meteorologists at Narita International airport (RJAA) had one report interval where they noted volcanic cloud, at 1300 local time (~ 3 km altitude with ~ 9 km visibility), but this cloud did not cause local ashfall.
A US Air Force video clip noted that on 2 February ash fell on Yokota Air Base, 105 km SE of Asama. The video said that Yokota received 3-5 mm of ashfall but the features in the field of view appeared to show considerably less, perhaps suggesting some areas of thickened ash deposition. Holliday noted that ash fell at the Base hours after the eruption; although he was unable to establish the exact start time there, ashfall ended at 0800.
During the eruption, Masakatsu Umeda, working in a French restaurant 7 km N of the summit, felt small but continuous shaking and saw a red plume rising from the summit crater. He heard a far softer sound than he did on 1 September 2004 but then he was 4 km NE of the summit at Rokurigahara parking lot.
An 18 February JMA report presented a sequence of night photos capturing incandescent explosions on 2 February at 0200 and for the next 15 minutes (figure 40). These photos portray the eruptive stage often termed the jet- or gas-thrust phase (see diagrams and models on a website by Camp, 2009).
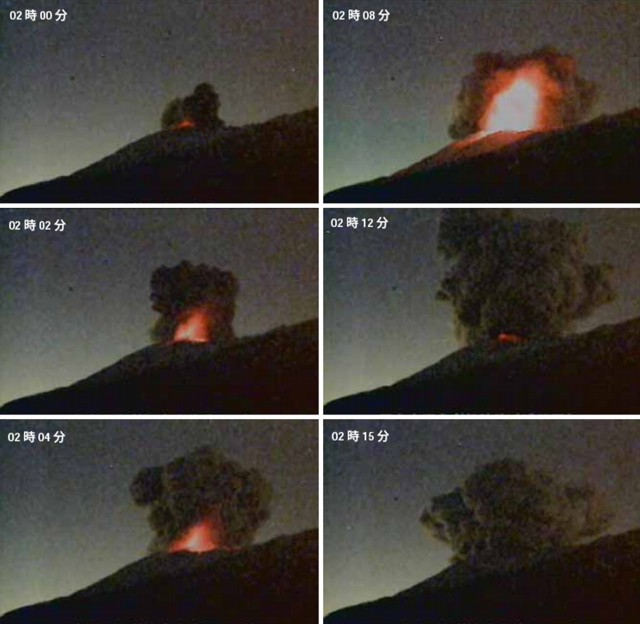 |
Figure 40. Onset of an Asama explosion captured photographically on 2 February 2009, as viewed from ~ 8 km NW at 1400 m elevation. The sequence starts in the upper left and proceeds down the first column and then to the second column (numerical values in each photo's upper left-hand corner represent time stamps; e.g., 02 08 represents 0208 hours). Note the growth of a dark billowing plume in the last two frames (from 0212 and 0215). The camera belongs to Ministry of Land, Infrastructure, Transport, and Tourism. |
Waning eruptions during next few months.A series of small eruptions followed, including those on 9, 10, 11, 16, and 17 February, 15 and 23 March, and at least as late as 2 May. The hazard status, initially raised to 3 on 1 February, dropped to 2 on 7 April.
JMA said that on 9 February at 0746, a plume rose 400 m above the summit; at 1700, a plume was 1,000 m above the summit. A trace of ashfall blew NE, to Kitakaruizawa. As of 0200 on 10 February, the plume height was 600 m above the summit; at 0500, it was 1400 m. As of 2300 on 10 February the plume height was 300 m above the summit. Takayuki Nagai, a teacher at a middle school 12 km N of Asama's summit; said that few students arriving there appeared to recognize that the eruption continued. One had seen a gray ash plume.
As of 2100 on 11 February, the eruption apparently continued, but JMA could not see plumes, probably because of bad weather. The eruption determination was seemingly based on elevated seismicity. The Tokyo Volcanic Ash Advisory Center (VAAC) indicated plumes in the range of 3-3.7 km altitude during 11-12 and 16-17 February. JMA noted an eruption during 1310-1400 on 16 February. A colored plume rose to 400 m above the summit and moved E.
Asama again erupted at 1833 on 17 February. A plume bearing ash rose to 400 m above the summit, and moved to E. Web cameras disclosed crater glow.
The Tokyo VAAC noted a plume to 3 km altitude on 15 March. JMA reported incandescence from the crater on 23 March, and an observer 50 km E at Maebashi saw strong steam plumes on 30 March. Although authorities had lowered the alert level, similar eruptions continued (with plumes to 3.4 km altitude) as late as 2 May. This was the last eruption clearly noted in available reports through the end of May.
2 February eruption's minimum mass.Several detailed maps of the SE-trending, elongate (cigar-shaped) 2009 deposits were compiled in the days after the 2009 eruptions. Such detailed maps (figure 41) enabled scientists to estimate the mass of material that fell on Honshu Island.
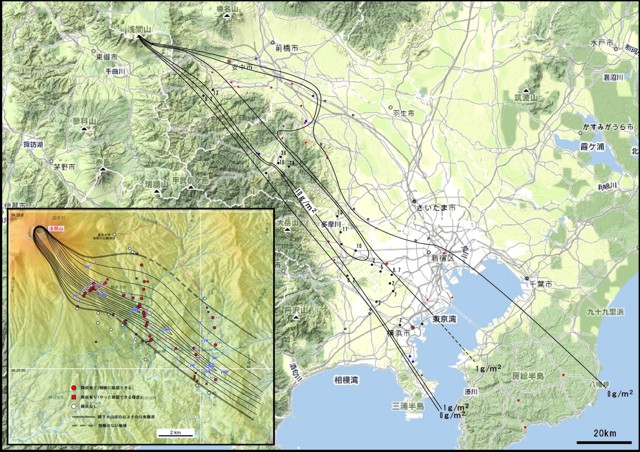 |
Figure 41. Isomass maps compiled from sampling tephra from Asama's 2 February 2009 eruption. Maps show data points and contours for the mass of ash found over S-central Honshu Island and (inset) in the 5-16 km distance range from Asama's summit vent. Data credits: (large map) Geological Survey of Japan (GSJ 18 February 2009 report); (inset) Earthquake Research Institute (ERI), University of Tokyo. |
For the map in the proximal region (inset), traverses were made across portions of the 2009 tephra deposits in early February at approximate distances of 5, 10, and 13 km from the crater. Besides showing points with measurable ash (solid circles), the maps disclose considerable points where the ash was absent or negligible (open circles). The investigators took many measurements at ~ 5 km near the axis of the deposit. Such deposits are often ephemeral, owing to post-depositional processes such as wind and particularly rainfall, which frequently strip the tephra away before detailed measurements.
For the map including the medial to more distal regions (figure 41), trace amounts of Asama tephra extended beyond Tokyo's large bay (Tokyo-wan) to the coastline of the Chiba Peninsula, ~ 220 km SE. Additional fine ash clearly blew beyond the coastline, settling over the adjacent Pacific Ocean. The GSJ estimated the erupted mass falling on Honshu Island at 20,000-30,000 metric tons (20-30 Gg).
Figure 42 illustrates the near-source deposit's mass assessment (for figure 41 inset). This yielded an erupted-mass estimate of about 2.0-2.4 metric tons. Various other maps and solutions for contours exist.
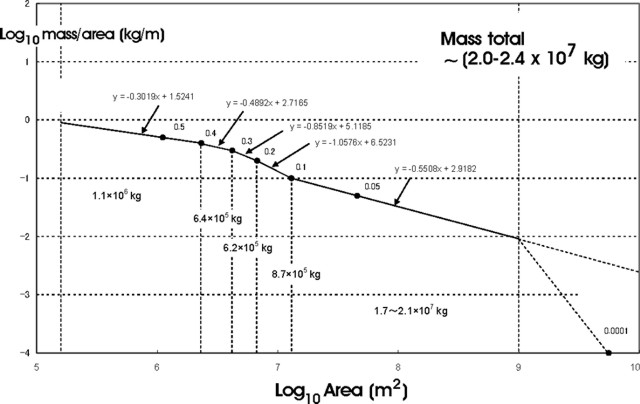 |
Figure 42. A plot summarizing mass data for the tephra blanket associated with the 2 February Asama eruption (the isomass map shown at right in the figure above). This is a plot of log10 [mass per unit area (kg/m2)] versus log10 [area (m2)]. The plot shows mass contributions along various segments. Courtesy of ERI, Univ. of Tokyo. |
Figure 43 presents basic grain-size information on the deposit. The photo shows some of the larger grains found at distance from the vent. The grains consisted largely of pre-existing rocks. Investigators found very few examples of juvenile glass grains (less than 1%). These juvenile grains were rhyolitic to dacitic.
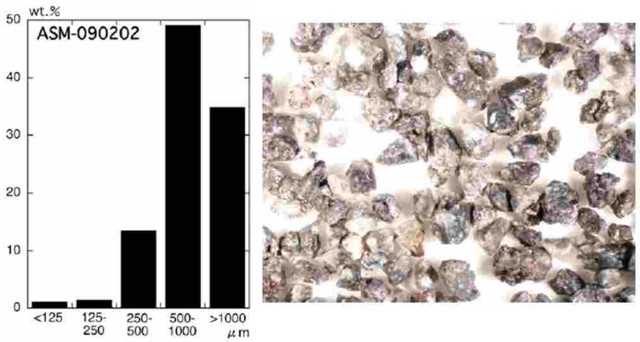 |
Figure 43. (left) Grain size fractions for Asama ash from the 2 February eruption (collection site 8 km SE of Asama). (right) Ash washed and sieved to capture particles above the 1 mm mesh size. The picture is 20 mm wide. Courtesy of ERI, Univ. of Tokyo. |
Few thin ash blankets have been assessed in more detail than the one shown here. The relevance of these efforts include understanding the character and size of the eruption and calibrating ashfall with satellite observations. Volcanic Ash Advisory Centers (VAACs) regularly model eruptions such as this in order to forecast the transport of ash in the atmosphere. This is based in part on the height of ash plumes and on meteorological observations such as wind-velocity profiles. One goal of those ash transport models is to steer aircraft clear of ash in the atmosphere. Volcanic ash plumes can reach higher altitudes than commercial aircraft can fly, and encounters with ash may lead to severe engine damage.
Reference.Camp, V., 2009, Eruption model (online): Department of Geological Sciences, San Diego State University (URL: http://www.geology.sdsu.edu/how_volcanoes_work/).
Minakami, T., 1960. Fundamental research for predicting volcanic eruptions (part 1); Earthquakes and crustal deformations originating from volcanic activities: Bull. Earthquake Res. Ins., v. 38, p. 497?544.
McNutt, S., 2000, Volcanic seismicity, in Encyclopedia of Volcanoes, Sigurdsson, H., Houghton, B., McNutt, S., Rymer, H, and Stix, J. (eds.), Academic Press, San Diego, p. 1015-1034
Geological Summary. Asamayama, Honshu's most active volcano, overlooks the resort town of Karuizawa, 140 km NW of Tokyo. The volcano is located at the junction of the Izu-Marianas and NE Japan volcanic arcs. The modern Maekake cone forms the summit and is situated east of the remnant of an older andesitic volcano, Kurofuyama, which was destroyed by a late-Pleistocene landslide about 20,000 years before present (BP). Growth of a dacitic shield volcano was accompanied by pumiceous pyroclastic flows, the largest of which occurred about 14,000-11,000 BP, and by growth of the Ko-Asamayama lava dome on the east flank. Maekake, capped by the Kamayama pyroclastic cone that forms the present summit, is probably only a few thousand years old and has observed activity dating back at least to the 11th century CE. Maekake has had several major Plinian eruptions, the last two of which occurred in 1108 (Asamayama's largest Holocene eruption) and 1783 CE.
Information Contacts: Japan Meteorological Agency (JMA), Otemachi, 1-3-4, Chiyoda-ku Tokyo 100-8122, Japan (URL: http://www.jma.go.jp/); Volcano Research Center, Earthquake Research Institute (ERI), University of Tokyo, Yayoi 1-1-1, Bunkyo-ku, Tokyo 113, Japan (URL: http://www.eri.u-tokyo.ac.jp/topics/ASAMA2004/index-e.html); Charles Holliday, (US) Air Force Weather Agency (AFWA); Yukio Hayakawa, Gunma University, Faculty of Education, Aramaki 4-2, Maebashi 371-8510, Japan; Ministry of Land, Infrastructure, Transport and Tourism (URL: http://www.mlit.go.jp/tonesui/).