JMA reported that minor inflation on Asamayama's W flank persisted during 10-17 April. The daily number of shallow volcanic earthquakes was 40-80 during 10-14 April and around 40 during 14-17 April. Sulfur dioxide emissions were high at 700 tons per day on 14 April. The Alert Level remained at a 2 (on a scale of 1-5) and warned the public that ejected blocks and pyroclastic flows may travel as far as 2 km from the crater during an eruption.
Source: Japan Meteorological Agency (JMA)
Ashfall from phreatic eruptions on 7 and 25 August 2019
Asamayama (also known as Asama), located in the Kanto-Chubu Region of Japan, previously erupted in June 2015. Activity included increased volcanic seismicity, small eruptions which occasionally resulted in ashfall, and SO2 gas emissions (BGVN 41:10). This report covers activity through August 2019, which describes small phreatic eruptions, volcanic seismicity, faint incandescence and commonly white gas plumes, and fluctuating SO2 emissions. The primary source of information for this report is provided by the Japan Meteorological Agency (JMA).
Activity during October 2016-May 2019. From October 2016 through December 2017, a high-sensitivity camera captured faint incandescence at night accompanied by white gas plumes rising above the crater to an altitude ranging 100-800 m (figure 44). A thermal anomaly and faint incandescence accompanied by a white plume near the summit was observed at night on 6-7 and 21 January 2017. These thermal anomalies were recorded near the central part of the crater bottom in January, February, and November 2017, and in May 2019. After December 2017 the faint incandescence was not observed, with an exception on 18 July 2018.
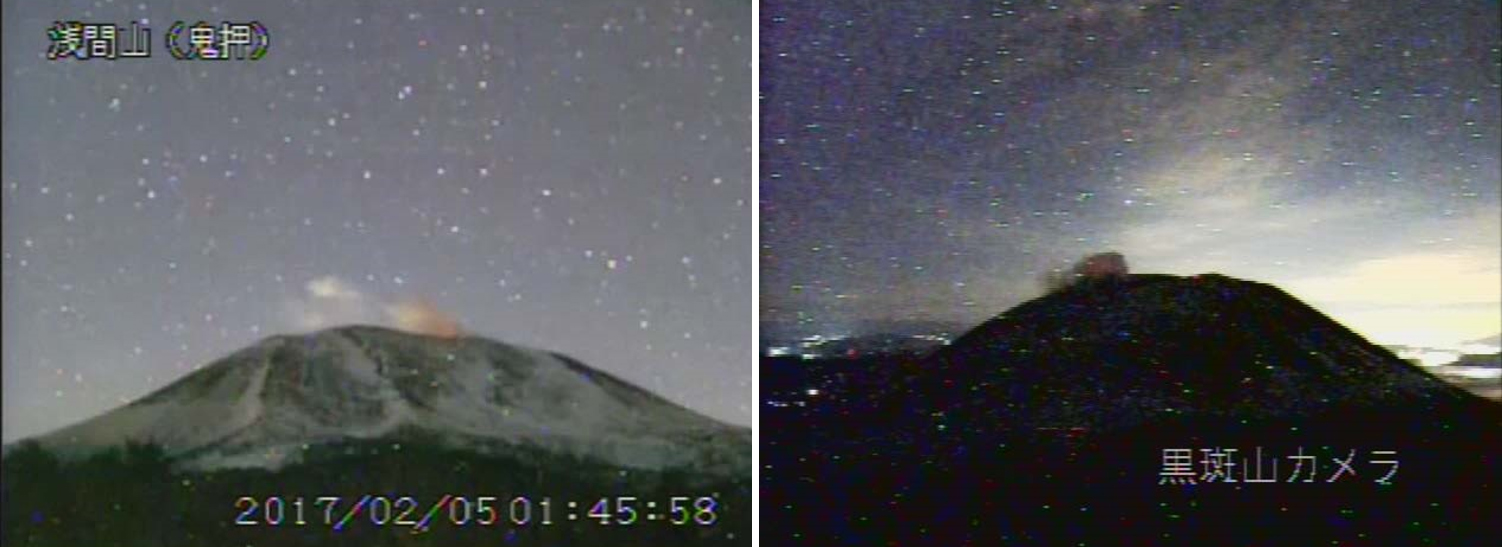 |
Figure 44. A surveillance camera observed faint incandescence at Asamayama in February 2017. Left: Onimushi surveillance camera taken at 0145 on 5 February 2017. Right: Kurokayama surveillance camera taken at 0510 on 1 February 2017. Courtesy of JMA (Monthly Report for February 2017). |
Field surveys on 6, 16, and 28 December 2016 reported an increased amount of SO2 gas emissions from November 2016 (100-600 tons/day) to March 2017 (1,300-3,200 tons/day). In April 2017 the SO2 emissions decreased (600-1,500 tons/day). Low-frequency shallow volcanic tremors decreased in December 2016; none were observed in January 2017. From February 2017 through June 2018 volcanic tremors occurred more intermittently. According to the monthly JMA Reports on February 2017 and December 2018 and data from the Geographical Survey Institute's Global Navigation Satellite Systems (GNSS), a slight inflation between the north and south baseline was recorded starting in fall 2016 through December 2018. This growth become stagnant at some of the baselines in October 2017.
Activity during August 2019. On 7 August 2019 a small phreatic eruption occurred at the summit crater and continued for about 20 minutes, resulting in an ash plume that rose to a maximum altitude of 1.8 km, drifting N and an associated earthquake and volcanic tremor (figure 45). According to the Tokyo Volcanic Ash Advisory (VAAC), this plume rose 4.6 km, based on satellite data from HIMAWARI-8. A surveillance camera observed a large volcanic block was ejected roughly 200 m from the crater. According to an ashfall survey conducted by the Mobile Observation Team on 8 August, slight ashfall occurred in the Tsumagoi Village (12 km N) and Naganohara Town (19 km NE), Gunma Prefecture (figure 46 and 47). About 2 g/m2 of ash deposit was measured by the Tokyo Institute of Technology. Immediately after the eruption on 7 August, seismicity, volcanism, and SO2 emissions temporarily increased and then decreased that same day.
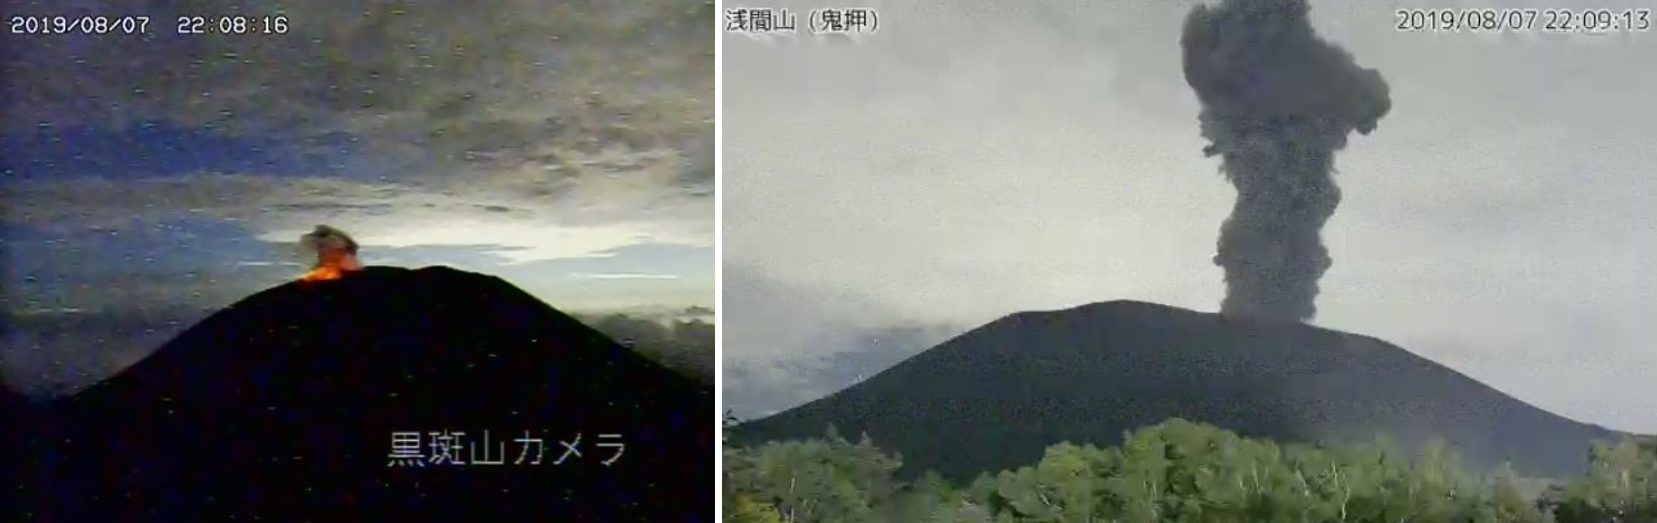 |
Figure 45. Surveillance camera images of Asamayama showing the small eruption at the summit crater on 7 August 2019, resulting in incandescence and a plume rising 1.8 km altitude. Both photos were taken on 7 August 2019.Courtesy of JMA (Monthly Report for August 2019). |
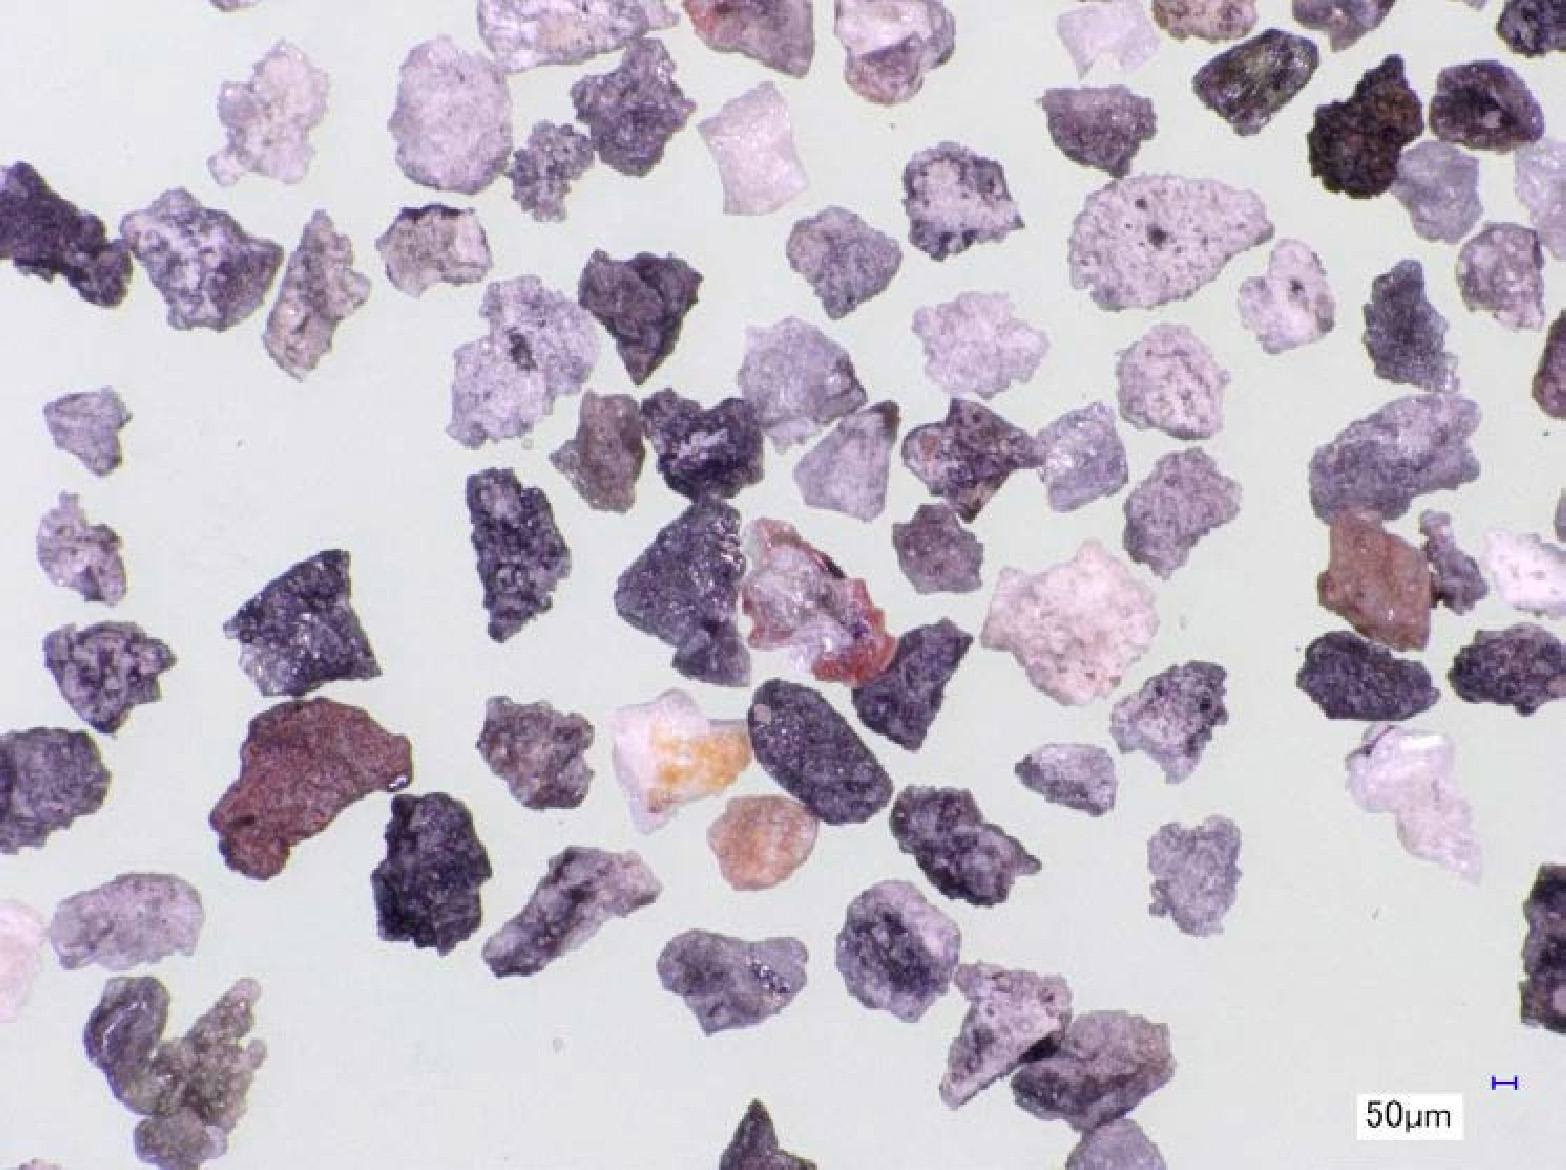 |
Figure 46. A photomicrograph of fragmented ejecta (250-500 µm) from Asamayama deposited roughly 5 km from the crater as a result of the eruption on 7 August 2019. Courtesy of JMA (Monthly Report for August 2019). |
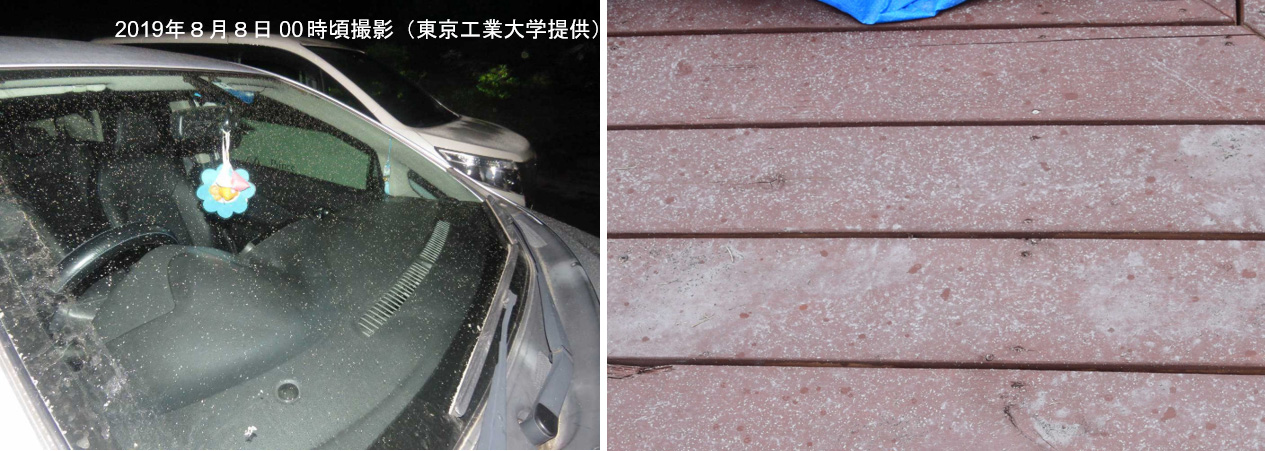 |
Figure 47. Photos of ashfall in a nearby town NNE of Asamayama due to the 7 August 2019 eruption. Courtesy of JMA (Daily Report for 8 August 2019). |
Another eruption at the summit crater on 25 August 2019 was smaller than the one on 7 August. JMA reported the resulting ash plume rose to an altitude of 600 m and drifted E. However, the Tokyo VAAC reported that the altitude of the plume up to 3.4 km, according to satellite data from HIMAWARI-8. A small amount of ashfall occurred in Karuizawa-machi, Nagano (4 km E), according to interview surveys and the Tokyo Institute of Technology.
Information Contacts: Japan Meteorological Agency (JMA), 1-3-4 Otemachi, Chiyoda-ku, Tokyo 100-8122, Japan (URL: http://www.jma.go.jp/jma/indexe.html); Tokyo Volcanic Ash Advisory Center (VAAC), 1-3-4 Otemachi, Chiyoda-ku, Tokyo 100-8122, Japan (URL: http://ds.data.jma.go.jp/svd/vaac/data/).
2023: March
| April
2021: February
| March
| August
2020: June
2019: August
| November
2018: July
2017: June
2015: June
2009: January
| February
| March
| April
2008: August
2004: August
| September
| October
| November
2003: February
| March
| April
2002: June
| September
JMA reported that minor inflation on Asamayama's W flank persisted during 10-17 April. The daily number of shallow volcanic earthquakes was 40-80 during 10-14 April and around 40 during 14-17 April. Sulfur dioxide emissions were high at 700 tons per day on 14 April. The Alert Level remained at a 2 (on a scale of 1-5) and warned the public that ejected blocks and pyroclastic flows may travel as far as 2 km from the crater during an eruption.
Source: Japan Meteorological Agency (JMA)
JMA reported that inflation on Asamayama's W flank persisted during 29 March-4 April, and the number of shallow volcanic earthquakes continued to increase. There were 95 events on 29 March, 91 on 30 March, 94 on 31 March, 77 on 1 April, 68 on 2 April, 104 on 3 April, and 149 on 4 April. Sulfur dioxide measurements were 1,600 tons per day on 29 March, which had increased compared to the previous measurement of 100 tons per day on 17 March. On 3 April the sulfur dioxide concentration was 1,000 tons per day. The Alert Level remained at a 2 (on a scale of 1-5) and warned the public to be aware of large volcanic blocks and pyroclastic flows within 2 km of the crater.
Source: Japan Meteorological Agency (JMA)
JMA reported that inflation on Asamayama’s W flank began to be detected on 15 March, and the number of shallow volcanic earthquakes increased on 21 March. On 22 March JMA raised the Alert Level to 2 (on a scale of 1-5) and warned the public that very small eruptions may impact areas within 500 m of the crater.
Source: Japan Meteorological Agency (JMA)
On 6 August JMA lowered the Alert Level for Asamayama to 1 (on a scale of 1-5), noting that the number of shallow volcanic earthquakes had been decreasing, sulfur dioxide gas emissions had been low, and deformation on the W flank had stabilized. JMA reminded the public to stay 500 m away from the crater.
Source: Japan Meteorological Agency (JMA)
On 23 March JMA raised the Alert Level for Asamayama to 2 (on a scale of 1-5), noting slight inflation on the W side of the volcano since 15 March and an increase in the number of daily volcanic earthquakes that have occurred since 20 March (36 recorded on 20 March and increasing to 77 events by 1500 on 23 March). After 23 March the number of daily volcanic earthquakes began to fluctuate, decreasing to 15 on 28 March and then 23 by 1500 on 29 March. The sulfur dioxide emission rate was 800 tons per day (t/d) on 22 March, 400 t/d on 24 March, and 700 t/d on 25 March, compared to the previous measurement of 200 t/d on 25 February.
Source: Japan Meteorological Agency (JMA)
On 5 February JMA lowered the Alert Level for Asamayama to 1 (on a scale of 1-5) noting that no deformation or crater incandescence had been detected since late November 2020, sulfur dioxide emissions had trended downward beginning in December, volcanic earthquakes were recorded only occasionally since mid-December, and the number of small-amplitude volcanic tremors were recorded occasionally and had not increased.
Source: Japan Meteorological Agency (JMA)
On 25 June JMA raised the Alert Level for Asamayama to 2 (on a scale of 1-5) noting that inflation on the W flank had been recorded since 20 June. The number of shallow (just below the summit, or 1-2 km a.s.l.) volcanic earthquakes had also increased; two volcanic tremors were detected on 20 June. Emissions form the summit crater had not changed and continued to be white in color and rise no more than 200 m above the crater rim.
Source: Japan Meteorological Agency (JMA)
On 6 November JMA lowered the Alert Level for Asamayama to 1 (on a scale of 1-5) noting that no eruptions had occurred since 26 August, volcanic tremor had not been recorded since early September, and volcanic gas emissions had been generally low.
Source: Japan Meteorological Agency (JMA)
JMA reported that at 1928 on 25 August a small eruption at Asamayama generated a grayish-white ash plume that rose 600 m above the crater rim and drifted E. Large blocks were also ejected from the crater. Minor ashfall was reported in Karuizawa Town, Nagano Prefecture, about 4 km E. The plume then turned white and continuous emissions rose 200 m during 25-26 August. The Alert Level remained at 2 (on a scale of 1-5).
Source: Japan Meteorological Agency (JMA)
JMA reported that, after a small phreatic eruption occurred at Asamayama on 7 August, both seismic activity and sulfur dioxide emissions temporarily increased and then decreased later that day. During 8-19 August white plumes generally rose 400 m above the crater rim; occasionally they rose as high as 800 m. Sulfur dioxide emissions were 70-300 tons per day. On 19 August the Alert Level was lowered to 2 (on a scale of 1-5).
Source: Japan Meteorological Agency (JMA)
JMA reported that at 2208 on 7 August a small phreatic eruption at Asamayama produced an ash plume that rose higher than 1.8 km above the crater rim and drifted N. Blocks were ejected 200 m from the crater. The eruption lasted about 20 minutes and was the first since 19 June 2015. The Alert Level was raised to 3 (on a scale of 1-5). Ash fell in Tsumagoi Village and Naganohara Town, in the Gunma Prefecture. White plumes rose as high as 700 m above the crater rim during 8-13 August, and the amount of sulfur dioxide released was 90-200 tons per day.
Source: Japan Meteorological Agency (JMA)
JMA stated that during 16-23 July white plumes rose as high as 300 m above Asamayama’s summit crater. Weak crater incandescence was visible for the first time since 23 December 2017. The Alert Level remained at 2 (on a scale of 1-5).
Source: Japan Meteorological Agency (JMA)
JMA stated that activity at Asama had been progressively increasing. During 2-5 June a plume rose less than 400 m above the active crater. Weak incandescence from the summit crater was recorded at night with a webcam. Sulfur dioxide flux was a little higher than 900 tons per day when measured on 2 June. The Alert Level remained at 2 (on a scale of 1-5).
Source: Japan Meteorological Agency (JMA)
On 16 June JMA reported that a small-scale eruption from Asama's summit crater generated ashfall to the NE within 4 km of the crater. Scientists aboard an overflight later that day observed gas venting of blue and white plumes. The Alert Level remained at 2 (on a scale of 1-5).
Source: Japan Meteorological Agency (JMA)
Based on information from JMA, the Tokyo VAAC reported that on 30 April and 2 May eruptions from Asama produced plumes that rose to altitudes of 3-3.4 km (10,000-11,000 ft) a.s.l. and drifted NE.
Source: Tokyo Volcanic Ash Advisory Center (VAAC)
On 7 April, JMA lowered the Alert Level for Asama from 3 to 2 (on a scale of 1-5).
Source: Japan Meteorological Agency (JMA)
JMA reported weak incandescence from Asama on 23 March. Strong steam emissions were seen on 30 March by an observer in Maebashi, 50 km E.
Sources: Yukio Hayakawa, Gunma University; Japan Meteorological Agency (JMA)
Based on information from JMA, the Tokyo VAAC reported that on 15 March an eruption from Asama produced a plume that rose to an altitude of 3 km (10,000 ft) a.s.l. and drifted E.
Source: Tokyo Volcanic Ash Advisory Center (VAAC)
Based on information from JMA, the Tokyo VAAC reported that during 11-12 February eruptions from Asama produced plumes that rose to altitudes of 3-3.7 km (10,000-12,000 ft) a.s.l. and drifted NE, E, and SE. JMA reported that on 16 and 17 February eruptions produced colored plumes containing ash that rose to an altitude of 3 km (10,000 ft) a.s.l. and drifted E. Incandescence in the crater was seen on web cameras.
Sources: Japan Meteorological Agency (JMA); Tokyo Volcanic Ash Advisory Center (VAAC)
JMA reported that an eruption from Asama produced ash plumes that rose to altitudes of 3-4 km (10,000-13,100 ft) a.s.l. during 9-10 February. Ash fell in areas to the NE on 9 February.
Source: Japan Meteorological Agency (JMA)
On 21 January, JMA reported that a thin ash blanket was seen on the NW crater rim of Asama. According to news articles, JMA raised the Alert Level from 2 to 3 on 1 February after detecting ground deformation and increased seismicity. An eruption the next day produced an ash plume that rose to an altitude of 4.2 km (13,800 ft) a.s.l. Ash fell in nearby communities and was detected as far away as eastern Chiba, 170 km SE. Based on analysis of satellite imagery, pilot observations, and information from JMA, the Tokyo VAAC reported that on 2 February ash plumes rose to altitudes of 3-4.6 km (10,000-15,000 ft) a.s.l. and drifted SE.
Sources: The Japan Times; Associated Press; Tokyo Volcanic Ash Advisory Center (VAAC); Japan Meteorological Agency (JMA)
Based on information from JMA, the Tokyo VAAC reported that on 14 August an eruption plume from Asama rose to an altitude of 3 km (10,000 ft) a.s.l. and drifted S.
Source: Tokyo Volcanic Ash Advisory Center (VAAC)
Based on information from JMA, the Tokyo VAAC reported that on 10 and 11 August eruption plumes from Asama rose to an altitude of 3 km (10,000 ft) a.s.l. and drifted SE and S, respectively.
Source: Tokyo Volcanic Ash Advisory Center (VAAC)
According to news reports, Asama volcano erupted with a loud explosion 14 November at 2059. The Japan Meteorological Agency rated the eruption as mid-sized, 3 on a scale of 5 in terms of power of the explosion. The agency issued a warning of falling ash in areas downwind of the volcano, although no ash plume was observed due to cloudy weather conditions. Following the explosion, falling rocks were observed over a large area on the slopes of the volcano. There were no immediate reports of injuries or damage.
The Tokyo VAAC issued a volcanic ash advisory following the eruption.
Sources: Associated Press; Tokyo Volcanic Ash Advisory Center (VAAC); Kyodo News
Based on information from JMA, the Tokyo VAAC reported that Asama erupted on 16 October at 1206, producing a SE-drifting ash cloud higher than 3.4 km a.s.l., and on 18 October at 1017, producing a N-drifting plume to a height of ~3.4 km a.s.l.
Source: Tokyo Volcanic Ash Advisory Center (VAAC)
Based on information from JMA, the Tokyo VAAC reported that an eruption at Asama at 2310 on 10 October produced a plume to an unknown height.
Source: Tokyo Volcanic Ash Advisory Center (VAAC)
Based on information from JMA, the Tokyo VAAC reported that eruptions at Asama during 23-25 September produced plumes to unknown heights.
Source: Tokyo Volcanic Ash Advisory Center (VAAC)
According to JMA, as reported by the news media, Asama erupted almost continuously for a third straight day on 16 September, causing more than 1,000 earthquakes. Incandescent fragments were ejected ~300 m from the summit and ash columns rose ~1,200 m above the crater. Late that night winds carried ash as far as central Tokyo. The frequency of the eruptions appeared to have tapered off by the afternoon of the 17th, although television footage showed gray smoke mixed with ash billowing over the mountain. By 18 September, JMA was reporting that ash plumes were still rising ~1,200 m, but only about 23 small eruptions and nearly 140 tremors had been recorded that afternoon, a significant change from the nearly consinuous activity of the previous few days. The hazard status remained at 3 on a scale of 5, meaning more small-to-medium eruptions could occur. A radar analysis conducted on 16 September confirmed that there was a lava dome in the crater, the JMA and Geographical Survey Institute reported, the first since 1973. Radar images showed a dome-shaped, layered form several dozen meters high with a radius of about 100 m in the NE part of the crater; it is an estimated 500,000 cubic meters in volume.
Sources: Reuters; The Japan Times; Associated Press
According to news reports, a small eruption at Asama around 1530 on 14 September produced an ash plume that rose 1-2.5 km above the volcano. A smaller eruption earlier that day around 0328 produced a plume to ~300 m above the volcano. A small amount of ash fell in Takasaki, Gunma Prefecture ~45 km from the volcano.
Sources: Reuters; Tokyo Volcanic Ash Advisory Center (VAAC); Kyodo News
According to news reports, the eruption that began at Asama on 1 September subsided the following day. On the 1st, an eruption produced gas and ash that rose to ~ 2 km above the volcano and ash was deposited ~125 miles downwind. JMA reported to news agencies that red glow visible at the volcano in the evening was from a forest fire and not lava flows. About 40 people were evacuated from the neighboring state of Gunma. On the 2nd, tremor had subsided and there was a lull in volcanic activity. The Alert Level remained at 3 (on a scale of 0-5).
Based on information from JMA, the Tokyo VAAC reported that an eruption beginning at Asama around 2000 on 1 September produced an ash plume to an unknown height. Ash was not visible on satellite imagery. According to news articles, JMA raised the Alert Level from 2 to 3 and advised people not to visit the volcano. No evacuations were ordered.
Sources: Reuters; Associated Press; Tokyo Volcanic Ash Advisory Center (VAAC)
JMA reported that Asama had four minor, brief (under 10-minute duration) eruptions thus far during 2003, the latest on 18 April when an ash cloud rose ~300 m. The first of the previous three occurred on 6 February when an ash cloud rose ~300 m and minor ash fell around the summit. The second took place on 30 March; again an ash cloud rose ~300 m and minor ash fell around the summit. The third took place on 7 April; in this case an ash cloud rose ~200 m. No unusual precursory seismic activity preceded these events. Asama lies in central Japan W of Tokyo, near the site of the 1998 Winter Olympic Games.
Source: Japan Meteorological Agency (JMA)
A news article stated that a small puff of gray "smoke" was emitted from Asama on 30 March. The government said there was no immediate danger of a major eruption.
Source: Associated Press
According to VRC, a photographer noticed two continuous puffs of discolored "smoke" rising from the summit of Asama on 6 February around noon. JMA noted that a puff was recorded on video footage rising 300 m above the summit crater around 1202. A small amount of ash was deposited on snow near the rim of the summit crater. Tremor, related to the emission, started around 1201 and lasted about 40 seconds. Otherwise, seismicity was at background levels and had been for several months. In addition, the temperature of the crater bottom was rather low. The last reported ash eruption at Asama occurred in July 1990.
Source: Volcano Research Center-Earthquake Research Institute (University of Tokyo)
The Asama Volcano Observatory reported that a period of high seismicity began at Asama on 18 September around 0620. Normally 30-59 earthquakes occur daily at the volcano, but on the 18th and 19th, they recorded 243 and 128 volcanic earthquakes, respectively. During this time, a relatively large amount of volcanic gas was emitted from the summit. Seismicity decreased on the 19th, but the temperature of the bottom of the crater lake remained high, as it has since May 2002. No changes in ground deformation were recorded.
Sources: Volcano Research Center-Earthquake Research Institute (University of Tokyo); Japan Meteorological Agency (JMA)
The number of volcanic earthquakes at Asama began to increase on 22 June around 0100. JMA reported that a total of 210 earthquakes occurred during 0100-0800, with the number of B-type earthquakes peaking around 0300 and A-type earthquakes occurring during 0300-0700. In addition, the temperature of the crater floor had increased since May 2002. According to news reports, crater-floor temperatures were the highest recorded since measurements began in 1994. Plumes rose 700 and 1,000 m above the summit on 2 and 4 June, respectively. On 22 June, access was restricted within 4 km of Asama's summit. After the 22nd, seismicity gradually decreased and by the 24th neither volcanic tremor nor notable changes in ground deformation were recorded.
Sources: Associated Press; Volcano Research Center-Earthquake Research Institute (University of Tokyo); The Japan Times
Reports are organized chronologically and indexed below by Month/Year (Publication Volume:Number), and include a one-line summary. Click on the index link or scroll down to read the reports.
First explosive activity in 11 years causes ashfall in early February
Card 1563 (07 February 1973) Explosion on 1 February the first since 1961
"On 1 February, 1920:26 (GMT 1020 26 sec) the Asama volcano blew up with a terrific explosion after 11 years of silence, since the activity on 7 November 1961. Only one explosion has taken place so far. Smoke and ash formed a column 1,000 m high. The volcanic ash, carried by the WNW wind, reached the Pacific Ocean. Fist-sized volcanic bombs fell within an area of four km from the crater, but no lava flow occurred. Fragments of andesite, sulfur, and pumice were found on the southern foot of the volcano. Air vibration as a result of the explosion reached 1.8 millibars as recorded on the barograph of the meteorological observatory of Karuizawa. The maximum amplitude of vibration from the explosion earthquake was 136 microns. The explosion took place seven hours after abnormally frequent earthquakes were recorded."
Card 1564 (09 February 1973) Details of eruption; ashfall and seismicity
"The summit crater of Asama-yama volcano exploded at 1920 JST on 1 February 1973. The explosion was audible at the cities of Kumagaya and Takasaki, about 80 km ESE of the volcano. This explosion was accompanied by red-hot pillars and a strong airshock which was felt as far away as Titibu city, about 70 km SE of the volcano, and was registered by seismographs (Magnification: 500) at the Izu-Osima Volcano Observatory, about 190 km SE of the crater. Large quantities of volcanic lapilli and ash fell, especially in the areas E & SE of the crater. At Tigataki, about 6 km S of the crater, many windowpanes in houses were broken because of the strong airshock, and many pumice blocks were distributed in areas several kilometers to the south. When this explosion took place, strong west winds were blowing, so ash-falls were carried from west to east, and reached the Pacific Ocean, about 200 km ESE from the volcano. At Honzyo city, about 60 km ESE of the volcano, quantities of lapilli fell (diameter of lapilli was about 2 mm). There were no reports of personal injuries. According to the observation by the Karuizawa Weather Station of the JMA, the maximum amplitude of the explosion-earthquake which was registered by seismographs at the observatory (about eight km SSE of the crater) was 136 microns, and change of air pressure by the air-shock was 1.8 mb measured on a barograph. According to the classification of explosions of Asama-yama, this explosion was estimated to be medium grade. Details of explosion, such as height of the volcanic smoke, etc. were not seen because it occurred at night. The last important explosion of Asama-yama volcano occurred in November 1961. Two very minor explosions took place in May 1965. This explosion is the first after a long calm stage of 11 years. Judging from past activities, other explosions are now expected.
"Preceding the explosion, many volcanic earthquakes were registered by seismographs at three observation points around the volcano. They gradually increased over the last six months, and quantities of smoke from the summit crater have increased since the latter part of December 1972. At dawn on 1 February, a volcanic glow was observed above the crater, and the number of earthquakes suddenly increased (about 300 in number from 1000 to 1920 hours on 1 February). After the explosion, volcanic tremors occurred for about three hours but stopped by midnight."
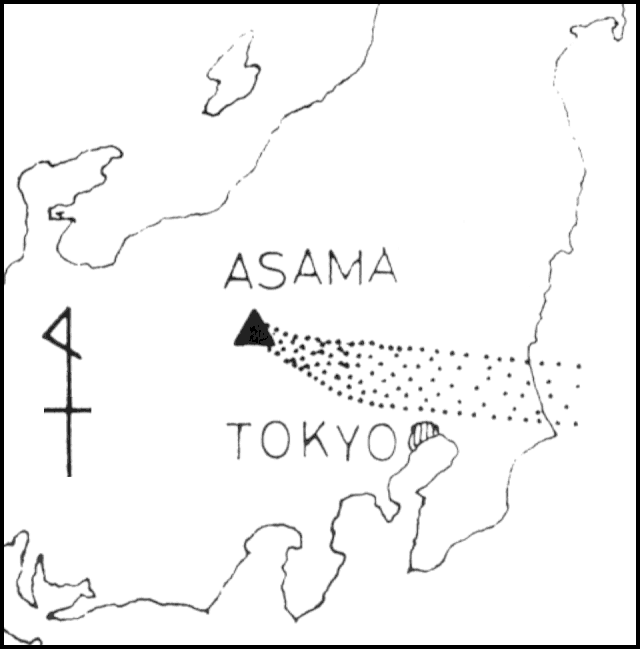 |
Figure 1. Preliminary distribution of ashfall from the explosion of Asama on 1 February 1973. Courtesy of JMA. |
Card 1568 (14 February 1973) Small eruption on 6 February causes dense ashfalls 20 km away
"Asama-yama erupted again at 1628 JST on 6 February 1973. No detonation was heard, but a small air-shock registered on a barograph (0.1 mb) at the observatory. The maximum amplitude of the explosion earthquake was 28 microns, as measured by a seismograph at the observatory. This eruption was estimated to be a small one, but dense, black-gray volcanic smoke including a large quantity of ash went up to a height of about 2500m, and much ash fell, especially to the east of the volcano. A great deal of lapilli and small volcanic blocks (max. diameter: 30mm) were distributed to a distance of four kilometers on the eastern side. Dense ash-falls obscured visibilities in areas about 20 km east of the volcano. Small quantities of fine ash were carried 150 km E of Asama-yama. After this eruption, vigorous emissions of smoke and/or minor eruptions were observed several times. No damage was reported, and no other explosions or eruptions were reported."
Information Contacts:
Card 1563 (07 February 1973) Tokiko Tiba, Dept. of Geology, National Science Museum, Tokyo, Japan.
Card 1564 (09 February 1973) Seismological Division, JMA.
Card 1568 (14 February 1973) Seismological Division, JMA.
Intermittent explosions during February
Card 1585 (19 March 1973) Intermittent explosions during February
After the explosion on 1 February, active explosions accompanied by earthquake swarms and volcanic glow (on 6 February) intermittently continued (table 1). Medium-grade explosions took place on 1 and 20 February, and small explosions occurred on 11, 14, and 15 February (one on each of those days). The other activities were minor explosions/eruptions according to the classification by the Observatory.
Table 1. Explosions from Asama, 1-20 February 1973. Courtesy of JMA.
| Date | Explosions |
| 01 Feb 1973 | 1 |
| 03 Feb 1973 | 2 |
| 05 Feb 1973 | 1 |
| 06 Feb 1973 | 5 |
| 08 Feb 1973 | 1 |
| 09 Feb 1973 | 10 |
| 10 Feb 1973 | 3 |
| 11 Feb 1973 | 8 |
| 13 Feb 1973 | 7 |
| 14 Feb 1973 | 5 |
| 15 Feb 1973 | 5 |
| 16-19 Feb 1973 | intermittently |
| 20 Feb 1973 | 1 |
The explosion at 0947 JST on 20 February was accompanied by a strong detonation and rumblings, and ash was carried by winds to the northeast and a slight ash-fall was detected at the coast, about 250km NE of the volcano. The maximum amplitude of the explosion-earthquake was 103 microns, and the air-vibration 2.3mb. The small explosions forced gray-black volcanic smoke to a height of 4000m (on 15 February) and were accompanied by detonations, air-shocks, rumblings and ashfalls. One minor explosion took place at 1659 JST on 9 march, after a temporary silence of 17 days, and then one vigorous explosion (medium grade) occurred at 0831 JST on 10 March. The height of the smoke was not determined due to the clouds, but a strong detonation was heard. The maximum amplitude was of the explosion earthquake was 177 microns, and the air-vibration was 0.9 mb. This explosion was weaker than the explosion on 1 February. Quantities of lapilli (about 1.5cm across) fell up to 25km east of the volcano, and some windowpanes in houses several kilometers east of the crater were broken by the air-shock. The ashes were carried east by winds and reached the Pacific Ocean.
Information Contacts: Seismological Division, JMA.
Moderate explosion on 18 April after a month of silence
Card 1614 (24 April 1973) Moderate explosion on 18 April after a month of silence
A medium-grade explosion with a detonation took place at 0315 JST on 18 April 1973 after a month-long silence. A medium-grade explosion occurred on 10 March, and a minor eruption on 17 March. The volcanic smoke erupted to a height of 4,500 m and was blown to the ESE. The maximum amplitude of the explosion-earthquake was 118 microns, and the recorded air-vibration was 3.7 mb at the observatory. Before this explosion, no particular increase in volcanic earthquakes was detected.
Information Contacts: Seismological Division, JMA.
Seismicity increases
Seismicity has increased substantially during the past 6 months, reaching the highest monthly total since August 1977 (figure 2). The number of recorded earthquakes peaked in September, declining slightly late in the month. No eruptive activity was observed, but monitoring was enhanced at Asama's JMA observatory.
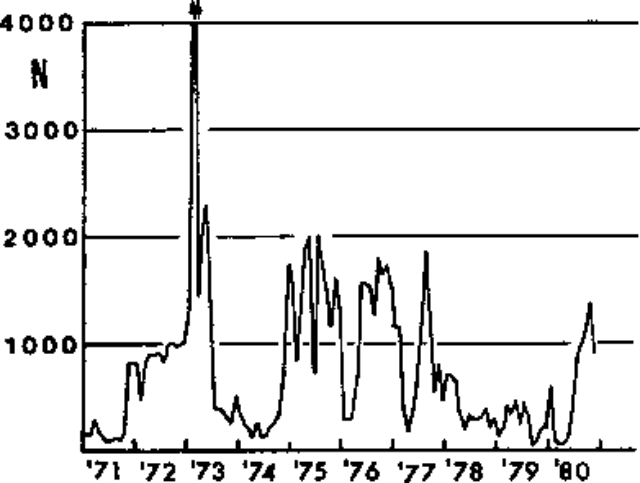 |
Figure 2. Number of seismic events recorded per month at Asama, January 1971-November 1980. The eruptions of February and March 1973 are indicated by arrows at the top. Courtesy of JMA. |
Information Contacts: JMA, Tokyo.
Frequent seismicity continues
Monthly seismicity at Asama increased from 1,114 recorded events in September to [1,365] in October, the highest monthly total since August 1977. Seismic activity decreased to 897 recorded events in November. No eruption or increase in steam emission were observed. Asama last erupted in 1973, when the earthquakes reached 5,612 per month.
Information Contacts: JMA, Tokyo.
Increased seismicity but no eruption
After a substantial increase in seismicity during the second half of 1980, the number of recorded earthquakes declined December-February. A sudden increase from fewer than 400 in February to nearly 1,000 in mid-March was not accompanied by any observed eruption or increase in steam ejection. By the end of March, seismicity had declined to the usual level of fewer than 500 recorded earthquakes per month.
Information Contacts: JMA, Tokyo.
Earthquake swarm but no eruption
On 10 August at about 1000, seismic instruments 1.8 km S of the crater recorded a sudden increase in the number of local earthquakes. The number of recorded events reached 276 on 10 August, and 230 were registered the next day. Seismicity began a gradual decline on 12 August and had dropped to the normal level of about 10 events/day a few days later (figure 3). No eruptive activity was observed, but vapor emission continued and JMA increased monitoring at its [Karuizawa Weather Station].
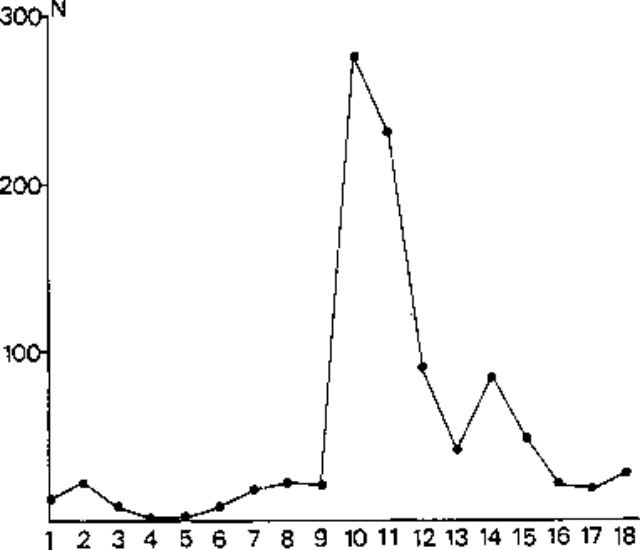 |
Figure 3. Daily number of earthquakes recorded at Asama, 1-18 August 1981. |
There have been several periods of increased seismicity at Asama since its last eruption in 1973.
Information Contacts: JMA, Tokyo.
Explosions; small pyroclastic flow; ash falls on Tokyo
Asama erupted explosively from the summit crater at 0225 and 0548 on 26 April. No increase in the number of discrete earthquakes was recorded before the eruption, but 55 periods of volcanic tremor were recorded in March, the largest monthly total since Asama last erupted, 1 February-24 May 1973. The white vapor plume normally visible above Asama's summit grew substantially in 1981. Its maximum monthly height declined in late 1981 but had begun to increase again in early 1982 (figure 4).
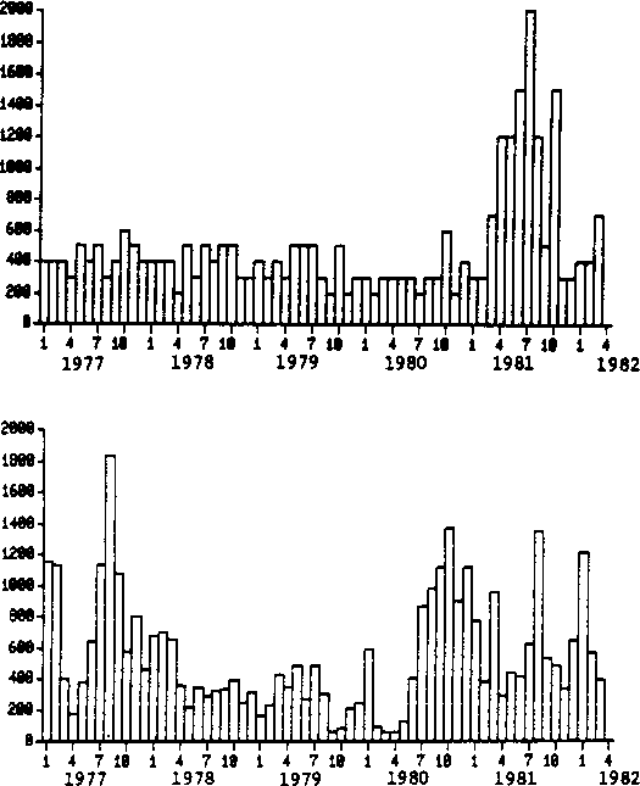 |
Figure 4. Top: Maximum monthly height (in kilometers) of the volcanic plume from Asama, January 1977-March 1982. Bottom: Monthly number of recorded seismic events at Asama, January 1977-March 1982. Courtesy of JMA. |
Local residents heard the first detonation and volcanic rumbling at 0225. A sulfuric smell persisted after the explosion. From the N rim of the summit crater, two staff members of the volcano museum at the N foot of Asama witnessed an incandescent eruption column and a pyroclastic flow. Snow on the N slope of Asama melted, and a telemetry cable serving seismic instruments was cut by a debris flow 150 seconds after the eruption began. GMS infrared images showed that an eruption cloud less than 50 km in diameter had risen to about 4.5 km at 0300. The earthquake accompanying the first explosion had a magnitude of 2.0 and a ground-shock amplitude of 35 µm, as recorded at JMA's Karuizawa [Weather Station] 2 km S of the volcano. B-type earthquakes, volcanic tremor, and ash ejection followed the explosion for about 2 hours. Eruptive activity continued intermittently until the second, smaller explosion, which began with an earthquake of 4 µm amplitude and was accompanied by volcanic tremor that lasted 10 minutes. A satellite image did not show this cloud at 0600, nor were remnants of the cloud from the first explosion evident.
Ashfall was noted at the Karuizawa [Weather Station] from 0200 until around 0600. Wind carried the ejecta primarily SE (figure 5). Ash 2-3 cm thick accumulated 12 km SE and SW of Asama at Karuizawa and Komoro. For the first time in 21 years fine ash fell in the metropolitan Tokyo area, 130 km to the SE. The total amount of ash and lapilli was estimated to be about 10,000 tons; no juvenile tephra was found. A gray plume, 500-1,000 m high, was observed throughout the day 26 April. All of the day's 89 recorded seismic events occurred after the first explosion. The number of earthquakes per day had been at normal levels since February (figure 6) and returned to normal about 1900. By 27 April, activity was limited to a 300-m-high vapor plume. No more explosions had occurred as of 30 April. The kinetic energy of the eruption was estimated at 1018 ergs.
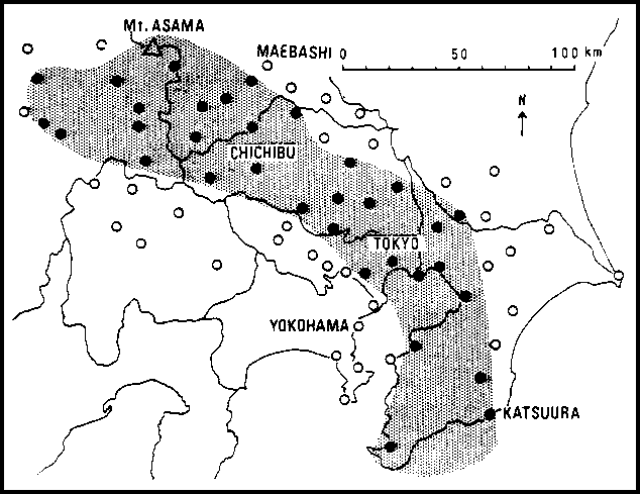 |
Figure 5. Area of ashfall (shaded region) from the 0225 eruption of Asama, 26 April. Courtesy of JMA. |
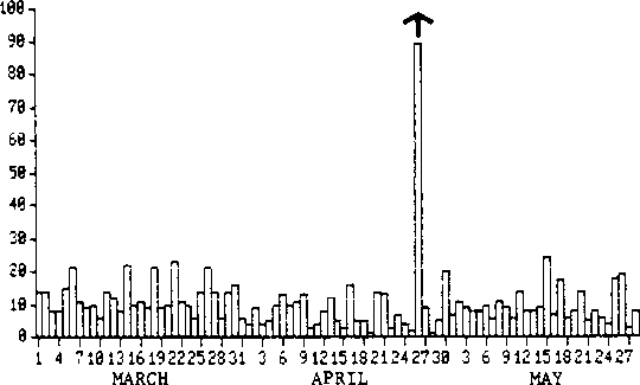 |
Figure 6. Daily number of recorded seismic events at Asama, March-May 1982. The 26 April eruption is marked by an arrow. Courtesy of JMA. |
Further References. Aramaki, S. and Hayakawa, Y., 1982, Ash-fall during the April 26, 1982 eruption of Asama volcano: Bulletin of the Volcanological Society of Japan, v. 27, no. 3, p. 203-215.
Shimozuru, D., Gyoda, N., Kagiyama, T., Koyama, E., Hagiwara, M., and Tsuji, H., 1982, The 1982 eruption of Asama volcano: Bulletin of the Earthquake Research Institute, Tokyo, v. 57, no. 3, p. 537-559.
Information Contacts: JMA, Tokyo; D. Shimozuru, ERI, Univ. of Tokyo; T. Tiba, National Science Museum, Tokyo; D. Haller, NOAA/NESS; UPI.
No further eruptions; vapor emission remains high
After the 1-day eruption of 26 April, no further eruptions have been observed as of 31 May. Local seismicity has been at its normal level since March, except on the day of the eruption (figure 6). Vapor emission remained at a high level; plumes that rose more than 1,000 m above the summit were observed on 9, 15, and 23 May.
Information Contacts: JMA, Tokyo.
Abrupt seismic event increase; explosion two days later
A small explosion occurred at 0958 on 2 October, after a sudden increase in seismicity to 108 events on 30 September then a decrease to five events the next day. The explosion caused slight ashfall on the N side of the volcano, and was accompanied by a ground shock with 2.0 µm amplitude recorded 2.0 km S of the summit.
After the 26 April explosion local seismicity had been at its usual level until July, when volcanic tremor was recorded for 15 minutes on the 6th. The level was again low until mid-August, then increased gradually in September, peaking on the 30th. On 7 October, 17 volcanic tremor events were recorded, but no explosion occurred; four were recorded the next day. As of 4 November no further explosions have been recorded, although seismicity has remained at a high level.
Information Contacts: JMA, Tokyo.
Incandescent tephra ejected; ashfall to 250 km
Asama ejected incandescent tephra before dawn 8 April. Fine ash carried by W winds fell as much as 250 km away and turned snow-capped mountains gray 80 km from the volcano. Scattered brush fires were started by hot tephra in nearby foothills. During the day, columns of whitish vapor rose from the crater. Visible imagery from the NOAA 7 polar orbiting satellite at 1500 on 8 April showed remnants of a plume extending about 80 km to the ENE, probably at roughly 5 km altitude. No casualties or major damage were reported.
Information Contacts: D. Haller, NOAA/NESDIS; UPI.
Summit crater explosive eruption
JMA scientists have sent details of the explosive, summit crater eruption on 8 April. Local seismic activity had increased in mid-March, but returned to background level in late March. In early April, high-frequency B-type earthquakes and volcanic tremor were observed more frequently than usual (figure 7).
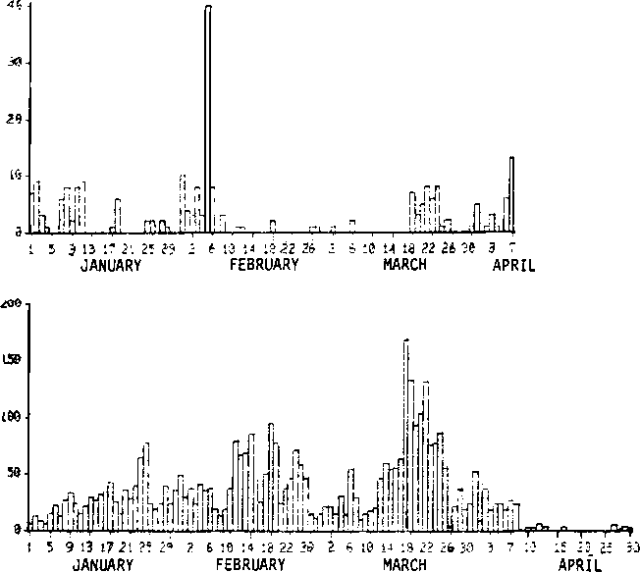 |
Figure 7. Daily number of recorded volcanic tremor events (top) and B-type earthquakes (bottom) at Asama, January-April 1983. Courtesy of JMA. |
The eruption began at 0159. The air shock (amplitude, 0.2 millibars) and eruption earthquake (amplitude, 125 µm) were recorded at the Karuizawa Weather [Station. JMA] personnel heard the thunder-like sound that accompanied the explosion, and observed the ejection of the incandescent tephra column. During the next 11 minutes, four more eruption earthquakes were recorded; seismic activity then declined rapidly. Only two volcanic earthquakes were recorded between the initial explosion and 0600, when most activity had ceased.
By 0450, when the summit was first visible from the [Weather Station], a 600-m-high, gray plume was being blown WSW from the summit. As the wind reversed during the eruption, ash was carried ENE (figure 8). Near Ko-Asama, a lava dome about 3 km E of the summit, 2.7 kg of tephra per m2 accumulated, including lapilli as large as 1 cm in diameter. By 0600 activity was limited to a 300 m-high vapor plume. No further explosions had been recorded by sunset. A forest fire started by the incandescent tephra on the S flank of Asama was extinguished by 0430.
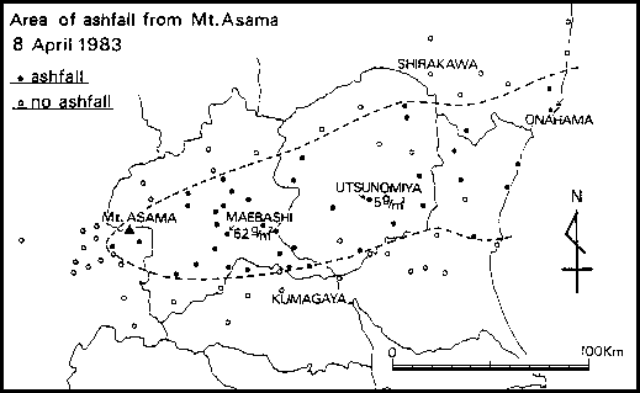 |
Figure 8. Area of ashfall from Asama, 8 April 1983. Courtesy of JMA. |
After the eruption, seismic activity declined to below background levels. Only a few seismic events per day were recorded.
Information Contacts: JMA, Tokyo.
White plume; seismicity
A white plume of constant volume rose from the summit crater during August. The number of recorded earthquakes increased 27 August-5 September, peaking on 3 September. A similar increase had occurred in late March. The earthquakes were shallow and centered under the summit crater. By 7 September, amplitudes had decreased to background levels.
Information Contacts: JMA.
Vapor emission; increased seismicity under crater
There was a sudden increase in the number of recorded earthquakes on 8 March, which persisted through early June (figure 9). Most of the earthquakes were centered just beneath the active summit crater. The number of volcanic tremor episodes increased after 9 March, following 9 months without any recorded tremor. Steam emission has also increased conspicuously since early March (figure 10) and monthly mean plume heights were the largest since the last eruption in 1982-83.
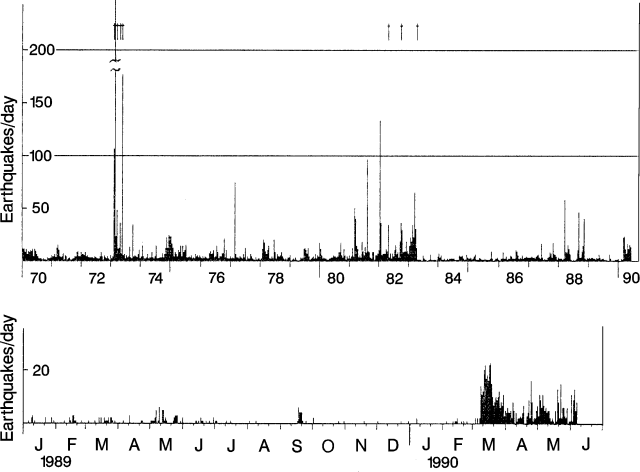 |
Figure 9. Daily number of recorded earthquakes at Asama, 1970-June 1990 (top), with detail showing daily recorded earthquakes during January 1989-June 1990 (bottom). Arrows mark eruptions. Courtesy of JMA. |
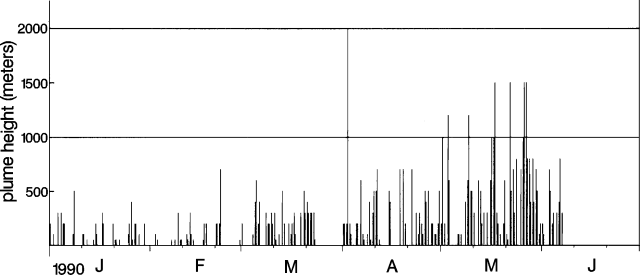 |
Figure 10. Height of steam emission from Asama, January-June 1990. Each bar represents one observation from Karuizawa Weather Station (JMA), 7.7 km SSE of the summit crater. Courtesy of JMA. |
Information Contacts: JMA.
Increasing steam emission
The number of recorded earthquakes remained elevated through early July. Most seismic events were centered just below the summit crater. Since the 10-month tremor-free period between June 1989 and 9 March 1990, the number of volcanic tremor events has also increased. Steam emission from the summit crater has increased conspicuously since March. The mean height of steam emissions in June was similar to that of May . . . .
Information Contacts: JMA.
Small ash eruptions; continued high seismicity
Small ash eruptions occurred on 20 July from around 0440 to 0700. Slight ashfall was recognized as far as 8 km E from the volcano. No damage was caused and no sounds were heard but seismometers recorded explosion shocks at 0437, 0438, and 0440. The ash plume, photographed by a video camera, was about 1,000 m high.
Seismicity remained at a high level as of 6 August. A seismic station 3.8 km SSE of the volcano recorded 166 earthquakes in July, only a small increase from the June total of 144. Most epicenters were located under the summit. Steam plume heights have increased several hundred meters since March.
Information Contacts: JMA.
Seismicity fluctuates; steam emission remains strong
Although seismicity remained at high levels following the multiple ash emissions on 20 July (15:07), the number of earthquakes fluctuated, decreasing after mid-August, increasing 28 August to a peak 31 August-2 September, then decreasing as of 10 September. During August, 103 earthquakes (down from 167 in July) primarily located under the summit, were recorded. Of the 36 recorded tremor episodes, the majority (25) occurred on 30 August after tremor was absent 3-28 August. Steam plume heights . . . remained high as of 10 September.
Information Contacts: JMA.
Seismicity and steam emission at high levels
Seismicity fluctuated, but remained at high levels (204 earthquakes during September, up from 104 in August) . . . . Peaks in seismicity occurred in early and late September (55 earthquakes were recorded on the 26th, the most in a single day since activity increased in March), both preceded by periods of low seismicity. The number of volcanic tremor events also increased during late September and the monthly total (26) was increased from August when 13 were recorded. Steam plume heights . . . remained high in September (figure 11).
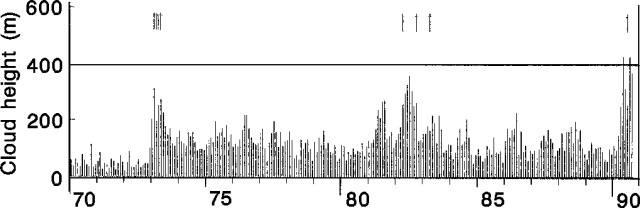 |
Figure 11. Monthly mean cloud height at Asama, 1970-90. Arrows at top mark eruptions. Courtesy of JMA. |
Information Contacts: JMA.
Seismicity declines slightly
High seismicity . . . continued through October, but declined slightly from previous months. A monthly total of 105 earthquakes and 19 tremor episodes were recorded, declining from 206 and 24 respectively in September. Seismicity was continuing to decline as of 14 November.
Information Contacts: JMA.
Seismicity declines
The strong seismicity . . . has declined since late October. Only 27 earthquakes and one tremor episode were recorded in November, compared to 105 and 31 respectively in October. Similar activity was noted in early December.
Information Contacts: JMA.
Steam emission and seismicity
Frequent seismicity . . . has declined since late October (figure 12). In December, 33 earthquakes but no tremor episodes were recorded, compared to 27 and 1, respectively, in November. Steam emission continued at levels similar to November, reaching 600 m above the summit.
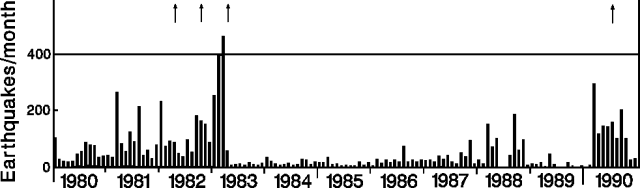 |
Figure 12. Monthly number of earthquakes at Asama 1980-90. Arrows mark eruptions. Courtesy of JMA. |
Information Contacts: JMA.
Continued steam emission; seismicity increases after 2 months of quiet
Strong seismicity . . . declined during February and March 1991. Only 19 earthquakes and no tremor episodes were recorded in March. Seismicity increased again 8-18 April and a monthly total of 250 earthquakes and 17 tremor episodes were recorded (figure 13). Steam emission remained unchanged with a plume height of a few hundred meters.
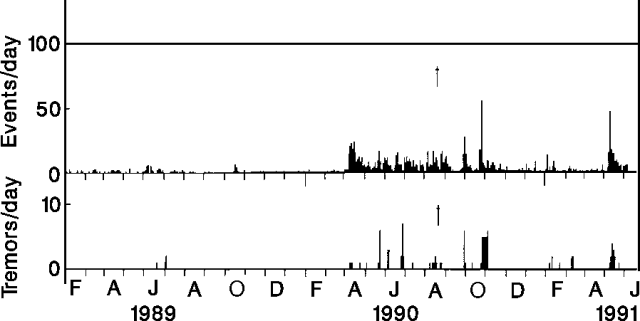 |
Figure 13. Daily number of recorded earthquakes (top) and tremor episodes (bottom) at Asama, January 1989-early May 1991. Arrow marks small ash eruptions on 20 July 1990. Courtesy of JMA. |
Information Contacts: JMA.
First month with over 1,000 earthquakes since 1991
Last reported on in 1991 (BGVN 16:04), but one of Japan's most active volcanoes, Asama had an increase in seismicity during mid-April. On 17 April the seismic system at station B, 2 km S of the summit, recorded 107 earthquakes. After that, the daily number of earthquakes dropped to between about 10 and 80. The total number of April earthquakes at station B was 1031; the last month with over 1,000 detected earthquakes was April 1991 (1,051).
Asama has had over 100 explosive eruptions since ~350 AD. The vast majority of these eruptions have been assigned Volcanic Explosivity Index (VEI) values of 2-3, but several had VEI values of 4 or 5.
Information Contacts: Volcanological Division, Seismological and Volcanological Department, Japan Meteorological Agency (JMA), 1-3-4 Ote-machi, Chiyoda-ku, Tokyo 100 Japan.
Variable seismicity, but less than April; steam plume to 800 m
Earthquake intensity during May was variable, although far fewer events were recorded compared to April (figure 14 and BGVN 20:04). At Station B (2 km S), 585 earthquakes and two tremors were recorded during May. On 18 May the highest steam plume of the month rose 800 m above the crater rim.
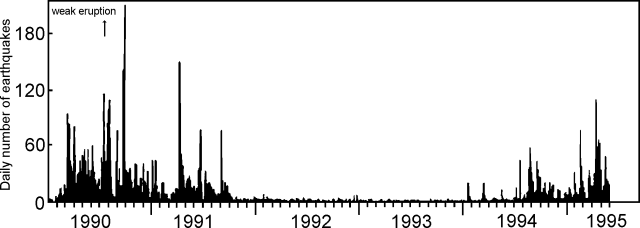 |
Figure 14. Daily number of earthquakes at Asama, 1 January 1990- 31 May 1995. Courtesy of JMA. |
Information Contacts: Volcanological Division, Seismological and Volcanological Department, Japan Meteorological Agency (JMA), 1-3-4 Ote-machi, Chiyoda-ku, Tokyo 100 Japan.
Ongoing seismicity
During early June the number of earthquakes (at Station B, 2 km S of the summit) increased and the monthly maximum of 113 events occurred on 8 June. The monthly earthquake total was 700. Steam continued to discharge from the summit crater during June; the highest plume rose 700 m above the crater rim (7 June).
Information Contacts: Volcanological Division, Seismological and Volcanological Dept, Japan Meteorological Agency (JMA), 1-3-4 Ote-machi, Chiyoda-ku, Tokyo 100 Japan.
Seismic activity increases
Seismicity was above normal levels during June, with 1,002 earthquakes recorded at Station B, 2 km S the summit. A peak of 70 events occurred on 5 June.
Information Contacts: Volcanological Division, Japan Meteorological Agency, 1-3-4 Ote-machi, Chiyoda-ku, Tokyo 100, Japan
Seismic activity continues
Seismicity was high during September: The monthly total number of earthquakes at Station B, 2 km S from the summit, was 874. The daily total number of earthquakes was 30-50 with a maximum of 71 on 3 September. Seismicity decreased in October: the total number of earthquakes recorded at station B was 702.
An abrupt increase in seismicity took place on 10 November when 216 earthquakes were recorded. Activity decreased the next day and then increased on 27 November. The monthly total number of earthquakes was 769.
Information Contacts: Volcanological Division, Japan Meteorological Agency (JMA), 1-3-4 Ote-machi, Chiyoda-ku, Tokyo 100, Japan.
Periods of heightened seismicity during September 2000 and June 2002
Asama has a history of periodic heightened seismicity; the last reported seismicity increase occurred in September 1996 (BGVN 21:11). A previously unreported seismic increase began on 18 September 2000. During 18-24 September the Japan Meteorological Agency (JMA) recorded 138, 431, 310, 243, 96, 33, and 14 earthquakes per day, respectively.
During 22-23 June 2002 another period of heightened seismicity occurred at Asama that was similar to the September 2000 activity (figure 15). The earthquakes began at 0100 on 22 June and at 0900 JMA issued a Volcanic Advisory stating that 210 volcanic tremor events had occurred during 0100-0800. The report also stated that the temperature of the crater floor had increased since May 2002; on 19 June the floor was at 180°C. Prior to the heightened seismicity, on 2 and 4 June plumes rose 700 and 1,000 m above Asama's summit, respectively.
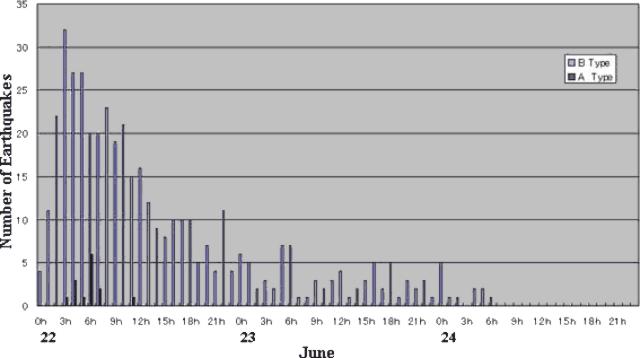 |
Figure 15. Plot showing volcanic earthquakes registered at Asama during 22-24 June 2002. The number of earthquakes peaked on 22 June around 0300 and gradually decreased, reaching background levels on 24 June. Courtesy of Asama Volcano Observatory, ERI-University of Tokyo. |
The Asama Volcano Observatory (ERI, University of Tokyo) reported that the number of B-type earthquakes peaked around 0300 on 22 June, with more than 30 earthquakes recorded per hour at a station located on the middle of Asama's eastern slope. Several A-type earthquakes, with a maximum magnitude of 2.1, occurred during 0300-0700. The B- and A-type earthquakes occurred 1.5 and 3.5 km beneath the volcano, respectively.
The restricted area surrounding Asama's summit was increased from 2 km to a 4-km radius on 22 June. After the 22nd, seismicity gradually decreased and JMA reported that by the afternoon of 24 June neither volcanic tremor nor notable changes in ground deformation had been recorded.
Information Contacts: Tsuneomi Kagiyama, Earthquake Research Institute, University of Tokyo; Yukio Hayakawa, Gunma University, Japan (URL: http://www.hayakawayukio.jp/).
Four minor ash eruptions during February-April 2003
Asama, located near the resort town of Karuizawa ~150 km W of Tokyo, has been seismically active since 18 September 2000. Heightened seismicity occurred in June 2002, when the daily number of volcanic earthquakes exceeded 300 (BGVN 27:06). The Asama Volcano Observatory (ERI, University of Tokyo) and JMA reported that a new episode of elevated seismicity started around 0620 on 18 September 2002. A relatively large amount of volcanic gas trailed from the summit. The seismicity increased after 0800, 18 September, such that 243 volcanic earthquakes took place on 18 September and another 128 on the 19th, after which the seismic activity decreased. However, the temperature of the crater bottom remained at the elevated levels observed since May 2002. No change was observed in ground deformation.
According to the Japan Meteorological Agency (JMA), seismicity had been at background levels for several months, and the temperature of the crater had been rather low prior to four minor eruptions between 6 February and 18 April 2003. The first eruption occurred at about noon on 6 February as an ash cloud was seen rising to 300 m above the summit crater, with minor ashfall around the summit. Seismic tremor related to the emission started at around 1201 and lasted about 40 seconds. On 30 March at 0154 hours, a gray ash cloud rose 300 m, with minor ashfall around the summit. Then, on 7 April at 0924, an ash cloud rose 200 m. On 18 April at 0732 the volcano spewed a mixture of black smoke and pale ash ~300 m high. There were no reports of injuries or damage from these eruptions, and the JMA reported that more such activity is expected. All of the eruptions were brief, none having durations of more than 10 minutes. No unusual precursory seismic activity preceded these events, but plume activity has increased since the beginning of February.
Information Contacts: Hitoshi Yamasato and Tomoyuki Kanno, Japan Meteorological Agency (JMA), Volcanological Division, 1-3-4 Ote-machi, Chiyoda-ku, Tokyo 100, Japan (URL: http://www.jma.go.jp/jma/index.html); Hidefumi Watanabe and Setysuya Nakada, Volcano Research Center-Earthquake Research Institute, University of Tokyo, Yayoi 1-1-1, Bunkyo, Tokyo, 113-0032 Japan (URL: http://www.eri.u-tokyo.ac.jp/VRC/index_E.html).
Volcanic tremor episodes in April 2003
Asama has been seismically active since 18 September 2000. Heightened seismicity occurred in June 2002, when the daily number of volcanic earthquakes exceeded 300 (BGVN 27:06). The Asama Volcano Observatory (ERI, University of Tokyo) and Japan Meteorological Agency (JMA) reported a new episode of elevated seismicity during 18-19 September 2002 (BGVN 28:04). According to JMA there were brief ash eruptions on 6 February, 30 March, 7 April, and 18 April 2003 to heights of 200-300 m above the crater with minor ashfall around the summit (BGVN 28:04).
Seismic data and plume observations compiled from JMA reports for September 2000 through April 2003 (table 2) reflect this recent activity. White plumes were reported from the Kama-yama crater during every month in this period, with the addition of grayish white plumes on 6 February, 7 April, and 18 April. These white plumes only rose to 1 km or above in April and May 2001, and June and August 2002. In addition, short isolated episodes of volcanic tremor were recorded in October 2001, February 2003, and March 2003. However, 12 episodes occurred in April 2003, with five on the 29th.
Table 2. Summary of seismicity and plume observations at Asama, January 2000-April 2003. All reported plumes originated from the Kama-yama crater, and were described as either white (W) or grayish white (GW). Data courtesy of JMA.
| Month | Total volcanic earthquakes | Maximum volcanic earthquakes (date) | Plume Height (m) (date) | Plume Color |
| Jan 2000 | 5 | 1 (4, 5, 9, 14, 18) | 300 (25, 26, 28) | W |
| Feb 2000 | 3 | 2 (26) | 300 (10) | W |
| Mar 2000 | 8 | 3 (29) | 300 (1, 10) | W |
| Apr 2000 | 75 | 27 (17) | 400 (17) | W |
| May 2000 | 10 | 2 (19, 27) | 500 (5, 30) | W |
| Jun 2000 | 26 | 6 (4) | 300 (4, 5, 15) | W |
| Jul 2000 | 13 | 3 (11, 29) | 300 (9) | W |
| Aug 2000 | 20 | 3 (5) | 200 (2, 21, 26) | W |
| Sep 2000 | 419 | 149 (19) | 500 (21) | W |
| Oct 2000 | 79 | 27 (31) | 400 (19) | W |
| Nov 2000 | 322 | 34 (25) | 300 (4, 6, 23, 27) | W |
| Dec 2000 | 234 | 18 (4, 6) | 500 (27) | W |
| Jan 2001 | 41 | 7 (2) | 700 (30) | W |
| Feb 2001 | 128 | 46 (19) | 500 (15) | W |
| Mar 2001 | 162 | 29 (24) | 800 (12, 21, 24) | W |
| Apr 2001 | 182 | 41 (10) | 1000 (28) | W |
| May 2001 | 20 | 3 (3, 36) | 1200 (17) | W |
| Jun 2001 | 11 | 2 (6, 7) | 800 (3) | W |
| Jul 2001 | 115 | 24 (13) | 600 (5) | W |
| Aug 2001 | 36 | 5 (18) | 400 (13, 28, 29) | W |
| Sep 2001 | 99 | 14 (23) | 500 (24, 25) | W |
| Oct 2001 | 113 | 12 (29) | 700 (27) | W |
| Nov 2001 | 144 | 13 (9) | 600 (11) | W |
| Dec 2001 | 80 | 7 (4) | 200 (many) | W |
| Jan 2002 | 150 | 11 (15) | 300 (6, 24) | W |
| Feb 2002 | 57 | 5 (many) | 400 (24) | W |
| Mar 2002 | 732 | 51 (30) | 300 (4, 25) | W |
| Apr 2002 | 979 | 103 (9) | 600 (29) | W |
| May 2002 | 953 | 49 (9) | 700 (28) | W |
| Jun 2002 | 1434 | 360 (22) | 1000 (2, 24) | W |
| Jul 2002 | 1499 | 119 (9) | 500 (many) | W |
| Aug 2002 | 1464 | 176 (9) | 1500 (6) | W |
| Sep 2002 | 1358 | 243 (18) | 600 (19) | W |
| Oct 2002 | 837 | 40 (6) | 700 (12) | W |
| Nov 2002 | 630 | 40 (11) | 400 (6) | W |
| Dec 2002 | 601 | 58 (22) | 300 (23, 26) | W |
| Jan 2003 | 775 | 42 (20) | 500 (20, 30) | W |
| Feb 2003 | 594 | 43 (3) | 500 (19) | W, GW (6) |
| Mar 2003 | 614 | 41 (15) | 300 (20, 30) | W |
| Apr 2003 | 458 | 31 (18) | 400 (22) | W, GW (7, 18) |
Information Contacts: Volcanological Division, Japan Meteorological Agency (JMA), 1-3-4 Ote-machi, Chiyoda-ku, Tokyo 100, Japan (URL: http://www.jma.go.jp/).
Eruption on 1 September causes an elongate ashfall deposit
An explosive eruption occurred from the summit crater of Asama at 2002 on 1 September 2004. Most of the initial reporting was in Japanese, although many of those reports had segments in English. Setsuya Nakada and Yukio Hayakawa provided links to initially available reports. According to the Geological Survey of Japan's website (managed by N. Geshi) and an article there summarizing contributions from many organizations and authors, the 1 September eruption was a single Vulcanian explosion.
According to the preliminary report of JMA, red-hot blocks spread several kilometers from the summit and caused many wildfires. Video images showed an extraordinary amount of incandescence at height, as well as bright zones on the ground surface. Some of the burns remained limited to the area of contact between the hot bombs and alpine vegetation.
On 3 September Yukio Hayakawa (Gunma University) visited parts of Asama's upland areas where wildfires had occurred (figure 16). There he found bombs up to a meter in diameter. Because of their greater size, the larger bombs cooled more slowly and had the greatest thermal impact. At least one large bomb had cracked and fragmented on impact, delivering relatively hot material over a wide area. This process accounted for the largest burned area he inspected. Hayakawa photographed an impressive impact crater associated with a large volcanic bomb from the 1 September eruption (figure 17). Along the impact crater's rim, the network of low-lying alpine vegetation was torn loose and lay folded back and upside-down.
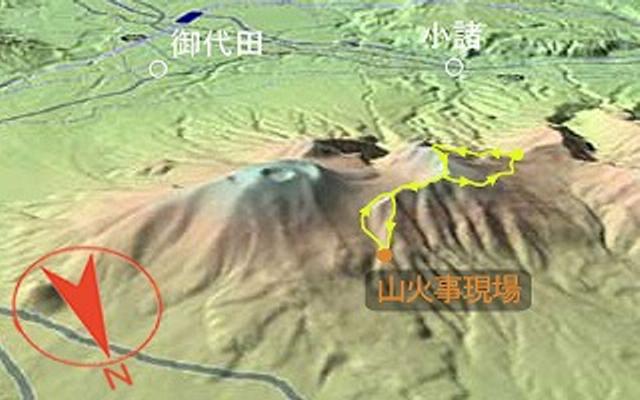 |
Figure 16. An image depicting Asama's topography with the route hiked (yellow) to investigate the eruption-induced wildfires (orange dot is the fire site investigated, at ~2,000 m elevation). Two urban areas indicated in Japanese on the map are Miyota town and Komoro city (white circles on left and right, respectively); the two sit ~7 km apart. Courtesy of Yukio Hayakawa, Gunma University. |
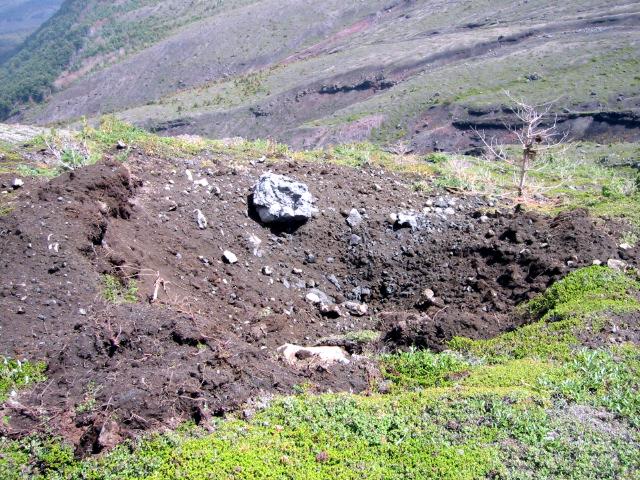 |
Figure 17. A fresh impact crater formed by a large bomb from the 1 September 2004 Asama eruption. Crater diameter at the plane of the undisturbed land surface was ~6 m, crater depth was ~1 m, and the rim of disturbed material stood up to ~0.5 m high. The impactor is visible at the NW wall of the crater (~0.8 m). Courtesy of Yukio Hayakawa, Gunma University. |
After the eruption, a helicopter flight around the volcano also confirmed that many ballistic blocks had landed on the volcano's upper flanks (figure 18). Asia Air Survey (Ltd.) also compiled a comprehensive set of post-eruption aerial stereophotos of Asama and surroundings. Ones taken of the crater on 3 September showed the principal crater immersed in a circular bank of dense white volcanic gases. A thin white plume blew NE. Impact scars were also visible on these photos, scattered over the upper flanks.
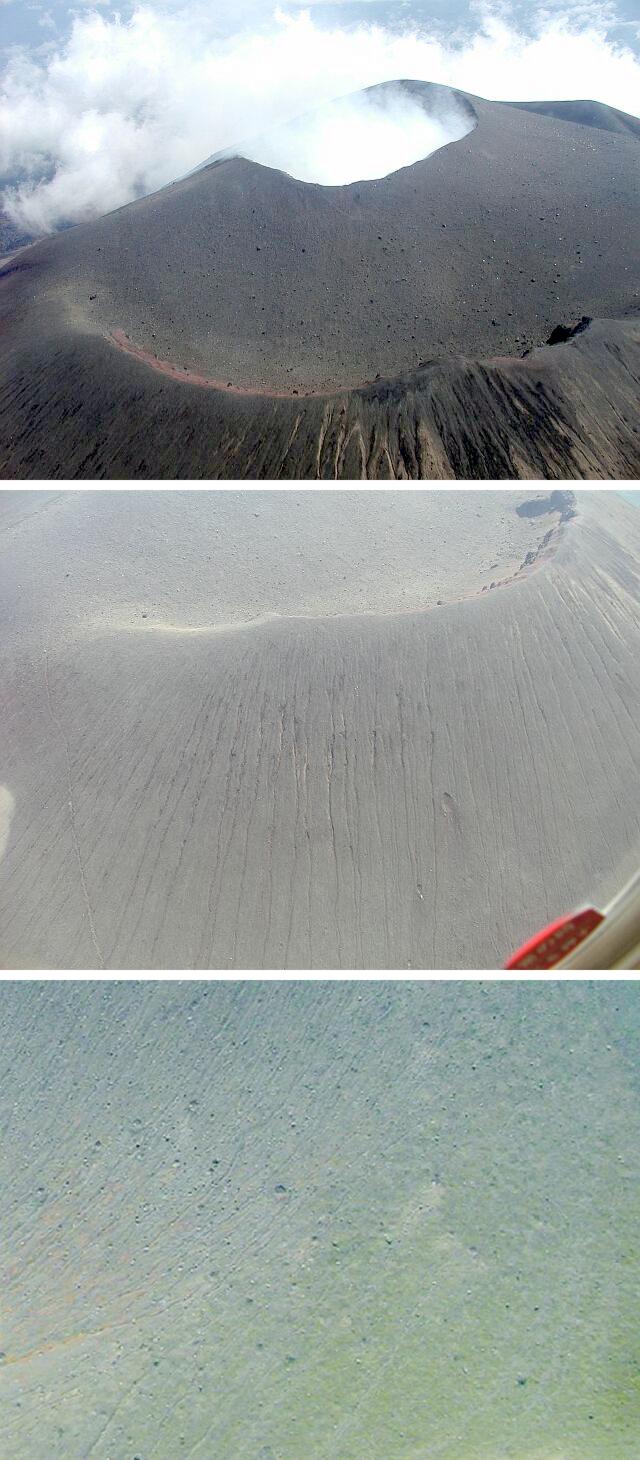 |
Figure 18. The Asama summit crater as seen in a series of shots taken from a helicopter two days after the 1 September 2004 eruption: (top) The main crater engulfed in white fumes with a thin plume blowing NE; (center) a closer view of the outer W flank and adjacent moat area, ~1 km from the crater; (bottom) a still closer view depicting a conspicuously cratered surface on the summit's NW flank. The center photo also shows two big craters in the center right; a trail following the outer crater rim is largely tephra covered but segments remain recognizable. Courtesy of the Geological Survey of Japan (captions and photos by H. Hoshizumi, GSJ). |
Tephra sampling and distribution. Strong winds blew the eruption cloud NE. Ashfall occurred ~250 km from the volcano and reached to the Pacific Ocean (with ash reported at the coastal locations of Soma and Haranomachi cities in Fukushima Prefecture). The ash-fall deposit covered a narrow and elongated area, forming a classic cigar-shaped pattern. Field work was begun to establish the mass and distribution of the tephra blanket (figure 19). The Earthquake Research Institute (ERI) noted that 5-cm-diameter cinders appeared up to ~5 km from the crater. In some cases rainfall occurred during or after the ashfall; in some cases it washed away fine-grained portions of the ash-fall deposit. In preliminary ERI and Geological Survey of Japan (GSJ) reports and personal communication, workers calculated tentative estimates of eruptive products on the order of 40,000-230,000 metric tons. The initial estimate by Hayakawa was 200,000 metric tons.
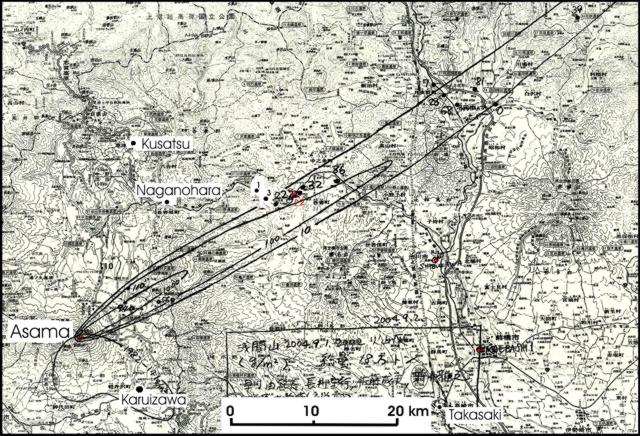 |
Figure 19. One preliminary (working) map of Asama's 1 September 2004 tephra mass (out to ~70 km from the source) showing data points used to constrain the isomass contours (in units of grams per meter squared). For comparison, one S- to SE-directed isomass contour (141 g/m2) was also included from a 1982 eruption. The base map is in Japanese but English names have been added to selected urban areas. Courtesy of Yukio Hayakawa, Gunma University. |
Geophysical and geochemical observations. Investigators at ERI Tokyo plotted the time-series of deformation recorded by four 3-component GPS stations within a few kilometers of the summit over January to early September 2004. Of these, only one station, ASM4, ~4 km S of the summit, showed any clear and consistent variation. Its changes were only clear in one component: it moved to the S on the order of 5-10 mm, motion that became most apparent after June 2004 (figure 20). Other groups also maintained GPS (and tilt?) stations on Asama and may have seen more diagnostic ground displacement associated with the eruption.
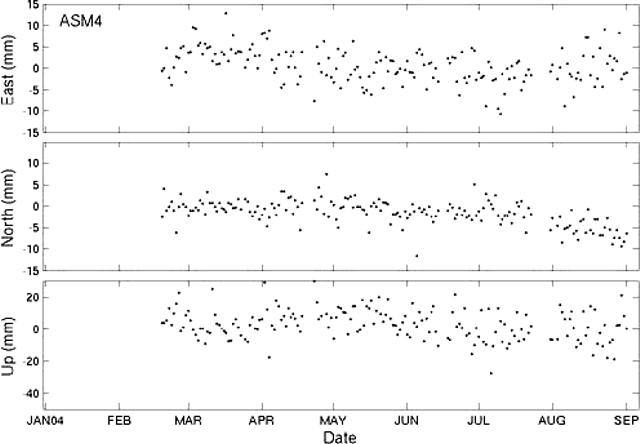 |
Figure 20. Time-series deformation of Asama recorded at GPS station ASM4, January-September 2004. The three orthogonal components are shown as follows: Upper row is in the E-W direction, middle row is in the N-S direction, and bottom row is in the up-down direction. The GPS reference frame was ITRF2000. These data were posted on the web on 6 September 2004 by the Volcano Research Center, University of Tokyo. |
ERI briefly discussed seismic signals received at the station for Asama, which arrived at about 2002 on 1 September 2004. The first extensive seismic signal was of elevated amplitude and persisted for about a minute. Another plot suggested that the entire set of 1 September eruptive signals spanned about 30 minutes. SO2 measurements used the differential optical absorption spectrometer (DOAS) technique. Ground-based traverses on 3 September measured an average of 1,475 metric tons/day, with respective measured lows and highs of 1,168 and 1,738 tons/day.
Satellite data. The TOMS Volcanic Emissions Group used the Atmospheric Infrared Sounder (AIRS) to detect emissions from Asama's 1 September eruption. AIRS is a hyperspectral imager on the EOS/Aqua satellite. It provides higher spatial resolution than TOMS, and as an infrared sensor it produces nighttime images of volcanic clouds. AIRS volcanic cloud studies are a collaborative effort between the TOMS group and the Atmospheric Spectroscopy Laboratory in the Department of Physics at UMBC.
A sub-circular cloud was associated with the eruption on 1 September (figure 21). When detected at 1554 UTC the cloud was well out over the Pacific Ocean, ~640 km from Asama. Travel time for the cloud was 4 hours and 52 minutes, which implies a (straight line) mean velocity for the cloud's center of ~130 km/hour. Even though there was no quantitative estimate of aerosol and gas, there was a strong volcanic signal. The AIRS image is presented as a bias difference (in Kelvin, K; the scale at the right). The larger the bias difference, the stronger the volcanic signal. In this case, a significant area reached a difference of over 10 K.
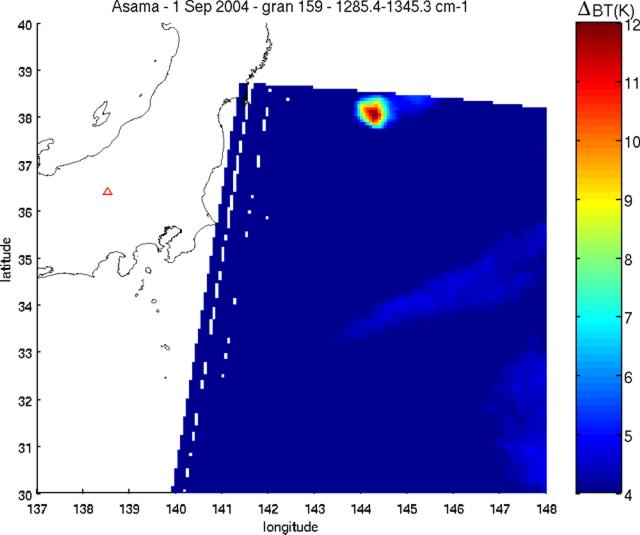 |
Figure 21. Asama's 1 September 2004 eruption generated a cloud that persisted and was imaged ~640 km ENE. The local time of this image was 0054 on 2 September (1554 UTC 1 September). Courtesy of Simon Carn and L. Larrabee Strow, UMBC. |
Information Contacts: Geological Survey of Japan, National Institute of Advanced Industrial Science and Technology (GSJ AIST) (URL: http://www.aist.go.jp/); Yukio Hayakawa, Faculty of Education, Gunma University, Aramaki 4-2, Maebashi Gunma 371-8510, Japan (URL: http://www.hayakawayukio.jp/English.html); Setsuya Nakada, Volcano Research Center, Earthquake Research Institute (ERI), University of Tokyo, Yayoi 1-1-1, Bunkyo-ku, Tokyo 113, Japan (URL: http://www.eri.u-tokyo.ac.jp/VRC/index_E.html); Simon Carn, TOMS Volcanic Emissions Group, University of Maryland, 1000 Hilltop Circle, Baltimore, MD 21250, USA (URL: https://so2.gsfc.nasa.gov/); L. Larrabee Strow, Atmospheric Spectroscopy Laboratory, Physics Department, 1000 Hilltop Circle, Baltimore, MD 21250, USA (URL: http://asl.umbc.edu/).
Pumice and lithic samples from September eruption chemically similar to older lavas
An explosive eruption occurred from the summit crater of Asama at 2002 on 1 September 2004 (BGVN 29:08). Most of the initial reporting was in Japanese, although many of those reports had segments in English. Setsuya Nakada and Yukio Hayakawa provided links to initially available reports. In initial assessments of the eruption, investigators identified several distinct suites of ejecta, including darker- and lighter-colored groups. The ERI report also discussed a breadcrust bomb sampled at Kromamegawara 3.5 km NE of Asama's crater, which contained a vitric outer film and vesicular interior. ERI compiled some initial major element compositions on the of products of the 1 September eruption, including those taken on both fresh pumices (bombs) and lithics. Both types of materials were chemically close to lavas erupted in the years 1783, 1973, and 1108.
Information Contacts: Geological Survey of Japan, National Institute of Advanced Industrial Science and Technology (GSJ AIST) (URL: http://www.aist.go.jp/); Yukio Hayakawa, Faculty of Education, Gunma University, Aramaki 4-2, Maebashi Gunma 371-8510, Japan (URL: http://www.hayakawayukio.jp/English.html); Setsuya Nakada, Volcano Research Center, Earthquake Research Institute (ERI), University of Tokyo, Yayoi 1-1-1, Bunkyo-ku, Tokyo 113, Japan (URL: http://www.eri.u-tokyo.ac.jp/VRC/index_E.html).
1 September 2004 eruption followed by others at least as late as 14 November
At 2020 on 1 September 2004, an explosive eruption occurred from the summit crater of Asama (BGVN 29:08 and 29:10). As previously reported, the resulting eruption cloud drifted NE, and ash fell ~250 km away. A Reuters news report stated that this was its biggest eruption in 21 years (since April 1983). A distinct plume was still discharging on 3 September, when Asia Air Surveys took a vertical aerial photograph (figures 22 and 23).
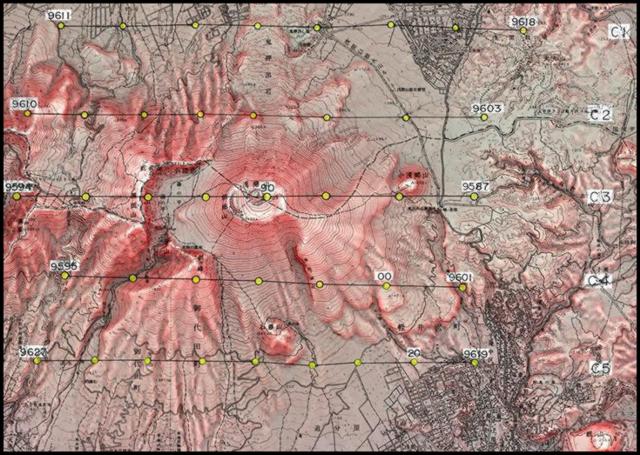 |
Figure 22. Topographic map showing the flight lines and locations of aerial photos at Asama volcano (N is towards the top), 3 September 2004. Courtesy of Asia Air Survey Co., Ltd. |
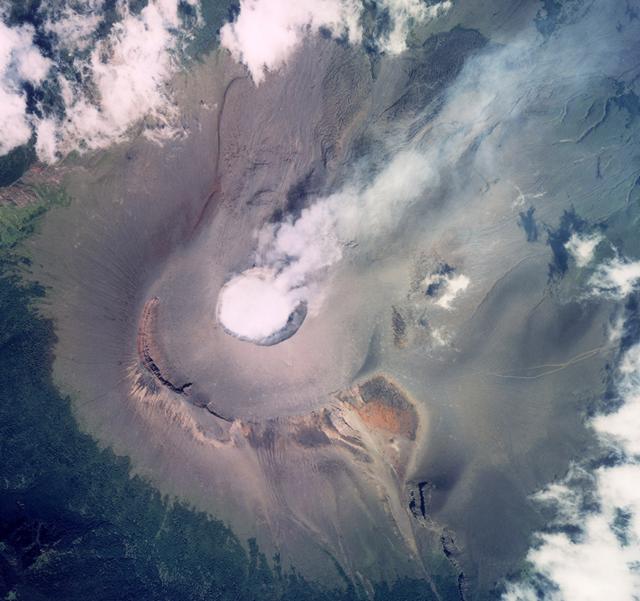 |
Figure 23. Aerial photo of Asama taken on 3 September 2004; the shot was taken at the point labeled "90" on line C3 on figure 22, in effect, from a point slightly E of the summit crater. Copyrighted photo is used here with permission of Asia Air Survey Co., Ltd. (their photo number C3-9590). |
Setsuya Nakada and Yukio Hayakawa informed Bulletin editors of Asama's eruptions by preparing reports and outlines in English, or explaining the significance of several kinds of data that were not otherwise accessible in English. Investigators plan to present data on Asama's 2004 eruptions at upcoming conferences, including The Joint Geoscience Meeting, to be held in May 2005 at Makuhari, Chiba (Japan).
A small eruption around 1530 on 14 September (figure 24) produced an ash plume that rose 1-2.5 km above the volcano. A smaller eruption earlier that day around 0328 produced a plume that rose ~300 m. A small amount of ash fell in Takasaki, ~45 km from the volcano.
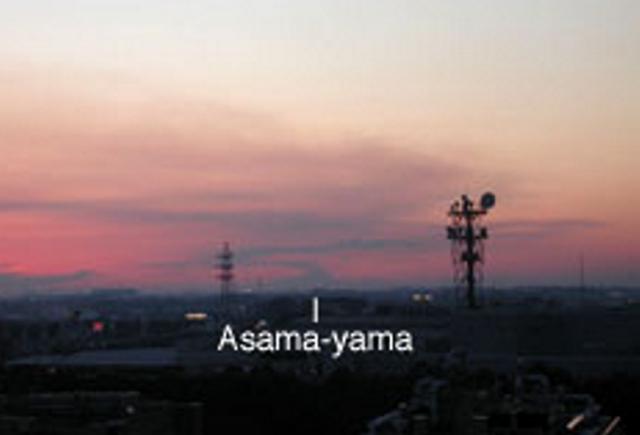 |
Figure 24. A drifting eruption cloud emitted at Asama, as seen from the Geological Society of Japan office building in Tsukuba, ~150 km E of the volcano. Taken at 1751 on 14 September. Courtesy of A. Tomiya, GSJ. |
Asama erupted almost continuously for a third straight day on 16 September (figure 25), associated with more than 1,000 earthquakes. Incandescent fragments were ejected ~300 m from the summit and ash columns rose ~1,200 m above the crater. Late that night, winds carried ash as far as central Tokyo, ~140 km SE. The frequency of the eruptions appeared to have tapered off by the afternoon of the 17th. Television footage at that time showed gray smoke mixed with ash billowing over the mountain. Minor ash eruptions occurred intermittently until 2103 on 18 September; ash clouds drifted E. Ashfall covered the southern part of the Kanto area, more than 150 km from the volcano.
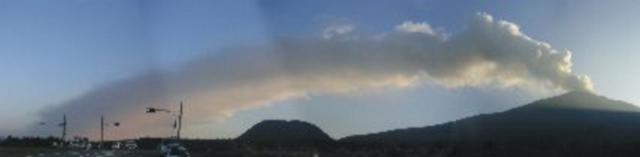 |
Figure 25. A panoramic photograph of Asama taken 16 September 2004 looking from Asama's NE flank. Courtesy of Michiko Owada, GSJ. |
By 18 September, the Japan Meteorological Agency (JMA) was reporting that ash plumes were still rising ~1,200 m, but only about 23 small eruptions and nearly 140 tremors had been recorded that afternoon, a significant change from the nearly continuous activity of the previous few days. The hazard status remained at 3 on a scale of 5, suggesting more small-to-medium eruptions might occur.
An analysis of crater morphology based on airborne radar conducted on 16 September confirmed a new lava dome there. According to JMA and the Geographical Survey Institute this was the first dome since 1973. Mid-September radar images showed the growth of a broad (pancake-shaped) layered form reaching several dozen meters high with a radius of ~100 m in the NE part of the crater; its volume was ~500,000 m3. Compelling images showcasing the side-looking airborne (SAR) radar method and depicting the dome can be seen on the GSI website (but as of early 2005 almost all the text remained in Japanese).
A moderate explosive eruption occurred at 1944 on 23 September. Small amounts of ash and lapilli were deposited NE of Asama.
Many (not all) parts of the world now have Volcanic Ash Advisory Centers (VAACs) devoted to helping aviators avoid volcanic ash. They operate through agencies closely associated with aviation meteorology. The Tokyo VAAC website presents a diagram showing some fundamental linkages in its information management networks (figure 26). The diagram is only intended to provide an introductory overview (e.g., it is not comprehensive, and it may be outdated); however, it should make the role of the Tokyo VAAC in the Asama eruption more tangible to many in the volcano-monitoring community.
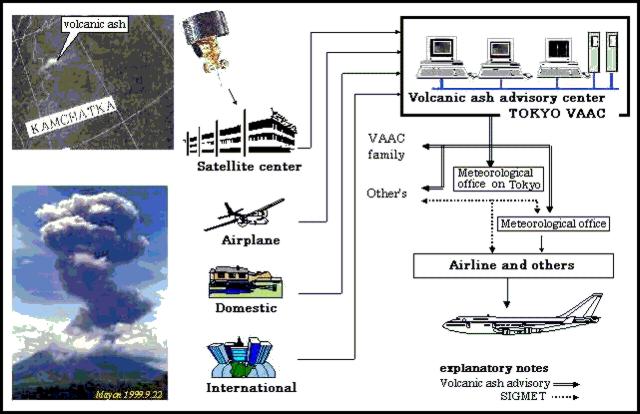 |
Figure 26. A schematic showing some paths of information flow into and out of the Tokyo VAAC. The real communication patterns are considerably more complex and involve other communication links, such as those of the air carrier, between its aircraft to its own offices, and those directly between local observatories and meteorological offices. Inputs from people monitoring a volcano pass through a system with different conventions and procedures. Modified from a diagram on the Tokyo VAAC website. |
Volcano-monitoring input can pass to the VAAC via the paths labeled Domestic (in this case, Japan) and International (including the Kamchatkhan Volcanic Eruptions Response Team, the Philippine Institute of Volcanology and Seismology, the Alaska Volcano Observatory, and adjacent VAACs of Washington, Anchorage, and Darwin). In some examples of the latter communications, one VAAC may alert others that an ash plume may soon extend beyond the boundary of VAAC's area of responsibility. Sources of incoming data include that from satellites and from aircraft. The latter includes both PIREPS, pilot reports, and AIREPs, air reports routed via airlines. The VAAC prepares output to aviators that includes both Volcanic Ash Advisories and SIGMETS. The latter, SIGnificant METeorological messages contain information about hazardous phenomena, including weather, severe icing, turbulence, or volcanic ash that, in the judgment of the forecaster, are hazardous to aviation). The system continues to undergo refinement and exists under the auspices of the International Civil Aviation Organization (ICAO).
Tokyo VAAC reported that eruptions during 23-25 September produced plumes, in some cases to unknown heights; and in one case to "FL 170" (aviation shorthand for 17,000 feet; ~5 km altitude; figure 27). In addition, minor ash eruptions occurred twice on 1 October. Afterwards a helicopter flight provided by the Nagano police (Shinshu) was carried out under conditions of clear sky with southerly winds, enabling observers to watch Asama's summit area during the hours of 0930-1100. They saw relatively weak emissions drifting N. A new vent, ~70 m in diameter and ~40 m in depth lay within the summit (Kamayama) crater. This was in accord with what had been observed on 16 and 17 September by radar (SAR image of GSI) and also photographed by the press (Eg., Yomiuri Shimbun). From the eastern rim of the vent a crack of incandescence was observed, from which a jet of volcanic gas issued intermittently. Using an infrared camera, the highest temperature JMA measured was 517°C.
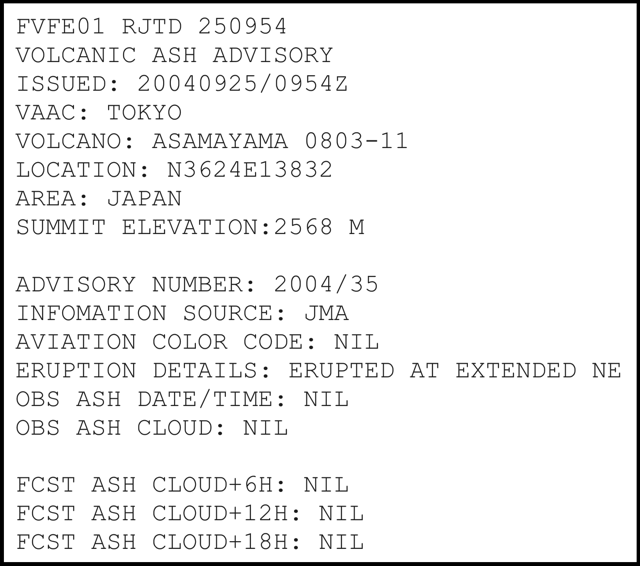 |
Figure 27. A Volcanic Ash Advisory issued by Tokyo VAAC describing a 25 September 2004 eruption at Asama that sent ash to ~5 km altitude (FL 170). Advisories such as this are the messages received on the flight deck of potentially affected aircraft and by the air carriers' dispatchers. Courtesy of the Tokyo VAAC. |
A minor explosive eruption occurred at 2310 on 10 October. Small amounts of ash and lapilli were deposited NNE of the volcano. The Tokyo VAAC reported this eruption produced a plume to an unknown height.
The Tokyo VAAC reported an eruption on 16 October at 1206; it discharged a SE-drifting ash cloud higher than 3.4 km altitude. On 18 October at 1017, a N-drifting plume rose to ~3.4 km altitude.
Asama erupted with a loud explosion on 14 November at 2059. JMA rated the eruption as mid-sized, 3 on a scale of 5, in terms of power of the explosion. The agency issued a warning of falling ash downwind of the volcano, although no ash plume was observed due to cloudy weather conditions. Following the explosion observers did see falling rocks over a large area on the volcano's slopes. There were no immediate reports of injuries or damage. Ash and lapilli were deposited E of Asama and ash-fall covered the N part of the Kanto area, reaching more than 100 km.
Other tilt, GPS, seismic, and gravity data. A tilt anomaly was observed and announced by JMA on 22 February, but no eruption occurred. That inflation took place over about 3 months, beginning 14 November 2004. The series of eruptions in September 2004 was preceded by earthquake swarms and shorter-term tilt changes. The respective anomalies became significant a few days to half a day before the explosive events. Tiltmeters of JMA and ERI are located ~3 km N and ~4 km E of the summit crater. The former are more sensitive than the latter, probably due to Asama's inferred E- to W-trending (dike-shaped) magma body. The inflationary tilt measured 3 km N of the summit crater was as small as 10-6 radians. The smaller tilt episodes remained below the detection threshold for the GPS network surrounding the volcano.
Preceding the Vulcanian explosions on 1, 23, and 29 September, observers noticed frequent B-type earthquakes. They also documented small inflations of the summit area. These inflations occurred about half day to one day before the explosions. On the other hand, the explosive events during 16-17 September followed deflation in the wake of a three-day inflation (10-13 September).
S. Okubo conducted continuous gravity measurements at the Asama Volcano Observatory (AVO) of ERI. Various explosive events of September reportedly occurred a few days after gravity shifted from an increase to a decrease. AVO's gravity station sits at 1,400 m elevation about 4 km E of the summit. Okubo proposed that the gravity changes reflected movement of magma within the conduit. Gravity decreased when the magma head rose above the observation level.
Information Contacts: Yukio Hayakawa, Faculty of Education, Gunma University, Aramaki 4-2, Maebashi Gunma 371-8510, Japan (URL: http://www.hayakawayukio.jp/English.html); Setsuya Nakada, Volcano Research Center, Earthquake Research Institute (ERI), University of Tokyo, Yayoi 1-1-1, Bunkyo-ku, Tokyo 113, Japan (URL: http://www.eri.u-tokyo.ac.jp/VRC/index_E.html); Geological Survey of Japan (GSJ), National Institute of Advanced Industrial Science and Technology (GSJ AIST) (URL: https://www.gsj.jp/); Asia Air Survey Co., Ltd. (URL: http://www.ajiko.co.jp/); Geographical Survey Institute (radar and other methods), Ministry of Land, Infrastructure and Transport, Japan (URL: http://www.gsi.go.jp/); Japan Meteorological Agency (JMA), Volcanological Division, Seismological and Volcanological Department, 1-3-4 Ote-machi, Chiyoda-ku, Tokyo 100-8122; Tokyo Volcanic Ash Advisory Center, Tokyo Aviation Weather Service Center, Haneda Airport 3-3-1, Ota-ku, Tokyo 144-0041, Japan (URL: https://ds.data.jma.go.jp/svd/vaac/data/); International Civil Aviation Organization (ICAO), 999 University Street, Montreal, Quebec H3C 5H7, Canada (URL: http://www.icao.int/); Reuters.
Maps of 2004 tephra deposits; radar images of the crater's interior and a dome
Setsuya Nakada and Yukio Hayakawa provided follow-up information on events at Asama since our last report (BGVN 30:01). Asama's largest recent explosion occurred on 1 September 2004, and the second largest, on 14 November 2004. Subsequent eruptions have been absent except for a small one in early December 2004.
The eruption that started on 1 September 2004 was characterized by an increase in the number of A-type earthquakes occurring during and after the main phase of explosions (based on data collected by the University of Tokyo's Earthquake Research Institute (ERI) and the Japan Meteorological Agency). Deep seismicity peaked at the end of 2004, but had subsequently remained moderate. GPS (global positioning system) instruments maintained ERI and the Geographical Survey Institute (GSI) disclosed inflation of the edifice. This inflationary trend has continued since mid-October 2004.
ERI undertook detailed analysis of earthquake hypocenters and the pressure source for the observed GPS data. This showed the existence of a dike-shaped magma reservoir trending WNW-ESE. The reservoir occurred just W of the summit and 1-2 km below sea level.
Around October 2004 the height of the lava filling the summit crater reached a maximum. Around that time the dome attained a height just ~70 m below the crater's lowest notch (an opening along the N rim). By the end of January 2005, in contrast, the center of the lava pool had deepened, possibly due to draining of the lava body back into the conduit.
A sequence of radar images provided glimpses into changeable features inside the steamy crater. Two images appear here, from 16 September and 15 December 2004 (figures 28 and 29). The former shows a flat-looking disk-shaped extrusion in the crater. The latter shows that the earlier extrusion had by this time become disrupted or perhaps buried.
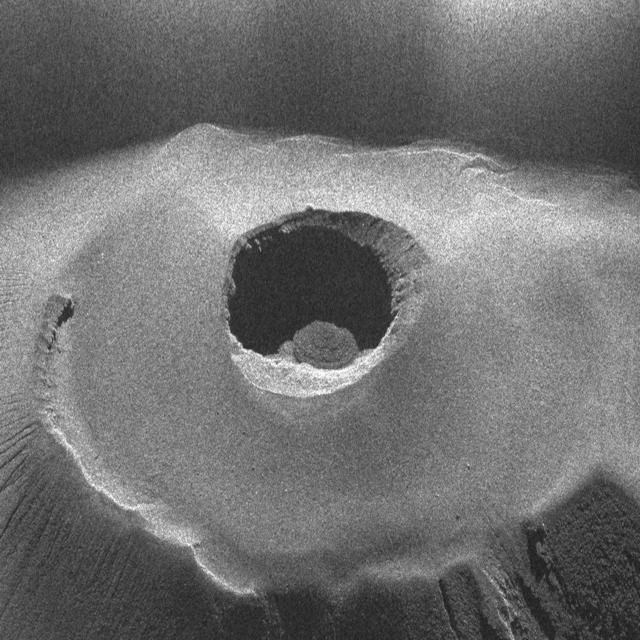 |
Figure 28. Radar image of Asama's summit crater taken from a Cessna airplane on 16 September 2004 by the Geographical Survey Institute, Japan. N is up. Radiated microwaves were transmitted from the N, at 4,290 m altitude, 2 km from the crater, with the off-nadir angle of 55 degrees. Courtesy of the Geographical Survey Institute. |
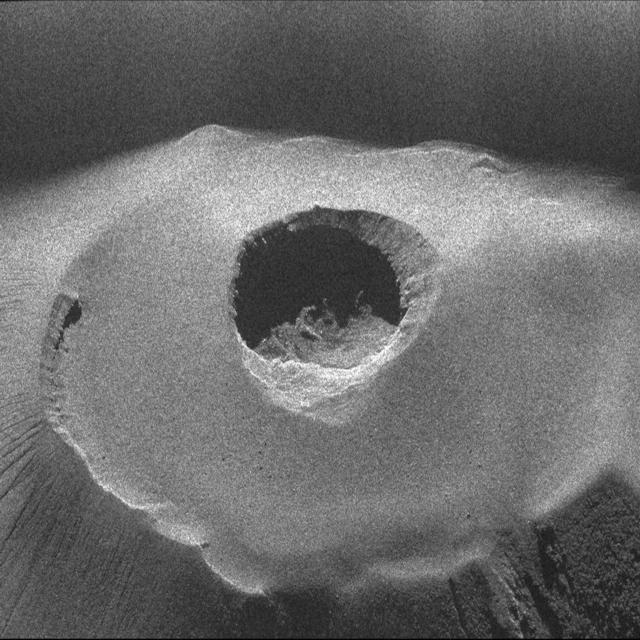 |
Figure 29. Radar image of Asama's summit crater taken from a Cessna on 15 December 2004 by the Geographical Survey Institute, Japan. N is up. Radiated microwaves were transmitted from the N, 2 km from the crater, with the off-nadir angle of 55 degrees. Courtesy of Geographical Survey Institute. |
Strong glowing at the summit was considered to be due to significant degassing after the main explosive phase. SO2 flux peaked around October (at ~5,000 metric tons a day) and has continued at a relatively high level, as much as 2,000 to 3,000 metric tons a day.
The eruptions emitted andesite (SiO2 ~61%), with high crystallinity, and containing partially melted sedimentary and other rock (felsic tuff?). The rock chemistry has remained uniform throughout the eruptions of the past several thousand years, though the inclusion of melted sedimentary rock was absent in products erupted prior to 2004.
Yukio Hayakawa provided a composite isomass map of 2004 Asama tephra deposits (figure 30). By far the largest deposit of the year erupted on 1 September. The smallest documented deposit occurred on 10 October. Ash deposits from activity on 1 September drifted NE, deposits from 16 September drifted SSE; 23 September, NNE; 29 September, N; 10 October, NE; and 14 November, E.
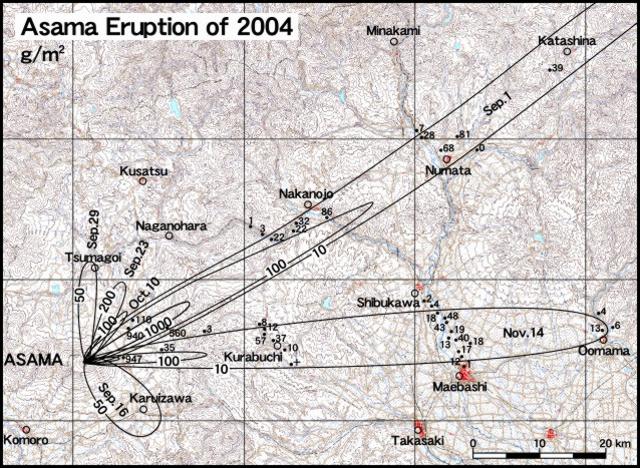 |
Figure 30. Isomass map of 2004 Asama tephra deposits erupted during September-November 2004. Open circles indicate cities; dots indicate sampling points where g/m2 of ash were measured; contours are in the same units. Courtesy Yukio Hayakawa. |
Information Contacts: Setsuya Nakada, Volcano Research Center, Earthquake Research Institute (ERI), University of Tokyo, Yayoi 1-1-1, Bunkyo-ku, Tokyo 113, Japan (URL: http://www.eri.u-tokyo.ac.jp/VRC/index_E.html); Yukio Hayakawa, Faculty of Education, Gunma University, Aramaki 4-2, Maebashi Gunma 371-8510, Japan (URL: http://www.hayakawayukio.jp/English.html); Geographical Survey Institute, Ministry of Land, Infrastructure and Transport, 1, Kitasato, Tsukuba-shi, Ibaraki-ken 305-0811 Japan (URL: http://www.gsi.go.jp, with radar data (text in Japanese): http://www.gsi.go.jp/BOUSAI/ASAMA/); Japan Meteorological Agency, Otemachi, 1-3-4, Chiyoda-ku Tokyo 100-8122, Japan (URL: http://www.jma.go.jp/).
Small eruptions in August 2008, the first since 2004
Seismicity on 8 August 2008 prompted JMA (Japan Meteorological Agency) to raise the alert level from 1 to 2. Three small eruptions followed in the next few days.
On 10 August, Asama erupted at 0237 and emitted an ash cloud that rose ~400 m above the crater and drifted SE. A second eruption occurred on 11 August. An ash plume rose ~200 m above the crater rim and drifted S. The Tokyo Volcanic Ash Advisory Center reported that the 10 and 11 August eruption plumes extended to an altitude of 3 km and drifted SE and S, respectively.
On 12 August, scientists from ERI climbed to the summit and collected ash samples at the SW rim of the crater. The thickness was less than 5 cm. Under the microscope the ash contains about 10% black or dark brown glass.
The third eruption occurred on 14 August at 0759; the ash plume rose to ~400 m above the crater rim. The Tokyo VAAC again reported that plumes extended to an altitude of 3 km and drifted S.
According to Keisuke Kanda, an official observer in a hut ~2 km from the summit, no explosive sounds were heard there during the three eruptions. The hut is maintained by Komoro City for hikers. Kanda, a city worker, stays at the hut almost 365 days a year.
A red glow on the summit crater was occasionally observed by web-cameras during the night. These events did not trigger MODVOLC thermal alerts.
Information Contacts: Japan Meteorological Agency (JMA), Otemachi, 1-3-4, Chiyoda-ku Tokyo 100-8122, Japan (URL: http://www.jma.go.jp/); Volcano Research Center, Earthquake Research Institute (ERI), University of Tokyo, Yayoi 1-1-1, Bunkyo-ku, Tokyo 113, Japan (URL: http://www.eri.u-tokyo.ac.jp/topics/ASAMA2004/index-e.html).
Late January 2009 eruption; another on 2 February with significant ashfall
Asama (figure 31) erupted in January and February 2009. Following three small eruptions in August 2008 (BGVN 33:08), glow was frequently reflected by steam over the summit crater. High seismicity began suddenly on 1 January 2009 and prevailed through that month (figure 32). By 21 January 2009 scientists from the Japan Meteorological Agency (JMA) had discovered a thin ash layer covering the NW rim of Asama's summit crater (figure 33).
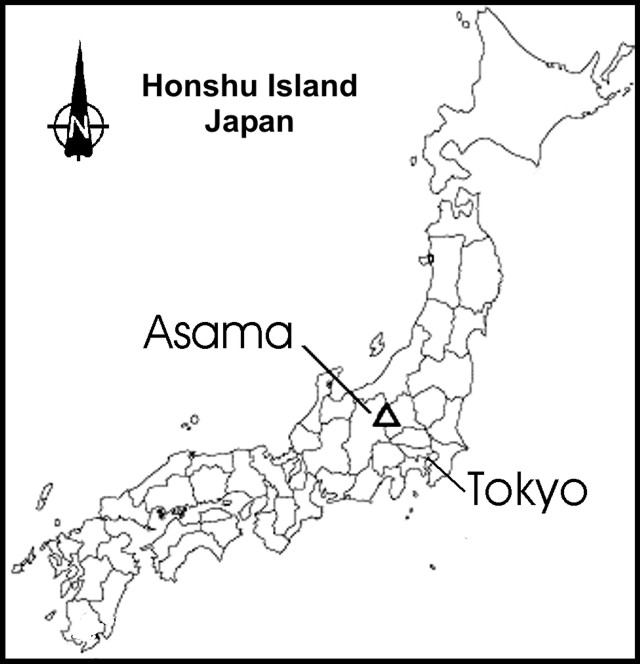 |
Figure 31. A sketch map centered on Honshu Island (Japan) indicating the location of Asama. The volcano sits 140 km NW of Tokyo. Courtesy of Japan Meteorological Agency (JMA). |
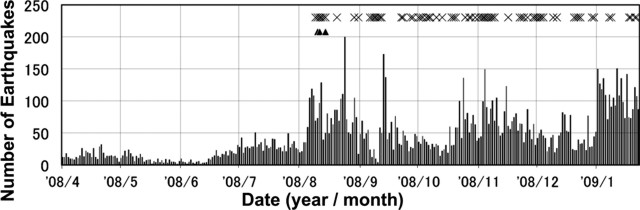 |
Figure 32. Plot of daily earthquakes registered at Asama during April 2008 through January 2009. At the top of the plot, the triangles indicate times of both earthquake and recognized eruption during the August 2008 eruptive episode; the Xs indicate times of visible glow (common during August 2008 and often visible thereafter). Courtesy of JMA. |
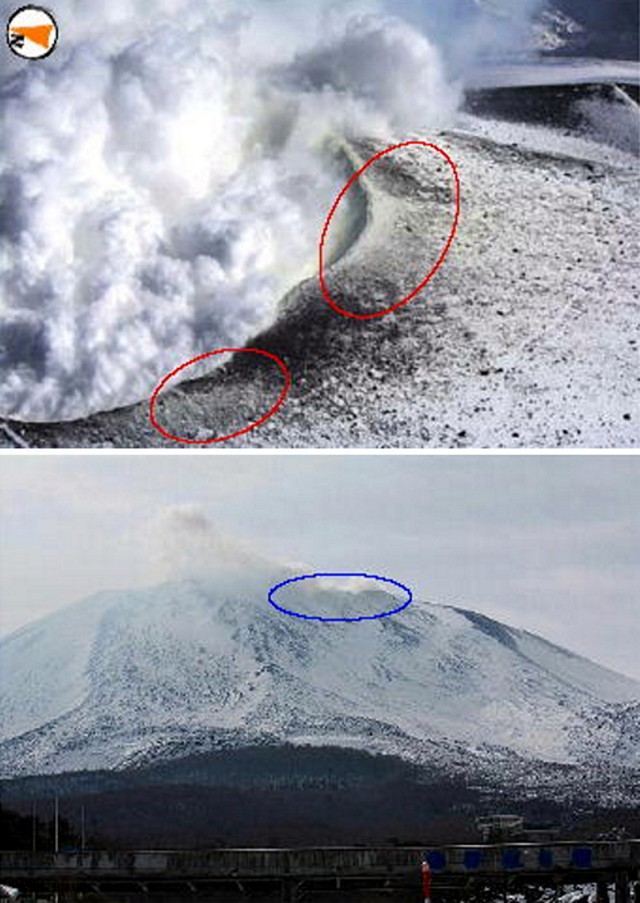 |
Figure 33. Two photos of Asama's steaming summit taken on 16 January (top, looking down on the crater's NW rim) and 21 January 2009 (bottom, viewed from the S). Dark material on 16 January was interpreted as older, perhaps in part from the 2004 eruption; circled areas indicate zones continaing yellow (sulfurous) sublimate. Circled areas on the 21 January photo indicate zones where thin ashfall was noted. Courtesy of JMA. |
The highest SO2 flux in recent years, over 5,000 metric tons/day, was recorded on 15 January 2009 (figure 34). JMA also noted minor crustal deformation.
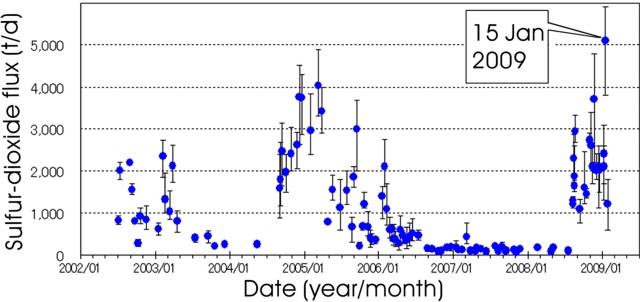 |
Figure 34. A plot of SO2 flux emitted from Asama between January 2002 and January 2009. Error bars indicate the high and low values of 5-7 measurements. Courtesy of JMA. |
Yukio Hayakawa visited Maebashi (a town ~50 km E of the summit) during January 2009. Local people told him that they felt the intensity of Asama's recent plumes had been high, more vigorous than in 2004 (BGVN 29:08).
An Associated Press story issued 2 February 2009 contained a video of Asama's ash- and bomb-peppered summit, with the crater emitting billowing white plumes. At night enormous red areas above the summit suggested the sudden ejection of molten material. That news report stated that JMA had seen an eruption in the early hours of 2 February. They said that some ash fell on parts of Tokyo. Later reports will present more details on that and later eruptions.
Information Contacts: Japan Meteorological Agency (JMA), Otemachi, 1-3-4, Chiyoda-ku, Tokyo 100-8122, Japan (URL: http://www.jma.go.jp/); Volcano Research Center, Earthquake Research Institute (ERI), University of Tokyo, Yayoi 1-1-1, Bunkyo-ku, Tokyo 113, Japan (URL: http://www.eri.u-tokyo.ac.jp/topics/ASAMA2004/index-e.html); Yukio Hayakawa, Gunma University, Faculty of Education, Aramaki 4-2, Maebashi 371-8510, Japan; Associated Press (URL: http://www.ap.org/).
The forecasted, 2 February 2009 eruption and waning eruptions into May
As we previously reported (BGVN33:12), Asama erupted in January and February 2009. As reported there, scientists noted that sulfur-dioxide fluxes suddenly rose during late 2008 from more than two years of very low values, that yellow sublimates subsequently appeared, and that thin ash fell on the rim of the summit crater by 21 January. Our statement that high seismicity began 1 January 2009 is clarified in this report, where we present long-baseline seismic data. A larger eruption followed on 2 February, reaching 2 km above the summit and dropping minor ash on parts of Tokyo (~140 km SE of the vent) and beyond.
This report begins with a brief mention of a satellite image from the 2004 eruption, and then continues with descriptions of the 2009 behavior chronicled in a previous report (BGVN33:12). Much of this information has come from the Japan Meteorological Agency (JMA). Translations of those detailed and informative reports from the original Japanese were provided by Yukio Hayakawa.
Satellite image of 2004 activity. An annotated satellite image not included in Bulletin reports on the 2004 eruption (BGVN29:08, 29:10; 30:01; 30:02) has come to light (figure 35). On 16 September 2004, a plume at ~3,700 m altitude (indicated on the figure in aviation parlance as "FL120," flight level 12,000 feet) traveled due S leaving a thin ash deposit.
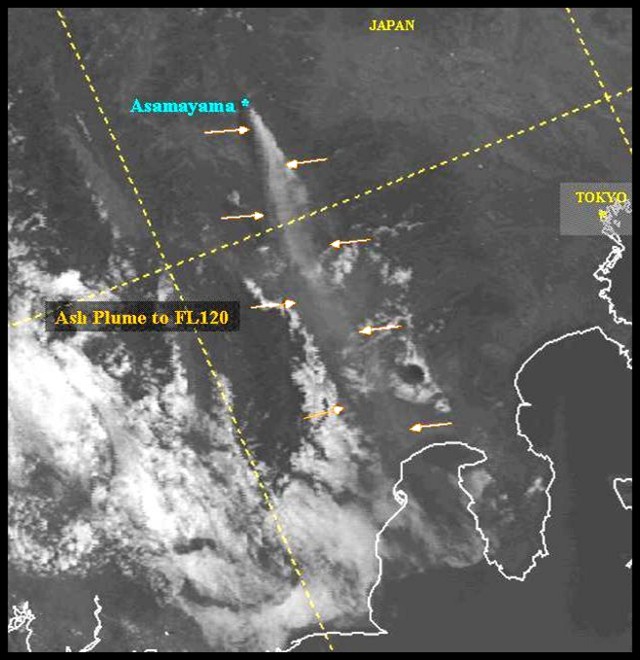 |
Figure 35. An annotated satellite image showing a 2004 Asama ash and steam plume at 0017 UTC on 16 September 2004. Enhanced Defense Meteorological Satellite Program (DMSP) visual imagery. Note dashed lines of latitude and longitude and the outlines of the coast of Honshu Island. This and at least seven other images were prepared by Charles Holliday and staff around that time. Image courtesy of US Air Force Weather Agency (AFWA). |
Multi-year eruptions and seismicity.Seismicity recorded at Asama between June 2002 and February 2009 (figure 36) included a number of different types of signals (figure 37). Eruptions are indicated by arrows of variable length corresponding to very small to medium eruptions as they occurred during 2003, 2004, 2008, and 2009.
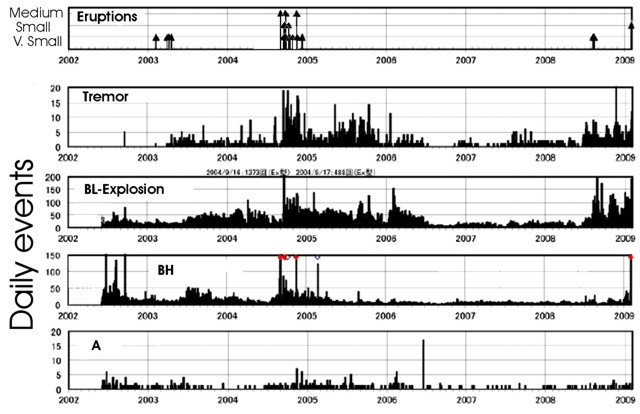 |
Figure 36. Asama eruptions and seismic data recorded from June 2002 through 2 February 2009 depicted in a series of five panels. The top panel shows eruptions (arrows) sorted into the size categories of very small, small, and medium (represented by respective arrow lengths). The second panel down shows the daily number of volcanic tremor events. The third through fifth panels show, respectively, daily numbers of earthquakes of types BL-Explosion, BH, and A. Courtesy of JMA. |
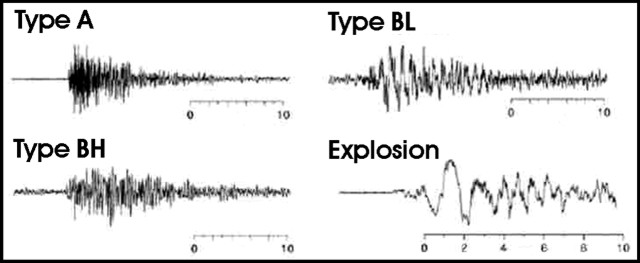 |
Figure 37. Typical seismic signals of four types of earthquakes seen at Asama during June 2002-February 2009. Scales show time in seconds. Courtesy of JMA. |
As brief background, seismic signals at volcanoes are often described using some common terms (Minakami, 1960; McNutt, 2000). Tremor consists of semi-continuous signal with durations of minutes to days or longer. Tremor's dominant frequencies are 1-5 Hz (often 2-3 Hz). Many investigators have concluded that tremor is akin to a series of low-frequency earthquakes occurring every few seconds. Explosion earthquakes accompany explosions and feature compressional, first P-wave arrivals. Some of the explosion energy enters the air where it travels much more slowly than through rocks, propagating as an acoustic wave that may be recorded by microphones or barographs. This air wave also couples back into the ground, allowing detection by a seismometer.
B-type earthquakes sometimes lack clear S waves, generally feature low frequency signals, but may include high-frequency signals as well. The types BL and BH respectively stand for low- and high-frequency (but the two types may also grade from one to the other).
Type A earthquakes are also called tectonic and volcano-tectonic. Their signals display clear P- and S-wave arrivals and are often thought to represent processes such as slip on a fault or breaking rock associated with intrusions.
Prior to the 2009 eruptions, tremor had been somewhat elevated at times during the latter half of 2007 and more consistently during the latter half of 2008. BL-Explosion earthquakes became scarce during late 2006, and from then until about mid-2008 they fluctuated to occasionally somewhat higher daily numbers. After mid-2008, these BL-Explosion earthquakes grew dramatically in number, peaking with the 2009 eruption. This pattern was similar to seismicity associated with the September 2004 eruption.
BH earthquakes generally stood at background after mid-2006 until just before the 2008 eruption. In the middle to latter months of 2008 they again grew, often remaining elevated until the start of 2009, when they increased still further.
Type-A earthquakes remained consistently small in number through 2007 onwards until their numbers peaked suddenly 2 February 2009. They were, however, present on more days approaching the 2009 eruptions.
The 2004, 2008, and 2009 eruptions included conspicuous increases in tremor, BL-Explosion earthquakes, and to some extent, BH earthquakes. Least diagnostic were type-A earthquakes, though they were present on more days with approach to the point of the 2009 eruption.
The predicted 2 February 2009 eruption.Sufficient precursory data were available for JMA to confidently announce the elevation of the hazard status to Level 3 (on a scale where the highest level is 5) at 1300 on 1 February 2009. In discussing the situation at a meeting around that time, a JMA officer said that an eruption similar to that of 2004 would take place within 2 days. Accordingly, authorities closed a vulnerable, 7-km stretch of Oni-oshi highway. It reopened the day after the 2 February eruption.
The volcano is heavily instrumented, and those maintained by JMA's Asamayama observatory are shown on figure 38. Precursory data used as a basis for the forecast included seismicity (figure 36), sulfur-dioxide fluxes (BGVN33:12), and tilt (e.g., figure 39).
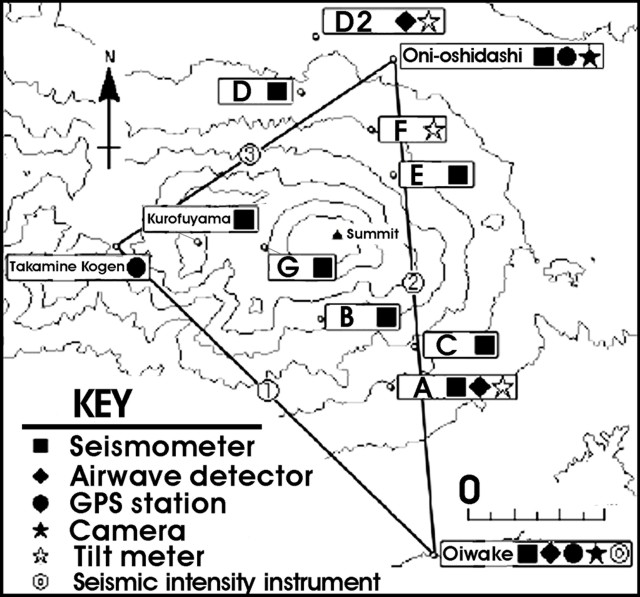 |
Figure 38. A sketch map showing Asama monitoring instrumentation discussed in 2009 JMA reports. Note the stations F, A, and D, points for collecting tilt data presented in figure 39. The contour interval is 200 m. The mountain hut is 0.7 km W of station G. The settlement Oiwake (near map's S edge) is now part of Karuizawa city. The station Oiwake is the site of JMA's Karuizawa weather station. (Oiwake is an ancient settlement located on the route between Kyoto and Edo (Tokyo), a path in use during the Edo period, 4,000-100 years ago). Courtesy of JMA. |
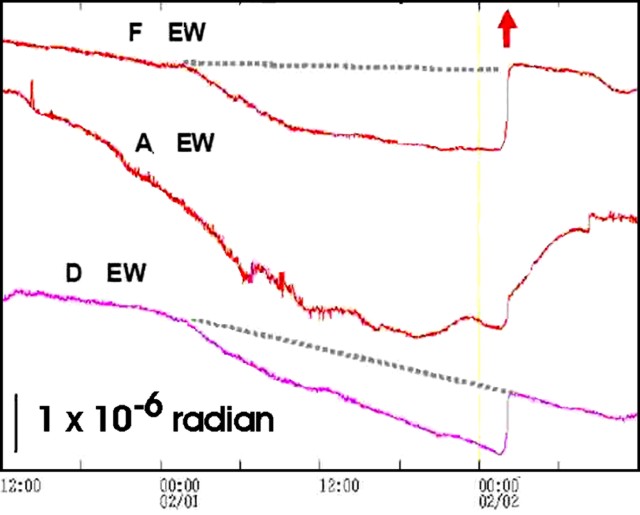 |
Figure 39. Tilt versus time at three Asama stations (F, A, and D) undergoing strong tilt excursions that helped scientists predict the 2 February eruption. The x-axis covers from 1200 on 31 January to 1200 on 2 February; the time of eruption (0151) indicated by heavy arrow at top. Clear tilt excursions (all in the EW direction) started roughly mid-day on 31 January at station A, and early on 1 February at stations F and D. At or shortly after the eruptions tilt excursions rebounded and made sudden shifts back towards their previous trends. Stations D and F returned most directly to their previous trends. With respect to time after the eruption, station A's excursions, though increasingly less extreme, continued for hours. Courtesy of JMA. |
In accord with JMA's precursory warnings, representatives of Komoro City decided to close the mountain hut 2 km W of the summit. The afternoon of 1 February, the resident and official observer there, Keisuke Kanda, readied the hut for closure. After that, he went to bed, planning to climb down the mountain the next morning. At the time of the eruption (0151) he neither felt nor heard any disturbance. At 0200 (about 9 minutes after the eruption began), he was awakened by his ringing cell phone.
The eruption that started at 0151 on 2 February generated a plume that rose to 2,000 m above the summit (to an altitude of ~ 4.6 km). Volcanic bombs were thrown to the N as far as 1 km. An air wave observed at Oiwake, 8 km SSE, had a pressure of 7 Pa. For comparison, the eruption of 1 September 2004 had a recorded air wave of 205 Pa. Cities recording ashfall included Karuizawa, Kamogawa, Tomioka, Chichibu, and in the broader Tokyo metropolitan area, Kawasaki, and Yokohama.
Aviation sources suggested that the 2 February eruption only lasted until 0800 (that is equivalent to 1 February during 1651-2300 UTC). Charles Holliday noted airport weather data. Downtown, at Tokyo International Airport (RJTT), meteorologists reported 'Volcanic Ash Cloud' during 0530-0636 on 2 February. Meteorologists at Narita International airport (RJAA) had one report interval where they noted volcanic cloud, at 1300 local time (~ 3 km altitude with ~ 9 km visibility), but this cloud did not cause local ashfall.
A US Air Force video clip noted that on 2 February ash fell on Yokota Air Base, 105 km SE of Asama. The video said that Yokota received 3-5 mm of ashfall but the features in the field of view appeared to show considerably less, perhaps suggesting some areas of thickened ash deposition. Holliday noted that ash fell at the Base hours after the eruption; although he was unable to establish the exact start time there, ashfall ended at 0800.
During the eruption, Masakatsu Umeda, working in a French restaurant 7 km N of the summit, felt small but continuous shaking and saw a red plume rising from the summit crater. He heard a far softer sound than he did on 1 September 2004 but then he was 4 km NE of the summit at Rokurigahara parking lot.
An 18 February JMA report presented a sequence of night photos capturing incandescent explosions on 2 February at 0200 and for the next 15 minutes (figure 40). These photos portray the eruptive stage often termed the jet- or gas-thrust phase (see diagrams and models on a website by Camp, 2009).
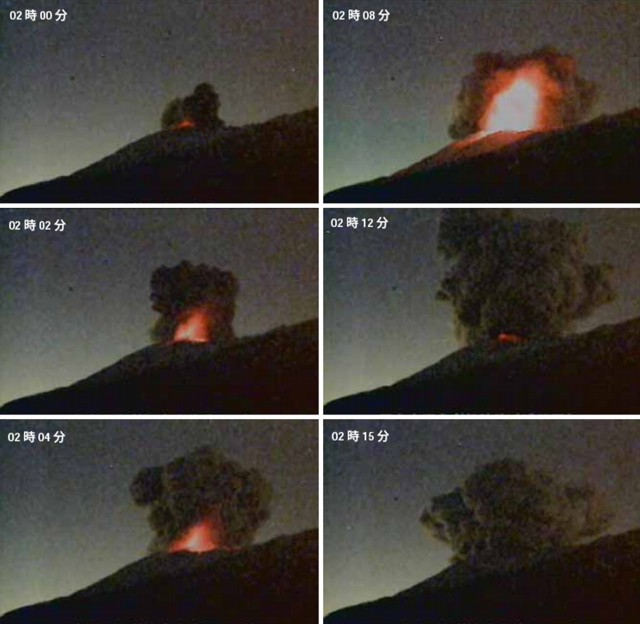 |
Figure 40. Onset of an Asama explosion captured photographically on 2 February 2009, as viewed from ~ 8 km NW at 1400 m elevation. The sequence starts in the upper left and proceeds down the first column and then to the second column (numerical values in each photo's upper left-hand corner represent time stamps; e.g., 02 08 represents 0208 hours). Note the growth of a dark billowing plume in the last two frames (from 0212 and 0215). The camera belongs to Ministry of Land, Infrastructure, Transport, and Tourism. |
Waning eruptions during next few months.A series of small eruptions followed, including those on 9, 10, 11, 16, and 17 February, 15 and 23 March, and at least as late as 2 May. The hazard status, initially raised to 3 on 1 February, dropped to 2 on 7 April.
JMA said that on 9 February at 0746, a plume rose 400 m above the summit; at 1700, a plume was 1,000 m above the summit. A trace of ashfall blew NE, to Kitakaruizawa. As of 0200 on 10 February, the plume height was 600 m above the summit; at 0500, it was 1400 m. As of 2300 on 10 February the plume height was 300 m above the summit. Takayuki Nagai, a teacher at a middle school 12 km N of Asama's summit; said that few students arriving there appeared to recognize that the eruption continued. One had seen a gray ash plume.
As of 2100 on 11 February, the eruption apparently continued, but JMA could not see plumes, probably because of bad weather. The eruption determination was seemingly based on elevated seismicity. The Tokyo Volcanic Ash Advisory Center (VAAC) indicated plumes in the range of 3-3.7 km altitude during 11-12 and 16-17 February. JMA noted an eruption during 1310-1400 on 16 February. A colored plume rose to 400 m above the summit and moved E.
Asama again erupted at 1833 on 17 February. A plume bearing ash rose to 400 m above the summit, and moved to E. Web cameras disclosed crater glow.
The Tokyo VAAC noted a plume to 3 km altitude on 15 March. JMA reported incandescence from the crater on 23 March, and an observer 50 km E at Maebashi saw strong steam plumes on 30 March. Although authorities had lowered the alert level, similar eruptions continued (with plumes to 3.4 km altitude) as late as 2 May. This was the last eruption clearly noted in available reports through the end of May.
2 February eruption's minimum mass.Several detailed maps of the SE-trending, elongate (cigar-shaped) 2009 deposits were compiled in the days after the 2009 eruptions. Such detailed maps (figure 41) enabled scientists to estimate the mass of material that fell on Honshu Island.
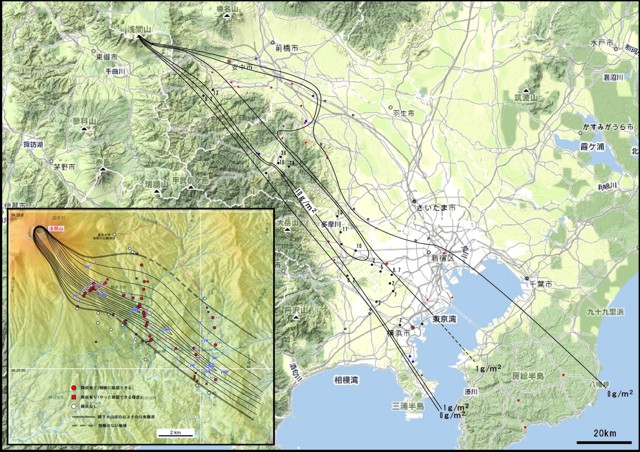 |
Figure 41. Isomass maps compiled from sampling tephra from Asama's 2 February 2009 eruption. Maps show data points and contours for the mass of ash found over S-central Honshu Island and (inset) in the 5-16 km distance range from Asama's summit vent. Data credits: (large map) Geological Survey of Japan (GSJ 18 February 2009 report); (inset) Earthquake Research Institute (ERI), University of Tokyo. |
For the map in the proximal region (inset), traverses were made across portions of the 2009 tephra deposits in early February at approximate distances of 5, 10, and 13 km from the crater. Besides showing points with measurable ash (solid circles), the maps disclose considerable points where the ash was absent or negligible (open circles). The investigators took many measurements at ~ 5 km near the axis of the deposit. Such deposits are often ephemeral, owing to post-depositional processes such as wind and particularly rainfall, which frequently strip the tephra away before detailed measurements.
For the map including the medial to more distal regions (figure 41), trace amounts of Asama tephra extended beyond Tokyo's large bay (Tokyo-wan) to the coastline of the Chiba Peninsula, ~ 220 km SE. Additional fine ash clearly blew beyond the coastline, settling over the adjacent Pacific Ocean. The GSJ estimated the erupted mass falling on Honshu Island at 20,000-30,000 metric tons (20-30 Gg).
Figure 42 illustrates the near-source deposit's mass assessment (for figure 41 inset). This yielded an erupted-mass estimate of about 2.0-2.4 metric tons. Various other maps and solutions for contours exist.
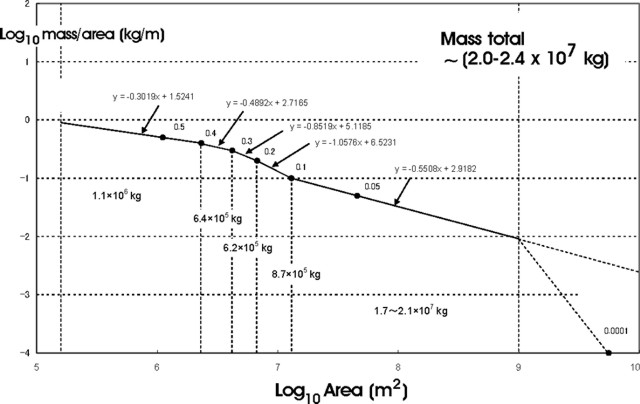 |
Figure 42. A plot summarizing mass data for the tephra blanket associated with the 2 February Asama eruption (the isomass map shown at right in the figure above). This is a plot of log10 [mass per unit area (kg/m2)] versus log10 [area (m2)]. The plot shows mass contributions along various segments. Courtesy of ERI, Univ. of Tokyo. |
Figure 43 presents basic grain-size information on the deposit. The photo shows some of the larger grains found at distance from the vent. The grains consisted largely of pre-existing rocks. Investigators found very few examples of juvenile glass grains (less than 1%). These juvenile grains were rhyolitic to dacitic.
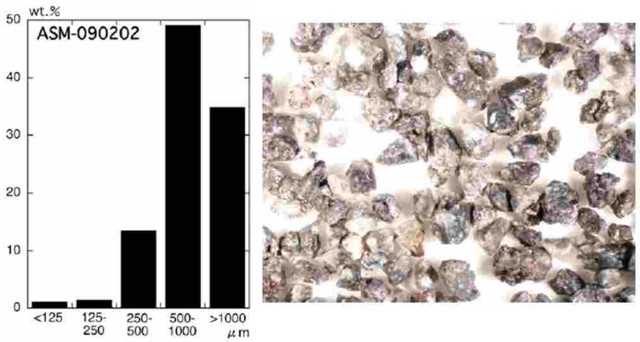 |
Figure 43. (left) Grain size fractions for Asama ash from the 2 February eruption (collection site 8 km SE of Asama). (right) Ash washed and sieved to capture particles above the 1 mm mesh size. The picture is 20 mm wide. Courtesy of ERI, Univ. of Tokyo. |
Few thin ash blankets have been assessed in more detail than the one shown here. The relevance of these efforts include understanding the character and size of the eruption and calibrating ashfall with satellite observations. Volcanic Ash Advisory Centers (VAACs) regularly model eruptions such as this in order to forecast the transport of ash in the atmosphere. This is based in part on the height of ash plumes and on meteorological observations such as wind-velocity profiles. One goal of those ash transport models is to steer aircraft clear of ash in the atmosphere. Volcanic ash plumes can reach higher altitudes than commercial aircraft can fly, and encounters with ash may lead to severe engine damage.
Reference.Camp, V., 2009, Eruption model (online): Department of Geological Sciences, San Diego State University (URL: http://www.geology.sdsu.edu/how_volcanoes_work/).
Minakami, T., 1960. Fundamental research for predicting volcanic eruptions (part 1); Earthquakes and crustal deformations originating from volcanic activities: Bull. Earthquake Res. Ins., v. 38, p. 497?544.
McNutt, S., 2000, Volcanic seismicity, in Encyclopedia of Volcanoes, Sigurdsson, H., Houghton, B., McNutt, S., Rymer, H, and Stix, J. (eds.), Academic Press, San Diego, p. 1015-1034
Information Contacts: Japan Meteorological Agency (JMA), Otemachi, 1-3-4, Chiyoda-ku Tokyo 100-8122, Japan (URL: http://www.jma.go.jp/); Volcano Research Center, Earthquake Research Institute (ERI), University of Tokyo, Yayoi 1-1-1, Bunkyo-ku, Tokyo 113, Japan (URL: http://www.eri.u-tokyo.ac.jp/topics/ASAMA2004/index-e.html); Charles Holliday, (US) Air Force Weather Agency (AFWA); Yukio Hayakawa, Gunma University, Faculty of Education, Aramaki 4-2, Maebashi 371-8510, Japan; Ministry of Land, Infrastructure, Transport and Tourism (URL: http://www.mlit.go.jp/tonesui/).
Colored (eruption) plumes cease after 27 May 2009; steaming and seismicity through 2009
The eruption at Asama that began on 21 January 2009 (BGVN 33:12) was followed by stronger activity on 2 February, and then by crater incandescence and small ash eruptions through 2 May (BGVN 34:04). The last colored plume reported by the Japan Meteorological Agency (JMA), likely containing ash, was on 27 May 2009. Periods of increased seismicity were detected throughout the year.
JMA monthly reports, available through December 2009, noted observations of white plumes in May 2009, with a grayish-white plume rising to 600 m above the Kamayama Crater on 27 May. White plumes in June remained below 500 m height. In July, white plumes rising no higher than 300 m were seen on nine days. Similar plumes were seen during August on 19 days and continued to be observed almost daily through the remainder of 2009.
Intermittent tremor episodes continued to be detected in 2009, along with volcanic earthquakes at a rate of approximately 2,300-3,000 events/month (average ~100 per day) from May through August. Only 1,450 volcanic earthquakes were detected in September (average of less than 50/day). Seismicity increased again after 25 October, rising to 143 events on the 30th, and a monthly total of 1,796. Volcanic earthquakes subsided after 3 November, remaining at less than 100/day through the end of the month (1,311 total). Overall December seismicity was back to the level recorded earlier in the year with 2,347 events, with an increase after the 25th, and a high of 135 earthquakes on the 29th.
Information Contacts: Japan Meteorological Agency (JMA), Otemachi, 1-3-4, Chiyoda-ku Tokyo 100-8122, Japan (URL: http://www.jma.go.jp/).
No changes in high-temperature areas around summit crater; seismicity remained low
Asama's quiescence during May-December 2009 noted in our previous report (BGVN 35:10) continued into 2010. Only two minor incidents were noteable during the end of the year. During 11-12 November seismic activity was at a low level, though it was slightly above background. White plumes were seen rising to a height of ~100-400 m above the crater. No remarkable changes were noted by either GPS or tiltmeter observations. Alert Level 1 continued during this period.
An observation flight was conducted in cooperation with the Japan Ground Self-Defense Force (JGSDF) on 2 November. High-temperature areas were confirmed in and around the center of the summit crater. No changes in the distribution of thermal anomalies was detected since the last observation on 13 April. The SO2 flux averaged ~200-300 tonnes/day (t/d) during November.
In December, seismic activity continued at a low level except for a slight increase during 28-31 December. A white plume was observed rising ~100-300 m above the crater. The SO2 flux measured an average of 100-300 t/d. No remarkable changes were noted by either GPS or tiltmeter observations.
There was no exceptional activity during either 2011 or 2012 to date.
Information Contacts: Japan Meteorological Agency (JMA), Otemachi, 1-3-4, Chiyoda-ke Tokyo 100-8122, Japan (URL: http://www.jma.go.jp/).
Small explosions on 16 and 19 January 2015
Asamayama (also known as Asama and Azumayama) has been relatively quiet since an eruption during January-February 2009 (BGVN 34:04, 35:10, and 37:10). This report discusses activity from the end of our previous report in October 2012 (BGVN 37:10) through September 2016. Data were provided by the Japan Meteorological Agency (JMA), which publishes monthly reports of Japanese volcanic activity. These reports have been translated into English since October 2010 and can be viewed online (see Information Contacts section below).
Based on JMA monthly reports, there was no exceptional activity during 2011-2013. However, during 2014, the frequency of shallow volcanic earthquakes and tremors occurring immediately under the summit crater began to increase. In late April 2015, volcanic seismicity further increased. Because of this increase in activity and the possibility of a small eruption, JMA raised the Alert Level on 11 June from 1 to 2 (on a scale of 5), and warned people not to approach the crater. The volcano remained in "a somewhat active state" in 2016 through at least September, and JMA kept the Alert Level at 2 through that time.
Very small eruptions were reported by JMA from the summit crater on 16 and 19 June 2015 that generated ashfall to the NE within 4 km of the crater. Scientists aboard an overflight later that day observed the crater venting white to blue-white gas. No further eruptions occurred through the end of December 2015.
JMA reported that the number of very weak volcanic earthquakes and tremors at a very shallow depth immediately under the summit crater had shown a long-term increasing trend since around 2014. The number began to increase further during late April 2015 and, although decreasing slightly since August, remained high through at least December.
On 14 October 2015, government scientists observed a thermal area around the bottom of the summit crater during an aerial inspection; this finding was similar to the previous observation on 24 June 2015. No new ejecta or discoloration were seen in or around the crater, and no changes in the crater morphology were observed.
According to JMA, white plumes rose as high as 700 m above the crater rim in November 2015 and 100-300 m above the rim in December. They also reported that between July and December 2015, weak night-time incandescence at the summit crater was visible.
The level of SO2 emissions rapidly increased from 200 metric tons/day on 1 June to 500 metric tons/day on 8 June, and then to 1,700 tons/day on 11 June 2015. The level remained high through at least the end of the year (table 3).
Table 3. Field survey data on SO2 levels (metric tons/day) by month, August-December 2015. Courtesy of JMA.
| Survey dates (2015) | SO2 level (t/d) |
| 3 August | 1,500 |
| 2 and 30 September | 600-1,900 |
| 8, 15, 26 October | 600-2,000 |
| 6, 24 November | 1,200 –1,700 |
| 2, 9, 22 December | 600-900 |
According to JMA, continuous Global Navigation Satellite System (GNSS) data had indicated that contraction had been occurring since the autumn of 2009. A slight extension was observed along some baselines from about May to September 2015. Contraction was also observed between the summit and Oiwake (8 km SSE) during June-September, based on electro-optical distance measurements. JMA interpreted this as possible inflation at shallow depths under the summit. Both methods indicated that contraction had ceased by October 2015. Tiltmeter data indicated that deeper parts under the western side of the summit had inflated slightly during early June; this trend slowed in late July and remained slow, but ongoing, through December 2015.
Information Contacts: Japan Meteorological Agency (JMA), Otemachi, 1-3-4, Chiyoda-ku Tokyo 100-8122, Japan (URL: http://www.jma.go.jp/) [Monthly reports in English are at URL: http://www.data.jma.go.jp/svd/vois/data/tokyo/eng/volcano_activity/monthly.htm)].
Ashfall from phreatic eruptions on 7 and 25 August 2019
Asamayama (also known as Asama), located in the Kanto-Chubu Region of Japan, previously erupted in June 2015. Activity included increased volcanic seismicity, small eruptions which occasionally resulted in ashfall, and SO2 gas emissions (BGVN 41:10). This report covers activity through August 2019, which describes small phreatic eruptions, volcanic seismicity, faint incandescence and commonly white gas plumes, and fluctuating SO2 emissions. The primary source of information for this report is provided by the Japan Meteorological Agency (JMA).
Activity during October 2016-May 2019. From October 2016 through December 2017, a high-sensitivity camera captured faint incandescence at night accompanied by white gas plumes rising above the crater to an altitude ranging 100-800 m (figure 44). A thermal anomaly and faint incandescence accompanied by a white plume near the summit was observed at night on 6-7 and 21 January 2017. These thermal anomalies were recorded near the central part of the crater bottom in January, February, and November 2017, and in May 2019. After December 2017 the faint incandescence was not observed, with an exception on 18 July 2018.
|
Figure 44. A surveillance camera observed faint incandescence at Asamayama in February 2017. Left: Onimushi surveillance camera taken at 0145 on 5 February 2017. Right: Kurokayama surveillance camera taken at 0510 on 1 February 2017. Courtesy of JMA (Monthly Report for February 2017). |
Field surveys on 6, 16, and 28 December 2016 reported an increased amount of SO2 gas emissions from November 2016 (100-600 tons/day) to March 2017 (1,300-3,200 tons/day). In April 2017 the SO2 emissions decreased (600-1,500 tons/day). Low-frequency shallow volcanic tremors decreased in December 2016; none were observed in January 2017. From February 2017 through June 2018 volcanic tremors occurred more intermittently. According to the monthly JMA Reports on February 2017 and December 2018 and data from the Geographical Survey Institute's Global Navigation Satellite Systems (GNSS), a slight inflation between the north and south baseline was recorded starting in fall 2016 through December 2018. This growth become stagnant at some of the baselines in October 2017.
Activity during August 2019. On 7 August 2019 a small phreatic eruption occurred at the summit crater and continued for about 20 minutes, resulting in an ash plume that rose to a maximum altitude of 1.8 km, drifting N and an associated earthquake and volcanic tremor (figure 45). According to the Tokyo Volcanic Ash Advisory (VAAC), this plume rose 4.6 km, based on satellite data from HIMAWARI-8. A surveillance camera observed a large volcanic block was ejected roughly 200 m from the crater. According to an ashfall survey conducted by the Mobile Observation Team on 8 August, slight ashfall occurred in the Tsumagoi Village (12 km N) and Naganohara Town (19 km NE), Gunma Prefecture (figure 46 and 47). About 2 g/m2 of ash deposit was measured by the Tokyo Institute of Technology. Immediately after the eruption on 7 August, seismicity, volcanism, and SO2 emissions temporarily increased and then decreased that same day.
|
Figure 45. Surveillance camera images of Asamayama showing the small eruption at the summit crater on 7 August 2019, resulting in incandescence and a plume rising 1.8 km altitude. Both photos were taken on 7 August 2019.Courtesy of JMA (Monthly Report for August 2019). |
|
Figure 46. A photomicrograph of fragmented ejecta (250-500 µm) from Asamayama deposited roughly 5 km from the crater as a result of the eruption on 7 August 2019. Courtesy of JMA (Monthly Report for August 2019). |
|
Figure 47. Photos of ashfall in a nearby town NNE of Asamayama due to the 7 August 2019 eruption. Courtesy of JMA (Daily Report for 8 August 2019). |
Another eruption at the summit crater on 25 August 2019 was smaller than the one on 7 August. JMA reported the resulting ash plume rose to an altitude of 600 m and drifted E. However, the Tokyo VAAC reported that the altitude of the plume up to 3.4 km, according to satellite data from HIMAWARI-8. A small amount of ashfall occurred in Karuizawa-machi, Nagano (4 km E), according to interview surveys and the Tokyo Institute of Technology.
Information Contacts: Japan Meteorological Agency (JMA), 1-3-4 Otemachi, Chiyoda-ku, Tokyo 100-8122, Japan (URL: http://www.jma.go.jp/jma/indexe.html); Tokyo Volcanic Ash Advisory Center (VAAC), 1-3-4 Otemachi, Chiyoda-ku, Tokyo 100-8122, Japan (URL: http://ds.data.jma.go.jp/svd/vaac/data/).
|
|
||||||||||||||||||||||||||
There is data available for 129 confirmed eruptive periods.
2019 Aug 7 - 2019 Aug 25 Confirmed Eruption (Explosive / Effusive) VEI: 2
| Episode 1 | Eruption (Explosive / Effusive) | ||||||||||||||
|---|---|---|---|---|---|---|---|---|---|---|---|---|---|---|
| 2019 Aug 7 - 2019 Aug 25 | Evidence from Observations: Reported | |||||||||||||
|
List of 1 Events for Episode 1
|
||||||||||||||
2015 Jun 16 - 2015 Jun 19 Confirmed Eruption (Explosive / Effusive) VEI: 1
| Episode 1 | Eruption (Explosive / Effusive) | Summit crater | ||||||||||||||||||||||||||||
|---|---|---|---|---|---|---|---|---|---|---|---|---|---|---|---|---|---|---|---|---|---|---|---|---|---|---|---|---|---|
| 2015 Jun 16 - 2015 Jun 19 | Evidence from Observations: Reported | ||||||||||||||||||||||||||||
|
List of 4 Events for Episode 1 at Summit crater
|
|||||||||||||||||||||||||||||
2009 Jan 21 - 2009 May 2 Confirmed Eruption (Explosive / Effusive) VEI: 2
| Episode 1 | Eruption (Explosive / Effusive) | ||||||||||||||||||||||||||||||||||||||||||||
|---|---|---|---|---|---|---|---|---|---|---|---|---|---|---|---|---|---|---|---|---|---|---|---|---|---|---|---|---|---|---|---|---|---|---|---|---|---|---|---|---|---|---|---|---|
| 2009 Jan 21 - 2009 May 2 | Evidence from Observations: Reported | |||||||||||||||||||||||||||||||||||||||||||
|
List of 7 Events for Episode 1
|
||||||||||||||||||||||||||||||||||||||||||||
2008 Aug 10 - 2008 Aug 14 Confirmed Eruption (Explosive / Effusive) VEI: 1
| Episode 1 | Eruption (Explosive / Effusive) | |||||||||||||||||||||||||||||
|---|---|---|---|---|---|---|---|---|---|---|---|---|---|---|---|---|---|---|---|---|---|---|---|---|---|---|---|---|---|
| 2008 Aug 10 - 2008 Aug 14 | Evidence from Observations: Reported | ||||||||||||||||||||||||||||
|
List of 4 Events for Episode 1
|
|||||||||||||||||||||||||||||
2004 Sep 1 - 2004 Dec 9 Confirmed Eruption (Explosive / Effusive) VEI: 2
| Episode 1 | Eruption (Explosive / Effusive) | ||||||||||||||||||||||||||||||||||||||||||||||||||||||||||||||||
|---|---|---|---|---|---|---|---|---|---|---|---|---|---|---|---|---|---|---|---|---|---|---|---|---|---|---|---|---|---|---|---|---|---|---|---|---|---|---|---|---|---|---|---|---|---|---|---|---|---|---|---|---|---|---|---|---|---|---|---|---|---|---|---|---|
| 2004 Sep 1 - 2004 Dec 9 | Evidence from Observations: Reported | |||||||||||||||||||||||||||||||||||||||||||||||||||||||||||||||
|
List of 11 Events for Episode 1
|
||||||||||||||||||||||||||||||||||||||||||||||||||||||||||||||||
2003 Feb 6 - 2003 Apr 18 Confirmed Eruption (Explosive / Effusive) VEI: 1
| Episode 1 | Eruption (Explosive / Effusive) | ||||||||||||||||||||||||||||||||||
|---|---|---|---|---|---|---|---|---|---|---|---|---|---|---|---|---|---|---|---|---|---|---|---|---|---|---|---|---|---|---|---|---|---|---|
| 2003 Feb 6 - 2003 Apr 18 | Evidence from Observations: Reported | |||||||||||||||||||||||||||||||||
|
List of 5 Events for Episode 1
|
||||||||||||||||||||||||||||||||||
1990 Jul 20 - 1990 Jul 20 Confirmed Eruption (Explosive / Effusive) VEI: 2
| Episode 1 | Eruption (Explosive / Effusive) | ||||||||||||||||||||||||||||||||||||||||||||||||||||||
|---|---|---|---|---|---|---|---|---|---|---|---|---|---|---|---|---|---|---|---|---|---|---|---|---|---|---|---|---|---|---|---|---|---|---|---|---|---|---|---|---|---|---|---|---|---|---|---|---|---|---|---|---|---|---|
| 1990 Jul 20 - 1990 Jul 20 | Evidence from Observations: Reported | |||||||||||||||||||||||||||||||||||||||||||||||||||||
|
List of 9 Events for Episode 1
|
||||||||||||||||||||||||||||||||||||||||||||||||||||||
1983 Apr 8 - 1983 Apr 8 Confirmed Eruption (Explosive / Effusive) VEI: 2
| Episode 1 | Eruption (Explosive / Effusive) | |||||||||||||||||||||||||||||||||||||||
|---|---|---|---|---|---|---|---|---|---|---|---|---|---|---|---|---|---|---|---|---|---|---|---|---|---|---|---|---|---|---|---|---|---|---|---|---|---|---|---|
| 1983 Apr 8 - 1983 Apr 8 | Evidence from Observations: Reported | ||||||||||||||||||||||||||||||||||||||
|
List of 6 Events for Episode 1
|
|||||||||||||||||||||||||||||||||||||||
1982 Oct 2 - 1982 Oct 2 Confirmed Eruption (Explosive / Effusive) VEI: 1
| Episode 1 | Eruption (Explosive / Effusive) | ||||||||||||||||||||||||||||||||||
|---|---|---|---|---|---|---|---|---|---|---|---|---|---|---|---|---|---|---|---|---|---|---|---|---|---|---|---|---|---|---|---|---|---|---|
| 1982 Oct 2 - 1982 Oct 2 | Evidence from Observations: Reported | |||||||||||||||||||||||||||||||||
|
List of 5 Events for Episode 1
|
||||||||||||||||||||||||||||||||||
1982 Apr 26 - 1982 Apr 26 Confirmed Eruption (Explosive / Effusive) VEI: 2
| Episode 1 | Eruption (Explosive / Effusive) | |||||||||||||||||||||||||||||||||||||||||||||||||||||||||||
|---|---|---|---|---|---|---|---|---|---|---|---|---|---|---|---|---|---|---|---|---|---|---|---|---|---|---|---|---|---|---|---|---|---|---|---|---|---|---|---|---|---|---|---|---|---|---|---|---|---|---|---|---|---|---|---|---|---|---|---|
| 1982 Apr 26 - 1982 Apr 26 | Evidence from Observations: Reported | ||||||||||||||||||||||||||||||||||||||||||||||||||||||||||
|
List of 10 Events for Episode 1
|
|||||||||||||||||||||||||||||||||||||||||||||||||||||||||||
1973 Feb 1 - 1973 May 24 Confirmed Eruption (Explosive / Effusive) VEI: 2
| Episode 1 | Eruption (Explosive / Effusive) | |||||||||||||||||||||||||||||||||||||||||||||||||||||||||||||||||||||
|---|---|---|---|---|---|---|---|---|---|---|---|---|---|---|---|---|---|---|---|---|---|---|---|---|---|---|---|---|---|---|---|---|---|---|---|---|---|---|---|---|---|---|---|---|---|---|---|---|---|---|---|---|---|---|---|---|---|---|---|---|---|---|---|---|---|---|---|---|---|
| 1973 Feb 1 - 1973 May 24 | Evidence from Observations: Reported | ||||||||||||||||||||||||||||||||||||||||||||||||||||||||||||||||||||
|
List of 12 Events for Episode 1
|
|||||||||||||||||||||||||||||||||||||||||||||||||||||||||||||||||||||
1965 May 23 - 1965 May 23 Confirmed Eruption (Explosive / Effusive) VEI: 2
| Episode 1 | Eruption (Explosive / Effusive) | ||||||||||||||||||||||||
|---|---|---|---|---|---|---|---|---|---|---|---|---|---|---|---|---|---|---|---|---|---|---|---|---|
| 1965 May 23 - 1965 May 23 | Evidence from Observations: Reported | |||||||||||||||||||||||
|
List of 3 Events for Episode 1
|
||||||||||||||||||||||||
1961 Aug 18 - 1961 Nov 16 Confirmed Eruption (Explosive / Effusive) VEI: 2
| Episode 1 | Eruption (Explosive / Effusive) | |||||||||||||||||||||||||||||||||||||||||||||||||||||||||||||||||||||
|---|---|---|---|---|---|---|---|---|---|---|---|---|---|---|---|---|---|---|---|---|---|---|---|---|---|---|---|---|---|---|---|---|---|---|---|---|---|---|---|---|---|---|---|---|---|---|---|---|---|---|---|---|---|---|---|---|---|---|---|---|---|---|---|---|---|---|---|---|---|
| 1961 Aug 18 - 1961 Nov 16 | Evidence from Observations: Reported | ||||||||||||||||||||||||||||||||||||||||||||||||||||||||||||||||||||
|
List of 12 Events for Episode 1
|
|||||||||||||||||||||||||||||||||||||||||||||||||||||||||||||||||||||
1958 Oct 3 - 1959 Aug 26 ± 5 days Confirmed Eruption (Explosive / Effusive) VEI: 2
| Episode 1 | Eruption (Explosive / Effusive) | ||||||||||||||||||||||||||||||||||||||||||||||||||||||||||||||||
|---|---|---|---|---|---|---|---|---|---|---|---|---|---|---|---|---|---|---|---|---|---|---|---|---|---|---|---|---|---|---|---|---|---|---|---|---|---|---|---|---|---|---|---|---|---|---|---|---|---|---|---|---|---|---|---|---|---|---|---|---|---|---|---|---|
| 1958 Oct 3 - 1959 Aug 26 ± 5 days | Evidence from Observations: Reported | |||||||||||||||||||||||||||||||||||||||||||||||||||||||||||||||
|
List of 11 Events for Episode 1
|
||||||||||||||||||||||||||||||||||||||||||||||||||||||||||||||||
[ 1955 Dec 16 ± 15 days ] Discredited Eruption
1953 Dec 27 - 1955 Aug 2 Confirmed Eruption (Explosive / Effusive) VEI: 3
| Episode 1 | Eruption (Explosive / Effusive) | ||||||||||||||||||||||||||||||||||||||||||||
|---|---|---|---|---|---|---|---|---|---|---|---|---|---|---|---|---|---|---|---|---|---|---|---|---|---|---|---|---|---|---|---|---|---|---|---|---|---|---|---|---|---|---|---|---|
| 1953 Dec 27 - 1955 Aug 2 | Evidence from Observations: Reported | |||||||||||||||||||||||||||||||||||||||||||
|
List of 7 Events for Episode 1
|
||||||||||||||||||||||||||||||||||||||||||||
1952 Jun 7 - 1952 Jun 14 Confirmed Eruption (Explosive / Effusive) VEI: 2
| Episode 1 | Eruption (Explosive / Effusive) | |||||||||||||||||||
|---|---|---|---|---|---|---|---|---|---|---|---|---|---|---|---|---|---|---|---|
| 1952 Jun 7 - 1952 Jun 14 | Evidence from Observations: Reported | ||||||||||||||||||
|
List of 2 Events for Episode 1
|
|||||||||||||||||||
[ 1952 Jan 16 ± 15 days - 1952 Jan 16 ± 15 days ] Uncertain Eruption
| Episode 1 | Eruption (Explosive / Effusive) | |||||||||||||||||||
|---|---|---|---|---|---|---|---|---|---|---|---|---|---|---|---|---|---|---|---|
| 1952 Jan 16 ± 15 days - 1952 Jan 16 ± 15 days | Evidence from Unknown | ||||||||||||||||||
|
List of 2 Events for Episode 1
|
|||||||||||||||||||
1950 Sep 23 - 1951 Jun 17 Confirmed Eruption (Explosive / Effusive) VEI: 1
| Episode 1 | Eruption (Explosive / Effusive) | ||||||||||||||||||||||||||||||||||
|---|---|---|---|---|---|---|---|---|---|---|---|---|---|---|---|---|---|---|---|---|---|---|---|---|---|---|---|---|---|---|---|---|---|---|
| 1950 Sep 23 - 1951 Jun 17 | Evidence from Observations: Reported | |||||||||||||||||||||||||||||||||
|
List of 5 Events for Episode 1
|
||||||||||||||||||||||||||||||||||
1949 Mar 10 - 1949 Oct 24 Confirmed Eruption (Explosive / Effusive) VEI: 2
| Episode 1 | Eruption (Explosive / Effusive) | |||||||||||||||||||
|---|---|---|---|---|---|---|---|---|---|---|---|---|---|---|---|---|---|---|---|
| 1949 Mar 10 - 1949 Oct 24 | Evidence from Observations: Reported | ||||||||||||||||||
|
List of 2 Events for Episode 1
|
|||||||||||||||||||
1947 Jun - 1947 Aug 14 Confirmed Eruption (Explosive / Effusive) VEI: 1
| Episode 1 | Eruption (Explosive / Effusive) | E corner of crater bottom | |||||||||||||||||||||||||||||||||||||||||||||||||||||||||||||||
|---|---|---|---|---|---|---|---|---|---|---|---|---|---|---|---|---|---|---|---|---|---|---|---|---|---|---|---|---|---|---|---|---|---|---|---|---|---|---|---|---|---|---|---|---|---|---|---|---|---|---|---|---|---|---|---|---|---|---|---|---|---|---|---|---|
| 1947 Jun - 1947 Aug 14 | Evidence from Observations: Reported | |||||||||||||||||||||||||||||||||||||||||||||||||||||||||||||||
|
List of 11 Events for Episode 1 at E corner of crater bottom
|
||||||||||||||||||||||||||||||||||||||||||||||||||||||||||||||||
1946 Oct 29 - 1946 Oct 30 Confirmed Eruption (Explosive / Effusive) VEI: 2
| Episode 1 | Eruption (Explosive / Effusive) | |||||||||||||||||||
|---|---|---|---|---|---|---|---|---|---|---|---|---|---|---|---|---|---|---|---|
| 1946 Oct 29 - 1946 Oct 30 | Evidence from Observations: Reported | ||||||||||||||||||
|
List of 2 Events for Episode 1
|
|||||||||||||||||||
1944 Jan (?) - 1945 Nov Confirmed Eruption (Explosive / Effusive) VEI: 2
| Episode 1 | Eruption (Explosive / Effusive) | |||||||||||||||||||
|---|---|---|---|---|---|---|---|---|---|---|---|---|---|---|---|---|---|---|---|
| 1944 Jan (?) - 1945 Nov | Evidence from Observations: Reported | ||||||||||||||||||
|
List of 2 Events for Episode 1
|
|||||||||||||||||||
1938 Mar 25 - 1942 Dec Confirmed Eruption (Explosive / Effusive) VEI: 1
| Episode 1 | Eruption (Explosive / Effusive) | |||||||||||||||||||||||||||||||||||||||||||||||||||||||||||
|---|---|---|---|---|---|---|---|---|---|---|---|---|---|---|---|---|---|---|---|---|---|---|---|---|---|---|---|---|---|---|---|---|---|---|---|---|---|---|---|---|---|---|---|---|---|---|---|---|---|---|---|---|---|---|---|---|---|---|---|
| 1938 Mar 25 - 1942 Dec | Evidence from Observations: Reported | ||||||||||||||||||||||||||||||||||||||||||||||||||||||||||
|
List of 10 Events for Episode 1
|
|||||||||||||||||||||||||||||||||||||||||||||||||||||||||||
1934 Nov 13 - 1937 Jul Confirmed Eruption (Explosive / Effusive) VEI: 3
| Episode 1 | Eruption (Explosive / Effusive) | ||||||||||||||||||||||||||||||||||||||||||||||||||||||||||||||||||||||||||
|---|---|---|---|---|---|---|---|---|---|---|---|---|---|---|---|---|---|---|---|---|---|---|---|---|---|---|---|---|---|---|---|---|---|---|---|---|---|---|---|---|---|---|---|---|---|---|---|---|---|---|---|---|---|---|---|---|---|---|---|---|---|---|---|---|---|---|---|---|---|---|---|---|---|---|
| 1934 Nov 13 - 1937 Jul | Evidence from Observations: Reported | |||||||||||||||||||||||||||||||||||||||||||||||||||||||||||||||||||||||||
|
List of 13 Events for Episode 1
|
||||||||||||||||||||||||||||||||||||||||||||||||||||||||||||||||||||||||||
1934 Jun - 1934 Jun Confirmed Eruption (Explosive / Effusive) VEI: 1
| Episode 1 | Eruption (Explosive / Effusive) | |||||||||||||||||||
|---|---|---|---|---|---|---|---|---|---|---|---|---|---|---|---|---|---|---|---|
| 1934 Jun - 1934 Jun | Evidence from Observations: Reported | ||||||||||||||||||
|
List of 2 Events for Episode 1
|
|||||||||||||||||||
1934 Jan 9 - 1934 Feb 11 Confirmed Eruption (Explosive / Effusive) VEI: 1
| Episode 1 | Eruption (Explosive / Effusive) | ||||||||||||||||||||||||
|---|---|---|---|---|---|---|---|---|---|---|---|---|---|---|---|---|---|---|---|---|---|---|---|---|
| 1934 Jan 9 - 1934 Feb 11 | Evidence from Observations: Reported | |||||||||||||||||||||||
|
List of 3 Events for Episode 1
|
||||||||||||||||||||||||
1933 Jan 9 - 1933 Aug 3 Confirmed Eruption (Explosive / Effusive) VEI: 2
| Episode 1 | Eruption (Explosive / Effusive) | |||||||||||||||||||
|---|---|---|---|---|---|---|---|---|---|---|---|---|---|---|---|---|---|---|---|
| 1933 Jan 9 - 1933 Aug 3 | Evidence from Observations: Reported | ||||||||||||||||||
|
List of 2 Events for Episode 1
|
|||||||||||||||||||
1931 Mar 31 - 1932 Sep 21 Confirmed Eruption (Explosive / Effusive) VEI: 3
| Episode 1 | Eruption (Explosive / Effusive) | ||||||||||||||||||||||||||||||||||||||||||||||||||||||||||||||||
|---|---|---|---|---|---|---|---|---|---|---|---|---|---|---|---|---|---|---|---|---|---|---|---|---|---|---|---|---|---|---|---|---|---|---|---|---|---|---|---|---|---|---|---|---|---|---|---|---|---|---|---|---|---|---|---|---|---|---|---|---|---|---|---|---|
| 1931 Mar 31 - 1932 Sep 21 | Evidence from Observations: Reported | |||||||||||||||||||||||||||||||||||||||||||||||||||||||||||||||
|
List of 11 Events for Episode 1
|
||||||||||||||||||||||||||||||||||||||||||||||||||||||||||||||||
1930 Apr 18 - 1930 Oct 17 Confirmed Eruption (Explosive / Effusive) VEI: 2
| Episode 1 | Eruption (Explosive / Effusive) | ||||||||||||||||||||||||||||||||||||||||||||
|---|---|---|---|---|---|---|---|---|---|---|---|---|---|---|---|---|---|---|---|---|---|---|---|---|---|---|---|---|---|---|---|---|---|---|---|---|---|---|---|---|---|---|---|---|
| 1930 Apr 18 - 1930 Oct 17 | Evidence from Observations: Reported | |||||||||||||||||||||||||||||||||||||||||||
|
List of 7 Events for Episode 1
|
||||||||||||||||||||||||||||||||||||||||||||
1929 Sep 18 - 1929 Nov 15 Confirmed Eruption (Explosive / Effusive) VEI: 2
| Episode 1 | Eruption (Explosive / Effusive) | |||||||||||||||||||||||||||||
|---|---|---|---|---|---|---|---|---|---|---|---|---|---|---|---|---|---|---|---|---|---|---|---|---|---|---|---|---|---|
| 1929 Sep 18 - 1929 Nov 15 | Evidence from Observations: Reported | ||||||||||||||||||||||||||||
|
List of 4 Events for Episode 1
|
|||||||||||||||||||||||||||||
1929 Jan 22 - 1929 Apr 5 Confirmed Eruption (Explosive / Effusive) VEI: 2
| Episode 1 | Eruption (Explosive / Effusive) | |||||||||||||||||||
|---|---|---|---|---|---|---|---|---|---|---|---|---|---|---|---|---|---|---|---|
| 1929 Jan 22 - 1929 Apr 5 | Evidence from Observations: Reported | ||||||||||||||||||
|
List of 2 Events for Episode 1
|
|||||||||||||||||||
1927 Mar (?) - 1928 Jul 25 Confirmed Eruption (Explosive / Effusive) VEI: 2
| Episode 1 | Eruption (Explosive / Effusive) | ||||||||||||||||||||||||||||||||||
|---|---|---|---|---|---|---|---|---|---|---|---|---|---|---|---|---|---|---|---|---|---|---|---|---|---|---|---|---|---|---|---|---|---|---|
| 1927 Mar (?) - 1928 Jul 25 | Evidence from Observations: Reported | |||||||||||||||||||||||||||||||||
|
List of 5 Events for Episode 1
|
||||||||||||||||||||||||||||||||||
1924 Sep 7 - 1924 Sep 29 Confirmed Eruption (Explosive / Effusive) VEI: 2
| Episode 1 | Eruption (Explosive / Effusive) | ||||||||||||||||||||||||
|---|---|---|---|---|---|---|---|---|---|---|---|---|---|---|---|---|---|---|---|---|---|---|---|---|
| 1924 Sep 7 - 1924 Sep 29 | Evidence from Observations: Reported | |||||||||||||||||||||||
|
List of 3 Events for Episode 1
|
||||||||||||||||||||||||
1920 Dec 6 - 1922 Apr 5 Confirmed Eruption (Explosive / Effusive) VEI: 2
| Episode 1 | Eruption (Explosive / Effusive) | ||||||||||||||||||||||||
|---|---|---|---|---|---|---|---|---|---|---|---|---|---|---|---|---|---|---|---|---|---|---|---|---|
| 1920 Dec 6 - 1922 Apr 5 | Evidence from Observations: Reported | |||||||||||||||||||||||
|
List of 3 Events for Episode 1
|
||||||||||||||||||||||||
1919 Mar 14 - 1919 Aug 27 (?) Confirmed Eruption (Explosive / Effusive) VEI: 2
| Episode 1 | Eruption (Explosive / Effusive) | |||||||||||||||||||||||||||||
|---|---|---|---|---|---|---|---|---|---|---|---|---|---|---|---|---|---|---|---|---|---|---|---|---|---|---|---|---|---|
| 1919 Mar 14 - 1919 Aug 27 (?) | Evidence from Observations: Reported | ||||||||||||||||||||||||||||
|
List of 4 Events for Episode 1
|
|||||||||||||||||||||||||||||
[ 1918 ] Uncertain Eruption
| Episode 1 | Eruption (Explosive / Effusive) | ||||||||||||||
|---|---|---|---|---|---|---|---|---|---|---|---|---|---|---|
| 1918 - Unknown | Evidence from Unknown | |||||||||||||
|
List of 1 Events for Episode 1
|
||||||||||||||
1917 May 3 (?) - 1917 Jul 31 (?) Confirmed Eruption (Explosive / Effusive) VEI: 1
| Episode 1 | Eruption (Explosive / Effusive) | ||||||||||||||||||||||||
|---|---|---|---|---|---|---|---|---|---|---|---|---|---|---|---|---|---|---|---|---|---|---|---|---|
| 1917 May 3 (?) - 1917 Jul 31 (?) | Evidence from Observations: Reported | |||||||||||||||||||||||
|
List of 3 Events for Episode 1
|
||||||||||||||||||||||||
1916 May 12 (?) - 1916 Oct 2 Confirmed Eruption (Explosive / Effusive) VEI: 1
| Episode 1 | Eruption (Explosive / Effusive) | ||||||||||||||||||||||||
|---|---|---|---|---|---|---|---|---|---|---|---|---|---|---|---|---|---|---|---|---|---|---|---|---|
| 1916 May 12 (?) - 1916 Oct 2 | Evidence from Observations: Reported | |||||||||||||||||||||||
|
List of 3 Events for Episode 1
|
||||||||||||||||||||||||
1915 May 13 (?) - 1915 Aug 27 Confirmed Eruption (Explosive / Effusive) VEI: 1
| Episode 1 | Eruption (Explosive / Effusive) | |||||||||||||||||||
|---|---|---|---|---|---|---|---|---|---|---|---|---|---|---|---|---|---|---|---|
| 1915 May 13 (?) - 1915 Aug 27 | Evidence from Observations: Reported | ||||||||||||||||||
|
List of 2 Events for Episode 1
|
|||||||||||||||||||
1914 Nov 12 - 1914 Dec 16 Confirmed Eruption (Explosive / Effusive) VEI: 2
| Episode 1 | Eruption (Explosive / Effusive) | ||||||||||||||||||||||||
|---|---|---|---|---|---|---|---|---|---|---|---|---|---|---|---|---|---|---|---|---|---|---|---|---|
| 1914 Nov 12 - 1914 Dec 16 | Evidence from Observations: Reported | |||||||||||||||||||||||
|
List of 3 Events for Episode 1
|
||||||||||||||||||||||||
1909 Jan 29 - 1914 Jun 24 Confirmed Eruption (Explosive / Effusive) VEI: 1
| Episode 1 | Eruption (Explosive / Effusive) | |||||||||||||||||||||||||||||||||||||||
|---|---|---|---|---|---|---|---|---|---|---|---|---|---|---|---|---|---|---|---|---|---|---|---|---|---|---|---|---|---|---|---|---|---|---|---|---|---|---|---|
| 1909 Jan 29 - 1914 Jun 24 | Evidence from Observations: Reported | ||||||||||||||||||||||||||||||||||||||
|
List of 6 Events for Episode 1
|
|||||||||||||||||||||||||||||||||||||||
1908 Aug 5 - 1908 Sep 23 Confirmed Eruption (Explosive / Effusive) VEI: 2
| Episode 1 | Eruption (Explosive / Effusive) | |||||||||||||||||||||||||||||
|---|---|---|---|---|---|---|---|---|---|---|---|---|---|---|---|---|---|---|---|---|---|---|---|---|---|---|---|---|---|
| 1908 Aug 5 - 1908 Sep 23 | Evidence from Observations: Reported | ||||||||||||||||||||||||||||
|
List of 4 Events for Episode 1
|
|||||||||||||||||||||||||||||
1908 Feb 13 (?) - 1908 Feb 19 Confirmed Eruption (Explosive / Effusive) VEI: 2
| Episode 1 | Eruption (Explosive / Effusive) | ||||||||||||||||||||||||
|---|---|---|---|---|---|---|---|---|---|---|---|---|---|---|---|---|---|---|---|---|---|---|---|---|
| 1908 Feb 13 (?) - 1908 Feb 19 | Evidence from Observations: Reported | |||||||||||||||||||||||
|
List of 3 Events for Episode 1
|
||||||||||||||||||||||||
1907 Aug 24 - 1907 Aug 24 Confirmed Eruption (Explosive / Effusive) VEI: 2
| Episode 1 | Eruption (Explosive / Effusive) | ||||||||||||||||||||||||
|---|---|---|---|---|---|---|---|---|---|---|---|---|---|---|---|---|---|---|---|---|---|---|---|---|
| 1907 Aug 24 - 1907 Aug 24 | Evidence from Observations: Reported | |||||||||||||||||||||||
|
List of 3 Events for Episode 1
|
||||||||||||||||||||||||
1907 Jan 18 - 1907 Mar 28 Confirmed Eruption (Explosive / Effusive) VEI: 2
| Episode 1 | Eruption (Explosive / Effusive) | |||||||||||||||||||||||||||||
|---|---|---|---|---|---|---|---|---|---|---|---|---|---|---|---|---|---|---|---|---|---|---|---|---|---|---|---|---|---|
| 1907 Jan 18 - 1907 Mar 28 | Evidence from Observations: Reported | ||||||||||||||||||||||||||||
|
List of 4 Events for Episode 1
|
|||||||||||||||||||||||||||||
1906 Apr 6 - 1906 Apr 6 Confirmed Eruption (Explosive / Effusive) VEI: 2
| Episode 1 | Eruption (Explosive / Effusive) | |||||||||||||||||||
|---|---|---|---|---|---|---|---|---|---|---|---|---|---|---|---|---|---|---|---|
| 1906 Apr 6 - 1906 Apr 6 | Evidence from Observations: Reported | ||||||||||||||||||
|
List of 2 Events for Episode 1
|
|||||||||||||||||||
[ 1905 ] Uncertain Eruption
| Episode 1 | Eruption (Explosive / Effusive) | |||||||||||||||||||
|---|---|---|---|---|---|---|---|---|---|---|---|---|---|---|---|---|---|---|---|
| 1905 - Unknown | Evidence from Unknown | ||||||||||||||||||
|
List of 2 Events for Episode 1
|
|||||||||||||||||||
1904 Aug 4 - 1904 Aug 4 Confirmed Eruption (Explosive / Effusive) VEI: 2
| Episode 1 | Eruption (Explosive / Effusive) | ||||||||||||||||||||||||
|---|---|---|---|---|---|---|---|---|---|---|---|---|---|---|---|---|---|---|---|---|---|---|---|---|
| 1904 Aug 4 - 1904 Aug 4 | Evidence from Observations: Reported | |||||||||||||||||||||||
|
List of 3 Events for Episode 1
|
||||||||||||||||||||||||
[ 1903 May 28 - 1903 Jun 30 ] Uncertain Eruption
| Episode 1 | Eruption (Explosive / Effusive) | ||||||||||||||||||||||||
|---|---|---|---|---|---|---|---|---|---|---|---|---|---|---|---|---|---|---|---|---|---|---|---|---|
| 1903 May 28 - 1903 Jun 30 | Evidence from Unknown | |||||||||||||||||||||||
|
List of 3 Events for Episode 1
|
||||||||||||||||||||||||
1902 Aug 5 - 1902 Aug 20 (?) Confirmed Eruption (Explosive / Effusive) VEI: 2
| Episode 1 | Eruption (Explosive / Effusive) | |||||||||||||||||||||||||||||
|---|---|---|---|---|---|---|---|---|---|---|---|---|---|---|---|---|---|---|---|---|---|---|---|---|---|---|---|---|---|
| 1902 Aug 5 - 1902 Aug 20 (?) | Evidence from Observations: Reported | ||||||||||||||||||||||||||||
|
List of 4 Events for Episode 1
|
|||||||||||||||||||||||||||||
1902 Feb 7 - 1902 Feb 7 Confirmed Eruption (Explosive / Effusive) VEI: 2
| Episode 1 | Eruption (Explosive / Effusive) | |||||||||||||||||||
|---|---|---|---|---|---|---|---|---|---|---|---|---|---|---|---|---|---|---|---|
| 1902 Feb 7 - 1902 Feb 7 | Evidence from Observations: Reported | ||||||||||||||||||
|
List of 2 Events for Episode 1
|
|||||||||||||||||||
1900 Jan 22 - 1901 Oct Confirmed Eruption (Explosive / Effusive) VEI: 2
| Episode 1 | Eruption (Explosive / Effusive) | ||||||||||||||||||||||||
|---|---|---|---|---|---|---|---|---|---|---|---|---|---|---|---|---|---|---|---|---|---|---|---|---|
| 1900 Jan 22 - 1901 Oct | Evidence from Observations: Reported | |||||||||||||||||||||||
|
List of 3 Events for Episode 1
|
||||||||||||||||||||||||
1899 Jul 10 - 1899 Aug 7 Confirmed Eruption (Explosive / Effusive) VEI: 2
| Episode 1 | Eruption (Explosive / Effusive) | |||||||||||||||||||
|---|---|---|---|---|---|---|---|---|---|---|---|---|---|---|---|---|---|---|---|
| 1899 Jul 10 - 1899 Aug 7 | Evidence from Observations: Reported | ||||||||||||||||||
|
List of 2 Events for Episode 1
|
|||||||||||||||||||
1899 Mar 11 Confirmed Eruption (Explosive / Effusive) VEI: 2
| Episode 1 | Eruption (Explosive / Effusive) | |||||||||||||||||||
|---|---|---|---|---|---|---|---|---|---|---|---|---|---|---|---|---|---|---|---|
| 1899 Mar 11 - Unknown | Evidence from Observations: Reported | ||||||||||||||||||
|
List of 2 Events for Episode 1
|
|||||||||||||||||||
1894 Apr 6 - 1894 Jun 14 Confirmed Eruption (Explosive / Effusive) VEI: 2
| Episode 1 | Eruption (Explosive / Effusive) | |||||||||||||||||||
|---|---|---|---|---|---|---|---|---|---|---|---|---|---|---|---|---|---|---|---|
| 1894 Apr 6 - 1894 Jun 14 | Evidence from Observations: Reported | ||||||||||||||||||
|
List of 2 Events for Episode 1
|
|||||||||||||||||||
[ 1892 ] Uncertain Eruption
| Episode 1 | Eruption (Explosive / Effusive) | ||||||||||||||
|---|---|---|---|---|---|---|---|---|---|---|---|---|---|---|
| 1892 - Unknown | Evidence from Unknown | |||||||||||||
|
List of 1 Events for Episode 1
|
||||||||||||||
1891 Oct (?) - 1891 Nov (?) Confirmed Eruption (Explosive / Effusive)
| Episode 1 | Eruption (Explosive / Effusive) | ||||||||||||||
|---|---|---|---|---|---|---|---|---|---|---|---|---|---|---|
| 1891 Oct (?) - 1891 Nov (?) | Evidence from Observations: Reported | |||||||||||||
|
List of 1 Events for Episode 1
|
||||||||||||||
1889 Dec 24 Confirmed Eruption (Explosive / Effusive) VEI: 2
| Episode 1 | Eruption (Explosive / Effusive) | |||||||||||||||||||
|---|---|---|---|---|---|---|---|---|---|---|---|---|---|---|---|---|---|---|---|
| 1889 Dec 24 - Unknown | Evidence from Observations: Reported | ||||||||||||||||||
|
List of 2 Events for Episode 1
|
|||||||||||||||||||
1879 Sep 27 - 1879 Sep 28 Confirmed Eruption (Explosive / Effusive) VEI: 2
| Episode 1 | Eruption (Explosive / Effusive) | |||||||||||||||||||
|---|---|---|---|---|---|---|---|---|---|---|---|---|---|---|---|---|---|---|---|
| 1879 Sep 27 - 1879 Sep 28 | Evidence from Observations: Reported | ||||||||||||||||||
|
List of 2 Events for Episode 1
|
|||||||||||||||||||
[ 1878 ] Uncertain Eruption
| Episode 1 | Eruption (Explosive / Effusive) | |||||||||||||||||||
|---|---|---|---|---|---|---|---|---|---|---|---|---|---|---|---|---|---|---|---|
| 1878 - Unknown | Evidence from Unknown | ||||||||||||||||||
|
List of 2 Events for Episode 1
|
|||||||||||||||||||
1875 Jun 14 Confirmed Eruption (Explosive / Effusive) VEI: 2
| Episode 1 | Eruption (Explosive / Effusive) | |||||||||||||||||||
|---|---|---|---|---|---|---|---|---|---|---|---|---|---|---|---|---|---|---|---|
| 1875 Jun 14 - Unknown | Evidence from Observations: Reported | ||||||||||||||||||
|
List of 2 Events for Episode 1
|
|||||||||||||||||||
1869 May - 1869 Oct 23 Confirmed Eruption (Explosive / Effusive) VEI: 2
| Episode 1 | Eruption (Explosive / Effusive) | |||||||||||||||||||
|---|---|---|---|---|---|---|---|---|---|---|---|---|---|---|---|---|---|---|---|
| 1869 May - 1869 Oct 23 | Evidence from Observations: Reported | ||||||||||||||||||
|
List of 2 Events for Episode 1
|
|||||||||||||||||||
1815 Feb 28 Confirmed Eruption (Explosive / Effusive) VEI: 3
| Episode 1 | Eruption (Explosive / Effusive) | |||||||||||||||||||||||||||||
|---|---|---|---|---|---|---|---|---|---|---|---|---|---|---|---|---|---|---|---|---|---|---|---|---|---|---|---|---|---|
| 1815 Feb 28 - Unknown | Evidence from Observations: Reported | ||||||||||||||||||||||||||||
|
List of 4 Events for Episode 1
|
|||||||||||||||||||||||||||||
1803 Nov 7 - 1803 Nov 21 Confirmed Eruption (Explosive / Effusive) VEI: 2
| Episode 1 | Eruption (Explosive / Effusive) | |||||||||||||||||||||||||||||
|---|---|---|---|---|---|---|---|---|---|---|---|---|---|---|---|---|---|---|---|---|---|---|---|---|---|---|---|---|---|
| 1803 Nov 7 - 1803 Nov 21 | Evidence from Observations: Reported | ||||||||||||||||||||||||||||
|
List of 4 Events for Episode 1
|
|||||||||||||||||||||||||||||
1803 Jul 4 Confirmed Eruption (Explosive / Effusive) VEI: 2
| Episode 1 | Eruption (Explosive / Effusive) | |||||||||||||||||||||||||||||
|---|---|---|---|---|---|---|---|---|---|---|---|---|---|---|---|---|---|---|---|---|---|---|---|---|---|---|---|---|---|
| 1803 Jul 4 - Unknown | Evidence from Observations: Reported | ||||||||||||||||||||||||||||
|
List of 4 Events for Episode 1
|
|||||||||||||||||||||||||||||
1783 May 9 - 1783 Aug 5 Confirmed Eruption (Explosive / Effusive) VEI: 4
| Episode 1 | Eruption (Explosive / Effusive) | ||||||||||||||||||||||||||||||||||||||||||||||||||||||||||||||||||||||||||||||||||||||||||||||||||||||||
|---|---|---|---|---|---|---|---|---|---|---|---|---|---|---|---|---|---|---|---|---|---|---|---|---|---|---|---|---|---|---|---|---|---|---|---|---|---|---|---|---|---|---|---|---|---|---|---|---|---|---|---|---|---|---|---|---|---|---|---|---|---|---|---|---|---|---|---|---|---|---|---|---|---|---|---|---|---|---|---|---|---|---|---|---|---|---|---|---|---|---|---|---|---|---|---|---|---|---|---|---|---|---|---|---|
| 1783 May 9 - 1783 Aug 5 | Evidence from Observations: Reported | |||||||||||||||||||||||||||||||||||||||||||||||||||||||||||||||||||||||||||||||||||||||||||||||||||||||
|
List of 19 Events for Episode 1
|
||||||||||||||||||||||||||||||||||||||||||||||||||||||||||||||||||||||||||||||||||||||||||||||||||||||||
[ 1779 Sep (?) ] Uncertain Eruption
| Episode 1 | Eruption (Explosive / Effusive) | |||||||||||||||||||
|---|---|---|---|---|---|---|---|---|---|---|---|---|---|---|---|---|---|---|---|
| 1779 Sep (?) - Unknown | Evidence from Unknown | ||||||||||||||||||
|
List of 2 Events for Episode 1
|
|||||||||||||||||||
1777 Confirmed Eruption (Explosive / Effusive) VEI: 2
| Episode 1 | Eruption (Explosive / Effusive) | |||||||||||||||||||
|---|---|---|---|---|---|---|---|---|---|---|---|---|---|---|---|---|---|---|---|
| 1777 - Unknown | Evidence from Observations: Reported | ||||||||||||||||||
|
List of 2 Events for Episode 1
|
|||||||||||||||||||
1776 Sep 5 Confirmed Eruption (Explosive / Effusive) VEI: 2
| Episode 1 | Eruption (Explosive / Effusive) | ||||||||||||||||||||||||
|---|---|---|---|---|---|---|---|---|---|---|---|---|---|---|---|---|---|---|---|---|---|---|---|---|
| 1776 Sep 5 - Unknown | Evidence from Observations: Reported | |||||||||||||||||||||||
|
List of 3 Events for Episode 1
|
||||||||||||||||||||||||
1769 Aug 6 Confirmed Eruption (Explosive / Effusive)
| Episode 1 | Eruption (Explosive / Effusive) | Volcano Uncertain | ||||||||||||||||||
|---|---|---|---|---|---|---|---|---|---|---|---|---|---|---|---|---|---|---|---|
| 1769 Aug 6 - Unknown | Evidence from Unknown | ||||||||||||||||||
|
List of 2 Events for Episode 1 at Volcano Uncertain
|
|||||||||||||||||||
1762 Apr Confirmed Eruption (Explosive / Effusive) VEI: 2
| Episode 1 | Eruption (Explosive / Effusive) | |||||||||||||||||||
|---|---|---|---|---|---|---|---|---|---|---|---|---|---|---|---|---|---|---|---|
| 1762 Apr - Unknown | Evidence from Observations: Reported | ||||||||||||||||||
|
List of 2 Events for Episode 1
|
|||||||||||||||||||
1755 Jul 5 - 1755 Aug 6 Confirmed Eruption (Explosive / Effusive) VEI: 2
| Episode 1 | Eruption (Explosive / Effusive) | |||||||||||||||||||||||||||||
|---|---|---|---|---|---|---|---|---|---|---|---|---|---|---|---|---|---|---|---|---|---|---|---|---|---|---|---|---|---|
| 1755 Jul 5 - 1755 Aug 6 | Evidence from Observations: Reported | ||||||||||||||||||||||||||||
|
List of 4 Events for Episode 1
|
|||||||||||||||||||||||||||||
1754 Aug 7 - 1754 Aug 19 Confirmed Eruption (Explosive / Effusive) VEI: 2
| Episode 1 | Eruption (Explosive / Effusive) | |||||||||||||||||||
|---|---|---|---|---|---|---|---|---|---|---|---|---|---|---|---|---|---|---|---|
| 1754 Aug 7 - 1754 Aug 19 | Evidence from Observations: Reported | ||||||||||||||||||
|
List of 2 Events for Episode 1
|
|||||||||||||||||||
1752 Sep - 1752 Oct Confirmed Eruption (Explosive / Effusive) VEI: 2 (?)
| Episode 1 | Eruption (Explosive / Effusive) | |||||||||||||||||||
|---|---|---|---|---|---|---|---|---|---|---|---|---|---|---|---|---|---|---|---|
| 1752 Sep - 1752 Oct | Evidence from Observations: Reported | ||||||||||||||||||
|
List of 2 Events for Episode 1
|
|||||||||||||||||||
1733 Jul 30 Confirmed Eruption (Explosive / Effusive) VEI: 2
| Episode 1 | Eruption (Explosive / Effusive) | ||||||||||||||||||||||||
|---|---|---|---|---|---|---|---|---|---|---|---|---|---|---|---|---|---|---|---|---|---|---|---|---|
| 1733 Jul 30 - Unknown | Evidence from Observations: Reported | |||||||||||||||||||||||
|
List of 3 Events for Episode 1
|
||||||||||||||||||||||||
1732 Jul 30 Confirmed Eruption (Explosive / Effusive) VEI: 2
| Episode 1 | Eruption (Explosive / Effusive) | |||||||||||||||||||
|---|---|---|---|---|---|---|---|---|---|---|---|---|---|---|---|---|---|---|---|
| 1732 Jul 30 - Unknown | Evidence from Observations: Reported | ||||||||||||||||||
|
List of 2 Events for Episode 1
|
|||||||||||||||||||
1731 Confirmed Eruption (Explosive / Effusive) VEI: 2
| Episode 1 | Eruption (Explosive / Effusive) | |||||||||||||||||||
|---|---|---|---|---|---|---|---|---|---|---|---|---|---|---|---|---|---|---|---|
| 1731 - Unknown | Evidence from Observations: Reported | ||||||||||||||||||
|
List of 2 Events for Episode 1
|
|||||||||||||||||||
1729 Nov - 1729 Dec Confirmed Eruption (Explosive / Effusive) VEI: 2
| Episode 1 | Eruption (Explosive / Effusive) | ||||||||||||||||||||||||
|---|---|---|---|---|---|---|---|---|---|---|---|---|---|---|---|---|---|---|---|---|---|---|---|---|
| 1729 Nov - 1729 Dec | Evidence from Observations: Reported | |||||||||||||||||||||||
|
List of 3 Events for Episode 1
|
||||||||||||||||||||||||
1729 Feb Confirmed Eruption (Explosive / Effusive) VEI: 2
| Episode 1 | Eruption (Explosive / Effusive) | |||||||||||||||||||
|---|---|---|---|---|---|---|---|---|---|---|---|---|---|---|---|---|---|---|---|
| 1729 Feb - Unknown | Evidence from Observations: Reported | ||||||||||||||||||
|
List of 2 Events for Episode 1
|
|||||||||||||||||||
1728 Nov 10 Confirmed Eruption (Explosive / Effusive) VEI: 2
| Episode 1 | Eruption (Explosive / Effusive) | |||||||||||||||||||
|---|---|---|---|---|---|---|---|---|---|---|---|---|---|---|---|---|---|---|---|
| 1728 Nov 10 - Unknown | Evidence from Observations: Reported | ||||||||||||||||||
|
List of 2 Events for Episode 1
|
|||||||||||||||||||
1723 Aug 20 Confirmed Eruption (Explosive / Effusive) VEI: 2
| Episode 1 | Eruption (Explosive / Effusive) | |||||||||||||||||||
|---|---|---|---|---|---|---|---|---|---|---|---|---|---|---|---|---|---|---|---|
| 1723 Aug 20 - Unknown | Evidence from Observations: Reported | ||||||||||||||||||
|
List of 2 Events for Episode 1
|
|||||||||||||||||||
1722 Nov 18 - 1723 Feb 5 Confirmed Eruption (Explosive / Effusive) VEI: 2
| Episode 1 | Eruption (Explosive / Effusive) | ||||||||||||||||||||||||
|---|---|---|---|---|---|---|---|---|---|---|---|---|---|---|---|---|---|---|---|---|---|---|---|---|
| 1722 Nov 18 - 1723 Feb 5 | Evidence from Observations: Reported | |||||||||||||||||||||||
|
List of 3 Events for Episode 1
|
||||||||||||||||||||||||
1721 Jun 22 Confirmed Eruption (Explosive / Effusive) VEI: 1
| Episode 1 | Eruption (Explosive / Effusive) | ||||||||||||||||||||||||
|---|---|---|---|---|---|---|---|---|---|---|---|---|---|---|---|---|---|---|---|---|---|---|---|---|
| 1721 Jun 22 - Unknown | Evidence from Observations: Reported | |||||||||||||||||||||||
|
List of 3 Events for Episode 1
|
||||||||||||||||||||||||
1720 Jun 6 Confirmed Eruption (Explosive / Effusive) VEI: 2
| Episode 1 | Eruption (Explosive / Effusive) | |||||||||||||||||||
|---|---|---|---|---|---|---|---|---|---|---|---|---|---|---|---|---|---|---|---|
| 1720 Jun 6 - Unknown | Evidence from Observations: Reported | ||||||||||||||||||
|
List of 2 Events for Episode 1
|
|||||||||||||||||||
1719 Jun 10 - 1719 Jun 11 Confirmed Eruption (Explosive / Effusive)
| Episode 1 | Eruption (Explosive / Effusive) | Volcano Uncertain | ||||||||||||||||||
|---|---|---|---|---|---|---|---|---|---|---|---|---|---|---|---|---|---|---|---|
| 1719 Jun 10 - 1719 Jun 11 | Evidence from Unknown | ||||||||||||||||||
|
List of 2 Events for Episode 1 at Volcano Uncertain
|
|||||||||||||||||||
1718 Sep 26 Confirmed Eruption (Explosive / Effusive) VEI: 2
| Episode 1 | Eruption (Explosive / Effusive) | |||||||||||||||||||
|---|---|---|---|---|---|---|---|---|---|---|---|---|---|---|---|---|---|---|---|
| 1718 Sep 26 - Unknown | Evidence from Observations: Reported | ||||||||||||||||||
|
List of 2 Events for Episode 1
|
|||||||||||||||||||
1717 Sep 23 Confirmed Eruption (Explosive / Effusive) VEI: 2
| Episode 1 | Eruption (Explosive / Effusive) | |||||||||||||||||||
|---|---|---|---|---|---|---|---|---|---|---|---|---|---|---|---|---|---|---|---|
| 1717 Sep 23 - Unknown | Evidence from Observations: Reported | ||||||||||||||||||
|
List of 2 Events for Episode 1
|
|||||||||||||||||||
1713 Jun 29 Confirmed Eruption (Explosive / Effusive) VEI: 2
| Episode 1 | Eruption (Explosive / Effusive) | ||||||||||||||||||||||||
|---|---|---|---|---|---|---|---|---|---|---|---|---|---|---|---|---|---|---|---|---|---|---|---|---|
| 1713 Jun 29 - Unknown | Evidence from Observations: Reported | |||||||||||||||||||||||
|
List of 3 Events for Episode 1
|
||||||||||||||||||||||||
1711 Apr 13 Confirmed Eruption (Explosive / Effusive) VEI: 2
| Episode 1 | Eruption (Explosive / Effusive) | ||||||||||||||||||||||||
|---|---|---|---|---|---|---|---|---|---|---|---|---|---|---|---|---|---|---|---|---|---|---|---|---|
| 1711 Apr 13 - Unknown | Evidence from Observations: Reported | |||||||||||||||||||||||
|
List of 3 Events for Episode 1
|
||||||||||||||||||||||||
1710 Mar 25 - 1710 Apr 13 Confirmed Eruption (Explosive / Effusive) VEI: 2
| Episode 1 | Eruption (Explosive / Effusive) | |||||||||||||||||||
|---|---|---|---|---|---|---|---|---|---|---|---|---|---|---|---|---|---|---|---|
| 1710 Mar 25 - 1710 Apr 13 | Evidence from Observations: Reported | ||||||||||||||||||
|
List of 2 Events for Episode 1
|
|||||||||||||||||||
1708 Dec 29 - 1709 Jan 8 Confirmed Eruption (Explosive / Effusive) VEI: 2
| Episode 1 | Eruption (Explosive / Effusive) | ||||||||||||||||||||||||
|---|---|---|---|---|---|---|---|---|---|---|---|---|---|---|---|---|---|---|---|---|---|---|---|---|
| 1708 Dec 29 - 1709 Jan 8 | Evidence from Observations: Reported | |||||||||||||||||||||||
|
List of 3 Events for Episode 1
|
||||||||||||||||||||||||
1706 Nov 20 Confirmed Eruption (Explosive / Effusive) VEI: 2
| Episode 1 | Eruption (Explosive / Effusive) | |||||||||||||||||||
|---|---|---|---|---|---|---|---|---|---|---|---|---|---|---|---|---|---|---|---|
| 1706 Nov 20 - Unknown | Evidence from Observations: Reported | ||||||||||||||||||
|
List of 2 Events for Episode 1
|
|||||||||||||||||||
1704 Feb 5 - 1704 Feb 9 Confirmed Eruption (Explosive / Effusive) VEI: 2
| Episode 1 | Eruption (Explosive / Effusive) | ||||||||||||||||||||||||
|---|---|---|---|---|---|---|---|---|---|---|---|---|---|---|---|---|---|---|---|---|---|---|---|---|
| 1704 Feb 5 - 1704 Feb 9 | Evidence from Observations: Reported | |||||||||||||||||||||||
|
List of 3 Events for Episode 1
|
||||||||||||||||||||||||
1703 Confirmed Eruption (Explosive / Effusive) VEI: 2
| Episode 1 | Eruption (Explosive / Effusive) | |||||||||||||||||||
|---|---|---|---|---|---|---|---|---|---|---|---|---|---|---|---|---|---|---|---|
| 1703 - Unknown | Evidence from Observations: Reported | ||||||||||||||||||
|
List of 2 Events for Episode 1
|
|||||||||||||||||||
1695 Jun 23 Confirmed Eruption (Explosive / Effusive) VEI: 2
| Episode 1 | Eruption (Explosive / Effusive) | ||||||||||||||||||||||||
|---|---|---|---|---|---|---|---|---|---|---|---|---|---|---|---|---|---|---|---|---|---|---|---|---|
| 1695 Jun 23 - Unknown | Evidence from Observations: Reported | |||||||||||||||||||||||
|
List of 3 Events for Episode 1
|
||||||||||||||||||||||||
1669 Apr 5 - 1669 Apr 15 Confirmed Eruption (Explosive / Effusive) VEI: 2
| Episode 1 | Eruption (Explosive / Effusive) | |||||||||||||||||||
|---|---|---|---|---|---|---|---|---|---|---|---|---|---|---|---|---|---|---|---|
| 1669 Apr 5 - 1669 Apr 15 | Evidence from Observations: Reported | ||||||||||||||||||
|
List of 2 Events for Episode 1
|
|||||||||||||||||||
1661 Oct 21 Confirmed Eruption (Explosive / Effusive) VEI: 2
| Episode 1 | Eruption (Explosive / Effusive) | |||||||||||||||||||
|---|---|---|---|---|---|---|---|---|---|---|---|---|---|---|---|---|---|---|---|
| 1661 Oct 21 - Unknown | Evidence from Observations: Reported | ||||||||||||||||||
|
List of 2 Events for Episode 1
|
|||||||||||||||||||
1661 Apr 14 - 1661 Apr 27 Confirmed Eruption (Explosive / Effusive) VEI: 2
| Episode 1 | Eruption (Explosive / Effusive) | |||||||||||||||||||
|---|---|---|---|---|---|---|---|---|---|---|---|---|---|---|---|---|---|---|---|
| 1661 Apr 14 - 1661 Apr 27 | Evidence from Observations: Reported | ||||||||||||||||||
|
List of 2 Events for Episode 1
|
|||||||||||||||||||
1660 Apr 8 (?) Confirmed Eruption (Explosive / Effusive) VEI: 2
| Episode 1 | Eruption (Explosive / Effusive) | |||||||||||||||||||
|---|---|---|---|---|---|---|---|---|---|---|---|---|---|---|---|---|---|---|---|
| 1660 Apr 8 (?) - Unknown | Evidence from Observations: Reported | ||||||||||||||||||
|
List of 2 Events for Episode 1
|
|||||||||||||||||||
1659 Jul 24 Confirmed Eruption (Explosive / Effusive) VEI: 2
| Episode 1 | Eruption (Explosive / Effusive) | |||||||||||||||||||
|---|---|---|---|---|---|---|---|---|---|---|---|---|---|---|---|---|---|---|---|
| 1659 Jul 24 - Unknown | Evidence from Observations: Reported | ||||||||||||||||||
|
List of 2 Events for Episode 1
|
|||||||||||||||||||
1658 Jul 24 Confirmed Eruption (Explosive / Effusive) VEI: 2
| Episode 1 | Eruption (Explosive / Effusive) | |||||||||||||||||||
|---|---|---|---|---|---|---|---|---|---|---|---|---|---|---|---|---|---|---|---|
| 1658 Jul 24 - Unknown | Evidence from Observations: Reported | ||||||||||||||||||
|
List of 2 Events for Episode 1
|
|||||||||||||||||||
1657 Nov 25 Confirmed Eruption (Explosive / Effusive) VEI: 2
| Episode 1 | Eruption (Explosive / Effusive) | |||||||||||||||||||
|---|---|---|---|---|---|---|---|---|---|---|---|---|---|---|---|---|---|---|---|
| 1657 Nov 25 - Unknown | Evidence from Observations: Reported | ||||||||||||||||||
|
List of 2 Events for Episode 1
|
|||||||||||||||||||
1656 Dec 10 Confirmed Eruption (Explosive / Effusive) VEI: 2
| Episode 1 | Eruption (Explosive / Effusive) | |||||||||||||||||||
|---|---|---|---|---|---|---|---|---|---|---|---|---|---|---|---|---|---|---|---|
| 1656 Dec 10 - Unknown | Evidence from Observations: Reported | ||||||||||||||||||
|
List of 2 Events for Episode 1
|
|||||||||||||||||||
1655 Nov 25 Confirmed Eruption (Explosive / Effusive) VEI: 2
| Episode 1 | Eruption (Explosive / Effusive) | |||||||||||||||||||
|---|---|---|---|---|---|---|---|---|---|---|---|---|---|---|---|---|---|---|---|
| 1655 Nov 25 - Unknown | Evidence from Observations: Reported | ||||||||||||||||||
|
List of 2 Events for Episode 1
|
|||||||||||||||||||
[ 1653 - 1654 ] Uncertain Eruption
| Episode 1 | Eruption (Explosive / Effusive) | |||||||||||||||||||
|---|---|---|---|---|---|---|---|---|---|---|---|---|---|---|---|---|---|---|---|
| 1653 - 1654 | Evidence from Unknown | ||||||||||||||||||
|
List of 2 Events for Episode 1
|
|||||||||||||||||||
1652 Apr 12 Confirmed Eruption (Explosive / Effusive) VEI: 2
| Episode 1 | Eruption (Explosive / Effusive) | |||||||||||||||||||
|---|---|---|---|---|---|---|---|---|---|---|---|---|---|---|---|---|---|---|---|
| 1652 Apr 12 - Unknown | Evidence from Observations: Reported | ||||||||||||||||||
|
List of 2 Events for Episode 1
|
|||||||||||||||||||
1651 Apr 12 Confirmed Eruption (Explosive / Effusive) VEI: 2
| Episode 1 | Eruption (Explosive / Effusive) | |||||||||||||||||||
|---|---|---|---|---|---|---|---|---|---|---|---|---|---|---|---|---|---|---|---|
| 1651 Apr 12 - Unknown | Evidence from Observations: Reported | ||||||||||||||||||
|
List of 2 Events for Episode 1
|
|||||||||||||||||||
[ 1650 Jul 2 (?) ] Uncertain Eruption
| Episode 1 | Eruption (Explosive / Effusive) | |||||||||||||||||||
|---|---|---|---|---|---|---|---|---|---|---|---|---|---|---|---|---|---|---|---|
| 1650 Jul 2 (?) - Unknown | Evidence from Unknown | ||||||||||||||||||
|
List of 2 Events for Episode 1
|
|||||||||||||||||||
1649 Aug 17 (?) - 1649 Aug 18 (?) Confirmed Eruption (Explosive / Effusive) VEI: 2
| Episode 1 | Eruption (Explosive / Effusive) | |||||||||||||||||||
|---|---|---|---|---|---|---|---|---|---|---|---|---|---|---|---|---|---|---|---|
| 1649 Aug 17 (?) - 1649 Aug 18 (?) | Evidence from Observations: Reported | ||||||||||||||||||
|
List of 2 Events for Episode 1
|
|||||||||||||||||||
1648 Aug 30 (?) Confirmed Eruption (Explosive / Effusive) VEI: 2
| Episode 1 | Eruption (Explosive / Effusive) | |||||||||||||||||||
|---|---|---|---|---|---|---|---|---|---|---|---|---|---|---|---|---|---|---|---|
| 1648 Aug 30 (?) - Unknown | Evidence from Observations: Reported | ||||||||||||||||||
|
List of 2 Events for Episode 1
|
|||||||||||||||||||
1648 Mar 20 (?) Confirmed Eruption (Explosive / Effusive) VEI: 2
| Episode 1 | Eruption (Explosive / Effusive) | ||||||||||||||||||||||||
|---|---|---|---|---|---|---|---|---|---|---|---|---|---|---|---|---|---|---|---|---|---|---|---|---|
| 1648 Mar 20 (?) - Unknown | Evidence from Observations: Reported | |||||||||||||||||||||||
|
List of 3 Events for Episode 1
|
||||||||||||||||||||||||
1647 Feb 18 - 1647 Mar 25 Confirmed Eruption (Explosive / Effusive) VEI: 2
| Episode 1 | Eruption (Explosive / Effusive) | |||||||||||||||||||
|---|---|---|---|---|---|---|---|---|---|---|---|---|---|---|---|---|---|---|---|
| 1647 Feb 18 - 1647 Mar 25 | Evidence from Observations: Reported | ||||||||||||||||||
|
List of 2 Events for Episode 1
|
|||||||||||||||||||
1645 Feb 24 (?) - 1645 May 21 Confirmed Eruption (Explosive / Effusive) VEI: 2
| Episode 1 | Eruption (Explosive / Effusive) | |||||||||||||||||||
|---|---|---|---|---|---|---|---|---|---|---|---|---|---|---|---|---|---|---|---|
| 1645 Feb 24 (?) - 1645 May 21 | Evidence from Observations: Reported | ||||||||||||||||||
|
List of 2 Events for Episode 1
|
|||||||||||||||||||
1644 Feb 20 Confirmed Eruption (Explosive / Effusive) VEI: 2
| Episode 1 | Eruption (Explosive / Effusive) | |||||||||||||||||||
|---|---|---|---|---|---|---|---|---|---|---|---|---|---|---|---|---|---|---|---|
| 1644 Feb 20 - Unknown | Evidence from Observations: Reported | ||||||||||||||||||
|
List of 2 Events for Episode 1
|
|||||||||||||||||||
1609 Apr 5 Confirmed Eruption (Explosive / Effusive) VEI: 2
| Episode 1 | Eruption (Explosive / Effusive) | |||||||||||||||||||
|---|---|---|---|---|---|---|---|---|---|---|---|---|---|---|---|---|---|---|---|
| 1609 Apr 5 - Unknown | Evidence from Observations: Reported | ||||||||||||||||||
|
List of 2 Events for Episode 1
|
|||||||||||||||||||
1605 Dec - 1606 Feb Confirmed Eruption (Explosive / Effusive) VEI: 2
| Episode 1 | Eruption (Explosive / Effusive) | |||||||||||||||||||
|---|---|---|---|---|---|---|---|---|---|---|---|---|---|---|---|---|---|---|---|
| 1605 Dec - 1606 Feb | Evidence from Observations: Reported | ||||||||||||||||||
|
List of 2 Events for Episode 1
|
|||||||||||||||||||
[ 1604 ] Uncertain Eruption
| Episode 1 | Eruption (Explosive / Effusive) | |||||||||||||||||||
|---|---|---|---|---|---|---|---|---|---|---|---|---|---|---|---|---|---|---|---|
| 1604 - Unknown | Evidence from Unknown | ||||||||||||||||||
|
List of 2 Events for Episode 1
|
|||||||||||||||||||
1600 Jan 14 - 1600 Jan 28 (?) Confirmed Eruption (Explosive / Effusive) VEI: 3 (?)
| Episode 1 | Eruption (Explosive / Effusive) | ||||||||||||||||||||||||
|---|---|---|---|---|---|---|---|---|---|---|---|---|---|---|---|---|---|---|---|---|---|---|---|---|
| 1600 Jan 14 - 1600 Jan 28 (?) | Evidence from Observations: Reported | |||||||||||||||||||||||
|
List of 3 Events for Episode 1
|
||||||||||||||||||||||||
1598 May 13 Confirmed Eruption (Explosive / Effusive) VEI: 2
| Episode 1 | Eruption (Explosive / Effusive) | ||||||||||||||||||||||||
|---|---|---|---|---|---|---|---|---|---|---|---|---|---|---|---|---|---|---|---|---|---|---|---|---|
| 1598 May 13 - Unknown | Evidence from Observations: Reported | |||||||||||||||||||||||
|
List of 3 Events for Episode 1
|
||||||||||||||||||||||||
1597 Apr 17 Confirmed Eruption (Explosive / Effusive) VEI: 2
| Episode 1 | Eruption (Explosive / Effusive) | |||||||||||||||||||||||||||||
|---|---|---|---|---|---|---|---|---|---|---|---|---|---|---|---|---|---|---|---|---|---|---|---|---|---|---|---|---|---|
| 1597 Apr 17 - Unknown | Evidence from Observations: Reported | ||||||||||||||||||||||||||||
|
List of 4 Events for Episode 1
|
|||||||||||||||||||||||||||||
1596 May 1 - 1596 Sep Confirmed Eruption (Explosive / Effusive) VEI: 3
| Episode 1 | Eruption (Explosive / Effusive) | ||||||||||||||||||||||||
|---|---|---|---|---|---|---|---|---|---|---|---|---|---|---|---|---|---|---|---|---|---|---|---|---|
| 1596 May 1 - 1596 Sep | Evidence from Observations: Reported | |||||||||||||||||||||||
|
List of 3 Events for Episode 1
|
||||||||||||||||||||||||
1595 Jun 1 Confirmed Eruption (Explosive / Effusive) VEI: 2 (?)
| Episode 1 | Eruption (Explosive / Effusive) | |||||||||||||||||||
|---|---|---|---|---|---|---|---|---|---|---|---|---|---|---|---|---|---|---|---|
| 1595 Jun 1 - Unknown | Evidence from Observations: Reported | ||||||||||||||||||
|
List of 2 Events for Episode 1
|
|||||||||||||||||||
1591 Nov 29 Confirmed Eruption (Explosive / Effusive) VEI: 3 (?)
| Episode 1 | Eruption (Explosive / Effusive) | |||||||||||||||||||||||||||||
|---|---|---|---|---|---|---|---|---|---|---|---|---|---|---|---|---|---|---|---|---|---|---|---|---|---|---|---|---|---|
| 1591 Nov 29 - Unknown | Evidence from Observations: Reported | ||||||||||||||||||||||||||||
|
List of 4 Events for Episode 1
|
|||||||||||||||||||||||||||||
1591 Apr 15 ± 45 days Confirmed Eruption (Explosive / Effusive) VEI: 2 (?)
| Episode 1 | Eruption (Explosive / Effusive) | |||||||||||||||||||||||||||||
|---|---|---|---|---|---|---|---|---|---|---|---|---|---|---|---|---|---|---|---|---|---|---|---|---|---|---|---|---|---|
| 1591 Apr 15 ± 45 days - Unknown | Evidence from Observations: Reported | ||||||||||||||||||||||||||||
|
List of 4 Events for Episode 1
|
|||||||||||||||||||||||||||||
1590 Apr 15 ± 45 days Confirmed Eruption (Explosive / Effusive) VEI: 2 (?)
| Episode 1 | Eruption (Explosive / Effusive) | |||||||||||||||||||
|---|---|---|---|---|---|---|---|---|---|---|---|---|---|---|---|---|---|---|---|
| 1590 Apr 15 ± 45 days - Unknown | Evidence from Observations: Reported | ||||||||||||||||||
|
List of 2 Events for Episode 1
|
|||||||||||||||||||
1582 Jul 3 Confirmed Eruption (Explosive / Effusive) VEI: 2
| Episode 1 | Eruption (Explosive / Effusive) | ||||||||||||||||||||||||
|---|---|---|---|---|---|---|---|---|---|---|---|---|---|---|---|---|---|---|---|---|---|---|---|---|
| 1582 Jul 3 - Unknown | Evidence from Observations: Reported | |||||||||||||||||||||||
|
List of 3 Events for Episode 1
|
||||||||||||||||||||||||
1582 Feb 16 Confirmed Eruption (Explosive / Effusive) VEI: 2
| Episode 1 | Eruption (Explosive / Effusive) | ||||||||||||||||||||||||
|---|---|---|---|---|---|---|---|---|---|---|---|---|---|---|---|---|---|---|---|---|---|---|---|---|
| 1582 Feb 16 - Unknown | Evidence from Observations: Reported | |||||||||||||||||||||||
|
List of 3 Events for Episode 1
|
||||||||||||||||||||||||
[ 1534 ] Uncertain Eruption
| Episode 1 | Eruption (Explosive / Effusive) | ||||
|---|---|---|---|---|
| 1534 - Unknown | Evidence from Unknown | |||
[ 1532 Jan 14 ] Uncertain Eruption
| Episode 1 | Eruption (Explosive / Effusive) | ||||||||||||||||||||||||
|---|---|---|---|---|---|---|---|---|---|---|---|---|---|---|---|---|---|---|---|---|---|---|---|---|
| 1532 Jan 14 - Unknown | Evidence from Unknown | |||||||||||||||||||||||
|
List of 3 Events for Episode 1
|
||||||||||||||||||||||||
1528 Confirmed Eruption (Explosive / Effusive) VEI: 2
| Episode 1 | Eruption (Explosive / Effusive) | |||||||||||||||||||
|---|---|---|---|---|---|---|---|---|---|---|---|---|---|---|---|---|---|---|---|
| 1528 - Unknown | Evidence from Observations: Reported | ||||||||||||||||||
|
List of 2 Events for Episode 1
|
|||||||||||||||||||
1527 May Confirmed Eruption (Explosive / Effusive) VEI: 2
| Episode 1 | Eruption (Explosive / Effusive) | |||||||||||||||||||
|---|---|---|---|---|---|---|---|---|---|---|---|---|---|---|---|---|---|---|---|
| 1527 May - Unknown | Evidence from Observations: Reported | ||||||||||||||||||
|
List of 2 Events for Episode 1
|
|||||||||||||||||||
[ 1518 ] Uncertain Eruption
| Episode 1 | Eruption (Explosive / Effusive) | ||||||||||||||
|---|---|---|---|---|---|---|---|---|---|---|---|---|---|---|
| 1518 - Unknown | Evidence from Unknown | |||||||||||||
|
List of 1 Events for Episode 1
|
||||||||||||||
[ 1427 Jul 7 ] Uncertain Eruption
| Episode 1 | Eruption (Explosive / Effusive) | ||||||||||||||
|---|---|---|---|---|---|---|---|---|---|---|---|---|---|---|
| 1427 Jul 7 - Unknown | Evidence from Unknown | |||||||||||||
|
List of 1 Events for Episode 1
|
||||||||||||||
[ 1281 Jul 3 ] Uncertain Eruption
| Episode 1 | Eruption (Explosive / Effusive) | |||||||||||||||||||||||||||||
|---|---|---|---|---|---|---|---|---|---|---|---|---|---|---|---|---|---|---|---|---|---|---|---|---|---|---|---|---|---|
| 1281 Jul 3 - Unknown | Evidence from Unknown | ||||||||||||||||||||||||||||
|
List of 4 Events for Episode 1
|
|||||||||||||||||||||||||||||
[ 1128 ] Uncertain Eruption
| Episode 1 | Eruption (Explosive / Effusive) | |||||||||||||||||||
|---|---|---|---|---|---|---|---|---|---|---|---|---|---|---|---|---|---|---|---|
| 1128 - Unknown | Evidence from Unknown | ||||||||||||||||||
|
List of 2 Events for Episode 1
|
|||||||||||||||||||
1108 Aug 29 - 1108 Oct Confirmed Eruption (Explosive / Effusive) VEI: 5
| Episode 1 | Eruption (Explosive / Effusive) | |||||||||||||||||||||||||||||||||||||||||||||||||
|---|---|---|---|---|---|---|---|---|---|---|---|---|---|---|---|---|---|---|---|---|---|---|---|---|---|---|---|---|---|---|---|---|---|---|---|---|---|---|---|---|---|---|---|---|---|---|---|---|---|
| 1108 Aug 29 - 1108 Oct | Evidence from Observations: Reported | ||||||||||||||||||||||||||||||||||||||||||||||||
|
List of 8 Events for Episode 1
|
|||||||||||||||||||||||||||||||||||||||||||||||||
[ 0887 ] Discredited Eruption
0685 Apr Confirmed Eruption (Explosive / Effusive) VEI: 3
| Episode 1 | Eruption (Explosive / Effusive) | Volcano Uncertain | |||||||||||||||||||||||
|---|---|---|---|---|---|---|---|---|---|---|---|---|---|---|---|---|---|---|---|---|---|---|---|---|
| 0685 Apr - Unknown | Evidence from Unknown | |||||||||||||||||||||||
|
List of 3 Events for Episode 1 at Volcano Uncertain
|
||||||||||||||||||||||||
0350 Nov 15 ± 10 years ± 15 days Confirmed Eruption (Explosive / Effusive) VEI: 4
| Episode 1 | Eruption (Explosive / Effusive) | As-C tephra | |||||||||||||||||||||||||||||||||
|---|---|---|---|---|---|---|---|---|---|---|---|---|---|---|---|---|---|---|---|---|---|---|---|---|---|---|---|---|---|---|---|---|---|---|
| 0350 Nov 15 ± 10 years ± 15 days - Unknown | Evidence from Correlation: Anthropology | |||||||||||||||||||||||||||||||||
|
List of 5 Events for Episode 1 at As-C tephra
|
||||||||||||||||||||||||||||||||||
1130 BCE ± 1430 years Confirmed Eruption (Explosive / Effusive)
| Episode 1 | Eruption (Explosive / Effusive) | |||||||||||||||||||
|---|---|---|---|---|---|---|---|---|---|---|---|---|---|---|---|---|---|---|---|
| 1130 BCE ± 1430 years - Unknown | Evidence from Correlation: Tephrochronology | ||||||||||||||||||
|
List of 2 Events for Episode 1
|
|||||||||||||||||||
2550 BCE ± 500 years Confirmed Eruption (Explosive / Effusive) VEI: 4
| Episode 1 | Eruption (Explosive / Effusive) | As-D tephra layers | |||||||||||||||||||||||
|---|---|---|---|---|---|---|---|---|---|---|---|---|---|---|---|---|---|---|---|---|---|---|---|---|
| 2550 BCE ± 500 years - Unknown | Evidence from Correlation: Anthropology | |||||||||||||||||||||||
|
List of 3 Events for Episode 1 at As-D tephra layers
|
||||||||||||||||||||||||
3450 BCE (?) Confirmed Eruption (Explosive / Effusive) VEI: 3
| Episode 1 | Eruption (Explosive / Effusive) | As-E tephra | |||||||||||||||||||||||
|---|---|---|---|---|---|---|---|---|---|---|---|---|---|---|---|---|---|---|---|---|---|---|---|---|
| 3450 BCE (?) - Unknown | Evidence from Isotopic: 14C (uncalibrated) | |||||||||||||||||||||||
|
List of 3 Events for Episode 1 at As-E tephra
|
||||||||||||||||||||||||
4100 BCE ± 100 years Confirmed Eruption (Explosive / Effusive)
| Episode 1 | Eruption (Explosive / Effusive) | ||||||||||||||||||||||||
|---|---|---|---|---|---|---|---|---|---|---|---|---|---|---|---|---|---|---|---|---|---|---|---|---|
| 4100 BCE ± 100 years - Unknown | Evidence from Isotopic: 14C (calibrated) | |||||||||||||||||||||||
|
List of 3 Events for Episode 1
|
||||||||||||||||||||||||
4700 BCE ± 500 years Confirmed Eruption (Explosive / Effusive)
| Episode 1 | Eruption (Explosive / Effusive) | AM-10 tephra | ||||||||||||||||||
|---|---|---|---|---|---|---|---|---|---|---|---|---|---|---|---|---|---|---|---|
| 4700 BCE ± 500 years - Unknown | Evidence from Correlation: Tephrochronology | ||||||||||||||||||
|
List of 2 Events for Episode 1 at AM-10 tephra
|
|||||||||||||||||||
6400 BCE ± 1050 years Confirmed Eruption (Explosive / Effusive)
| Episode 1 | Eruption (Explosive / Effusive) | |||||||||||||||||||
|---|---|---|---|---|---|---|---|---|---|---|---|---|---|---|---|---|---|---|---|
| 6400 BCE ± 1050 years - Unknown | Evidence from Correlation: Tephrochronology | ||||||||||||||||||
|
List of 2 Events for Episode 1
|
|||||||||||||||||||
7200 BCE ± 200 years Confirmed Eruption (Explosive / Effusive)
| Episode 1 | Eruption (Explosive / Effusive) | |||||||||||||||||||
|---|---|---|---|---|---|---|---|---|---|---|---|---|---|---|---|---|---|---|---|
| 7200 BCE ± 200 years - Unknown | Evidence from Isotopic: 14C (calibrated) | ||||||||||||||||||
|
List of 2 Events for Episode 1
|
|||||||||||||||||||
This compilation of synonyms and subsidiary features may not be comprehensive. Features are organized into four major categories: Cones, Craters, Domes, and Thermal Features. Synonyms of features appear indented below the primary name. In some cases additional feature type, elevation, or location details are provided.
Synonyms |
||||
| Asama | ||||
Cones |
||||
| Feature Name | Feature Type | Elevation | Latitude | Longitude |
| Hotokeiwa | Shield volcano | |||
| Kama-yama | Pyroclastic cone | 2568 m | 36° 24' 12.00" N | 138° 31' 34.00" E |
| Kurofu-yama | Stratovolcano | 2405 m | ||
| Maekake-yama | Stratovolcano | 2493 m | 36° 23' 56.00" N | 138° 31' 10.00" E |
Craters |
||||
| Feature Name | Feature Type | Elevation | Latitude | Longitude |
| Okama | Crater | |||
Domes |
||||
| Feature Name | Feature Type | Elevation | Latitude | Longitude |
| Hanare-yama | Dome | 1256 m | ||
| Ko-Asama-yama | Dome | 1655 m | ||
| Sekison-zan | Dome | 1667 m | ||
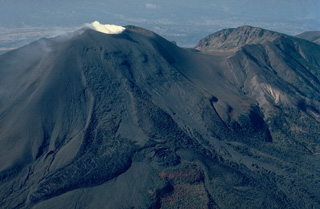 Asama, Honshu's most active volcano, has an historical record dating back more than 1300 years. The modern cone of Maekake-yama, shown steaming here at the left, is situated east of the horseshoe-shaped remnant of an older andesitic volcano, Kurofu-yama (right), that was destroyed by a late-Pleistocene landslide about 20,000 years ago. Maekake-yama is probably only a few thousand years old, but has had several major plinian eruptions, the last two of which occurred in 1108 and 1783 CE.
 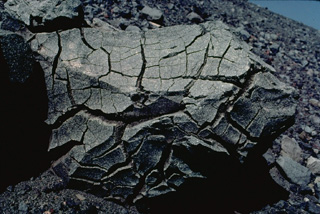 The surface texture of this large volcanic bomb suggests its name. Breadcrust bombs are produced when the surface of a newly ejected block cools and fractures while degassing inflates the still-hot interior. This roughly 1-m-wide breadcrust bomb was ejected onto the rim of Asama volcano in Japan.
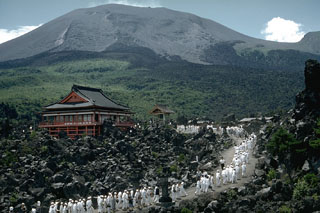 The Onioshidashi lava flow on the N flank of Asamayama volcano was erupted at the end of the last major eruption in 1783. Asamayama has a historical record dating back more than 1,300 years. The Maekakeyama summit in the center was constructed within an open crater whose rim appears on the horizon to the far-right
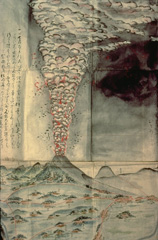 This contemporary painting depicts the 1783 eruption, one of the largest historical eruptions of Asama. It began with moderate explosions on May 9 and in late June and mid July. Activity intensified beginning July 25, and the culminating stage took place August 3-5. On August 4 and 5, the Agatsuma and Kambara pyroclastic flows swept the north flank, the latter destroying several villages, and along with associated lahars, caused 1377 fatalities. Emplacement of the Onioshidashi lava flow on the north flank concluded the eruption.
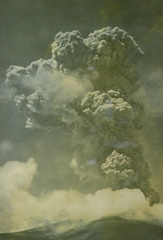 A 4-km-high eruption plume rises above the summit of Asama volcano on June 24, 1954. Frequent small explosive eruptions had begun in December 1953 and continued until June 1955. A large vulcanian eruption occurred on June 11, 1955. Activity ended with a small explosion on August 2, 1955.
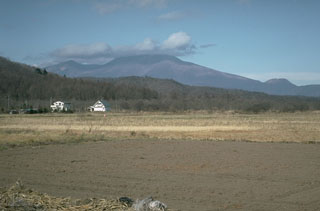 Asamayama is seen in here from the SE. The summit cone of Maekakeyama was constructed within an east-facing collapse scarp from the failure of Kurofuyama, whose rim forms the peak to the left of Maekakeyama. Ko-Asamayama is a flank lava dome that visible on the lower-right horizon.
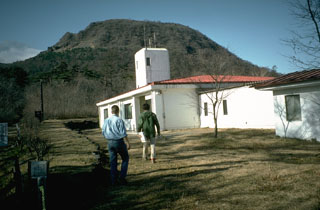 The Asamayama Volcano Observatory, operated by the University of Tokyo, is a base for geological, geophysical, and geochemical monitoring of the active volcano. The observatory is located on the E flank below Ko-Asamayama, the late-Pleistocene lava dome in the background that formed about 18,000 years ago.
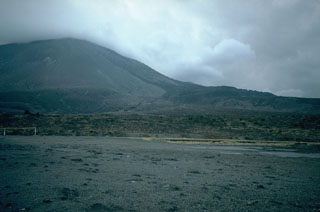 This view of Asamayama from the NE shows deposits of one of the largest historical eruptions of the volcano. The flat surface in the foreground is a pyroclastic flow deposit from the 1783 eruption. Behind it is the 1783 Onioshidashi lava flow that descended the north flank near the right horizon. The 1783 eruption began on 9 May and devastating pyroclastic flows and lahars on 4 and 5 August caused many fatalities. The lava flow was emplaced at the end the eruption, which ceased on 5 August.
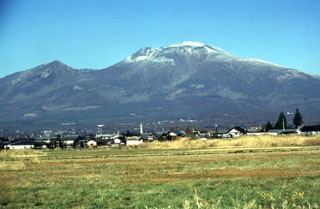 Asama, one of Honshu's most active volcanoes, is seen here from the SE. The snow-capped modern cone of Maekakeyama (center) was constructed within an open collapse scar resulting from the failure of Kurofuyama, an older cone forming the lower peak to the left. The E-facing escarpment of Kurofuyama was created by a large volcanic landslide about 20,000 years ago. Maekakeyama is probably only a few thousand years old, but has had several major Plinian eruptions, two of which occurred in 1108 and 1783 CE.
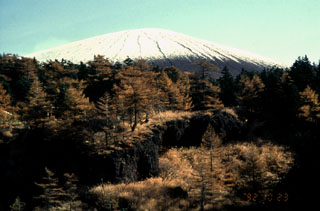 The gully in the foreground below Maekakeyama exposes deposits of the Oiwake pyroclastic flow, which was emplaced during a major explosive eruption in 1108 CE. This Plinian eruption, the largest from Asama during the Holocene, produced 0.4 km3 of asfall followed by emplacement of the 0.6 km3 Oiwake pyroclastic flow and the Butai lava flow down the NW flank from the crater. The summit of Maekakeyama collapsed after this eruption to form a 0.9 x 1.3 km crater.
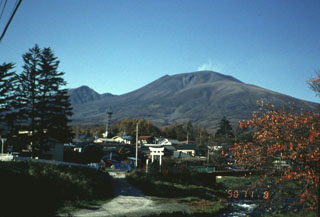 A faint plume rises above the summit of Asama behing the resort city of Karuizawa, immediately SE of the volcano. Asama is one of the most active volcanoes in Honshu and ash from its eruptions occasionally reach Tokyo.
The following 5 samples associated with this volcano can be found in the Smithsonian's NMNH Department of Mineral Sciences collections, and may be availble for research (contact the Rock and Ore Collections Manager). Catalog number links will open a window with more information.
| Catalog Number | Sample Description | Lava Source | Collection Date |
|---|---|---|---|
| NMNH 105653-00 | Osumilite | -- | -- |
| NMNH 113869 | Hypersthene Andesite | -- | -- |
| NMNH 116589-2 | Pumice | -- | -- |
| NMNH 116589-3 | Pumice | -- | -- |
| NMNH 116691-29 | Pumice | -- | -- |
| Copernicus Browser | The Copernicus Browser replaced the Sentinel Hub Playground browser in 2023, to provide access to Earth observation archives from the Copernicus Data Space Ecosystem, the main distribution platform for data from the EU Copernicus missions. |
| MIROVA | Middle InfraRed Observation of Volcanic Activity (MIROVA) is a near real time volcanic hot-spot detection system based on the analysis of MODIS (Moderate Resolution Imaging Spectroradiometer) data. In particular, MIROVA uses the Middle InfraRed Radiation (MIR), measured over target volcanoes, in order to detect, locate and measure the heat radiation sourced from volcanic activity. |
| MODVOLC Thermal Alerts | Using infrared satellite Moderate Resolution Imaging Spectroradiometer (MODIS) data, scientists at the Hawai'i Institute of Geophysics and Planetology, University of Hawai'i, developed an automated system called MODVOLC to map thermal hot-spots in near real time. For each MODIS image, the algorithm automatically scans each 1 km pixel within it to check for high-temperature hot-spots. When one is found the date, time, location, and intensity are recorded. MODIS looks at every square km of the Earth every 48 hours, once during the day and once during the night, and the presence of two MODIS sensors in space allows at least four hot-spot observations every two days. Each day updated global maps are compiled to display the locations of all hot spots detected in the previous 24 hours. There is a drop-down list with volcano names which allow users to 'zoom-in' and examine the distribution of hot-spots at a variety of spatial scales. |
|
WOVOdat
Single Volcano View Temporal Evolution of Unrest Side by Side Volcanoes |
WOVOdat is a database of volcanic unrest; instrumentally and visually recorded changes in seismicity, ground deformation, gas emission, and other parameters from their normal baselines. It is sponsored by the World Organization of Volcano Observatories (WOVO) and presently hosted at the Earth Observatory of Singapore.
GVMID Data on Volcano Monitoring Infrastructure The Global Volcano Monitoring Infrastructure Database GVMID, is aimed at documenting and improving capabilities of volcano monitoring from the ground and space. GVMID should provide a snapshot and baseline view of the techniques and instrumentation that are in place at various volcanoes, which can be use by volcano observatories as reference to setup new monitoring system or improving networks at a specific volcano. These data will allow identification of what monitoring gaps exist, which can be then targeted by remote sensing infrastructure and future instrument deployments. |
| Volcanic Hazard Maps | The IAVCEI Commission on Volcanic Hazards and Risk has a Volcanic Hazard Maps database designed to serve as a resource for hazard mappers (or other interested parties) to explore how common issues in hazard map development have been addressed at different volcanoes, in different countries, for different hazards, and for different intended audiences. In addition to the comprehensive, searchable Volcanic Hazard Maps Database, this website contains information about diversity of volcanic hazard maps, illustrated using examples from the database. This site is for educational purposes related to volcanic hazard maps. Hazard maps found on this website should not be used for emergency purposes. For the most recent, official hazard map for a particular volcano, please seek out the proper institutional authorities on the matter. |
| IRIS seismic stations/networks | Incorporated Research Institutions for Seismology (IRIS) Data Services map showing the location of seismic stations from all available networks (permanent or temporary) within a radius of 0.18° (about 20 km at mid-latitudes) from the given location of Asamayama. Users can customize a variety of filters and options in the left panel. Note that if there are no stations are known the map will default to show the entire world with a "No data matched request" error notice. |
| UNAVCO GPS/GNSS stations | Geodetic Data Services map from UNAVCO showing the location of GPS/GNSS stations from all available networks (permanent or temporary) within a radius of 20 km from the given location of Asamayama. Users can customize the data search based on station or network names, location, and time window. Requires Adobe Flash Player. |
| DECADE Data | The DECADE portal, still in the developmental stage, serves as an example of the proposed interoperability between The Smithsonian Institution's Global Volcanism Program, the Mapping Gas Emissions (MaGa) Database, and the EarthChem Geochemical Portal. The Deep Earth Carbon Degassing (DECADE) initiative seeks to use new and established technologies to determine accurate global fluxes of volcanic CO2 to the atmosphere, but installing CO2 monitoring networks on 20 of the world's 150 most actively degassing volcanoes. The group uses related laboratory-based studies (direct gas sampling and analysis, melt inclusions) to provide new data for direct degassing of deep earth carbon to the atmosphere. |
| Large Eruptions of Asamayama | Information about large Quaternary eruptions (VEI >= 4) is cataloged in the Large Magnitude Explosive Volcanic Eruptions (LaMEVE) database of the Volcano Global Risk Identification and Analysis Project (VOGRIPA). |
| EarthChem | EarthChem develops and maintains databases, software, and services that support the preservation, discovery, access and analysis of geochemical data, and facilitate their integration with the broad array of other available earth science parameters. EarthChem is operated by a joint team of disciplinary scientists, data scientists, data managers and information technology developers who are part of the NSF-funded data facility Integrated Earth Data Applications (IEDA). IEDA is a collaborative effort of EarthChem and the Marine Geoscience Data System (MGDS). |

