Report on Campi Flegrei (Italy) — August 2012
Bulletin of the Global Volcanism Network, vol. 37, no. 8 (August 2012)
Managing Editor: Richard Wunderman.
Campi Flegrei (Italy) Analysis of seismic swarms (Mw =1.9; ~219 events) during September 2012
Please cite this report as:
Global Volcanism Program, 2012. Report on Campi Flegrei (Italy) (Wunderman, R., ed.). Bulletin of the Global Volcanism Network, 37:8. Smithsonian Institution. https://doi.org/10.5479/si.GVP.BGVN201208-211010
Campi Flegrei
Italy
40.827°N, 14.139°E; summit elev. 458 m
All times are local (unless otherwise noted)
219 low-magnitude earthquakes occurred at Campi Flegrei during September 2012, a comparatively large number with respect to the previous year (figure 22). The earthquakes chiefly were contained within two swarms (with events up to Mw 1.9; Mw indicates moment magnitude) occurring on 7 and 15 September. Peak ground accelerations (PGA) were non-trivial (up to ~0.5 g), and some earthquakes were widely felt by area residents. Analysis revealed that the strain release rate of the 7 September swarm fell within values seen for other swarms during the last 20 years. The observations reported by the Vesuvius Observatory (who provided the material for this report) were limited to those associated with the earthquakes and related seismic analysis. Other reporting on topics such as deformation appears on the Observatory's website (see Information Contacts, below). The observatory is part of Italy's National Institute of Geophysics and Volcanology (INGV).
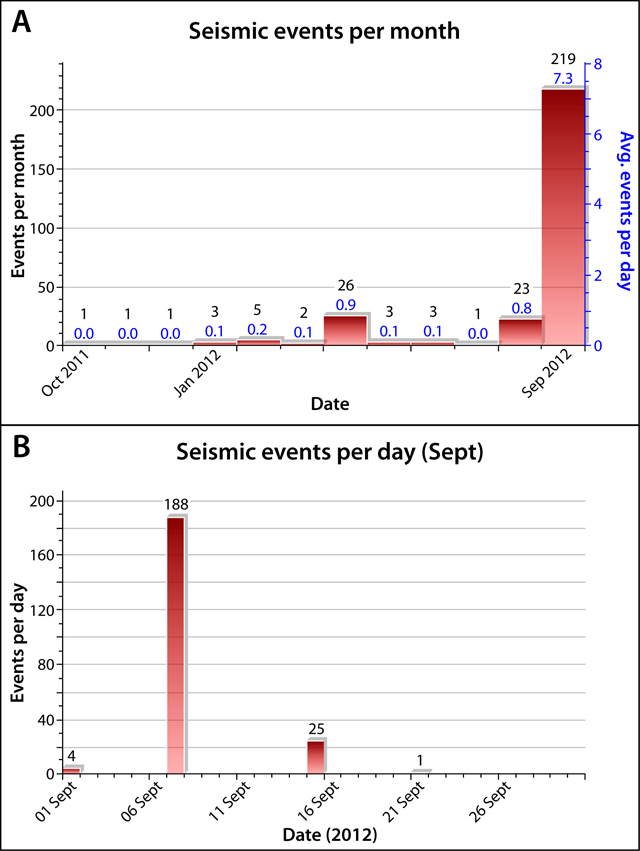 |
Figure 22. Campi Flegrei earthquake count recorded between October 2011 and the end of September 2012. (A) The number of earthquakes recorded per month during October 2011-September 2012 (288 total events). (B) The number of earthquakes recorded during September 2012 alone (219 total events), highlighting the swarm of 188 events on 7 September. Courtesy of Vesuvius Observatory-INGV (Naples). |
Almost all of the earthqaukes that occurred during September took place in two swarms (figures 22 and 23). The first swarm occurred in the area of Pozzuoli during 0715-0935 UTC on 7 September. The two largest events of that swarm were Mw 1.9 (a duration magnitude, Md, value of 1.7; figure 24); these events were the largest recorded events of the prior year (figure 24A). The 7 September swarm was dominant over the 15 September swarm both in terms of the number and magnitude of events.
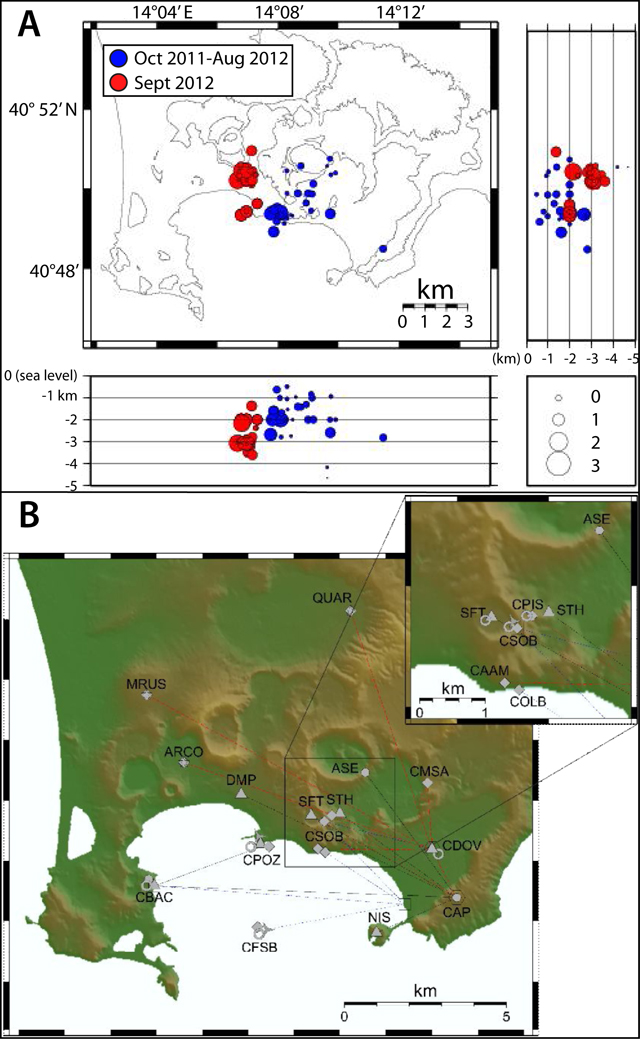 |
Figure 23. (A) Hypocentral locations registered at Campi Flegrei during October 2011-August 2012 (blue) and September 2012 (red). The size of the symbols is proportional to the magnitude, as shown in the lower right box. (B) A map with the seismic network at Campi Flegrei. The boxed area zooms in on the region where the two swarms occured. Courtesy of Vesuvius Observatory-INGV (Naples). |
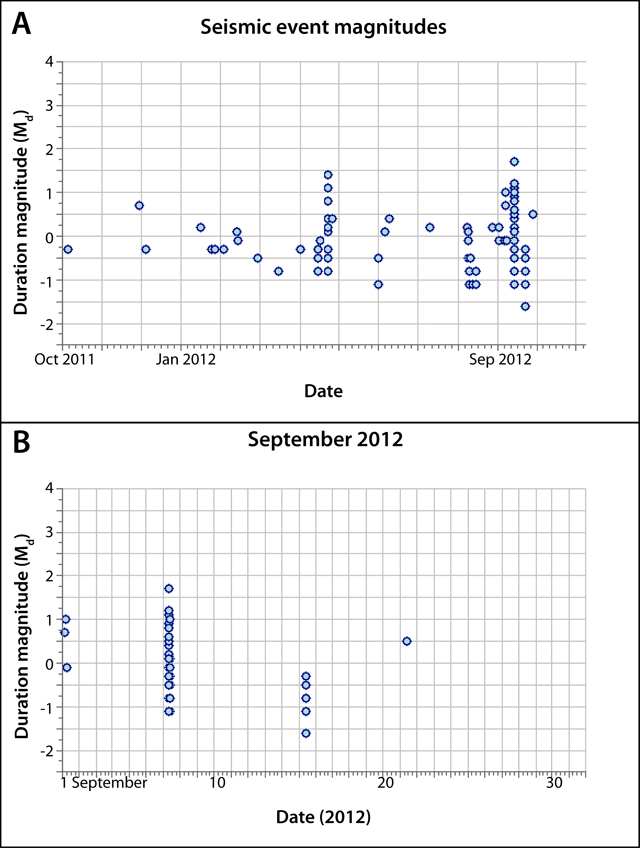 |
Figure 24. Magnitudes (duration magnitude, Md) of seismic events recorded at Campi Flegrei during October 2011-September 2012 (A). (B) shows the details of the computed magnitudes during the September 2012 seismic swarm. Courtesy of Vesuvius Observatory-INGV (Naples). |
The second swarm of September 2012 took place between 0901 and 1012 UTC on 15 September (figure 22), with the strongest events (Md -0.3) occurring at 0947 and 0954 UTC. This swarm was recorded by only one station (STH, Agnano, figure 23B) and thus was plausibly located in close proximity to that station at shallow depth. This swarm is absent on the depth plot in figure 25 (depth not available).
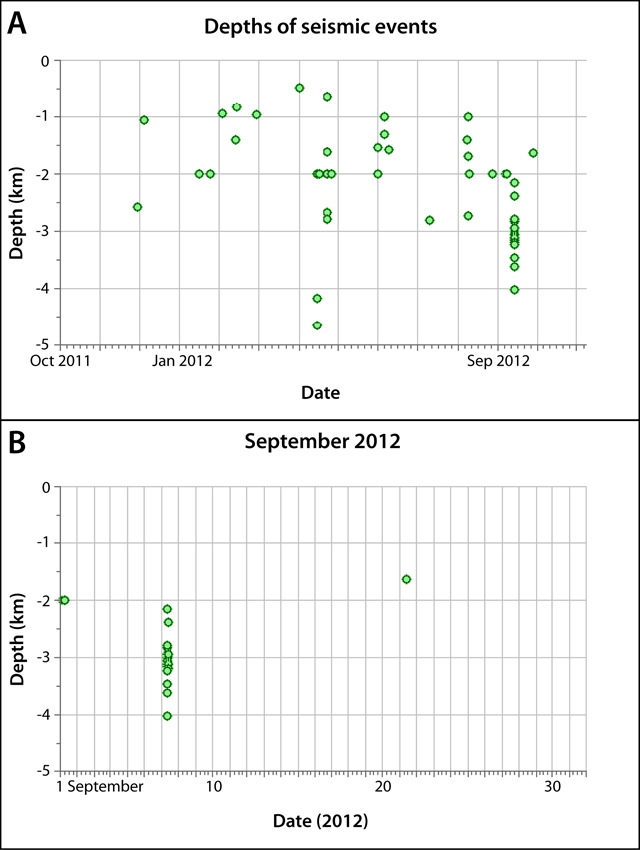 |
Figure 25. Time series plots of the hypocentral depths of seismic events recorded at Campi Flegrei during October 2011-September 2012 (A) and during September 2012 (B) showing details of the September 2012 seismic swarm. Courtesy of Vesuvius Observatory-INGV (Naples). |
The hypocenters of 49 events were determined during September 2012; their depths were generally less than 4 km (figures 23 and 25). The seismological parameters did not show significant anomalies (figures 24 and 25). However, September 2012 was the most seismically energetic time period of the prior year (figure 26); seismicity during September produced >3 times the cumulative energy released during the preceding year.
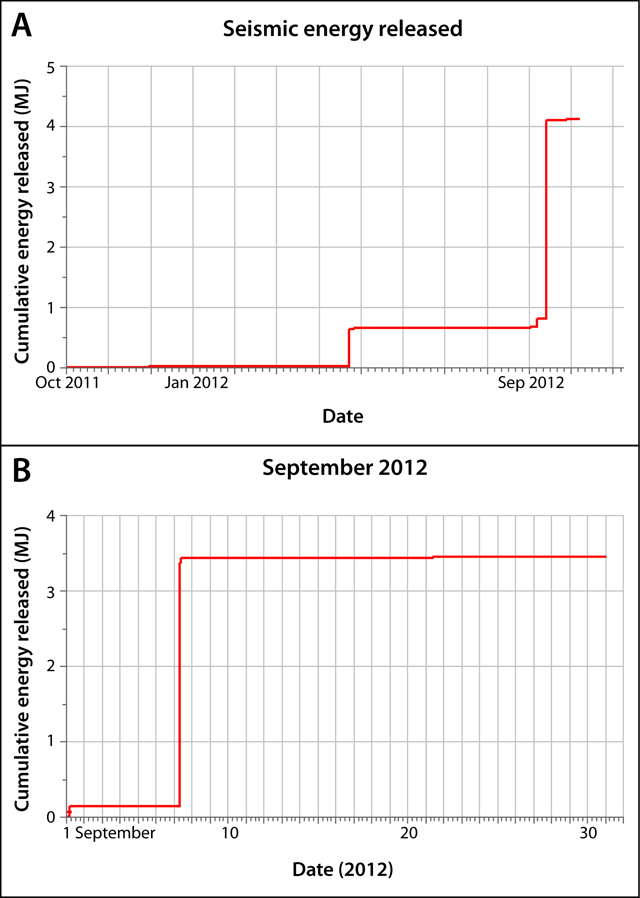 |
Figure 26. Cumulative seismic energy released at Campi Flegrei during (A) October 2011-September 2012 and (B) September 2012. Courtesy of Vesuvius Observatory-INGV (Naples). |
Analysis of the 7 September seismic swarm. For the two main events (0734 and 0825 UTC) on 7 September, source parameters were determined from S-wave displacement spectra (results shown in figure 27).
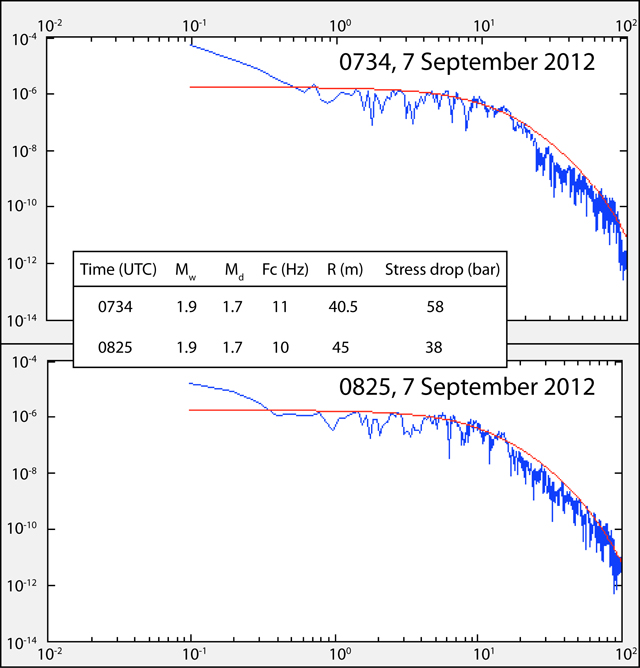 |
Figure 27. Displacement spectra (blue) for the S-waves of the largest events in the 7 September 2012 seismic swarm, occurring at 0734 (top) and 0825 UTC (bottom). The red curves represent the fit with a theoretical model. The displacement spectra were obtained from the records of the accelerometer CPOZ (Pozzuoli, figure 23B). The tabulated values display the computed source parameters for each event: Mw, moment magnitude; Md, duration magnitude; Fc, corner frequency; R (m), source radius, and stress drop (bars). For discussion of source parameters see Mooney (1989). Courtesy of Vesuvius Observatory-INGV (Naples). |
The duration and strain release of the 7 September swarm were similar to other seismic swarms at Campi Flegrei since at least 1994 (figure 28).
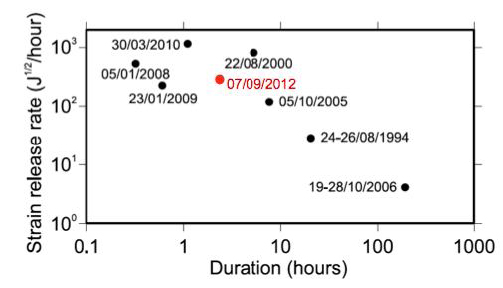 |
Figure 28. A plot showing duration and strain release rate for Campi Flegrei seismic swarms since 1994. Courtesy of Vesuvius Observatory-INGV (Naples). |
Some of the events in the swarm were widely felt in the urban area of Pozzuoli. Peak ground acceleration values (PGA, units of %g, the acceleration due to gravity) recorded by the accelerometer in Pozzuoli (CPOZ, figure 23B) show two prominent peaks corresponding to the two largest events that occurred at 0734 and 0825 UTC (figure 29).
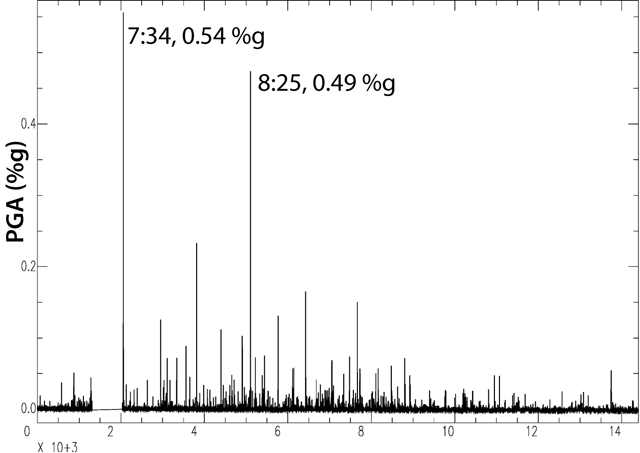 |
Figure 29. Peak ground acceleration values (PGA, in units of %g, the acceleration due to gravity) recorded by the accelerometer CPOZ (Pozzuoli, figure 23B) between 0700 and 1100 UTC on 7 September 2012. The visible gap in the data between 0722 and 0733 was caused by technical problems in the data transmission system. The two largest events are labelled with their timestamps and PGA values. Courtesy of Vesuvius Observatory-INGV (Naples). |
Reference. Mooney, W.D., 1989. Seismic methods for determining earthquake source parameters and lithospheric structure, in Pakiser, L.C. and Mooney, W.D. (eds), Geophysical framework of the continental United States, Geological Society of America Memoir 172.
Geological Summary. Campi Flegrei is a 13-km-wide caldera that encompasses part of Naples and extends to the south beneath the Gulf of Pozzuoli. Episodes of significant uplift and subsidence within the dominantly trachytic caldera have occurred since Roman times. The earliest known eruptive products are dated 47,000 years BP. The caldera formed following two large explosive eruptions, the massive Campanian ignimbrite about 36,000 BP, and the over 40 km3 Neapolitan Yellow Tuff (NYT) about 15,000 BP. Following eruption of the NYT a large number of eruptions originated from widely scattered subaerial and submarine vents. Most activity occurred during three intervals: 15,000-9,500, 8,600-8,200, and 4,800-3,800 BP. The latest eruption were in 1158 CE at Solfatara and activity in 1538 CE that formed the Monte Nuovo cinder cone.
Information Contacts: Vesuvius Observatory, National Institute of Geophysics and Volcanology (INGV), Via Diocleziano 328, 80124 Napoli, Italy (URL: http://www.ov.ingv.it/ov/).