The Pusat Vulkanologi dan Mitigasi Bencana Geologi (PVMBG) reported that activity at Ruang had decreased following the 17 and 30 April 2024 eruptions. During September-December 2025 white emissions decreased in height to 10-50 m above the summit. Volcanic seismicity was generally low; during the previous three months seismicity was dominated by distant tectonic earthquakes, with 0-3 deep volcanic (VT) earthquakes per day. The Alert Level was lowered to 1 (the lowest level on a scale of 1-4) at 1000 on 10 December and the public was warned to stay 500 m away from the active crater.
Source: Pusat Vulkanologi dan Mitigasi Bencana Geologi (PVMBG, also known as CVGHM)
Eruption on 25 September 2002 is the largest in Indonesia in many years
The 25 September 2002 eruption of Ruang (BGVN 27:10 and 28:08) was, according to the Darwin Volcanic Ash Advisory Center (VAAC), the largest in Indonesia for many years and was well observed by satellite sensors. The eruption cloud reached a height of ~ 20 km, and a pyroclastic flow toward the SE damaged an area 1.6 km². Although no village was hit by the pyroclastic flow, two were heavily damaged by very thick ash material.
The Darwin VAAC and Bureau of Meteorology have published images and animations of the eruption clouds (figure 2). The satellites and images included those from Aqua/MODIS, GMS Java Animation, and AVHRR sensors. Some ash clouds dispersed towards Singapore and Jakarta. A higher level cloud remained nearly stationary near the tropopause (the top of the troposphere, where most of the Earth's weather occurs). The highest cloud moved eastwards in the stratosphere. The color/shading reflects the strength of the detected ash signal.
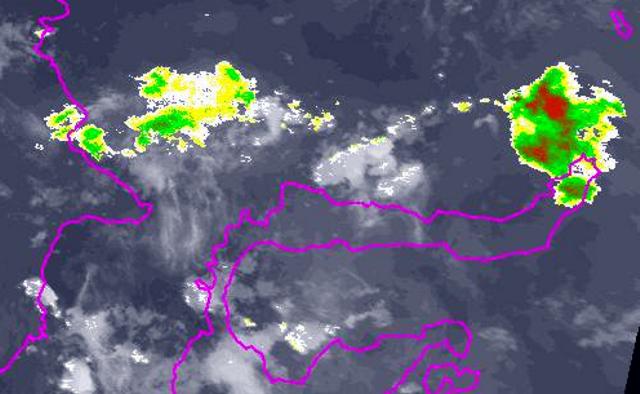 |
Figure 2. Night-time infrared image of the Ruang eruption processed to highlight volcanic ash. N is towards the top; the local island margins are shown, Sulawesi to the right and Borneo to the left. The enhanced areas disclose the W portion of the plume drifting over Borneo and the higher E ash and gas cloud nearly stationary over the eruption site. A third area of ash and ice cloud is nearly invisible near the bottom center. Courtesy of NASA, NOAA, and the Darwin VAAC. |
The TOMS scientists published an image on their website (figure 3), described as follows: "The TOMS overpass on September 25 was too early to capture the fresh eruption cloud, but ash and SO2 were evident on the following day. The aerosol signal over S Borneo is at least partly due to smoke from biomass burning; the ash cloud from Ruang can be seen over NE Borneo. A data gap may be obscuring any SO2 or ash immediately W of Ruang."
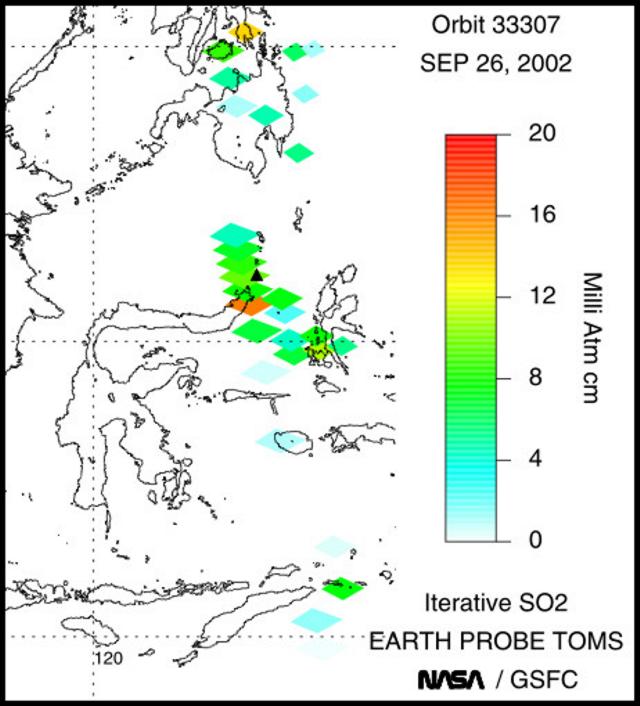 |
Figure 3. Ruang erupted on 25 September 2002. A pass the next day of the Earth Probe satellite with the Total Ozone Mapping Spectrometer (TOMS) instrument yielded this map of SO2 concentrations. Courtesy of Simon Carn and Arlin Krueger. |
Information Contacts: Darwin Volcanic Ash Advisory Center (VAAC), Commonwealth Bureau of Meteorology, Northern Territory Regional Office, PO Box 40050, Casuarina, NT 0811, Australia (URL: http://www.bom.gov.au/info/vaac/); Nia Haerani, Directorate of Volcanology and Geological Hazards (formerly VSI), Jalan Diponegoro No 57, Bandung 40122, Indonesia (URL: http://www.vsi.esdm.go.id/); Simon A. Carn and Arlin Krueger, Joint Center for Earth Systems Technology (NASA/UMBC), University of Maryland, Baltimore County, 1000 Hilltop Circle, Baltimore, MD 21250, USA (URL: https://so2.gsfc.nasa.gov/).
2025: December
2024: April
| May
2022: April
| June
2015: March
| June
2002: September
| October
The Pusat Vulkanologi dan Mitigasi Bencana Geologi (PVMBG) reported that activity at Ruang had decreased following the 17 and 30 April 2024 eruptions. During September-December 2025 white emissions decreased in height to 10-50 m above the summit. Volcanic seismicity was generally low; during the previous three months seismicity was dominated by distant tectonic earthquakes, with 0-3 deep volcanic (VT) earthquakes per day. The Alert Level was lowered to 1 (the lowest level on a scale of 1-4) at 1000 on 10 December and the public was warned to stay 500 m away from the active crater.
Source: Pusat Vulkanologi dan Mitigasi Bencana Geologi (PVMBG, also known as CVGHM)
On 15 May BNPB reported that a total of 9,343 residents of Tagulandang and Ruang islands remained in evacuation centers because of eruptions from Ruang. According to PVMBG daily white steam-and-gas plumes that were sometimes dense rose as high as 700 m above the summit and drifted in multiple directions during 15-21 May. The Alert Level was lowered to 2 (the second lowest level on a scale of 1-4) at 0900 on 18 May and the public was warned to stay 2 km away from the active crater.
Sources: Badan Nacional Penanggulangan Bencana (BNPB); Pusat Vulkanologi dan Mitigasi Bencana Geologi (PVMBG, also known as CVGHM)
PVMBG reported that during 1-12 May seismicity at Ruang was characterized by decreasing numbers of volcanic earthquakes and continuous tremor with decreasing amplitudes. During 8-13 May white plumes rose 200-400 m above the summit and drifted in multiple directions. The Alert Level was lowered to 3 (the second highest level on a scale of 1-4) and the public was warned to stay 4 km away from the active crater.
Source: Pusat Vulkanologi dan Mitigasi Bencana Geologi (PVMBG, also known as CVGHM)
PVMBG reported that seismicity at Ruang during 1-2 May was characterized by continuous tremors along with both deep and shallow volcanic earthquakes. The number of seismic events was decreasing based on a seismic station at the Ruang Post, 5 km from the crater; two closer stations, 1.5 and 2.7 km from the crater, had been damaged by eruptions. During 1-4 and 7 May white-and-gray ash plumes that were sometimes dense rose 100-700 m above the summit and drifted in multiple directions. Dense white steam-and-gas plumes rose 100-450 m above the summit and drifted NE, E, and S during 5-7 May.
On 5 May PVMBG reduced the exclusion zone from a 7 km radius around the active crater to 5 km. According to news reports a total of 5,849 residents of Tagulandang Island had been evacuated by 5 May; additional evacuations were halted after the exclusion zone was changed. The Sam Ratulangi International Airport (98 km SW in Manado, North Sulawesi) reopened on 5 May, though several airports remained closed including Djalaludin Airport in Gorongtalo, Siau Airport in the Sitaro Islands, Naha Airport in the Sangihe Islands, Lolakndi Bolaang Mongondow Airport, Miangas Airport, and Melonguane Airport in the Talaud Islands. The Alert Level remained at 4 (the highest level on a scale of 1-4).
Sources: Pusat Vulkanologi dan Mitigasi Bencana Geologi (PVMBG, also known as CVGHM); Antara News; Antara News; Antara News; Antara News
PVMBG reported that seismicity significantly increased at Ruang on 29 April and the signals indicated magma moving towards the surface. Earthquakes began to be felt at 0015 on 30 April. At 0115 the earthquakes intensified; residents in neighboring Tagulandang Island reportedly felt continuous shaking, heard loud roaring, and saw an ash plume rising about 2 km above the summit. Activity continued to escalate and at 0130 the Alert Level was raised to 4 (the highest level on a scale of 1-4). The public was warned to stay 7 km away from the active crater and residents on Tagulandang within 6 km were instructed to evacuate. A webcam photo from 0232 on 30 April showed lava being ejected above the summit; an eruptive event was recorded in seismic data at 0235. According to the Darwin VAAC ash plumes had risen to 15.2 km (50,000 ft) a.s.l. by 0300 and to 19.2 km (63,000 ft) a.s.l. by 0320, and by 0620 were expanding radially; the plumes may have risen to 23 km (75,400 ft) a.s.l. or more based on other expert analysis.
PVMBG noted that at 0835 dense gray-to-black ash plumes rose at least 5 km and drifted E and S. A webcam photo from 0827 showed multiple pyroclastic density currents descending the flanks. According to a characterization by BNPB the eruption ejected incandescent lava high above the summit and lightning was frequently seen in the plumes. Tephra fell over a more extensive area compared the 16-18 April eruption phase; gravel-sized tephra fell in Apengsala, about 8 km NNE from Ruang’s central vent, and outside of the exclusion zone. According to a news report residents felt shock waves from the explosions. At least three eruptive events were recorded during 1200-1800 that produced gray-and-black ash plumes at least as high as 1.5 km. The VAAC noted that by 1510 the high-level plume had detached from the summit and was drifting W and SW, and ash between 13.7-19.2 km (45,000-63,000 ft) a.s.l. continued to be identified drifting WNW at least through 0940 on 1 May. Ash plumes continued to be identified in satellite images, rising to 3 km (10,000 ft) a.s.l. and drifting N and SE at least through 1240 on 1 May.
According to a news report the eruption and the presence of ash and ashfall caused the closure of seven airports, scheduled to reopen on 1 May: the Sam Ratulangi International Airport (98 km SW in Manado, North Sulawesi), the Gorontalo Airport (371 km SW), the Siau/Sitaro Airport (40 km N), the Bolaang Mongondow Airport (215 km SW), the Tahuna/Naha Airport (150 km N), the Pohuwato Airport (445 SW), and the Pogogul Airport (460 km WSW). On 1 May about 123 residents were evacuated to Bitung City by boat. Ashfall was notable at the Sam Ratulangi International Airport with delays affecting about 7,000 passengers.
Sources: Pusat Vulkanologi dan Mitigasi Bencana Geologi (PVMBG, also known as CVGHM); Badan Nacional Penanggulangan Bencana (BNPB); Darwin Volcanic Ash Advisory Centre (VAAC); Andrew Tupper, Natural Hazards Consulting; Antara News; Antara News; Antara News; Antara News; Antara News
PVMBG raised the Alert Level for Ruang to 2 (on a scale of 1-4) at 1300 on 16 April due to intensifying seismicity. A minor eruption began at around 1337 on 16 April and produced dense white emissions; at 1600 the Alert Level was raised to 3 (on a scale of 1-4). Explosive activity began at 2145 and ash plumes rose 2 km above the summit. Activity continued to escalate. An explosive pulse was recorded at 0108 on 17 April. According to the Darwin VAAC ash plumes had risen to 9.1 km (30,000 ft) a.s.l. and drifted W by 0230, and at 0300 they reached 12.2 km (40,000 ft) a.s.l. and detached from the summit. Ash plumes at a lower altitude of 4.6 km (15,000 ft) a.s.l. drifted WSW. BNPB reported that 828 people from Pumpente and Laingpatehi villages evacuated to neighboring Tagulandang Island to the NE and the communication network in Laingpatehi village was non-operational. Photos showed incandescent material being ejected above the summit, incandescent material on the flanks, pyroclastic density currents descending the flanks, and dense ash plumes with lightning rising into dark, nighttime skies. Another explosive pulse was recorded at 0505 according to PVMBG, and the VAAC noted that by 0600 ash plumes had risen to 13.7 km (45,000 ft) a.s.l. and drifted W and NW. The plume was detached from the summit by 0713. Additional smaller eruptive events produced ash plumes that rose to 1.5 km (5,000 ft) a.s.l. and drifted E.
PVMBG recorded bigger eruptive pulses at 1800 and 2015 on 17 April. Roaring and booming noises were sometimes heard, with gray-to-black ash plumes at 2015 and a felt earthquake. According to the VAAC ash plumes rose to 15.2 km (50,000 ft) a.s.l. by 2000 and at least to 19.2 km (63,000 ft) a.s.l. by 2020; the plumes drifted NW. PVMBG raised the Alert Level to 4, the highest level, at 2100 on 17 April noting that seismicity continued to increase, ash plumes were getting taller, and incandescent rocks were ejected as far as 5 km with some reaching Tagulandang Island. The public was warned to stay 6 km away from Ruang’s main crater. Several residents in Tagulandang were hit with tephra and some received medical treatment according to BNPB. Ashfall was recorded in as many as 10 villages in two sub-districts on Tagulandang and in several sub-districts of North Minahasa Regency (75 km SSW) including West Likupang, Wori, East Likupang, and South Likupang. Communication networks in Lumbo Village on Tagulandang were not properly functioning. An estimated 6,045 people living in the W part Tagulandang evacuated. According to a news article, there was damage to more than 3,000 homes, two churches, and an elementary school.
Multiple ash layers were identified in a satellite image 2310 on 17 April according to the VAAC; ash at 16.8 km (55,000 ft) a.s.l. drifted NW and E and ash at 14.3 km (47,000 ft) a.s.l. drifted WSW. At 0310 on 18 April ash plumes rose to 12.2 km and drifted WNW and W and detached from the volcano by 0600; earlier high-level plumes continued to expand as they drifted NW. According to a news report the Sam Ratulangi International Airport, 98 km SW in Manado, North Sulawesi, closed on 18 April due to the presence of ash.
The VAAC continued to track the plumes; lower-altitude plumes at 7.6 km (25,000 ft) a.s.l. drifted SE. The higher plumes, between 10.7-15.2 km (35,000-50,000 ft) a.s.l., continued to drift NW and WNW and had dissipated by 1710 on 19 April, though sulfur dioxide continued to be tracked W. Weather clouds began to obscure the plumes. On 19 April PVMBG reported that ash plumes rose 400-750 m above the summit and drifted S. During 20-21 April the VAAC issued notifications of ash plumes rising 1.5-2.1 km (5,000-7,000 ft) a.s.l. and drifting S and SW based on satellite images and information from PVMBG. The closure of the Sam Ratulangi International Airport affected 150 flights and about 19,085 passengers as of 20 April based on a news report; the airport resumed operations at noon on 22 April. PVMBG reported that during 21-23 April dense white steam-and-gas plumes rose as high as 200 m and drifted SW, W, and NW. The Alert Level was lowered to 3 at 0900 on 22 April because activity had decreased. Residents were warned to stay 4 km away from the crater.
Sources: Pusat Vulkanologi dan Mitigasi Bencana Geologi (PVMBG, also known as CVGHM); Badan Nacional Penanggulangan Bencana (BNPB); Darwin Volcanic Ash Advisory Centre (VAAC); Antara News; Antara News; Tempo; VOI
PVMBG reported that the number of deep volcanic earthquakes at Ruang increased each day during 10-15 April, with the total number significantly higher than from the entire month of March. During the morning of 16 April dense white plumes were visible rising 200-500 m above the summit and seismicity intensified. At 1000 on 16 April the Alert Level was raised to 2 (on a scale of 1-4) and the public was warned to stay 2 km away from the crater.
A minor eruption began at around 1337 on 16 April. The Darwin VAAC noted that an ash plume was visible in a satellite image rising to 1.2 km (4,000 ft) a.s.l. and drifting SSW. At 1600 the Alert Level was raised to 3. According to a news article a larger eruption began at 2045 and ash plumes rose 2 km. The eruption intensified overnight during 16-17 April. The Darwin VAAC report that at 0230 on 17 April ash plumes rose to 9.1 km (30,000 ft) a.s.l. and drifted W; another plume at 0300 reached 12.2 km (40,000 ft) a.s.l. and detached from the summit. Ash plumes at a lower altitude, 4.6 km (15,000 ft) a.s.l., drifted WSW. At 0600 ash plumes rose to 13.7 km (45,000 ft) a.s.l. and drifted W and NW. The plume was detached from the summit by 0713. BNPB reported that 828 people evacuated and the communication network in Laingpatehi village was not operational. Photos showed incandescent material being ejected above the summit, incandescent material on the flanks, and dense ash plumes with lightning rising into dark, nighttime skies.
Sources: Pusat Vulkanologi dan Mitigasi Bencana Geologi (PVMBG, also known as CVGHM); Badan Nacional Penanggulangan Bencana (BNPB); Jakarta Post; Darwin Volcanic Ash Advisory Centre (VAAC)
An increased number of deep volcanic earthquakes at Ruang in April prompted PVMBG to raise the Alert Level to 2 (on a scale of 1-4). A total of 232 deep volcanic earthquakes were recorded by the seismic network during 1 April-22 June, with just over half of them occurring in early to mid-April. No data was recorded from 18 April through 11 May due to technical difficulties. The network recorded 6-20 events during 11-31 May and just 1-2 events during 1-21 June. PVMBG lowered the Alert Level to 1 on 23 June.
Source: Pusat Vulkanologi dan Mitigasi Bencana Geologi (PVMBG, also known as CVGHM)
PVMBG reported that at least 121 deep volcanic earthquakes at Ruang were recorded during 1-16 April, though the number of those events began to increase on 7 April. No visible changes to the crater were noted, but weather conditions sometimes prevented views. Seismicity significantly changed on 16 April, characterized by 50 deep volcanic earthquakes, two local tectonic earthquakes, and four felt earthquakes. That same day the Alert Level was raised to 2 (on a scale of 1-4) and residents and tourists were warned to stay 1.5 km away from the active craters and 2.5 km on the E, SE, S, and SW flanks. Elevated seismicity continued to be recorded through 18 April.
Source: Pusat Vulkanologi dan Mitigasi Bencana Geologi (PVMBG, also known as CVGHM)
PVMBG reported that seismicity at Ruang decreased from 14 March through 2 June. Emissions were unobserved during periods of clear weather from 1 May through 2 June. The Alert Level was lowered to 1 (on a scale of 1-4) on 3 June. Residents and tourists were warned not to approach the active craters.
Source: Pusat Vulkanologi dan Mitigasi Bencana Geologi (PVMBG, also known as CVGHM)
PVMBG reported that emissions from Ruang were unobserved during periods of clear weather from 1 January through 12 March. Seismicity increased starting on 6 March prompting PVMBG to raise the Alert Level to 2 (on a scale of 1-4) on 12 March. Residents and tourists were warned not to approach the craters within a 1.5-km radius.
Source: Pusat Vulkanologi dan Mitigasi Bencana Geologi (PVMBG, also known as CVGHM)
During 21-27 October, a thick low-level ash plume infrequently rose above Ruang. Rainfall on 23 October caused lahars to flow down the volcano's flanks during 1445-1545. Ruang remained at Alert Level 2 (on a scale of 1-4).
Source: Pusat Vulkanologi dan Mitigasi Bencana Geologi (PVMBG, also known as CVGHM)
VSI reported that following the 25 September Ruang eruption there was no significant volcanic activity; only thin white clouds rose 100 m above the summit. On 30 September VSI decreased the Alert Level at Ruang from 4 to 3 (on a scale of 1-4).
Sources: Pusat Vulkanologi dan Mitigasi Bencana Geologi (PVMBG, also known as CVGHM); Darwin Volcanic Ash Advisory Centre (VAAC)
VSI increased the Alert Level at Ruang to 4 (the highest level) when the volcano began to erupt on 25 September at 0100. During the 7-hour eruption an ash cloud rose 0.5-1 km above the summit. Ruang erupted again at 1140, producing an ash cloud that VSI reported rose to 5 km above the summit. According to the Darwin VAAC, satellite imagery revealed that an ash cloud reached ~16 km above the volcano. People living near the volcano at desa Pumpente and desa Laimpatehi were evacuated.
Sources: Pusat Vulkanologi dan Mitigasi Bencana Geologi (PVMBG, also known as CVGHM); Darwin Volcanic Ash Advisory Centre (VAAC)
Reports are organized chronologically and indexed below by Month/Year (Publication Volume:Number), and include a one-line summary. Click on the index link or scroll down to read the reports.
Plume observed in late June
Pilots from Qantas Airlines reported an eruption around 1600 on 27 June. A plume moved W and reached an altitude of about 6,000 m. However, the eruption was not visible in GMS satellite imagery.
Information Contacts: Bureau of Meteorology, Northern Territory Regional Office, P.O. Box 735, Darwin, NT 0801 Australia; NOAA/NESDIS Satellite Analysis Branch, Room 401, 5200 Auth Road, Camp Springs, MD 20746, USA.
Eruption on 25 September 2002 sends ash to at least 5 km
The last reported activity at Ruang occurred when Qantas Airlines pilots observed an eruption around 1600 on 27 June 1996 (BGVN 21:08). A resulting plume moved W and reached an altitude of ~6 km. However, the eruption was not visible in GMS satellite imagery. The last known confirmed eruption at Ruang occurred in 1949.
A drastic increase of seismic events - from 3 to 24 events/day - was observed on 24 September by the Volcanological Survey of Indonesia (VSI). The next day, people near the volcano reported hearing a noise, and ash eruptions began by 0100. By 0300 ash emissions were continuous, and ash began falling around Ruang island and the nearby island of Tagulandang. Observers reported that the sounds accompanying the eruption were weak. By 0400 more than 1,000 people living near the volcano were evacuated to a nearby island. Around 0800, the Alert Level advanced to the highest status (level 4).
The first strong eruption commenced at 1140 on 25 September, producing thick black clouds that rose 3 km. Ten minutes later, a second eruption sent ash clouds rising 5 km. At 1210 the activity subsided enough to observe glowing material on E flank. The specific eruption site has not been firmly established. It has been presumed by VSI that it originated from "Crater II" or "where the 1949 lava originated (E side of summit)." The eruption column was reported from ground-based observations as rising to at least 5 km, and by Darwin VAAC advisories as rising to about 17 km. According to the Darwin VAAC, satellite imagery revealed that the ash cloud drifted westward to Borneo and Sumatra. Satellite images from NOAA showed the plume drifting SW with other components drifting W (figure 1). By 30 September the volcano was quiet with only a thin white plume rising about 100 m. The Alert Level was reduced from 4 to 3 on 30 September 2002.
 |
Figure 1. Satellite imagery on 25 September 2002 showed a large eruption plume from Ruang. The volcano's location is shown by the arrow. The plume appears to branch into SW- and W-drifting components. Courtesy NOAA. |
Information Contacts: Volcanological Survey of Indonesia (VSI), Jalan Diponegoro No. 57, Bandung 40122, Indonesia (URL: http://www.vsi.esdm.go.id/); Darwin Volcanic Ash Advisory Center (VAAC), Bureau of Meteorology, Northern Territory Regional Office, P.O. Box 735, Darwin, NT 0801 Australia; NOAA/NESDIS Satellite Analysis Branch, Room 401, 5200 Auth Road, Camp Springs, MD 20746, USA.
Rapid decrease in activity following September 2002 eruption
Volcanic activity had decreased by 30 September 2002 after a strong eruption on the 25th. After the hazard status was lowered from Alert Level 4 to 3 on 30 September, it was dropped to Level 2 during the week of 7-13 October. However, activity continued to be higher than normal that week, with frequent strong emissions and "thick white ash" rising ~100 m above the summit. Emission earthquakes decreased (table 1). High-pressure plumes decreased in frequency from 14 October through 10 November, but "thick white ash" continued to rise from the summit. No ashfall was reported during October or November. Rainfall on 23 October caused a lahar. No volcanic or emission earthquakes were recorded during 4-10 November, and the Alert Level was reduced to level 1.
Table 1. Seismicity at Ruang, 7 October-10 November 2002. Courtesy of VSI.
| Date | Emission earthquakes | Tectonic earthquakes |
| 07 Oct-13 Oct 2002 | 3 | 46 |
| 14 Oct-20 Oct 2002 | 6 | 39 |
| 21 Oct-27 Oct 2002 | 2 | 85 |
| 28 Oct-03 Nov 2002 | 2 | 63 |
| 04 Nov-10 Nov 2002 | -- | 58 |
Information Contacts: Dali Ahmad, Volcanological Survey of Indonesia (VSI), Jalan Diponegoro No. 57, Bandung 40122, Indonesia (URL: http://www.vsi. esdm.go.id/).
Eruption on 25 September 2002 is the largest in Indonesia in many years
The 25 September 2002 eruption of Ruang (BGVN 27:10 and 28:08) was, according to the Darwin Volcanic Ash Advisory Center (VAAC), the largest in Indonesia for many years and was well observed by satellite sensors. The eruption cloud reached a height of ~ 20 km, and a pyroclastic flow toward the SE damaged an area 1.6 km². Although no village was hit by the pyroclastic flow, two were heavily damaged by very thick ash material.
The Darwin VAAC and Bureau of Meteorology have published images and animations of the eruption clouds (figure 2). The satellites and images included those from Aqua/MODIS, GMS Java Animation, and AVHRR sensors. Some ash clouds dispersed towards Singapore and Jakarta. A higher level cloud remained nearly stationary near the tropopause (the top of the troposphere, where most of the Earth's weather occurs). The highest cloud moved eastwards in the stratosphere. The color/shading reflects the strength of the detected ash signal.
|
Figure 2. Night-time infrared image of the Ruang eruption processed to highlight volcanic ash. N is towards the top; the local island margins are shown, Sulawesi to the right and Borneo to the left. The enhanced areas disclose the W portion of the plume drifting over Borneo and the higher E ash and gas cloud nearly stationary over the eruption site. A third area of ash and ice cloud is nearly invisible near the bottom center. Courtesy of NASA, NOAA, and the Darwin VAAC. |
The TOMS scientists published an image on their website (figure 3), described as follows: "The TOMS overpass on September 25 was too early to capture the fresh eruption cloud, but ash and SO2 were evident on the following day. The aerosol signal over S Borneo is at least partly due to smoke from biomass burning; the ash cloud from Ruang can be seen over NE Borneo. A data gap may be obscuring any SO2 or ash immediately W of Ruang."
|
Figure 3. Ruang erupted on 25 September 2002. A pass the next day of the Earth Probe satellite with the Total Ozone Mapping Spectrometer (TOMS) instrument yielded this map of SO2 concentrations. Courtesy of Simon Carn and Arlin Krueger. |
Information Contacts: Darwin Volcanic Ash Advisory Center (VAAC), Commonwealth Bureau of Meteorology, Northern Territory Regional Office, PO Box 40050, Casuarina, NT 0811, Australia (URL: http://www.bom.gov.au/info/vaac/); Nia Haerani, Directorate of Volcanology and Geological Hazards (formerly VSI), Jalan Diponegoro No 57, Bandung 40122, Indonesia (URL: http://www.vsi.esdm.go.id/); Simon A. Carn and Arlin Krueger, Joint Center for Earth Systems Technology (NASA/UMBC), University of Maryland, Baltimore County, 1000 Hilltop Circle, Baltimore, MD 21250, USA (URL: https://so2.gsfc.nasa.gov/).
|
|
||||||||||||||||||||||||||
There is data available for 13 confirmed eruptive periods.
2024 Apr 16 - 2024 May 7 Confirmed Eruption (Explosive / Effusive) VEI: 4
| Episode 1 | Eruption (Explosive / Effusive) | ||||||||||||||||||||||||||||||||||||||||||||||||||||||||||||||||||||||||||||||||||||||||||||||||||||||||||||||||||||||||||||
|---|---|---|---|---|---|---|---|---|---|---|---|---|---|---|---|---|---|---|---|---|---|---|---|---|---|---|---|---|---|---|---|---|---|---|---|---|---|---|---|---|---|---|---|---|---|---|---|---|---|---|---|---|---|---|---|---|---|---|---|---|---|---|---|---|---|---|---|---|---|---|---|---|---|---|---|---|---|---|---|---|---|---|---|---|---|---|---|---|---|---|---|---|---|---|---|---|---|---|---|---|---|---|---|---|---|---|---|---|---|---|---|---|---|---|---|---|---|---|---|---|---|---|---|---|
| 2024 Apr 16 - 2024 May 7 | Evidence from Observations: Reported | |||||||||||||||||||||||||||||||||||||||||||||||||||||||||||||||||||||||||||||||||||||||||||||||||||||||||||||||||||||||||||
|
List of 23 Events for Episode 1
|
||||||||||||||||||||||||||||||||||||||||||||||||||||||||||||||||||||||||||||||||||||||||||||||||||||||||||||||||||||||||||||
2002 Sep 25 - 2002 Sep 29 (?) Confirmed Eruption (Explosive / Effusive) VEI: 4 (?)
| Episode 1 | Eruption (Explosive / Effusive) | ||||||||||||||||||||||||||||||||||||||||||||
|---|---|---|---|---|---|---|---|---|---|---|---|---|---|---|---|---|---|---|---|---|---|---|---|---|---|---|---|---|---|---|---|---|---|---|---|---|---|---|---|---|---|---|---|---|
| 2002 Sep 25 - 2002 Sep 29 (?) | Evidence from Observations: Reported | |||||||||||||||||||||||||||||||||||||||||||
|
List of 7 Events for Episode 1
|
||||||||||||||||||||||||||||||||||||||||||||
[ 1996 Jun 27 ] Uncertain Eruption
| Episode 1 | Eruption (Explosive / Effusive) | ||||||||||||||
|---|---|---|---|---|---|---|---|---|---|---|---|---|---|---|
| 1996 Jun 27 - Unknown | Evidence from Unknown | |||||||||||||
|
List of 1 Events for Episode 1
|
||||||||||||||
1949 Jan 5 - 1949 Jan 19 (on or after) Confirmed Eruption (Explosive / Effusive) VEI: 2
| Episode 1 | Eruption (Explosive / Effusive) | ||||||||||||||||||||||||||||||||||
|---|---|---|---|---|---|---|---|---|---|---|---|---|---|---|---|---|---|---|---|---|---|---|---|---|---|---|---|---|---|---|---|---|---|---|
| 1949 Jan 5 - 1949 Jan 19 (on or after) | Evidence from Observations: Reported | |||||||||||||||||||||||||||||||||
|
List of 5 Events for Episode 1
|
||||||||||||||||||||||||||||||||||
[ 1946 Oct 13 - 1946 Oct 15 ] Discredited Eruption
CAVW lists an explosive eruption during 13-15 October 1946, but Neuman Van Padang (1959), eight years after his CAVW compilation ,states there was no eruption between Petroeschevsky's observation of 480 degree solfataras in September 1946 and the January 1949 eruption.
[ 1940 Apr ] Discredited Eruption
Increased fumarolic activity only in 1940 and 1941 (Neumann van Padang, 1959).
[ 1918 Feb ] Discredited Eruption
Increased fumarolic activity only in 1918 (Neumann van Padang, 1959).
1914 May 29 - 1915 Feb 28 ± 30 days Confirmed Eruption (Explosive / Effusive) VEI: 2
| Episode 1 | Eruption (Explosive / Effusive) | Summit craters K2 and K3 | |||||||||||||||||||||||||||||||||
|---|---|---|---|---|---|---|---|---|---|---|---|---|---|---|---|---|---|---|---|---|---|---|---|---|---|---|---|---|---|---|---|---|---|---|
| 1914 May 29 - 1915 Feb 28 ± 30 days | Evidence from Observations: Reported | |||||||||||||||||||||||||||||||||
| Explosive eruption with nuees ardentes destroyed 1904 lava dome. Eruption continued, with interruptions, until first months of 1915. Summit craters K2 and K3 formed in this eruption (Neumann Van Padang 1959). | ||||||||||||||||||||||||||||||||||
|
List of 5 Events for Episode 1 at Summit craters K2 and K3
|
||||||||||||||||||||||||||||||||||
1904 Apr 22 - 1905 May 27 Confirmed Eruption (Explosive / Effusive) VEI: 3 (?)
| Episode 1 | Eruption (Explosive / Effusive) | |||||||||||||||||||||||||||||||||||||||||||||||||
|---|---|---|---|---|---|---|---|---|---|---|---|---|---|---|---|---|---|---|---|---|---|---|---|---|---|---|---|---|---|---|---|---|---|---|---|---|---|---|---|---|---|---|---|---|---|---|---|---|---|
| 1904 Apr 22 - 1905 May 27 | Evidence from Observations: Reported | ||||||||||||||||||||||||||||||||||||||||||||||||
|
List of 8 Events for Episode 1
|
|||||||||||||||||||||||||||||||||||||||||||||||||
1889 Jun Confirmed Eruption (Explosive / Effusive) VEI: 1
| Episode 1 | Eruption (Explosive / Effusive) | |||||||||||||||||||
|---|---|---|---|---|---|---|---|---|---|---|---|---|---|---|---|---|---|---|---|
| 1889 Jun - Unknown | Evidence from Observations: Reported | ||||||||||||||||||
|
List of 2 Events for Episode 1
|
|||||||||||||||||||
1874 Nov 15 Confirmed Eruption (Explosive / Effusive) VEI: 2
| Episode 1 | Eruption (Explosive / Effusive) | |||||||||||||||||||||||||||||
|---|---|---|---|---|---|---|---|---|---|---|---|---|---|---|---|---|---|---|---|---|---|---|---|---|---|---|---|---|---|
| 1874 Nov 15 - Unknown | Evidence from Observations: Reported | ||||||||||||||||||||||||||||
|
List of 4 Events for Episode 1
|
|||||||||||||||||||||||||||||
1871 Mar 2 - 1871 Mar 14 Confirmed Eruption (Explosive / Effusive) VEI: 2
| Episode 1 | Eruption (Explosive / Effusive) | |||||||||||||||||||||||||||||||||||||||||||||||||
|---|---|---|---|---|---|---|---|---|---|---|---|---|---|---|---|---|---|---|---|---|---|---|---|---|---|---|---|---|---|---|---|---|---|---|---|---|---|---|---|---|---|---|---|---|---|---|---|---|---|
| 1871 Mar 2 - 1871 Mar 14 | Evidence from Observations: Reported | ||||||||||||||||||||||||||||||||||||||||||||||||
|
List of 8 Events for Episode 1
|
|||||||||||||||||||||||||||||||||||||||||||||||||
1870 Aug 27 - 1870 Aug 28 Confirmed Eruption (Explosive / Effusive) VEI: 3 (?)
| Episode 1 | Eruption (Explosive / Effusive) | ||||||||||||||||||||||||||||||||||
|---|---|---|---|---|---|---|---|---|---|---|---|---|---|---|---|---|---|---|---|---|---|---|---|---|---|---|---|---|---|---|---|---|---|---|
| 1870 Aug 27 - 1870 Aug 28 | Evidence from Observations: Reported | |||||||||||||||||||||||||||||||||
|
List of 5 Events for Episode 1
|
||||||||||||||||||||||||||||||||||
1856 Sep Confirmed Eruption (Explosive / Effusive) VEI: 1
| Episode 1 | Eruption (Explosive / Effusive) | ||||||||||||||||||||||||
|---|---|---|---|---|---|---|---|---|---|---|---|---|---|---|---|---|---|---|---|---|---|---|---|---|
| 1856 Sep - Unknown | Evidence from Observations: Reported | |||||||||||||||||||||||
|
List of 3 Events for Episode 1
|
||||||||||||||||||||||||
1840 Confirmed Eruption (Explosive / Effusive) VEI: 2
| Episode 1 | Eruption (Explosive / Effusive) | ||||||||||||||||||||||||
|---|---|---|---|---|---|---|---|---|---|---|---|---|---|---|---|---|---|---|---|---|---|---|---|---|
| 1840 - Unknown | Evidence from Observations: Reported | |||||||||||||||||||||||
|
List of 3 Events for Episode 1
|
||||||||||||||||||||||||
1836 Apr 22 - 1836 Apr 24 Confirmed Eruption (Explosive / Effusive) VEI: 2
| Episode 1 | Eruption (Explosive / Effusive) | |||||||||||||||||||
|---|---|---|---|---|---|---|---|---|---|---|---|---|---|---|---|---|---|---|---|
| 1836 Apr 22 - 1836 Apr 24 | Evidence from Observations: Reported | ||||||||||||||||||
| Eruption during 22-24 April 1835 or 1836 listed by Neumann van Padang (1951, CAVW); Neumann van Padang (1959) listed the year as 1836. | |||||||||||||||||||
|
List of 2 Events for Episode 1
|
|||||||||||||||||||
1808 Confirmed Eruption (Explosive / Effusive) VEI: 2
| Episode 1 | Eruption (Explosive / Effusive) | |||||||||||||||||||||||||||||
|---|---|---|---|---|---|---|---|---|---|---|---|---|---|---|---|---|---|---|---|---|---|---|---|---|---|---|---|---|---|
| 1808 - Unknown | Evidence from Observations: Reported | ||||||||||||||||||||||||||||
| An eruption (no details) was reported in 1810 (Petroeschevsky and Klompe, 1951), but CAVW states that the 1810 and 1811 eruption reports seem to relate to an eruption in 1808. Neumann van Padang (1959) lists no 1810 event. | |||||||||||||||||||||||||||||
|
List of 4 Events for Episode 1
|
|||||||||||||||||||||||||||||
This compilation of synonyms and subsidiary features may not be comprehensive. Features are organized into four major categories: Cones, Craters, Domes, and Thermal Features. Synonyms of features appear indented below the primary name. In some cases additional feature type, elevation, or location details are provided.
Synonyms |
| Roeang | Roewang | Doeang | Doewang | Duwang | Duang |
There are no samples for Ruang in the Smithsonian's NMNH Department of Mineral Sciences Rock and Ore collection.
| Copernicus Browser | The Copernicus Browser replaced the Sentinel Hub Playground browser in 2023, to provide access to Earth observation archives from the Copernicus Data Space Ecosystem, the main distribution platform for data from the EU Copernicus missions. |
| MIROVA | Middle InfraRed Observation of Volcanic Activity (MIROVA) is a near real time volcanic hot-spot detection system based on the analysis of MODIS (Moderate Resolution Imaging Spectroradiometer) data. In particular, MIROVA uses the Middle InfraRed Radiation (MIR), measured over target volcanoes, in order to detect, locate and measure the heat radiation sourced from volcanic activity. |
| MODVOLC Thermal Alerts | Using infrared satellite Moderate Resolution Imaging Spectroradiometer (MODIS) data, scientists at the Hawai'i Institute of Geophysics and Planetology, University of Hawai'i, developed an automated system called MODVOLC to map thermal hot-spots in near real time. For each MODIS image, the algorithm automatically scans each 1 km pixel within it to check for high-temperature hot-spots. When one is found the date, time, location, and intensity are recorded. MODIS looks at every square km of the Earth every 48 hours, once during the day and once during the night, and the presence of two MODIS sensors in space allows at least four hot-spot observations every two days. Each day updated global maps are compiled to display the locations of all hot spots detected in the previous 24 hours. There is a drop-down list with volcano names which allow users to 'zoom-in' and examine the distribution of hot-spots at a variety of spatial scales. |
|
WOVOdat
Single Volcano View Temporal Evolution of Unrest Side by Side Volcanoes |
WOVOdat is a database of volcanic unrest; instrumentally and visually recorded changes in seismicity, ground deformation, gas emission, and other parameters from their normal baselines. It is sponsored by the World Organization of Volcano Observatories (WOVO) and presently hosted at the Earth Observatory of Singapore.
GVMID Data on Volcano Monitoring Infrastructure The Global Volcano Monitoring Infrastructure Database GVMID, is aimed at documenting and improving capabilities of volcano monitoring from the ground and space. GVMID should provide a snapshot and baseline view of the techniques and instrumentation that are in place at various volcanoes, which can be use by volcano observatories as reference to setup new monitoring system or improving networks at a specific volcano. These data will allow identification of what monitoring gaps exist, which can be then targeted by remote sensing infrastructure and future instrument deployments. |
| Volcanic Hazard Maps | The IAVCEI Commission on Volcanic Hazards and Risk has a Volcanic Hazard Maps database designed to serve as a resource for hazard mappers (or other interested parties) to explore how common issues in hazard map development have been addressed at different volcanoes, in different countries, for different hazards, and for different intended audiences. In addition to the comprehensive, searchable Volcanic Hazard Maps Database, this website contains information about diversity of volcanic hazard maps, illustrated using examples from the database. This site is for educational purposes related to volcanic hazard maps. Hazard maps found on this website should not be used for emergency purposes. For the most recent, official hazard map for a particular volcano, please seek out the proper institutional authorities on the matter. |
| IRIS seismic stations/networks | Incorporated Research Institutions for Seismology (IRIS) Data Services map showing the location of seismic stations from all available networks (permanent or temporary) within a radius of 0.18° (about 20 km at mid-latitudes) from the given location of Ruang. Users can customize a variety of filters and options in the left panel. Note that if there are no stations are known the map will default to show the entire world with a "No data matched request" error notice. |
| UNAVCO GPS/GNSS stations | Geodetic Data Services map from UNAVCO showing the location of GPS/GNSS stations from all available networks (permanent or temporary) within a radius of 20 km from the given location of Ruang. Users can customize the data search based on station or network names, location, and time window. Requires Adobe Flash Player. |
| DECADE Data | The DECADE portal, still in the developmental stage, serves as an example of the proposed interoperability between The Smithsonian Institution's Global Volcanism Program, the Mapping Gas Emissions (MaGa) Database, and the EarthChem Geochemical Portal. The Deep Earth Carbon Degassing (DECADE) initiative seeks to use new and established technologies to determine accurate global fluxes of volcanic CO2 to the atmosphere, but installing CO2 monitoring networks on 20 of the world's 150 most actively degassing volcanoes. The group uses related laboratory-based studies (direct gas sampling and analysis, melt inclusions) to provide new data for direct degassing of deep earth carbon to the atmosphere. |
| Large Eruptions of Ruang | Information about large Quaternary eruptions (VEI >= 4) is cataloged in the Large Magnitude Explosive Volcanic Eruptions (LaMEVE) database of the Volcano Global Risk Identification and Analysis Project (VOGRIPA). |
| EarthChem | EarthChem develops and maintains databases, software, and services that support the preservation, discovery, access and analysis of geochemical data, and facilitate their integration with the broad array of other available earth science parameters. EarthChem is operated by a joint team of disciplinary scientists, data scientists, data managers and information technology developers who are part of the NSF-funded data facility Integrated Earth Data Applications (IEDA). IEDA is a collaborative effort of EarthChem and the Marine Geoscience Data System (MGDS). |


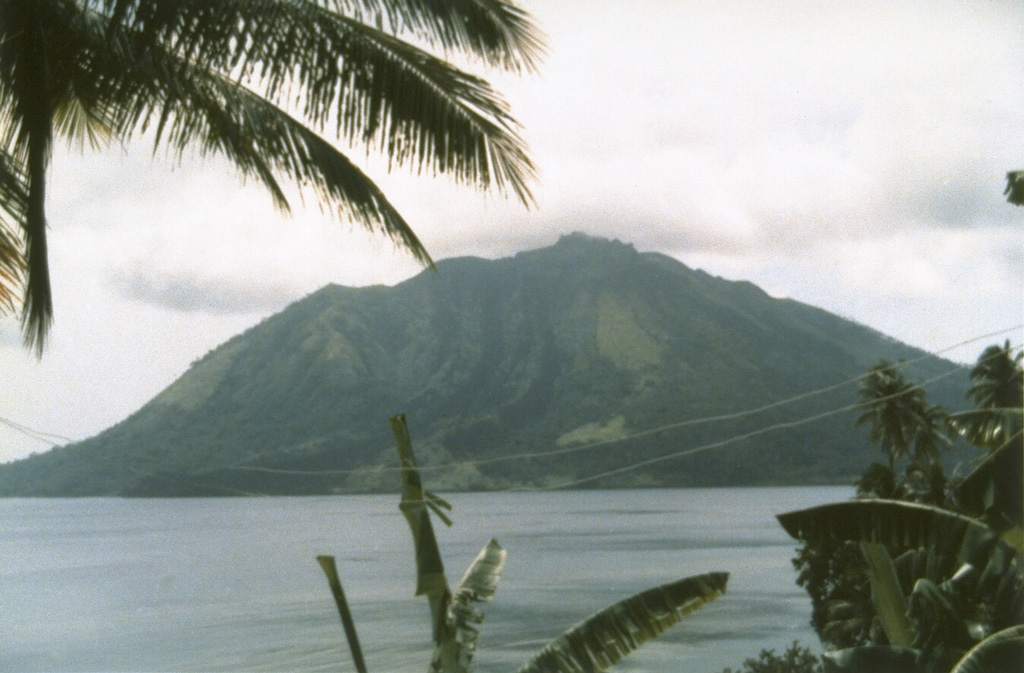
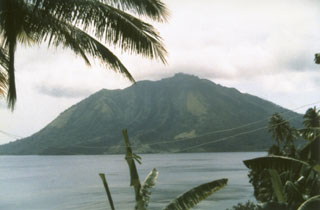 Ruang volcano, seen here from the nearby island of Tagulandang, forms a small 4 x 5 km island that is part of a chain of islands extending north from Sulawesi. Explosive eruptions, recorded in historical time since 1808, have been accompanied by pyroclastic flows and lava dome formation, and have frequently caused damage to populated areas.