Report on Sinabung (Indonesia) — January 2014
Bulletin of the Global Volcanism Network, vol. 39, no. 1 (January 2014)
Managing Editor: Richard Wunderman.
Sinabung (Indonesia) Dome eruption continues; fatal pyroclastic flow on 1 February 2014
Please cite this report as:
Global Volcanism Program, 2014. Report on Sinabung (Indonesia) (Wunderman, R., ed.). Bulletin of the Global Volcanism Network, 39:1. Smithsonian Institution. https://doi.org/10.5479/si.GVP.BGVN201401-261080
Sinabung
Indonesia
3.17°N, 98.392°E; summit elev. 2460 m
All times are local (unless otherwise noted)
The latest eruption of Sinabung volcano began mid-September 2013; activity through early December 2013 was reported in BGVN 38:09. This report describes the continuing eruption from December 2013 through April 2014, primarily drawn from reports issued by the Indonesian Center of Volcanology and Geological Hazard Mitigation (CVGHM) and reports from the Darwin Volcanic Ash Advisory Centre (VAAC). Many videos and photographs also emerged online, some of outstanding information content.
Badan Nacional Penanggulangan Bencana (BNPB — the Indonesian National Agency for Disaster Management) produced a map in 2013 showing disaster-prone areas near Sinabung (figure 8 and table 3). Orange shading shows the highest hazard area, Area III. The S and SE extensions of Area III project downslope, delineating regions and villages with high exposure to pyroclastic- and lava-flow hazards.
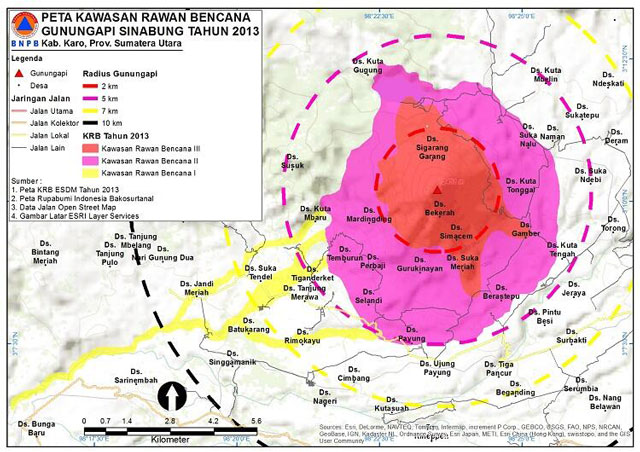 |
Figure 8. Sinabung 2013 hazard map of Sinabung showing villages within hazard-prone zones, including locations such as the village of Sukameriah located S of the summit (labeled 'Ds. Suka Meriah'). Table 3 translates critical portions of the map key. Courtesy of BNPB; from Carl (2014). |
Table 3. Sinabung hazard-prone areas (KRB) map's legend translated into English (refer to figure 1). Courtesy of BNPB and Google Translate.
| Feature in Indonesian | Feature in English |
| Gunungapi | Volcano summit (triangle) |
| Desa | Village (dot) |
| Jaringan Jalan - Jalan Utama - Jalan Kolektor - Jalan Local - Jalan Lain |
Road network - Main road - Collector road - Local road - Alternate road |
| Radius Gunungapi | Radial distance from volcano summit (3 km, red; 5 km, purple; 7 km, yellow; 10 km, black) |
| KRB Tahun 2013 - Kawasan Rawan Bencana III, II, I |
Hazard-prone areas in 2013 - Hazard-prone area III (orange), II (purple), & I (yellow) |
| Sumber | Information source |
December 2013-January 2014. Based on webcam images, the Darwin VAAC reported that on 22 December an ash plume from Sinabung rose to an altitude of 3.7 km and drifted 55 km W. During 23-24 December ash plumes recorded by the webcam rose to an altitude of 3 km.
PVMBG reported that seismicity at Sinabung increased during 21-26 December and indicated rising magma and lava-dome growth. Observers in Ndokum Siroga, about 8.5 km away, noted dense white plumes rising 70-1,200 m above the crater. Roaring was also periodically heard. A lava dome in the North Crater, visible on 24 December, was 56 m high and 210 m wide. During 25-26 December plumes were white and gray, and rose 300-400 m above the crater. On 26 December the lava-dome volume was estimated to be over 1 million cubic meters, with a growth rate of 3.5 cubic meters per second. The Alert Level remained at 4 (on a scale of 1-4). Visitors and tourists were prohibited from approaching the crater within a radius of 5 km.
On 30 December Badan Nacional Penanggulangan Bencana (BNPB) reported that the number of displaced people reached 19,126 (5,979 families). They also noted that activity at Sinabung had increased. Collapsing parts of the lava dome generated block-and-ash flows as well as pyroclastic flows which traveled as far as 3.5 km down the SE flank. Explosions and pyroclastic flows generated ash plumes that rose at least 6 km above the crater.
BNPB reported vigorous eruptions during 30-31 December 2013. Ash plumes rose as high as 7 km above the summit lava dome, pyroclastic flows traveled as far as 3.5 km SE, and incandescent lava and ash traveled 1.5 km SE. Dome growth and vigorous related dynamics in January were documented on the Photovolcanica (2014) web site. Lightning, lava-dome growth, pyroclastic flows, and ash whirls ("twisters", shown below) were observed during Sinabung's eruptions.
On 3 January 2014 lava-dome collapses generated more than 100 pyroclastic flows that traveled 2-4 km SE. Two villages evacuated, Jerawa (Ds. Jeraya) and Desa Pintu Besi (Ds. Pintu Besi) (figure 8). On 4 January pyroclastic flows were larger and more frequent; they traveled up to 5 km SE and 3.5 km SSE. Ash plumes rose 2-4 km (figure 9). Roaring was periodically heard and burned trees on the S flank were noted. Seismicity remained high, with constant tremor, hybrid earthquakes indicating a growing lava dome, and volcanic earthquakes. The number of low-frequency earthquakes dropped dramatically, however.
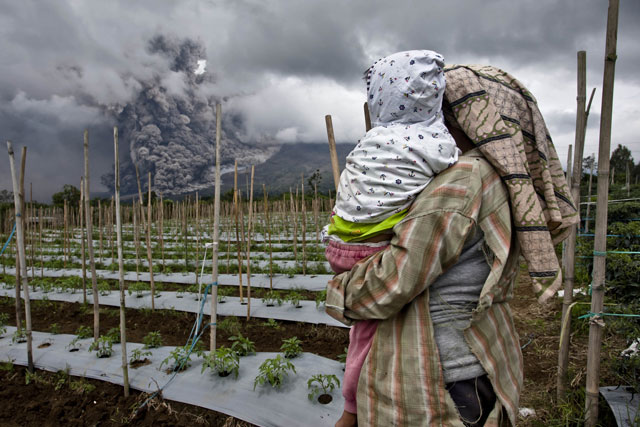 |
Figure 9. A woman carrying her daughter in an agricultural plot near Sinabung as an ash plume rose and pyroclastic flows descended the flanks on 4 January 2014. Photo by Ifansasti (2014). |
At 1600 (UTC) (2300 local) on 4 January 2014, MODVOLC satellite thermal alerts were measured over Sinabung for the first time in at least the last 10 years. (The MODVOLC system was described in the 1980's and an online version started during 2000-2001, although some similar thermal databases now span on the order of 4 decades (Ramsey and Harris, 2011; Wright and others, 2004)). Lava effusion was high, resulting in thermal alerts during much of January 2014. From the time of that first alert, nearly daily to weekly alerts were measured through May 2014.
During 4-5 January pyroclastic flows were recorded 426 times. On 5 January the number of hybrid earthquakes increased, indicating lava-dome growth, and pyroclastic flows traveled 1.5-4.5 km SE. On 7 January ash plumes rose 1-6 km and drifted SW, and pyroclastic flows continued to travel 1.5-4.5 km SE. The village of Payang, ~4.6 km S of Sinabung's summit, was blanketed by ash on 7 January 2014 (figure 10).
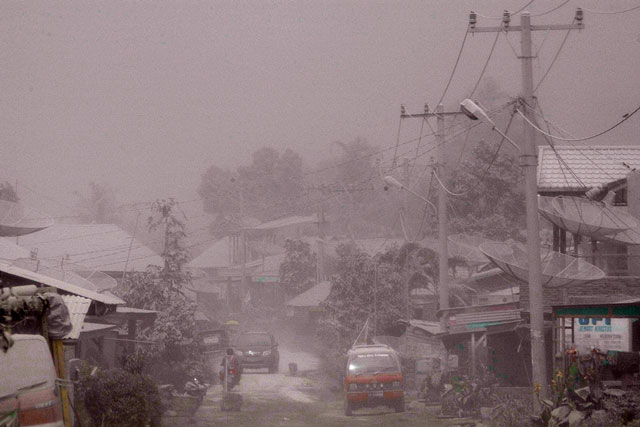 |
Figure 10. The village of Payung (~4.6 km S of Sinabung's summit) as ash falls during the eruption of Sinabung on 7 January 2014. Image courtesy of Martin (2014); photography by Ulet Ifansasti/Getty Images. |
A pyroclastic flow photographed on 10 January appears in figure 11. BNPB reported that the number of hybrid earthquakes decreased on 11 January and volcanic earthquakes increased. Amid these January eruptions aAsh plumes rose 1-5 km and drifted W, and pyroclastic flows traveled 1-4.5 km SE and 1 km E. Several villages in the Namanteran district reported ashfall. On 16 January, satellite imagery showed a white ash plume underlain by previous deposits of gray pyroclastic flows (figure 12). Around this time, the number of refugees reached over 22,000 persons.
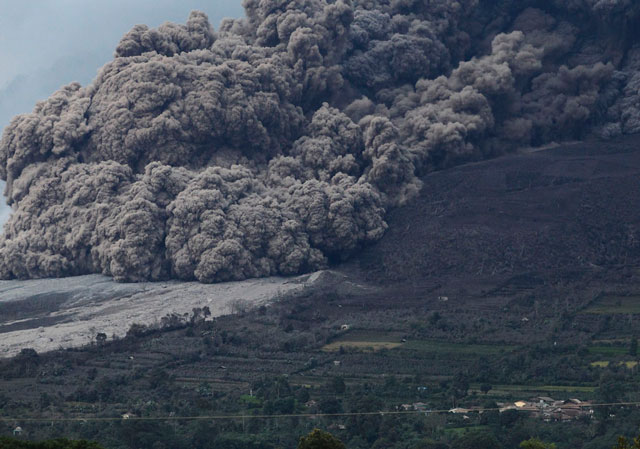 |
Figure 11. Pyroclastic flows traveling down Sinabung's S flank during an eruption on 10 January 2014. This photo was taken from Berastepu village in Karo district (~4 km SE of volcano summit). Courtesy of Bracken (2014), with caption information from REUTERS/Beawiharta. |
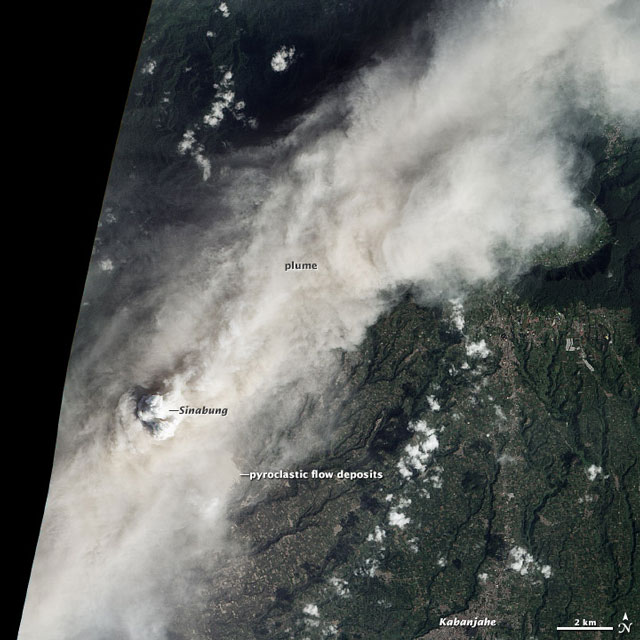 |
Figure 12. The Advanced Land Imager (ALI) on the Earth Observing-1 (EO-1) satellite collected this natural-color image of an ash plume from Sinabung on 16 January 2014. Frequent collapses from the unstable lava dome at the volcano's summit created pyroclastic flows that have traveled at least 4.5 km down the volcano's flanks. The SE margin of these flows are just visible to the lower right of the plume. Courtesy of NASA Earth Observatory. Image by Jesse Allen and Robert Simmon, using EO-1 ALI data from the NASA EO-1 team. Caption by Robert Simmon. |
A number of images of the eruption of Sinabung volcano during the second week of January 2014 are available on the Photovolcanica website (Roscoe, 2014). James Reynolds captured some remarkable videos of pyroclastic flows at Sinabung on 21 January 2014 (Earth Uncut TV, 2014; Vervaeck, 2014). Those videos showed explosions that often initiated the pyroclastic flows. As the flows moved downslope, they rapidly formed turbulent, ash-laden currents comprising the bulk of the flow volume (see Figure 3). An image of the S flank of Sinabung taken on 14 January shows lava flows erupting from the summit (figure 13).
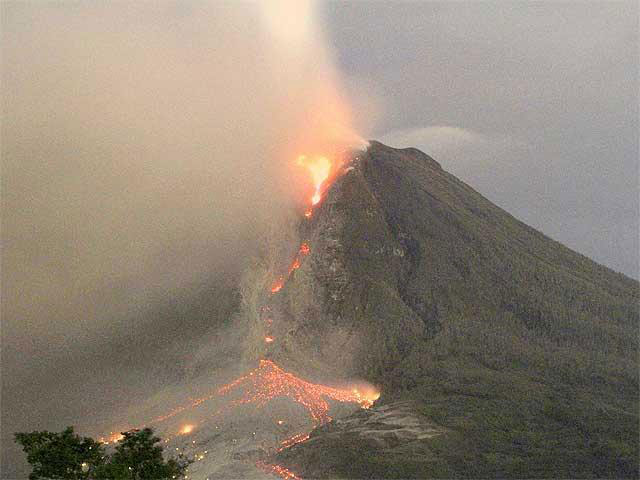 |
Figure 13. Sinabung volcano on 14 January 2014 as it erupts a small plume and a lava flow that traveled down the volcano's S flank, as seen from Kuta Tengah village. Note the sinuous gulley (shaded depression) running downslope just to the right (E) of the lava flows; this is also a prominent landmark in figure 9. Courtesy of India Times (2014). |
On 31 January 2014 Sinabung continued to effusively erupt viscous lava, further contributing to both the growth of the lava dome and the lava flow that descended the SE flank. The depression on the SE side of the volcano was mostly been filled by the lava flow, prompting concerns that pyroclastic flows lacked confinement and might take other paths to the S or E.
February 2014. On the morning of 1 February 2014 the lava dome collapsed and created one or two pyroclastic flows. As a result, 17 people (mostly students) died. All known fatalities occurred in Sukameriah village ('Ds. Suka Meriah,' figure 1). That village sits just over 3 km S of the summit, thus well within the 5-km-exclusionary zone. The resulting expanse of hot deposit generated a series of narrow spinning vortices ('twisters') of rising air and ash, that with height joined a rising plume (figure 14).
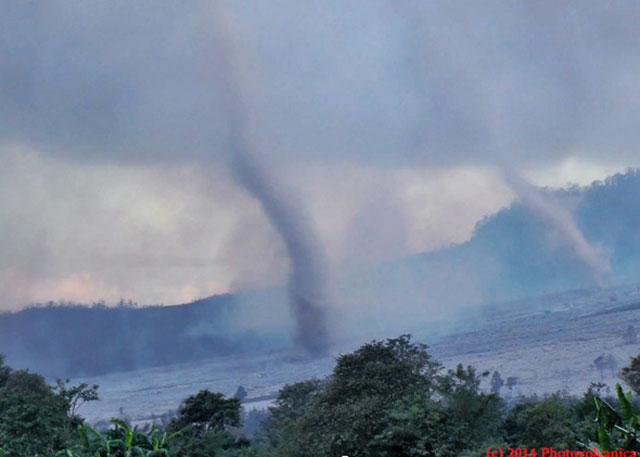 |
Figure 14. Twisters generated from pyroclastic flows at Sinabung on 1 February 2014. Courtesy of Plait (2014) (photo from video on Photovolcanica website). |
Waning trend. According to CVGHM, during 2-4 February 2014 no significant explosions or pyroclastic flows seemed to have occurred. Activity showed an overall decreasing trend. The number of seismic events related to the rise of new magma (hybrid earthquakes and tremor) had generally decreased over the preceding weeks. This corresponded to what was observed visually (when weather permitted clear views). Occasional medium-sized explosions and dome collapses produced pyroclastic flows that reached up to 3 km in length at 1350 on 3 February and at 0750 on 4 February.
Based on webcam images, Indonesian Met office notices, wind data, and ground reports, the Darwin VAAC reported that during 12-13 and 15-18 February ash plumes from Sinabung rose to an altitude of 3.7 km (12,000 ft) a.s.l. and drifted 25-95 km N, NE, and E.
During 15-23 February 2014 the eruption continued without significant changes, but with progressively decreasing activity. CVGHM noted the slow extrusion and gradual enlargement of the lava effusing from the summit vent and onto the S slope. Occasional rockfalls, ash emissions, and minor pyroclastic flows occurred as well. The erupted lava was determined to be andesite, typical of many stratovolcanoes in subduction settings.
March 2014. Based on wind data, webcam images, and satellite images, the Darwin VAAC reported that during 25 February-1 March and 3-4 March ash plumes from Sinabung rose to altitudes of 3-4 km a.s.l. and drifted 25-55 km E, NE, N, NW, W, and SW. Darwin VAAC also reported that during 4-7 and 9-11 March ash plumes from Sinabung rose to 3.7-4 km a.s.l. and drifted W and SW. During 6 and 9-11 March ash plumes drifted 35-165 km SW and W.
PVMBG described activity at Sinabung during 8-15 March based on observations from a post in the Ndokum Siroga village, 8.5 km away. Dense white plumes rose from the lava dome daily, as high as 1 km on most days; plumes rose 2 km on 12 March. Incandescent material originating from various parts of the lava dome traveled up to 2 km S and SE. Tremor and volcanic earthquakes were detected, and signals representing avalanches from the unstable and still-growing dome increased. Sulfur dioxide emissions varied between 300 and 598 tons per day. Observations on 13 March showed that lava from the dome had flowed 2.4 km downslope.
On 15 March 2014, Sinabung was still at Alert Level 4 (the highest level). During 15-22 March 2014, there was a declining trend in the RSAM (real-time seismic amplitude measurement).
The volcano continued to be active on 18 March 2014 with no significant changes, but an overall decreasing trend. Lava effusion fed the S-flank lava lobe which had been mainly growing along its E side. No significant pyroclastic flows occurred, only frequent smaller rockfalls. Small ash plumes continued to be regularly visible on satellite imagery. The 18 March report indicated that seismicity decreased overall and hybrid earthquakes had disappeared. This suggested to the authors that pressure and magma supply rate had dropped significantly and that the eruption could be ending in the near future.
Based on webcam images, the Darwin VAAC reported that on 29 March an ash plume from Sinabung rose to an altitude of 4.3 km. Meteorological cloud cover prevented satellite views.
On 30 March 2014, CVGHM reported a slowly decreasing trend in activity, with little variation over the preceding weeks. The viscous lava lobe remained weakly sustained and continued to grow very slowly. An intermittent steam and an occasional ash plume often rose to ~4.2 km a.s.l. No new pyroclastic flows occurred. During 23 March-8 April dense white plumes rose at most 1.2 km above the lava dome. Lava had traveled 2.5 km down the flanks as of 6 April and was incandescent at various locations. Incandescent material originating from the edges of the lava dome and flow traveled up to 2 km S and 500 m SE. Tremor and volcanic earthquakes were detected, and signals representing avalanches from the unstable and still-growing dome decreased. Sulfur dioxide emissions varied but were relatively insignificant. Based on decreasing seismicity, deformation, and SO2 gas flux, CVGHM lowered the Sinabung Alert Level from 4 to 3 on 8 April 2014.
Flow paths into April 2014. Figure 15 shows two satellite images of Sinabung, the upper taken on 7 June 2013 (before the eruption) and the lower taken on 6 February 2014 (during the current eruption). The path of the pyroclastic and lava flows on the SE flank shows the extent of the devastated area and the orientation of other images (figures 13 and 16). Ashfall coated nearby villages and the flanks, as well as the coffee, chili pepper, and other types of plantations clustered at the foot of the volcano.
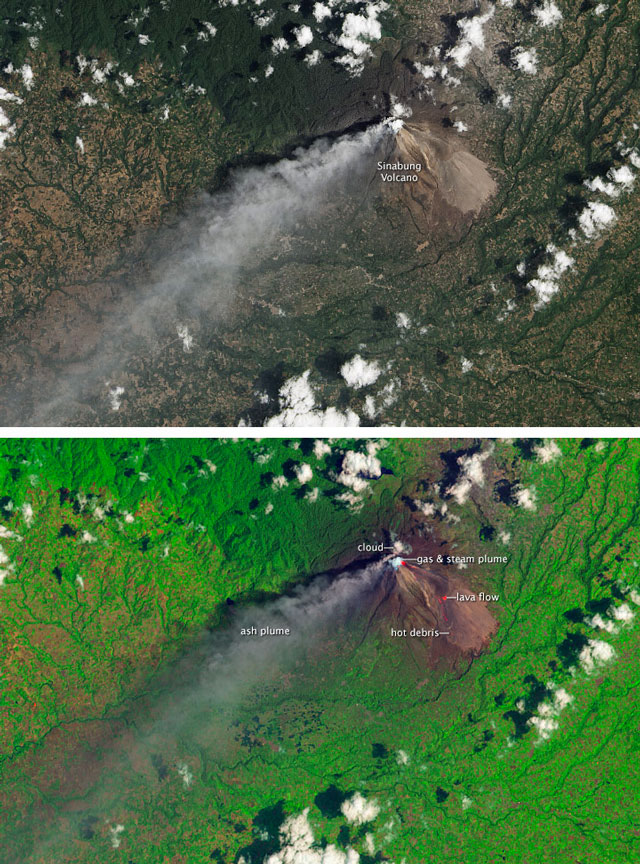 |
Figure 15. (Top) Pre-eruption Sinabung image acquired by Landsat on 7 June 2013; much of the surrounding landscape was covered by dark green forests. (Bottom) An image acquired on 6 February 2014 by the Advanced Land Imager (ALI) on the Earth Observing-1 (EO-1) satellite. This is a natural-color image of an ash plume, a light gray apron of pyroclastic flow deposits, and broad scale ash fall coating much of the region. Frequent collapses from the unstable lava dome near Sinabung's summit created pyroclastic flows that traveled at least 4.5 km from the summit. NASA Earth Observatory images by Jesse Allen, using EO-1 ALI data provided courtesy of the NASA EO-1 team and Landsat data from the U.S. Geological Survey. Caption by Robert Simmon and Adam Voiland. |
CVGHM prepared an image (figure 16) of the path along which lava and pyroclastic flows traversed down the S side of Sinabung, delineating the extent of the lava flows at various dates from 31 January through 6 April 2014. On 6 April 2014 the lava flow was 2.5 km from the volcano summit. The image of 6 February 2014 (figure 15) revealed that pyroclastic flows had gone ~4 km from the summit of Sinabung. Some of those pyroclastic-flow deposits appear outboard and below the lavas at the bottom of figure 9.
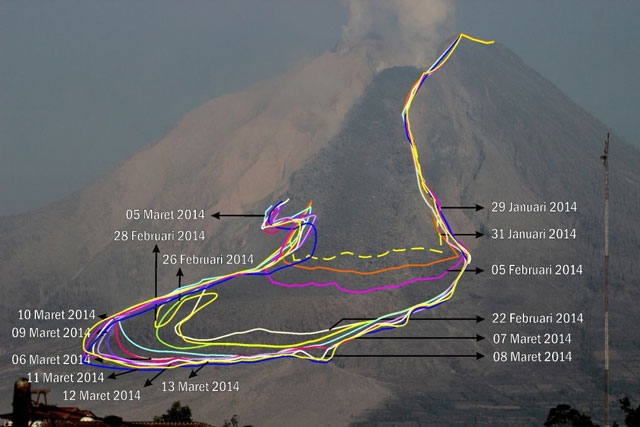 |
Figure 16. This 6 April 2014 photograph of the S flank of Sinabung was annotated with dates by CVGHM (in Indonesian) to mark the advance of lava during 31 January-6 April 2014. The annotations include such features as flow margins and fronts ('lidah lava' means lava tongue). Taken from the CVGHM weekly report of 8 April 2014. |
A report from CVGHM dated 10 April 2014 indicated that lava had recently extruded slowly, feeding a thick lobe on the S flank. The effusion rate had declined, hybrid earthquakes disappeared, and rockfall-induced seismicity decreased. Owing to these recent decreases in the intensity of activity, on 10 April authorities decreased the alert status from the Level 4 to 3 (on a scale of 1-4). People from some of the evacuated areas (to the E and NE) were allowed to return to their homes where they began the process of cleaning up the ash (of unstated thickness). Only the areas remaining off limits were within 3 km radius (eg., Sukameriah) and the SE sector village Berastapu (figure 8).
The lava lobe descending from the summit was considered by CVGHM to represent a large unstable mass draped onto the steep slope of the volcano. They acknowledged the risk of a sudden failure that could potentially result in a devastating pyroclastic flow. A pyroclastic flow did occur on 17 April 2014 at 1740, triggered by a partial collapse of the steep lava tongue. The flow was relatively small and only reached the then depopulated area at the base of the volcano.
Based on webcam images, satellite images, and wind data, the Darwin VAAC reported that on 22 April an ash plume rose to an altitude of 3.7 km and drifted almost 40 km W. MODVOLC thermal alerts were measured on 21 April 2014 at 1540 UTC and on 26 April 2014 at 1855 UTC.
Geophysical and geochemical plots. Figures 17 and 18 summarize measurements made and provided by CVGHM; figure 17 plots seismic signals measured from 7 November 2013 to 8 April 2014, and figure 18 plots various geochemical fluxes from1 September 2013 to 8 April 2014.
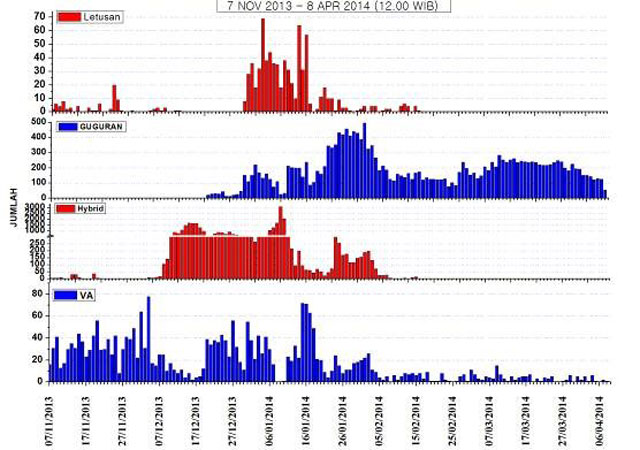 |
Figure 17. Plots showing on the y-axis the daily number ('jumlah') of various seismic events measured at Sinabung volcano for the period 7 November 2013 (07/11/2013) to 6 April 2014 (06/04/2014). The common x-axis values depict time, with dates shown for 10-day intervals, using the format 'dd/mm/yyyy'. The seismic types include: 'letusan'-seismically-detected eruptions; 'guguran'-avalanche signals, which correlated with the instability of the lava dome; 'hybrid' earthquakes—associated with growth of the lava dome; and 'VA'-deep volcanic earthquakes, indicating the persistence of a relatively small pressure due to intrusion of magma. Although not shown, CVGHM also measured low-frequency and shallow-volcanic earthquakes and tremor. Courtesy of CVGHM. |
The deep volcanic ('VA') and hybrid earthquakes were among the earliest to show clear escalation, with the latter the most sustained. As seen on figure 17, all seismic data, except that associated with avalanches, decreased dramatically after mid-February 2014.
Figure 18 shows in the upper panel, the same seismic peak ('Letusan,' seismically detected eruptions) seen in the previous figure, an interval of high values measured in late December and especially prominent during early to mid-January. In the 2nd panel from the top, SO2 flux, there is a gap in data during the time of the eruption, due at least in part to the challenge of obtaining meaningful measurements in ash-choked plumes. Pronounced peaks occurred in available SO2 flux measurements during the periods 11-18 January and ~mid to late February 2014, with data gaps in their midst, probably for the same reasons just mentioned. Later and earlier measurements yielded much lower fluxes.
The 3rd panel down plots hot-spring-water temperatures ('suhu air panas'), which showed but gradual changes on the order of 0.5°C increase overall. The 4th and 5th panels down plot CO2 and H2S, respectively (in percent by volume) for the same area. Both those measurements display similar patterns. They lack data from January, around the time the eruption, thwarting direct comparisons to the eruption. In addition, CVGHM measured and reported deformation nearby Sinabung from tiltmeters and electronic distance measurement (EDM) equipment (not shown here). They also employ a webcam to monitor the volcano in clear weather.
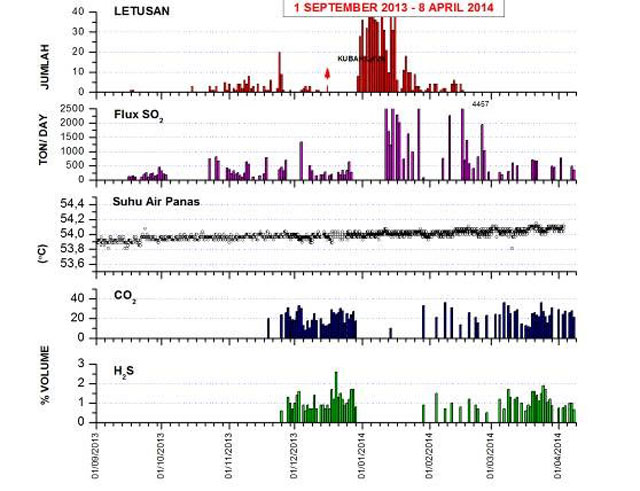 |
Figure 18. Daily number of explosion earthquake ('Letusan') and various geochemical fluxes and concentrations measured at Sinabung volcano on a common x-axis scale for the period from 1 September 2013 to 8 April 2014 (in figure as 01/09/2013 to 08/04/2014; i.e., dates in the format 'dd/mm/yyyy'). The measurements indicated by the heading labels for each graph include: 'letusan' — eruption earthquakes per day; SO2 flux in tons/day; 'suhu air panas'—water temperature of the hot springs area in District Payung at the S foot of Sinabung in °C; and hot spring CO2 and H2S there in percent by volume. Courtesy of CVGHM. |
References. BNPB, 2014, Disaster Map of Mount Sinabung (URL: http://geospasial.bnpb.go.id/2014/04/09/peta-penurunan-status-gunung-sinabung/ ).
Bracken, M., 2014 (10 January), Eruptions at Mount Sinabung in Indonesia displace residents, Baltimore Sun Darkroom, (URL: http://darkroom.baltimoresun.com/2014/01/eruptions-at-mount-sinabung-in-indonesia-displace-residents/##2).
Carl, 2014 (6 January), The Road to Sinabung, VolcanoCafe (URL: http://volcanocafe.wordpress.com/2014/01/06/the-road-to-sinabung/).
Earth Uncut TV — You Tube, 2014 (16 February), (URL: http://www.youtube.com/watch?v=8nGoRPeZMjo&list=UULKYsEXfI0PGXeKYL1KV7qA ).
Ifansasti, U., 2014 (4 January), Villagers Evacuated As Mount Sinabung Eruptions Continue, Getty Images (URL: http://www.google.com/hostednews/getty/article/ALeqM5i60aXEMfqnd64Q0ILmbE2qrbV98A?docId=460700117&hl=en).
India Times, 2014 (14 January), Mount Sinabung volcano spews ash as seen from Kuta Tengah village in Karo district 14 Jan, 2014, Economic Times (URL: http://economictimes.indiatimes.com/slideshows/day-in-pics/january-14-2014/mount-sinabung-volcano-spews-ash-as-seen-from-kuta-tengah-village-in-karo-district/slideshow/28800393.cms).
Martin, M., 2014 (7 January), Indonesia's Mt. Sinabung continues to spew ash, Los Angeles Times Photography website (URL: http://framework.latimes.com/2014/01/07/mount-sinabung/##/9).
NASA Earth Observatory, 2014 (16 January), Roiling Ash Plume above Sinabung Volcano, (URL: http://earthobservatory.nasa.gov/NaturalHazards/view.php?id=82872).
NASA Earth Observatory, 2014 (12 February), Changed landscape around Sinabung (URL: http://earthobservatory.nasa.gov/IOTD/view.php?id=83080&eocn=image&eoci=related_image).
Plait, P, 2014 (7 February), Like Volcanoes Aren't Scary Enough, Now They're Spawning Twisters, Slate (URL: http://www.slate.com/blogs/bad_astronomy/2014/02/07/volcano_twisters_ash_devils_spawned_from_sinabung.html).
Ramsey, M.S., Harris, A.JL., 2012, Volcanology 2020: How will thermal remote sensing of volcanic surface activity evolve over the next decade? J. Volcanol. Geotherm. Res., doi: 10.1016/j.jvolgeores.2012.05.01.
Roscoe, R, 2014, Sinabung Volcano (Gunung Sinabung), Photovolcanica website (URL: http://www.photovolcanica.com/VolcanoInfo/Sinabung/Sinabung.html).
Wright, R., Flynn, L.P., Garbeil, H., Harris, A., Pilger, E., 2004.MODVOLC: near-real-time thermal monitoring of global volcanism. J. Volcanol. Geotherm. Res. 135 (1-2), 29-49; DOI: 10.1016/j.jvolgeores.2003.12.008
Geological Summary. Gunung Sinabung is a Pleistocene-to-Holocene stratovolcano with many lava flows on its flanks. The migration of summit vents along a N-S line gives the summit crater complex an elongated form. The youngest crater of this conical andesitic-to-dacitic edifice is at the southern end of the four overlapping summit craters. The youngest deposit is a SE-flank pyroclastic flow 14C dated by Hendrasto et al. (2012) at 740-880 CE. An unconfirmed eruption was noted in 1881, and solfataric activity was seen at the summit and upper flanks in 1912. No confirmed historical eruptions were recorded prior to explosive eruptions during August-September 2010 that produced ash plumes to 5 km above the summit.
Information Contacts: Indonesian Center of Volcanology and Geological Hazard Mitigation (CVGHM) (also known as Pusat Vulkanologi dan Mitigasi Bencana Geologi-PVMBG), Jalan Diponegoro 57, Bandung 40122, Indonesia (URL: http://vsi.esdm.go.id/); Indonesian National Agency for Disaster Management (Badan Nacional Penanggulangan Bencana-BNPB), Gedung Graha 55 Jl. Tanah Abang II No. 57, 10120, Jakarta Pusat (URL: http://www.bnpb.go.id/); Darwin Volcanic Ash Advisory Centre (VAAC), Bureau of Meteorology, Northern Territory Regional Office, PO Box 40050, Casuarina, NT 0811, Australia (URL: http://www.bom.gov.au/info/vaac/); CBC.CA News (URL: http://www.cbc.ca/news/world/); Volcano Discovery (URL: http://www.volcanodiscovery.com); MODVOLC, Hawai'i Institute of Geophysics and Planetology (HIGP) Thermal Alerts System, School of Ocean and Earth Science and Technology (SOEST), Univ. of Hawai'i, 2525 Correa Road, Honolulu, HI 96822, USA (URL: http://modis.higp.hawaii.edu/); and NASA Earth Observatory (URL: http://earthobservatory.nasa.gov/NaturalHazards).