Report on Agung (Indonesia) — January 2018
Bulletin of the Global Volcanism Network, vol. 43, no. 1 (January 2018)
Managing Editor: Edward Venzke.
Edited by A. Elizabeth Crafford.
Agung (Indonesia) New eruption after 54 years; extensive pre-eruption seismicity precedes ash emission on 21 November 2017
Please cite this report as:
Global Volcanism Program, 2018. Report on Agung (Indonesia) (Crafford, A.E., and Venzke, E., eds.). Bulletin of the Global Volcanism Network, 43:1. Smithsonian Institution. https://doi.org/10.5479/si.GVP.BGVN201801-264020
Agung
Indonesia
8.343°S, 115.508°E; summit elev. 2997 m
All times are local (unless otherwise noted)
A large explosive and effusive eruption lasting about 11 months during 1963-64 at Indonesia's Mount Agung on Bali produced voluminous ashfall, devastating pyroclastic flows that caused extensive damage, and over 1,000 fatalities. The volcano remained largely quiet until renewed seismicity began in August 2017, the prelude to a new eruptive episode, which started in late November 2017 and is ongoing. Self and Rampino (2012) and Fontijn et al. (2015) published detailed summaries of historical activity at Agung prior to this new episode; a brief summary of their work is provided.
Information about the new eruptive episode comes from Pusat Vulkanologi dan Mitigasi Bencana Geologi (PVMBG), also known as the Indonesian Center for Volcanology and Geological Hazard Mitigation (CVGHM), Badan Nasional Penanggulangan Bencana (BNPB) which is the National Board for Disaster Management, the Darwin Volcanic Ash Advisory Center (VAAC), and various sources of satellite data. The first two months of this new episode, through December 2017, are discussed in this report.
Summary of 1963-64 eruption. The February 1963 to January 1964 eruption, Indonesia's largest and most devastating eruption of the twentieth century, was a multi-phase explosive and effusive event that produced both basaltic andesite tephra and andesite lava (Self and Rampino, 2012). After a few days of felt earthquakes on 16 and 17 February 1963, explosive activity began at the summit on 18 February. This was followed the next day by the effusion of about 0.1 km3 of andesite lava which was extruded until 17 March 1963, when a large explosive eruption generated pyroclastic density currents (PDCs) and lahars that devastated wide areas N, SW, and SE of the volcano (figure 1) (Fontijn et al, 2015).
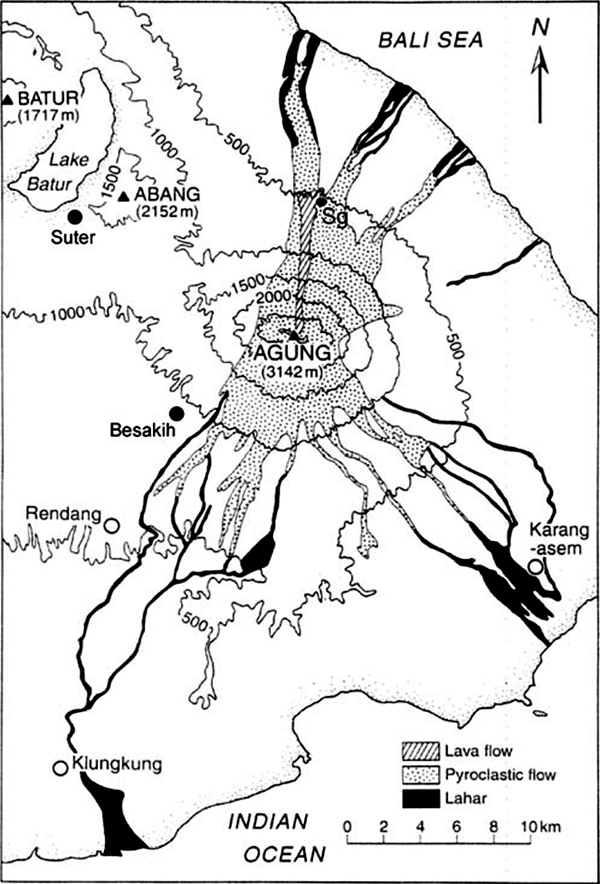 |
Figure 1. Map of Gunung Agung and vicinity, eastern Bali, showing the extent of the 1963 lava flow (cross-hatched), pyroclastic flow deposits (stippled), and lahar deposits (dark shading) of the 1963–1964 eruption (after unpublished map courtesy of Indonesian Volcanological Survey). Sg is Siligading village, where many fatalities occurred. Reproduced from Self and Rampino (2012, figure 3). |
Explosive activity continued intermittently until a second explosive phase of similar intensity occurred two months later, beginning on 16 May 1963 with reported ash plumes reaching 10 km above the 3-km-high summit (figure 2). This phase produced the greatest proportion of the pyroclastic flow material from the eruption and led to additional death and destruction in villages at the foot of the volcano (Self and Rampino, 2012). Explosive outbursts continued intermittently until 17 January 1964. The total death toll of the eruption was estimated between 1,100 and 1,900 (see references in Fontijn et al., 2015). A total estimated volume of erupted magma was ca 0.4 km3 (Self and Rampino, 2012).
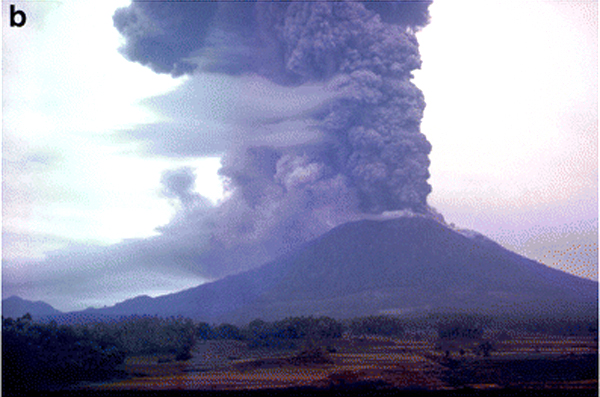 |
Figure 2. Photograph reported to be of the 16 May 1963 eruption column at Agung; the view is from the SW, perhaps near Rendang (shown on figure 1). Photo courtesy of the family of Denis Mathews, reproduced from Self and Rampino (2012, figure 2b). |
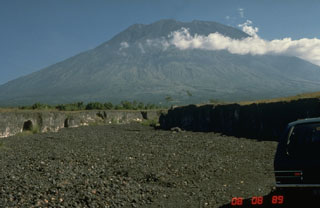
Activity between 1964 and 2017. Almost no activity was reported from Agung during 1964-2017. Weak solfataric activity from within the summit crater was reported in 1989 (SEAN 14:07). MODVOLC thermal alerts were reported intermittently on one or two days during a few years (2001, 2002, 2004, 2006, 2008, 2012, 2013), but all of the alerts were located on the middle or lower flanks, suggesting their source was agriculture or forest fires, unrelated to volcanic activity. Chaussard et al. (2013) reported inflation centered on the summit at a rate of 7.8 cm/year between mid-2007 and early 2009, followed by slow deflation at a rate of 1.9 cm/year until mid-2011 (the last acquired data).
Summary of September-December 2017 Activity. Increases in seismic activity were first noted at Agung during mid-August 2017. Exponential increases in the rate of events during the middle of September led PVMBG to incrementally raise the Alert Level from I to IV (lowest to highest) between 14 and 22 September. Steam-and-gas emissions were intermittently observed 50-500 m above the summit crater from the end of September through October, with occasional bursts as high as 1,500 m. Seismicity dropped off almost as quickly as it rose, beginning on 20 October, and then continued a more gradual decrease through the end of the month and into November. The number and intensity of hot spots observed within the summit crater increased during September, then leveled off during October.
Ash emissions first appeared on 21 November, rising to 700 m above the summit. Ash density and heights of plumes increased several times during the rest of November to about 3,000 m. Ashfall as deep as 5 mm affected neighboring communities, and was reported several hundred kilometers from the summit; the international airport about 60 km SW was forced to close for a few days at the end of the month. Thermal data indicated effusion of lava into the summit crater at the end of November. After 30 November, emissions continued, primarily comprised of steam and gas, with intermittent plumes of dense ash, rising up to 2.5 km above the summit throughout December.
Activity during August-September 2017. In their monthly report of volcanic activity for August 2017, PVMBG noted that 49 volcanoes, including Agung, were listed at Alert Level 1, meaning "Normal", with no apparent increases in visual or seismic activity. The first signs of renewed unrest at Agung appeared as an increase in the rate of deep volcanic earthquakes (VA or Vulkanik Dalam) beginning on 10 August 2017. Shallow volcanic earthquakes (VB or Vulkanik Dangkal) began to increase two weeks later on 24 August, followed by an increase in the number of local tectonic earthquakes on 26 August (figure 3). Based on this increased seismicity, and an observation on 13 September of new solfataric activity at the bottom of the summit crater, PVMBG raised the Alert Level the following day from Level I (Normal) to Level II (Beware); the Aviation Color Code was raised to Yellow on a four-color scale (Green, Yellow, Orange, Red). The deeper earthquakes (VA) had a seismic amplitude range from 3-10 mm. The shallow earthquakes (VB) had an amplitude range of 2-7 mm. Otherwise, there was no surface expression of activity during September.
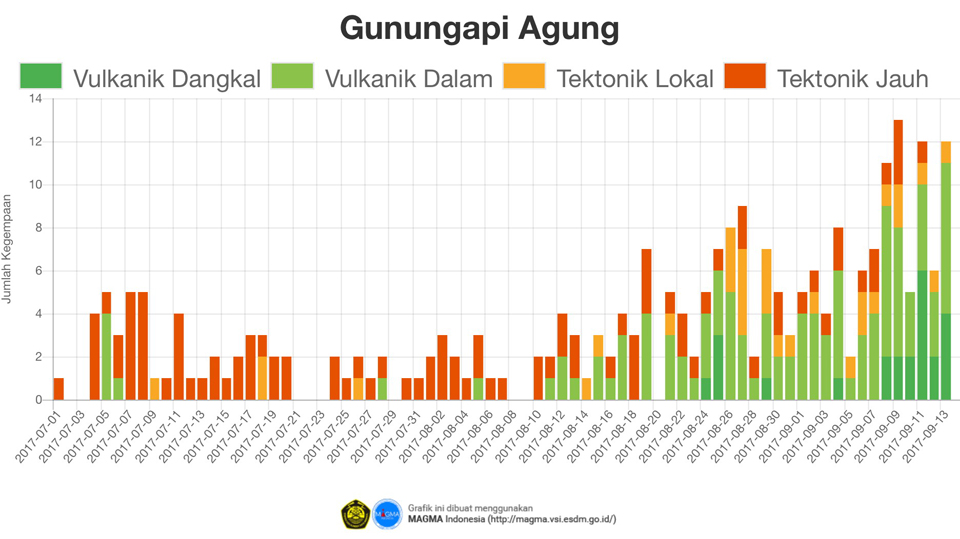 |
Figure 3. Seismic activity at Agung between 1 July and 13 September 2017. The Y-axis is the number of daily earthquakes. The increase in deep volcanic seismicity (VA, or Vulkanik Dalam) that began on 10 August 2017 was followed two weeks later by an increase in shallow volcanic seismicity (Vulkanik Dangkal or VB). Courtesy of PVMBG (Peningkatan Tingkat Aktivitas Gunung Agung, 14 September 2017). |
The Agung Volcano Observatory (AVO) is located in Rendang village about 8 km SW. Webcams are located in Rendang and in Bukit Asah, about 8 km W. On 15 September 2017 a steam emission was observed rising 50 m above the crater rim. The AVO issued a VONA on 18 September noting a rapid increase in volcanic earthquake activity with a small hot spot detected in satellite data. This contributed to them raising the Alert Level again to Level III (Standby), resulting in a 6-km-radius exclusion zone activated around the summit, extending to 7.5 km on the N, SE, and SSW flanks where the pyroclastic flows of 1963 had caused the most damage. Many of the 50,000 village residents within the 6 km exclusion zone began voluntary evacuations. The communities affected included Jungutan (7 km S) and Buana Giri (12 km SE) villages in the Bebandem District, Sebudi Village (6 km SW) in the Selat Subdistrict, Besakih Village (12 km SW) in the Rendang Subdistrict, and Dukuh (4 km NE) and Ban (7.5 km NW) villages in the Kubu Subdistrict. About 9,500 people had voluntarily evacuated from the villages by 22 September 2017.
The observatory issued another VONA on 19 September 2017, reporting an 'ash cloud' at 0255 UTC (1055 Central Indonesia Time, or WITA). It was described as a dense, white plume moving to the W. Around the same time (0240 UTC) MODVOLC recorded ten thermal alerts on the N and E flanks. Bali's Regional Disaster Management Agency (BPBD) reported in Antara News on 19 September that the source of the smoke and ash were forest fires caused by excessively dry conditions.
A VONA issued by AVO in the morning of 22 September stated that a steam emission about 50 m above the summit drifted NW. During the evening of 22 September, PVMBG raised the Alert Level to Level IV (Caution), the highest of the four-level scale, based primarily on continuing increases in seismicity. They expanded the exclusion zone to 9 km around the summit, and to 12 km in the areas S, SE, and NNE. The number of evacuees had risen to nearly 35,000 people by 24 September. Steam-and-gas plumes were intermittently observed rising to 200 m above the crater rim during the rest of September. By 26 September, PVMBG reported increasing seismic activity with 579 deep volcanic (VA) quakes, 373 shallow quakes (VB), and 50 local tectonic events that day. Seismicity continued to escalate through the end of the month. By the end of September, the government was assisting with the logistics of evacuating tens of thousands of livestock, primarily cattle, as well as over 90,000 people from within and around the 9 km exclusion zone. MAGMA Indonesia reported that new steaming and thermal areas within the summit crater expanded during the last week of the month.
Activity during October 2017. Narrow steam plumes rose 50-200 m above the summit crater during the first half of October. The rate of earthquakes during the last week of September and the first week of October continued to fluctuate at high levels, averaging 1-3 per minute, and more than 600 per day. By the first week of October, shallow earthquakes alone had increased to more than 200 per day, suggesting the possibility of magmatic activity at shallow depth. Satellite data showed increasing steam emissions along the NE edge of the crater rim. Tiltmeter data showed sudden deflation on 1 October, followed by continued inflation through 5 October. AVO released a VONA on 7 October noting a steam plume rising 1,500 m above the summit crater at 1245 UTC and drifting E (figure 4).
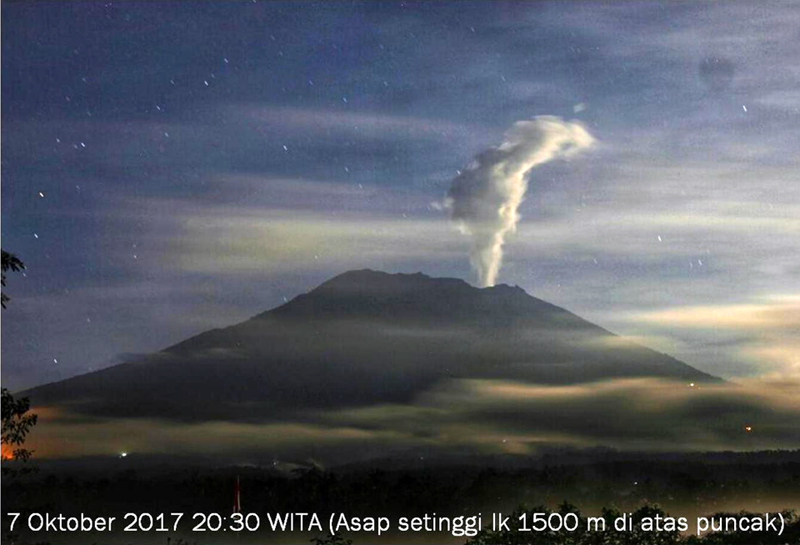 |
Figure 4. A steam plume rose 1,500 m above the summit of Agung on 7 October 2017. Courtesy of PVMBG (Penurunan Status Gunungapi Agung, Bali Dari Level IV (awas) Ke Level III (siaga) Tanggal 29 Oktober 2017 Pukul 16.00 WITA). |
During the second half of the month, steam plumes were denser and rose more frequently to 200-500 m above the summit crater. BNPB flew drones over the summit on 20 and 29 October 2017 and captured 400 aerial photographs (figures 5 and 6). The images revealed a widening of the fracture zone on the E side of the summit crater, and a new fracture on the SE side.
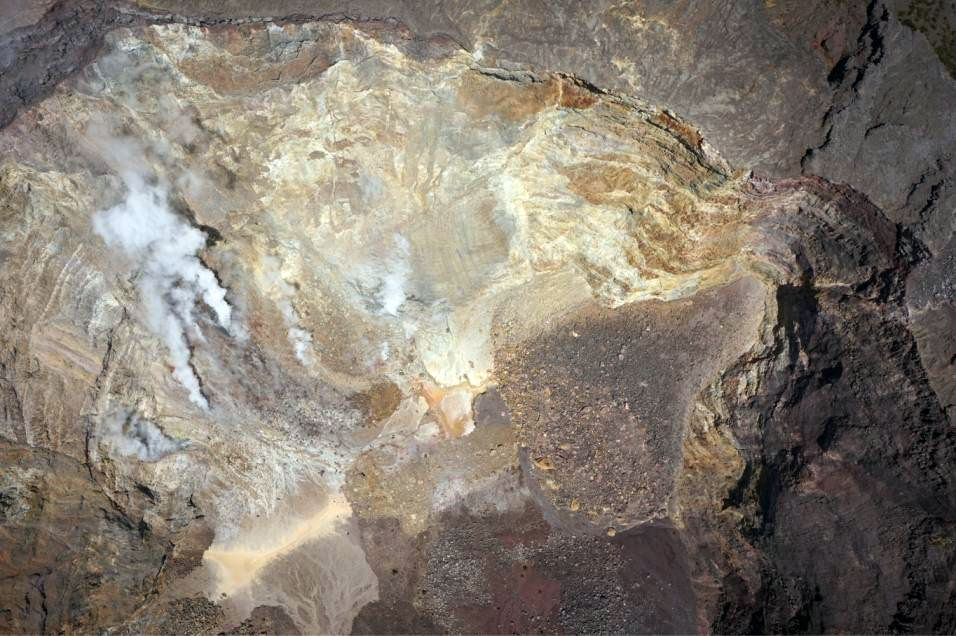 |
Figure 5. A view into the summit crater of Agung on 20 October 2017, taken by a BNPB drone. Steam fumaroles rose from the NNE flank. N is to the left. Courtesy of PVMBG (Penurunan Status Gunungapi Agung, Bali Dari Level IV (awas) Ke Level III (siaga) Tanggal 29 Oktober 2017 Pukul 16.00 WITA). |
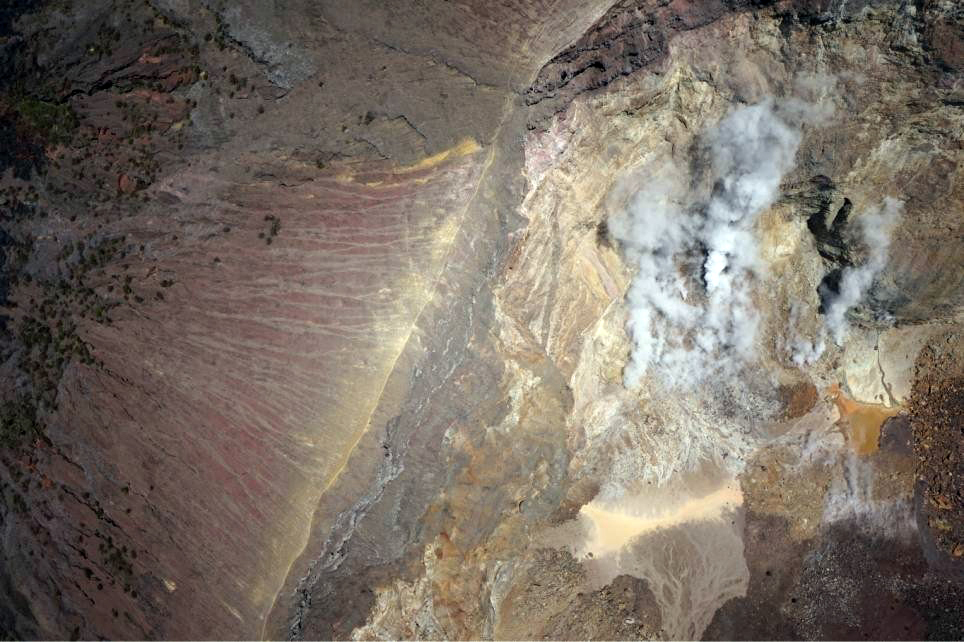 |
Figure 6. A view into the summit crater of Agung on 29 October 2017, taken by a BNPB drone. The steam plumes rose from the NE corner of the summit crater. The NE rim of the crater slopes away to the upper left. Courtesy of PVMBG (Penurunan Status Gunungapi Agung, Bali Dari Level IV (awas) Ke Level III (siaga) Tanggal 29 Oktober 2017 Pukul 16.00 WITA). |
PVMBG noted a decline in seismicity beginning on 20 October 2017 which continued through the end of the month (figure 7), leading them to lower the Alert Level from IV to III on 29 October, and reduce the exclusion zone to a 6 km radius, plus a 7.5 km area in the NNE, SE and SSW sectors. In their late October report, they observed that remote sensing thermal infrared data had detected an increase in the thermal energy beginning on 10 July 2017, in the form of an increased number of hot spots within the summit crater. During August and September, the number of hot spots had increased significantly and correlated with the increases in seismicity (figure 8). The intensity of the thermal anomalies then decreased during October. Inflation resumed in mid-August and peaked in mid-September. After that, the GPS data indicated deflation at lower levels, but uplift of 6 cm occurred near the summit. The deformation rate slowed after 20 October.
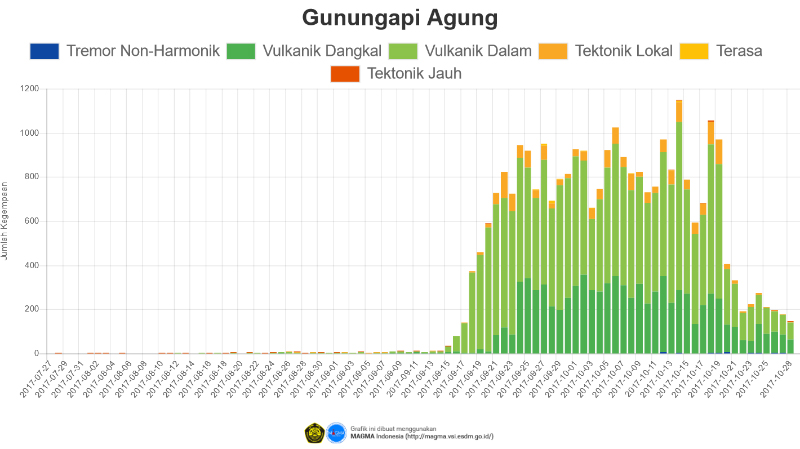 |
Figure 7. Daily seismic activity at Agung from 27 July-29 October 2017. Seismicity decreased noticeably on 20 October 2017, leading PVMBG to lower the Alert Level from IV to III on 29 October. Note that the vertical axis counting the number of daily seismic events ranges from 0 to 1,200, while in figure 3 the same axis ranges from 0 to 14. Courtesy of MAGMA Indonesia (Penurunan Status Gunungapi Agung, Bali dari Level IV (AWAS) ke Level III (SIAGA) Tanggal 29 Oktober 2017 pukul 16.00 WITA). |
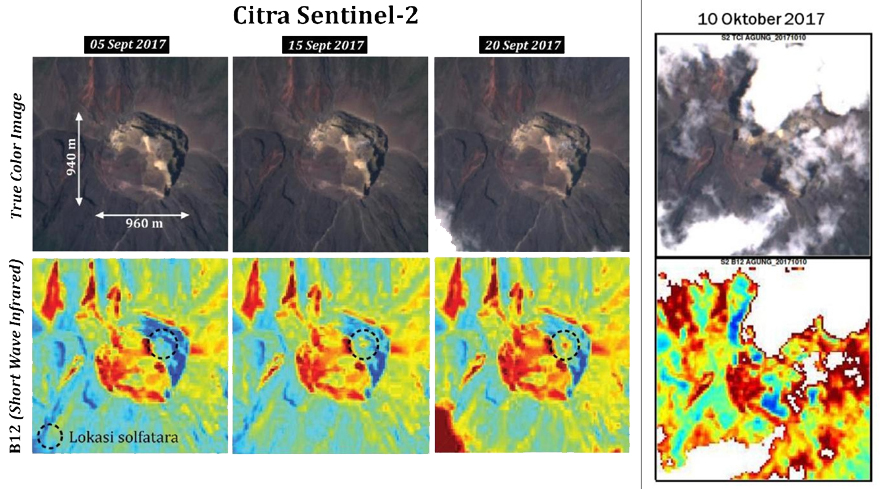 |
Figure 8. Satellite thermal imagery from Citra-Sentinel 2 revealed an increase in the number and intensity of hotspots within the summit caldera of Agung during September 2017, followed by a decrease in early October. Courtesy of PVMBG (Penurunan Status Gunungapi Agung, Bali Dari Level IV (awas) Ke Level III (siaga) Tanggal 29 Oktober 2017 Pukul 16.00 WITA). |
Activity during November 2017. For the first three weeks of November, dense white steam plumes rose 50-500 m above the summit crater. A VONA issued late on 11 November reported a 500-m-high steam plume. Seismicity continued at a much lower rate than during late September-October, with tens of daily events as opposed to hundreds.
The first ash emission of the current eruption occurred on 21 November at 1705 local time; the plume rose to 700 m and drifted ESE (figure 9). Trace amounts of ashfall were reported in the Pidpid-Nawehkerti area about 9 km SE. At the time of the first ash emission, BNPB reported the number of evacuees living in temporary housing at about 25,000. The emission was preceded by a low-frequency tremor. Multiple volcanic ash advisories were issued by the Darwin VAAC on 21 November, although the ash was not visible in satellite imagery due to weather clouds. Continuous tremor with 2-5 mm amplitude was recorded the following three days, and ash-and-steam emissions rose 300-800 m above the summit crater.
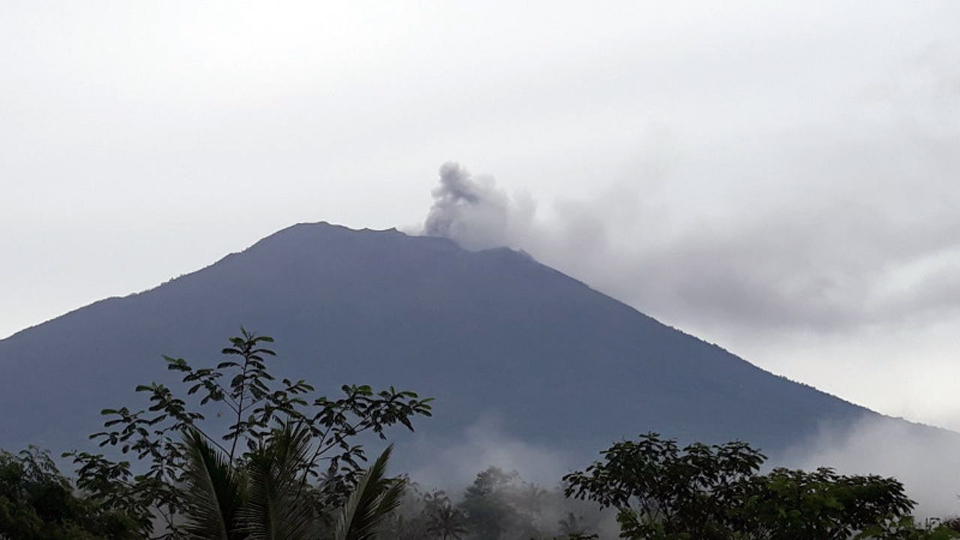 |
Figure 9. The first reported ash emission from Agung in 53 years rose 700 m and drifted SE on 21 November 2017. Courtesy of PVMBG (Letusan Gunung Agung Selasa, 21 November 2017 Pukul 17.05 WITA). |
A larger emission on 25 November sent black-gray ash plumes 2,000 m above the crater rim (figure 10) which then drifted W. The Darwin VAAC reported an ash plume visible in satellite imagery at 7.6 km altitude drifting WSW. Emissions continued later in the day, rising 4.6-6.7 km altitude and extending SE. Bright incandescence at the summit crater was observed that night. Ashfall was reported to the WSW in the villages of Menanga and Rendang (12 km SW) at the AVO Post, and also in Besakih Village, located in the upper part of Pempatan (8 km W). A number of international flights were cancelled from the I Gusti Ngurah Rai International Airport in Denpasar (60 km SW), affecting about 2,000 passengers, although the airport remained open.
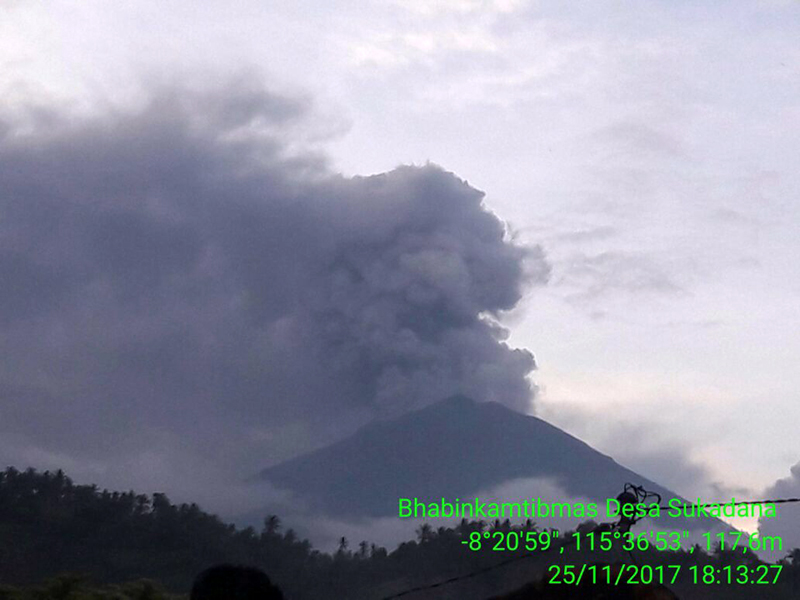 |
Figure 10. An ash emission rose at least 1,500 m above the summit of Agung on 25 November 2017 and drifted W. Courtesy of PVMBG (Letusan Gunung Agung 25 November 2017 Pukul 17:30 Wita). |
Around 0545 local time the following day (26 November), the intensity of the ash emissions increased; the top of the plume reached 3,300 m above the summit at 1100 local time, and was drifting SE and E (figure 11). Ashfall was reported in many areas downwind including North Duda (9 km S), Duda Timur (12 km S), Pempetan, Besakih, Sideman (15 km SSW), Tirta Abang, Sebudi (6 km SW), Amerta Bhuana (10 km SSW), and some villages in Gianyar (20 km WSW) (figure 12). The largest amount, deposits 5 mm thick, was reported in Sibetan (11 km SSE). Trace amounts of ash were also reported much farther away, in Nusa Penida (an island 40 km S), Lombok (100 km ESE), and Sumbawa, 250 km E on the island of West Nusa Tenggara. Explosions from the crater were audible 12.5 km away that evening. Incandescence at the summit was observed from Bukit Asah and Batulompeh. The Darwin VAAC reported continuous ash emissions to 7.9 km altitude drifting SE throughout most the day, increasing to 9.1 km later in the day; ashfall was also reported at the international airport.
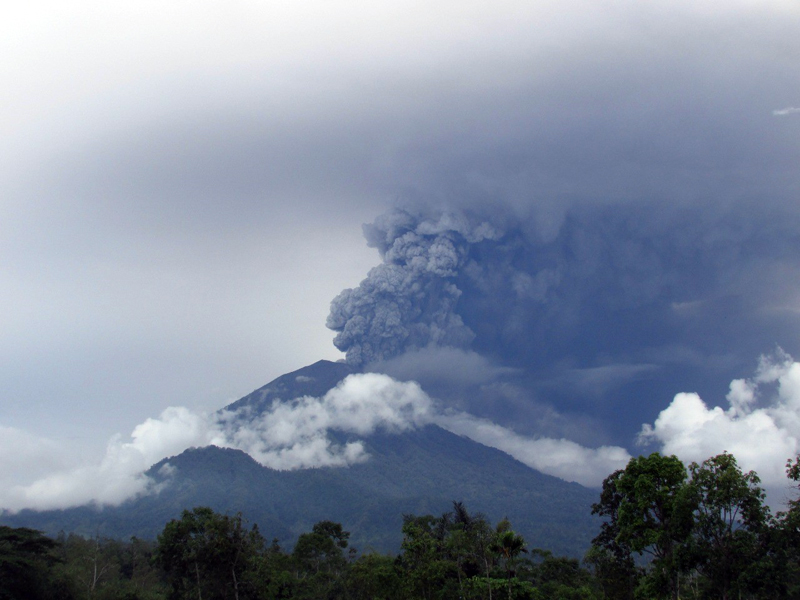 |
Figure 11. A dense plume of ash rose 3,000 m above the summit of Agung and drifted ESE on 26 November 2017. Courtesy of PVMBG (Peningkatan Status Gunungapi Agung, Bali Dari Level III (siaga) Ke Level IV (awas), 27 November 2017). |
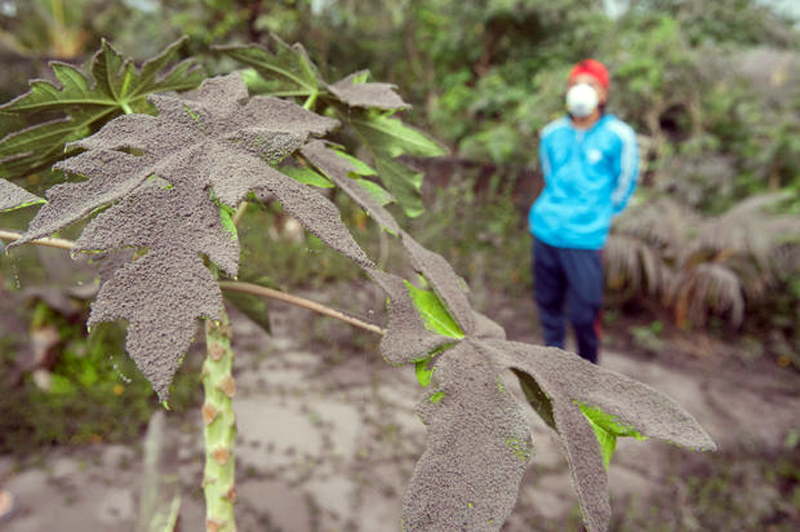 |
Figure 12. Ash from an eruption of Agung on 26 November 2017 covered garden plants in Jungutan Village, 7 km SE. Courtesy of Reuters. |
The airport in Denpasar was forced to close during 27-29 November 2017. On those days ash drifted in multiple directions at different altitudes; it was observed drifting E at 9.1 km altitude, SW at 7.6 km altitude, and was moving S below 6.1 km. This increase in emissions led PVMBG to raise the Alert Level from III to IV on 27 November. Pictures and video showed a white steam plume adjacent to a gray ash plume rising from the crater, suggesting two distinct sources (figure 13).
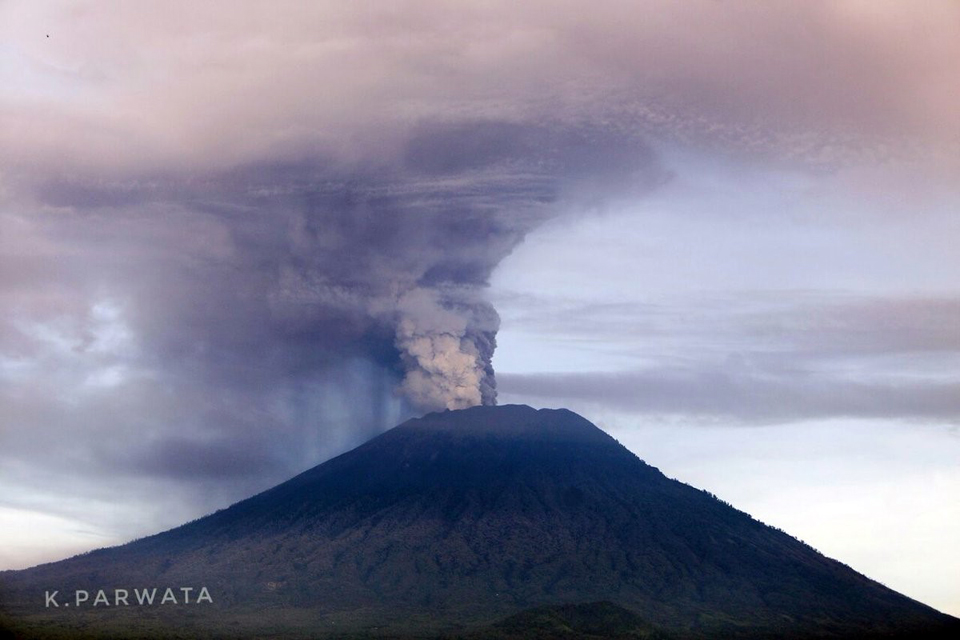 |
Figure 13. A white steam plume and dense gray ash both rose from the summit of Agung on 27 November 2017. Photo by K. Parwata, courtesy of Sutopo Purwo Nugroho, Twitter. |
A single MODVOLC thermal alert appeared at the summit that day, along with a strong thermal anomaly in the MIROVA system data (figure 14) consistent with the appearance of new lava in the summit crater. The tiltmeter installed at the Yehkori station 4 km S of the summit showed continued inflation of up to 6 microradians between 22 and 27 November (figure 15). PVMBG also increased the exclusion zone to a radius of 8 km from the summit crater plus areas 10 km from the summit to the NNE, SE, S, and SW.
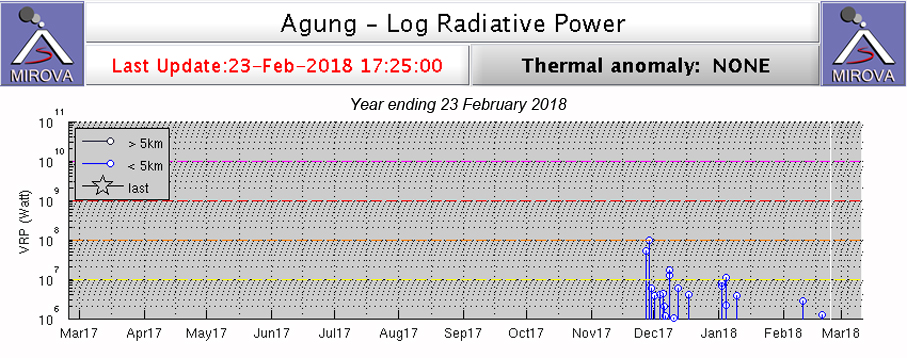 |
Figure 14. A MIROVA plot of satellite infrared data for the year ending 23 February 2018 showed the first thermal anomaly from Agung in late November 2017, consistent with the emergence of lava in the summit crater. Courtesy of MIROVA. |
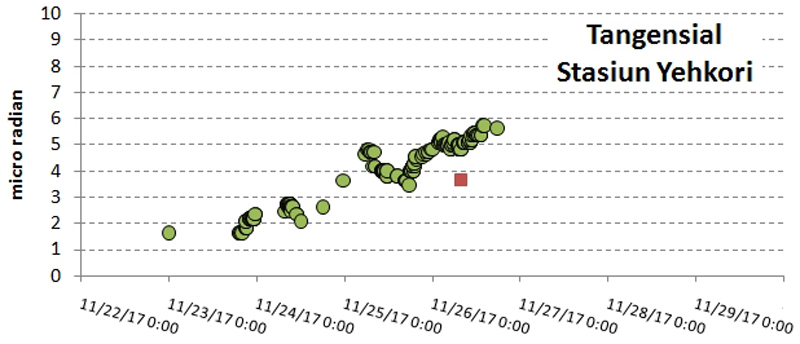 |
Figure 15. A steady inflation was measured by the tiltmeter located at the Yehkori station 4 km S of the summit of Agung between 22 November and 27 November. Courtesy of PVMBG (Peningkatan Status Gunungapi Agung, Bali Dari Level III (siaga) Ke Level IV (awas), 27 November 2017). |
MAGMA Indonesia reported that beginning with the ash eruption on 21 November, lahars appeared in the Tukad Yehsa, Tukad Sabuh, and Tukad Beliaung drainages on the S flank, as well as Tukad Bara on the N flank. As of the end of November 2017, these lahars had impacted houses, roads, and agricultural areas. Although ash emissions increased, and lava was confirmed within the summit crater during the last week of November, the number of seismic events remained well below the values recorded during September and October (figure 16).
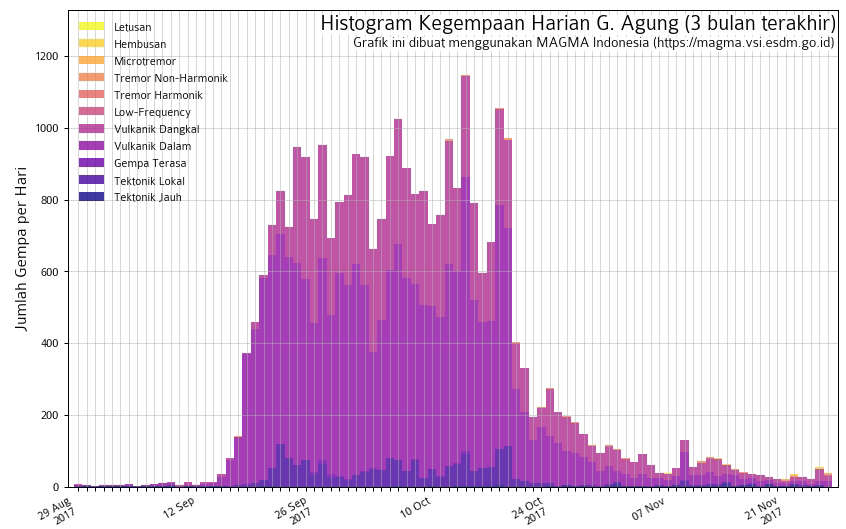 |
Figure 16. Seismicity at Agung decreased significantly beginning on 20 October 2017 and remained well below 200 daily events throughout November, even though ash emissions began on 21 November. Courtesy of PVMBG (Peningkatan Status Gunungapi Agung, Bali Dari Level III (siaga) Ke Level IV (awas), 27 November 2017). |
Ash emissions were reported by PVMBG rising to 3,000 m above the summit and drifting S on 27 November (figure 17). Continuing ash emission during 28-29 November rose to 2,000-4,000 m above the summit and drifted WSW (figure 18). Continuous seismic tremors were recorded during 28 November-1 December.
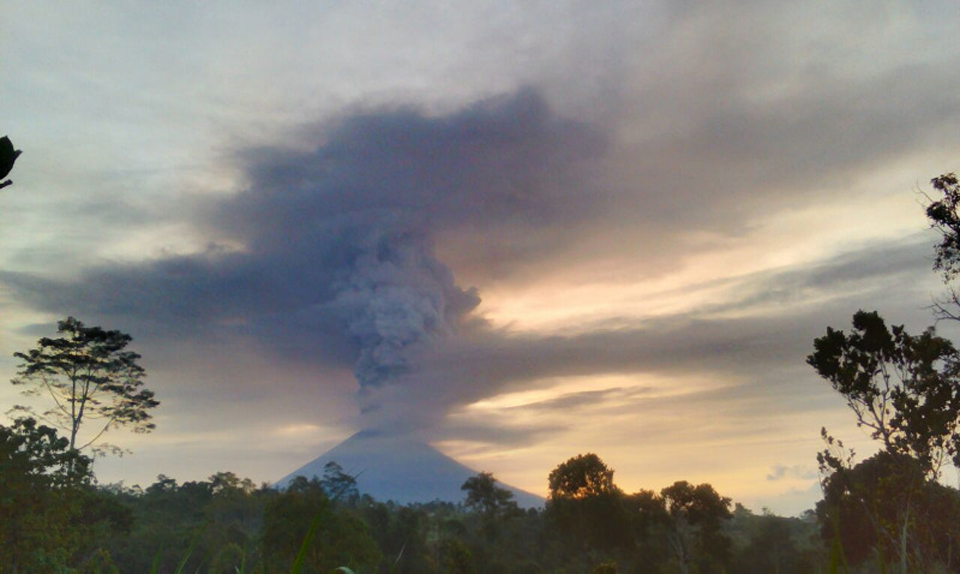 |
Figure 17. Ash plumes from Agung rose to altitudes of around 6,000 m (3,000 m above the summit crater) and drifted S on 27 November 2017. Image courtesy of MAGMA Indonesia (Peningkatan Status Gunungapi Agung, Bali Dari Level Ill (SIAGA) ke Level IV (AWAS), 27 November 2017 10:07 WIB, Ir. Kasbani, M.Sc.). |
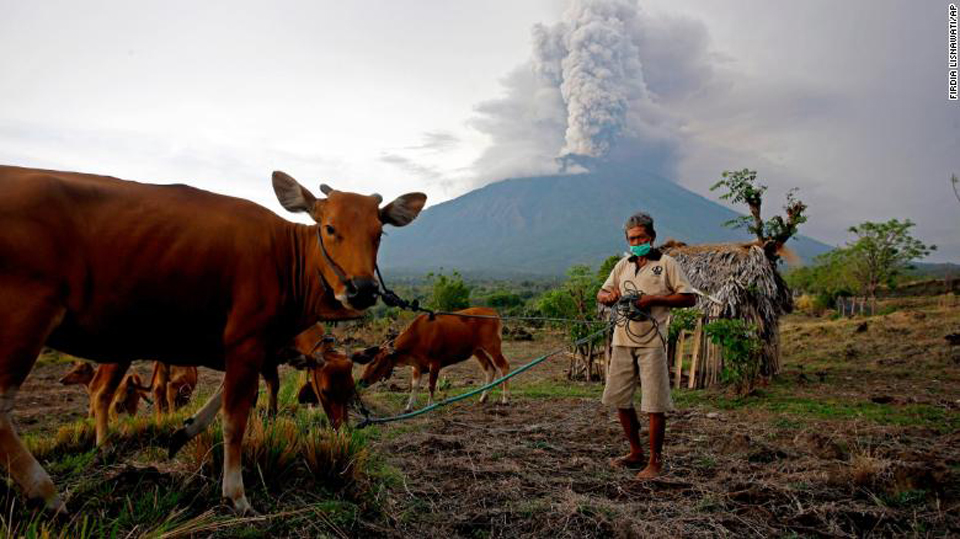 |
Figure 18. A dense plume of steam and ash rose from Agung and drifted away from this villager and his livestock on 28 November 2017. Courtesy of CNN. |
With the increase in ash emissions during the last days of November 2017, satellite instruments also recorded significant releases of SO2 (figure 19). MAGMA Indonesia reported on 1 December that satellite data also recorded high temperatures consistent with new lava within the crater on 27, 28, and 29 November 2017. They estimated the volume of lava in the crater to be about 20 million cubic meters, equivalent to about a third of the total crater volume. The base of the ash-and-steam plumes was often reddish during 29 November-5 December reflecting incandescence from the lava in the crater (figure 20).
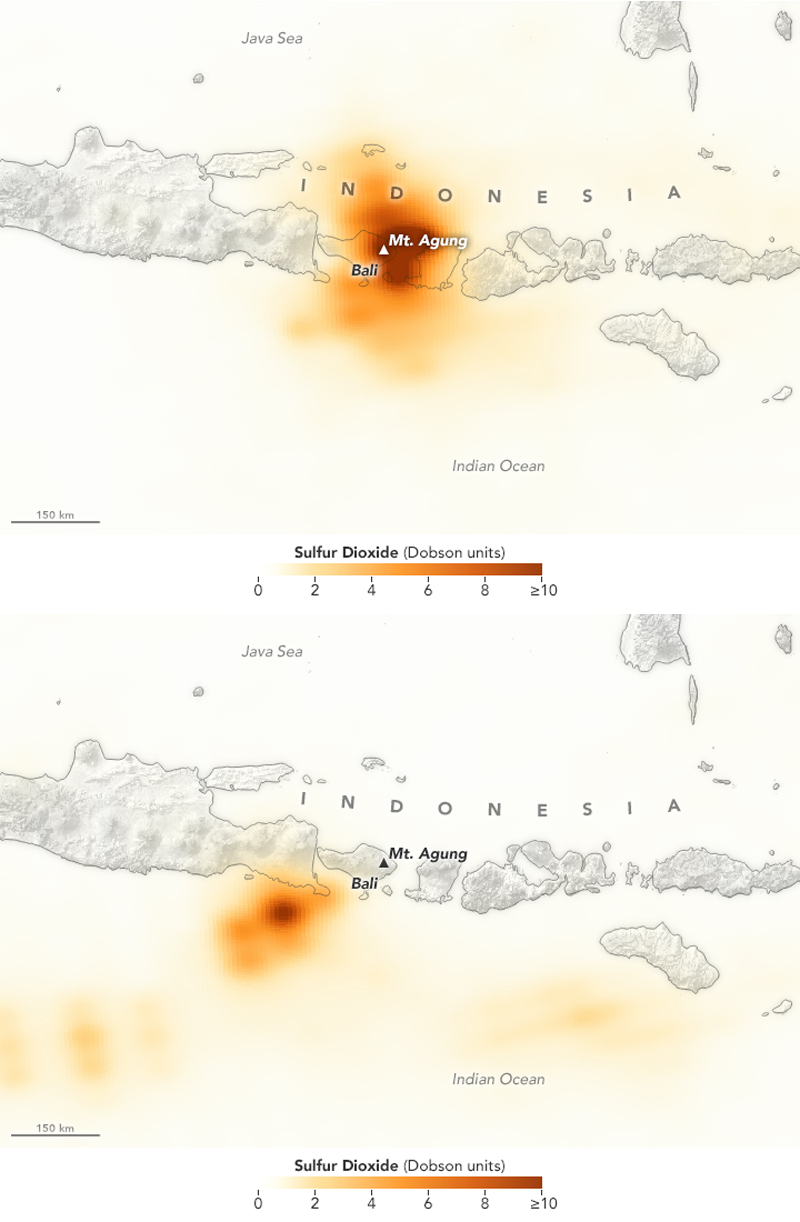 |
Figure 19. The concentrations of SO2 emitting from Agung increased to levels that were easily detected by the Ozone Mapper Profiler Suite (OMPS) on the Suomi National Polar-orbiting Partnership (Suomi-NPP) satellite on 27 (top) and 28 (bottom) November 2017. The concentration of SO2 is measured in Dobson Units, a measure of the molecular density of the SO2 in the atmosphere. These NASA Earth Observatory images were created by Joshua Stevens, using OMPS data from the Goddard Earth Sciences Data and Information Services Center (GES DISC). |
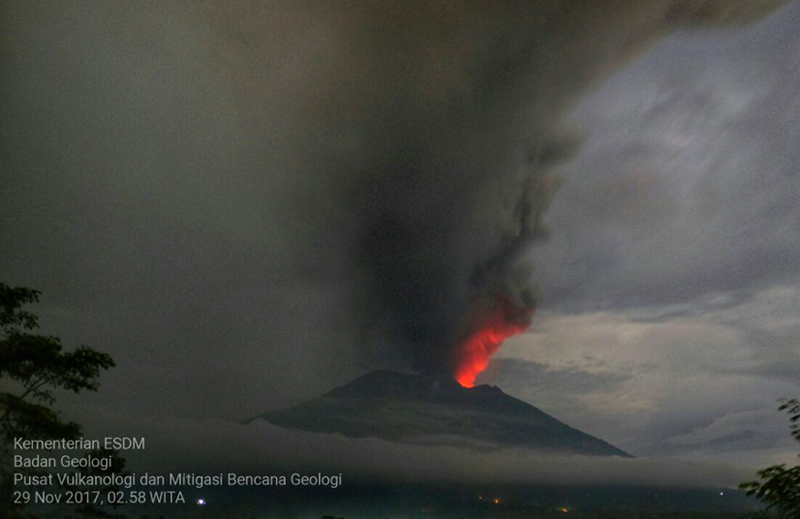 |
Figure 20. Incandescence appeared at the base of the ash-and-steam plume at Agung on 29 November 2017, consistent with lava effusion in the summit crater. Courtesy of MAGMA Indonesia (Perkembangan Terkini Aktivitas Gunung Agung (1 Desember 2017 21:00 WITA), 2 December 2017 07:55 WIB, Ir. Kasbani, M.Sc.). |
By 29 November, continuous ash emissions were rising to 6.4 km altitude and drifting from the SW towards the S, becoming diffuse over the Denpasar region (figure 21). The plume was observed moving E at the same elevation on 30 November, lowering to 5.5 km later in the day. Although emissions were primarily steam and gas beginning on 30 November, pilot reports on 1 December indicated ash was still visible SE of Agung, and steam-and-ash emissions were continuing. Steam-only emissions were reported on 2 December rising less than 1,000 m above the summit.
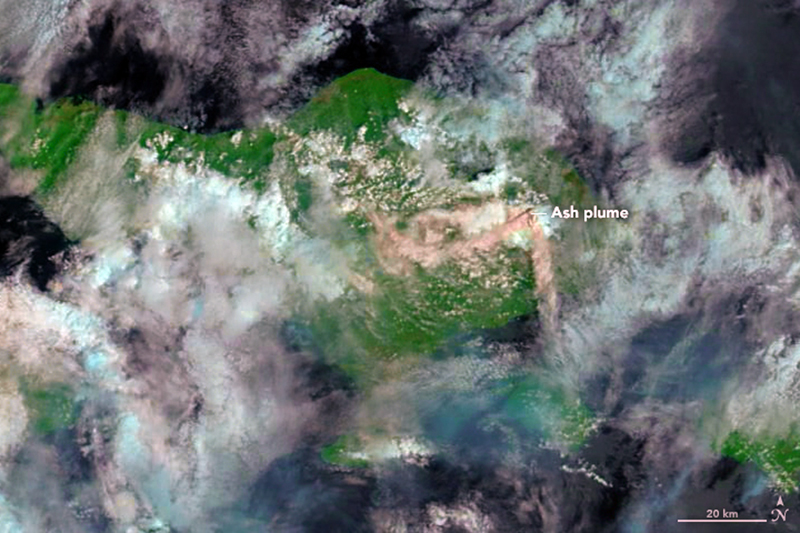 |
Figure 21. Gas-and-ash emissions from Agung on 29 November 2017 were drifting both W and S in this false-color image generated by the Moderate Resolution Imaging Spectroradiometer (MODIS) on NASA's Terra satellite. The image uses a combination of shortwave infrared light and natural color, making it easier to differentiate between ash, clouds, and forest. The plumes appear to rise from two vents in the volcano's summit crater. Courtesy of NASA Earth Observatory. |
Activity during December 2017. Steam, gas, and ash emissions continued throughout December 2017. During the first two weeks, emissions were primarily steam and gas, rising up to 2,000 m (figure 22), and incandescence was often observed at the summit. Dense gray ash emissions were observed, however, during 1-2 December. BNPB noted on 5 December that 63,885 evacuees were distributed in 225 evacuation shelters. On 8 December at 0759 a brief event generated a dense ash plume that rose 2.1 km above the crater rim and drifted W (figure 23). Minor amounts of ash were deposited on the flanks, and lapilli were reported in Temakung. A second ash plume rose 3 km at 1457 later that day.
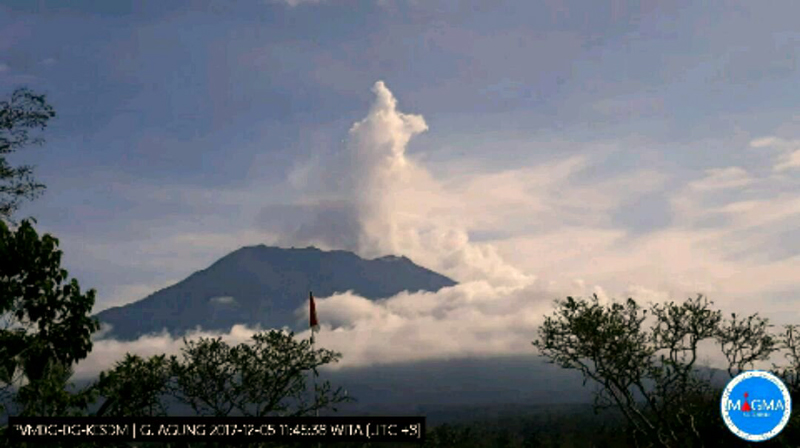 |
Figure 22. A burst of dense steam rose as high as 1,500 m from the crater of Agung on 5 December 2017 at 0848 local time (WITA) and drifted E, after which only a narrow diffuse plume remained. View is from the S. Courtesy of Sutopo Purwo Nugroho, Twitter. |
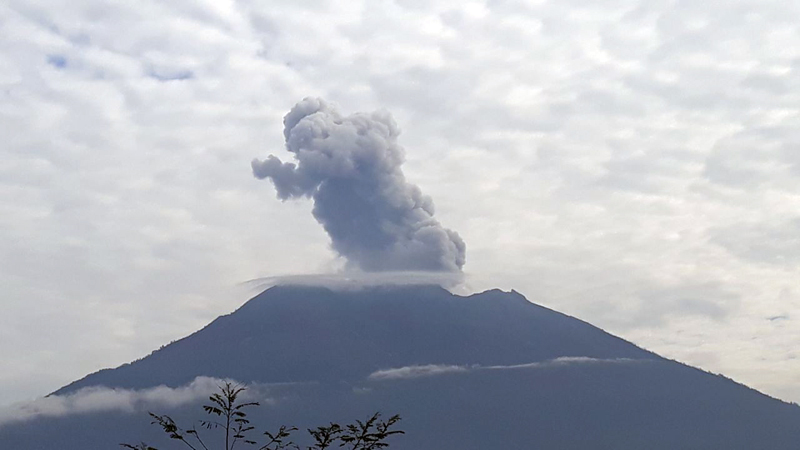 |
Figure 23. An eruption at Agung on 8 December 2017 at 0759 WITA sent a dense gray ash plume 2,100 m above peak to the W. View is from the S. Courtesy of Sutopo Purwo Nugroho, Twitter. |
The Darwin VAAC reported multiple daily explosions during 8-15 December, creating ash plumes that drifted NW, W, and WSW at altitudes between 4.3 and 5.5 km. The explosions were visible in the webcams and from ground-based observers, and occasionally in satellite imagery when not blocked by weather clouds. VONA's were issued for events on 8 and 12 December. Multiple events during 11-12 December sent plumes rising up to 2.5 km above the crater rim and drifting NW and W (figure 24).
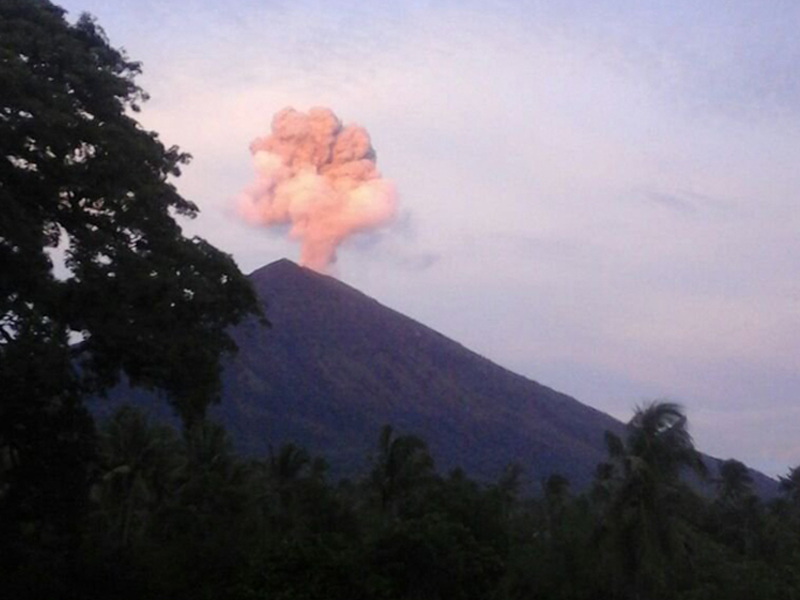 |
Figure 24. A small ash emission rose from the crater of Agung during the early morning of 11 December 2017. Courtesy of Sutopo Purwo Nugroho, Twitter. |
The Darwin VAAC reported larger ash emissions to 7.6 km altitude on 15 and 16 December interspersed with lower altitude (5.5-6.1 km) plumes. Continuing, regular discrete emissions during 16-17 December rose to 6.1 km and drifted WNW. An overhead image of the summit crater of 16 December revealed that, since a similar photo was taken on 20 October, new lava had filled about 1/3 of the crater with an estimated 30 million cubic meters of material (figure 25).
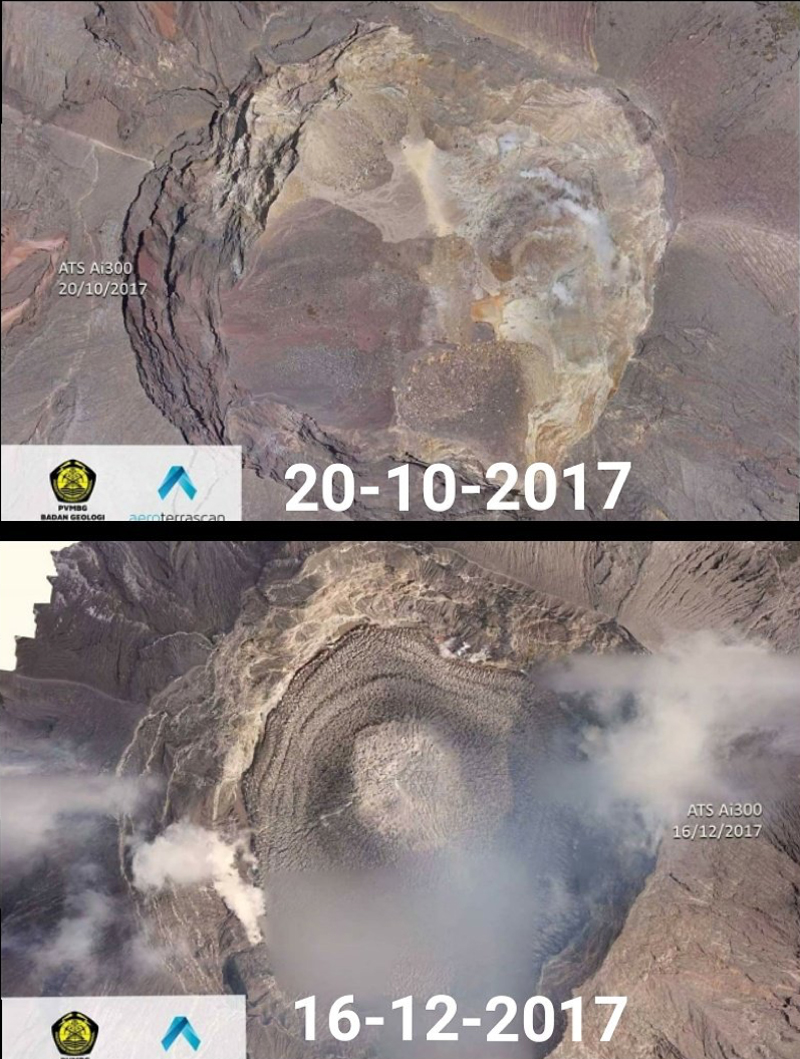 |
Figure 25. Repeated overhead images of the Agung summit crater taken on 20 October and 16 December 2017 showed new lava filling about 1/3 of the crater with an estimated 30 million cubic meters of material. Posted on Twitter by Sutopo Purwo Nugroho for BNBP. |
Discrete emissions to 5.5 km moving N and NNE were common during 18-21 December. Ash and steam drifted both E and W from the summit on 22 December. An ash emission on 23 December rose to 5.8 km and drifted NE, after which repeated emissions continued, rising to 4.6 km (figure 26). Ash fell on the flanks and in Tulamben, Kubu (9 km NE). In the morning of 24 December, a much larger plume drifting W at 10.7 km altitude was visible in satellite imagery. It dissipated after a few hours, and a separate plume was observed drifting NE at 5.5-5.8 km (figure 27); emissions continued throughout the day and into the next. PVMBG reported that the ash deposits from the NE-drifting plume were up to 3 mm thick (figure 28).
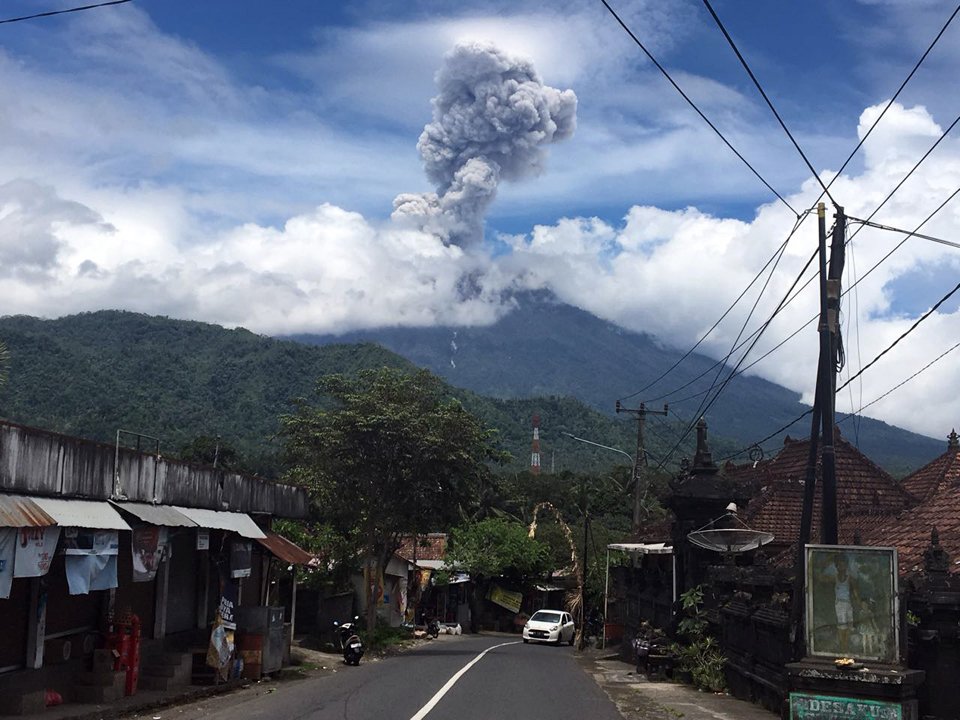 |
Figure 26. An event at Agung on 23 December 2017 sent a dense, gray plume to 2,500 m above the crater rim at 1157 WITA. View is from a village on the W flank, likely about 7 km from the summit. Courtesy of Sutopo Purwo Nugroho, Twitter. |
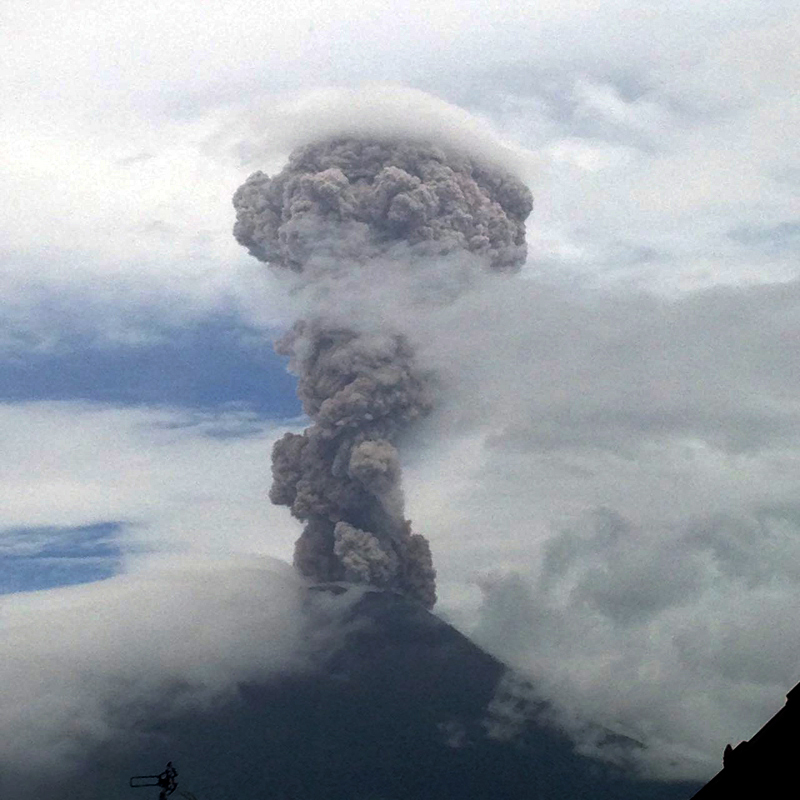 |
Figure 27. Agung erupted steam and ash with a plume height of 2,000-2,500 m on 24 December 2017 at 1005 WITA. Courtesy of Sutopo Purwo Nugroho, Twitter. |
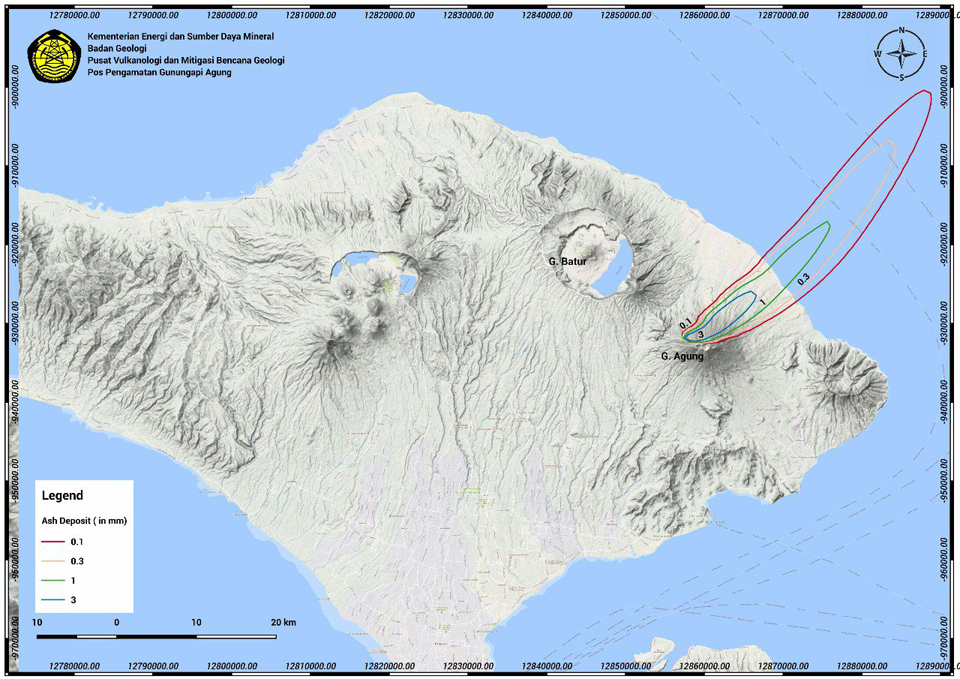 |
Figure 28. Map showing distribution and thickness of volcanic ash and lapilli from the ash emissions at Agung that began on 24 December 2017 at 1005 WITA. A thin layer of ash was deposited in a narrow NE trending band on the NE side of Agung. Courtesy of Sutopo Purwo Nugroho, Twitter. |
As of 25 December, BNPB reported just over 70,000 evacuees spread out in 239 shelters. Discrete ash emissions continued through the end of the month rising as high as 2 km above the crater rim and drifting in several different directions. The last VAAC report of 2017 indicated an ash plume drifting W at 4.3 km altitude on 31 December.
References: Chaussard E, Amelung F, Aoki Y, 2013, Characterization of open and closed volcanic systems in Indonesia and Mexico using InSAR time series. J Geophys Res Solid Earth, 118:3957–3969. DOI: 10.1002/jgrb.50288.
Fontijn K, Costa F, Sutawidjaja I, Newhall C G, Herrin J S, 2015, A 5000-year record of multiple highly explosive mafic eruptions from Gunung Agung (Bali, Indonesia): implications for eruption frequency and volcanic hazards. Bull Volcanol, 77: 59. DOI: 10.1007/s00445-015-0943-x.
Self S, Rampino M, 2012, The 1963–1964 eruption of Agung volcano (Bali, Indonesia). Bull Volcanol 74:1521–1536. DOI: 10.1007/s00445-012-0615-z.
Geological Summary. Symmetrical Agung stratovolcano, Bali's highest and most sacred mountain, towers over the eastern end of the island. The volcano, whose name means "Paramount," rises above the SE rim of the Batur caldera, and the northern and southern flanks extend to the coast. The summit area extends 1.5 km E-W, with the high point on the W and a steep-walled 800-m-wide crater on the E. The Pawon cone is located low on the SE flank. Only a few eruptions dating back to the early 19th century have been recorded in historical time. The 1963-64 eruption, one of the largest in the 20th century, produced voluminous ashfall along with devastating pyroclastic flows and lahars that caused extensive damage and many fatalities.
Information Contacts: Pusat Vulkanologi dan Mitigasi Bencana Geologi (PVMBG, also known as Indonesian Center for Volcanology and Geological Hazard Mitigation, CVGHM), Jalan Diponegoro 57, Bandung 40122, Indonesia (URL: http://www.vsi.esdm.go.id/); Badan Nasional Penanggulangan Bencana (BNPB), National Disaster Management Agency, Graha BNPB - Jl. Scout Kav.38, East Jakarta 13120, Indonesia (URL: http://www.bnpb.go.id/); MAGMA Indonesia, Kementerian Energi dan Sumber Daya Mineral (URL: https://magma.vsi.esdm.go.id/); NASA Earth Observatory, EOS Project Science Office, NASA Goddard Space Flight Center, Goddard, Maryland, USA (URL: http://earthobservatory.nasa.gov/); NASA Goddard Space Flight Center (NASA/GSFC), Global Sulfur Dioxide Monitoring Page, Atmospheric Chemistry and Dynamics Laboratory, 8800 Greenbelt Road, Goddard, Maryland, USA (URL: https://so2.gsfc.nasa.gov/); MIROVA (Middle InfraRed Observation of Volcanic Activity), a collaborative project between the Universities of Turin and Florence (Italy) supported by the Centre for Volcanic Risk of the Italian Civil Protection Department (URL: http://www.mirovaweb.it/); Hawai'i Institute of Geophysics and Planetology (HIGP) - MODVOLC Thermal Alerts System, School of Ocean and Earth Science and Technology (SOEST), Univ. of Hawai'i, 2525 Correa Road, Honolulu, HI 96822, USA (URL: http://modis.higp.hawaii.edu/); Antara News (URL: https://bali.antaranews.com); Sutopo Purwo Nugroho, Head of Information Data and Public Relations Center of BNPB via Twitter (URL: https://twitter.com/Sutopo_PN); Cable News Network (CNN), Turner Broadcasting System, Inc. (URL: http://www.cnn.com/); Reuters (URL: http://www.reuters.com/).