Report on Reventador (Ecuador) — August 2020
Bulletin of the Global Volcanism Network, vol. 45, no. 8 (August 2020)
Managing Editor: Edward Venzke.
Edited by Kadie L. Bennis.
Reventador (Ecuador) Frequent explosions, ash emissions, and incandescent block avalanches during February-July 2020
Please cite this report as:
Global Volcanism Program, 2020. Report on Reventador (Ecuador) (Bennis, K.L., and Venzke, E., eds.). Bulletin of the Global Volcanism Network, 45:8. Smithsonian Institution. https://doi.org/10.5479/si.GVP.BGVN202008-352010
Reventador
Ecuador
0.077°S, 77.656°W; summit elev. 3562 m
All times are local (unless otherwise noted)
Reventador is a stratovolcano located in the Cordillera Real, Ecuador with historical eruptions dating back to the 16th century. The most recent eruptive period began in 2008 and has continued through July 2020 with activity characterized by frequent explosions, ash emissions, and incandescent block avalanches (BGVN 45:02). This report covers volcanism from February through July 2020 using information primarily from the Instituto Geofísico (IG-EPN), the Washington Volcano Ash Advisory Center (VAAC), and various infrared satellite data.
During February to July 2020, IG-EPN reported almost daily explosions, gas-and-steam and ash emissions, and frequent crater incandescence. The highest average number of explosions per day was 26 in March, followed by an average of 25 explosions per day in June (table 12). Ash plumes rose to a maximum height of 2.5 km above the crater during this reporting period with the highest plume height recorded on 5 May 2020. Frequently at night, crater incandescence was observed, occasionally accompanied by incandescent block avalanches traveling as far as 900 m downslope from the summit of the volcano.
Table 12. Monthly summary of eruptive events recorded at Reventador from February through July 2020. Data courtesy of IG-EPN (February to July 2020 daily reports).
| Month | Average Number of Explosions per day | Max plume height above the crater |
| Feb 2020 | 17 | 1.3 km |
| Mar 2020 | 26 | 2.2 km |
| Apr 2020 | 21 | 1.4 km |
| May 2020 | 22 | 2.5 km |
| Jun 2020 | 25 | 1.3 km |
| Jul 2020 | 15 | 1.4 km |
During February 2020 there were between 2 and 32 explosions recorded each day, accompanied by gas-and-steam and ash emissions that rose about 700-1,300 m above the crater. At night and early morning crater incandescence was observed frequently throughout the reporting period from 1 February and onward. Incandescent block avalanches were also detected intermittently beginning on 5 February when incandescent blocks rolled 300-800 m downslope from the summit on all sides of the volcano. On 6 and 21 February, gas-and-steam and ash emissions rose to a high of 1.3 km above the crater, according to Washington VAAC notices (figure 125).
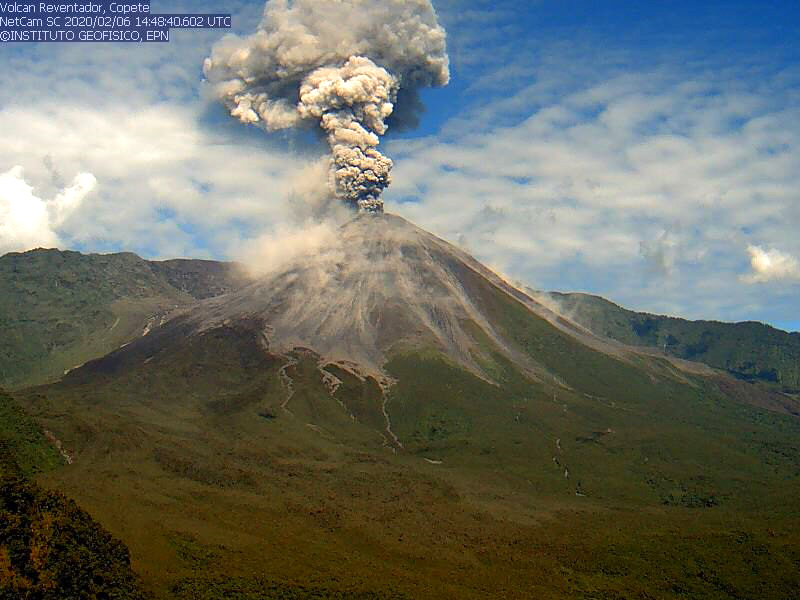 |
Figure 125. Webcam images of ash plumes rising from Reventador on 6 February 2020. Courtesy of IG-EPN (Informe diario del estado del Volcán Reventador No. 2020-37). |
Between 7 and 47 daily explosions were detected during March. On 17 March, rainfall generated two small lahars, accompanied by ash emissions that rose 1 km above the crater drifting NW. That same day, ashfall was reported in San Rafael (8 km ESE) SE of the volcano (figure 126). On 19 March ashfall was also reported in El Chaco (30 km SW), according to SNGR-Umeva-Orellana. At night, crater incandescence was observed and was occasionally accompanied by block avalanches traveling as far as 900 m downslope of the summit. Gas-and-steam and ash emissions continued, rising to 2.2 km above the crater on 28 March, according to the Washington VAAC notices.
 |
Figure 126. Photo of ashfall SE of Reventador on 17 March 2020. Courtesy of IG-EPN (IG al Instante Informativo Volcán Reventador No. 001). |
Activity persisted in April, characterized by almost daily gas-and-steam and ash emissions that rose to 1.4 km above the crater (figure 127) and intermittent crater incandescence observed at night and in the morning. The number of daily explosions detected per day ranged between 2 and 40, many of which were accompanied by block avalanches that traveled as far as 800 m downslope from the summit.
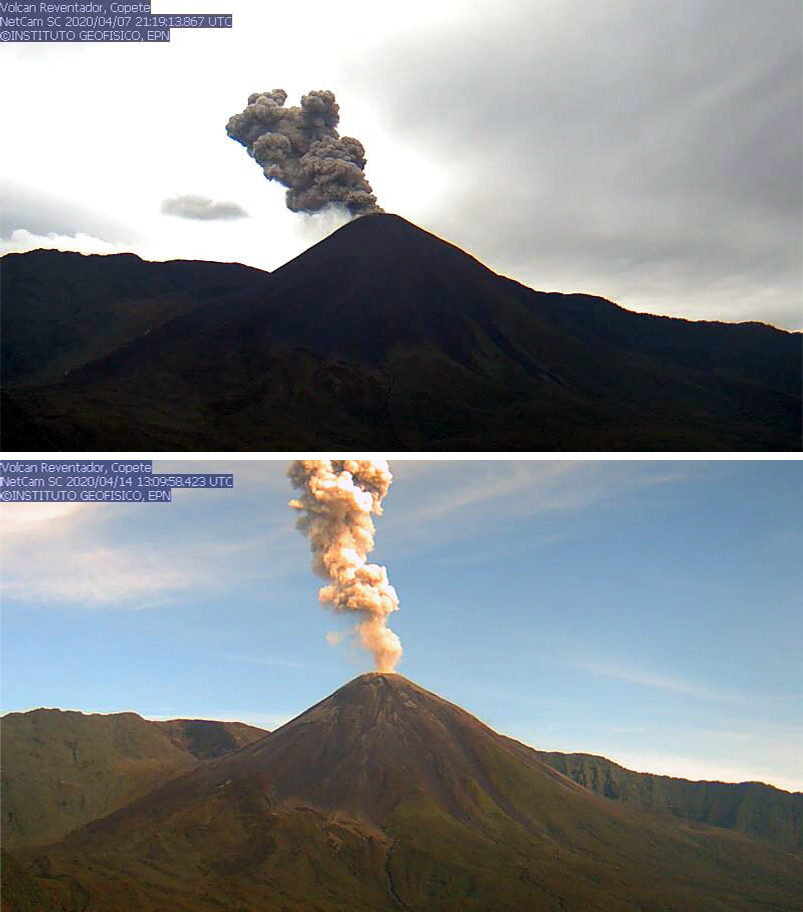 |
Figure 127. Webcam images showing gas-and-steam and ash plumes rising from Reventador on 7 (top) and 14 (bottom) April 2020. Courtesy of IG-EPN (Informe diario del estado del Volcán Reventador No. 2020-99 and 2020-105). |
During May, volcanism remained consistent, characterized by intermittent crater incandescence, gas-and-steam and ash emissions that rose 2.5 km above the crater, and daily explosions that ranged between 6 and 56 per day. On 14 May a Washington VAAC advisory stated there were three ash emissions that rose to a maximum of about 2.5 km above the crater and drifted W. At night, crater incandescence was observed accompanied by incandescent blocks that traveled 300 m below the summit on the SE flank; the furthest blocks traveled during this month was 800 m downslope.
The average number of daily explosions increased from 22 in May to 25 in June, and ranged between 0 and 51 per day, accompanied by gas-and-steam and ash emissions that rose 1.3 km above the crater (figure 128). At night, crater incandescence continued to be observed with occasional blocks rolling down the flanks up to 800 m downslope from the summit.
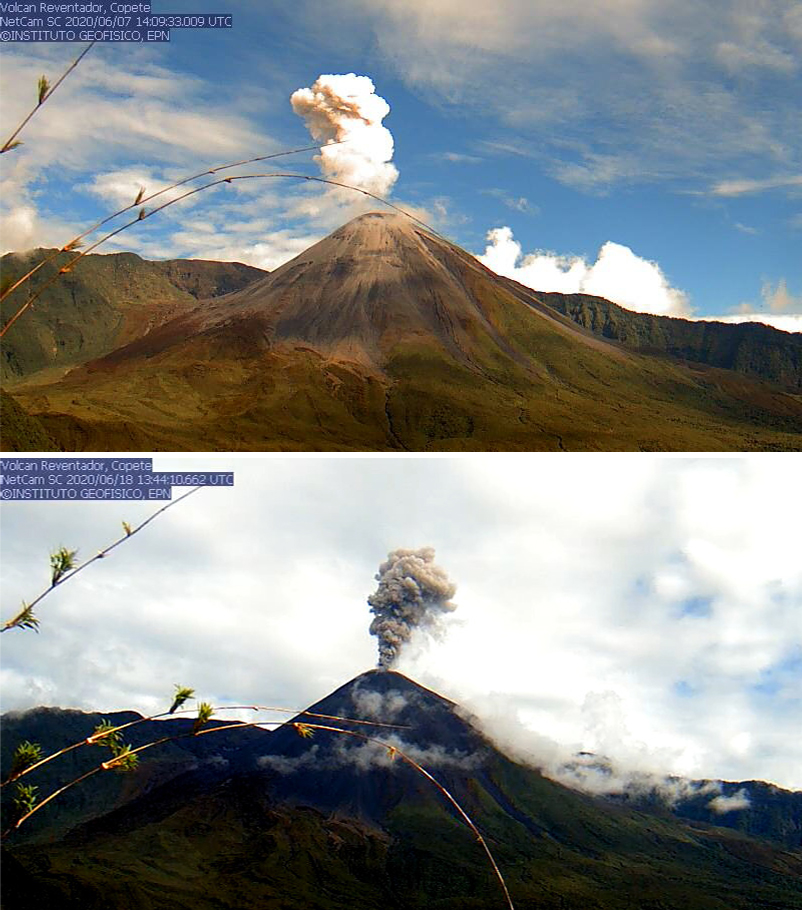 |
Figure 128. Webcam images showing gas-and-steam and ash plumes rising from Reventador on 7 (top) and 18 (bottom) June 2020. Courtesy of IG-EPN (Informe diario del estado del Volcán Reventador No. 2020-160 and 2020-171). |
By July, the average number of daily explosions decreased to 15 and gas-and-steam and ash emissions continued (figure 129). The maximum ash plume height during this month reached 1.4 km above the crater, according to a Washington VAAC advisory. Explosions still continued, ranging between 2 and 38 per day; explosions were not recorded in every daily report during this month. At night, crater incandescence was commonly observed and was sometimes accompanied by incandescent block avalanches that traveled as far as 800 m downslope from the summit. On 1 July a webcam image showed an explosion that produced an ash plume that rose 1 km above the crater drifting W and small pyroclastic flows near the cone. Another explosion on 5 July resulted in an ash plume that rose up to 1 km above the crater drifting W and NW accompanied by crater incandescence, a block avalanche that moved up to 800 m downslope, and a pyroclastic flow. On 22 and 24 July explosions ejected blocks that traveled downslope from the summit and were accompanied by pyroclastic flows that traveled down the N flank for 600 m.
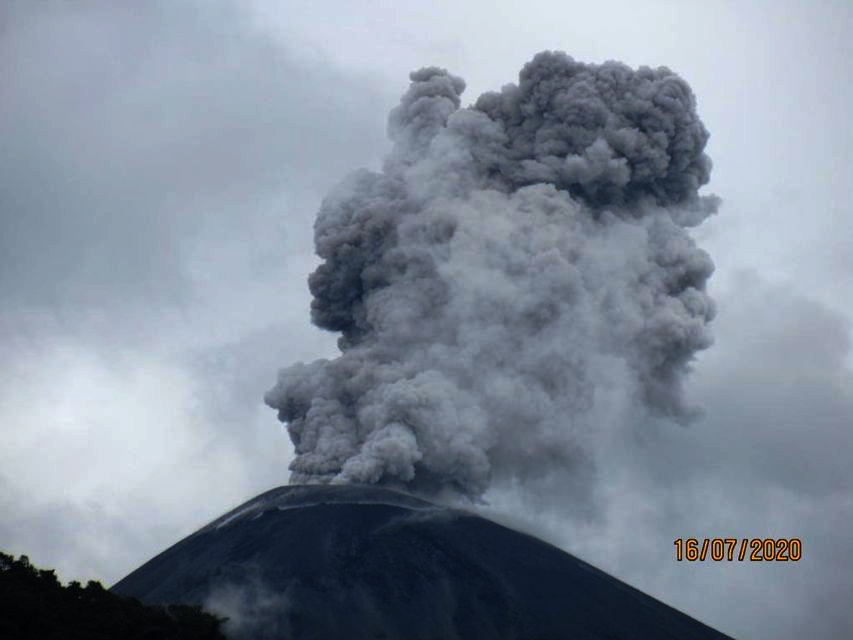 |
Figure 129. Image of an explosion at Reventador on 16 July 2020 that produced an ash column rising 500 m above the crater drifting N. Photo by Darwin Yánez (SNGRE, Servicio Nacional de Gestión de Riesgos y Emergencias del Ecuador), courtesy of IG-EPN (Informe Especial Reve N1 2020). |
MIROVA (Middle InfraRed Observation of Volcanic Activity) analysis of MODIS satellite data showed intermittent thermal anomalies within 5 km of the summit during 5 October 2019 and July 2020 (figure 130). There was a small decline in power from late April to late May, followed by a brief break in thermal anomalies from late May to mid-June 2020. In comparison, the MODVOLC algorithm identified nine thermal alerts between February and July 2020 near the crater summit on 5 February (2), 7 February (2), 12 February (1), 22 March (1), 27 April (1), 10 June (1), and 7 July (1). Some thermal anomalies can be seen in Sentinel-2 thermal satellite imagery on days with little cloud cover (figure 131).
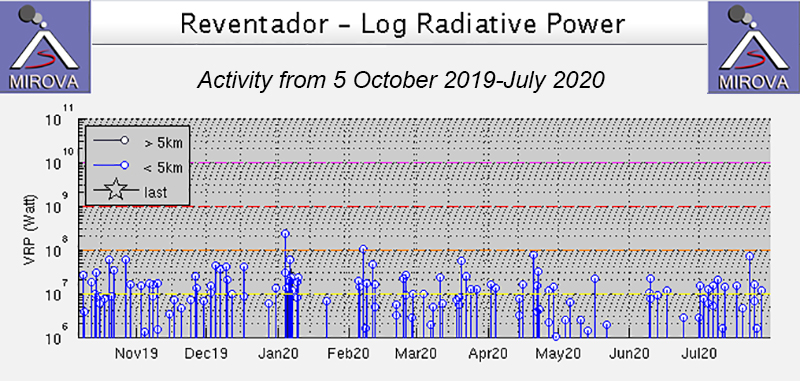 |
Figure 130. Thermal anomalies at Reventador persisted intermittently during 5 October 2019 through July 2020 as recorded by the MIROVA system (Log Radiative Power). Courtesy of MIROVA. |
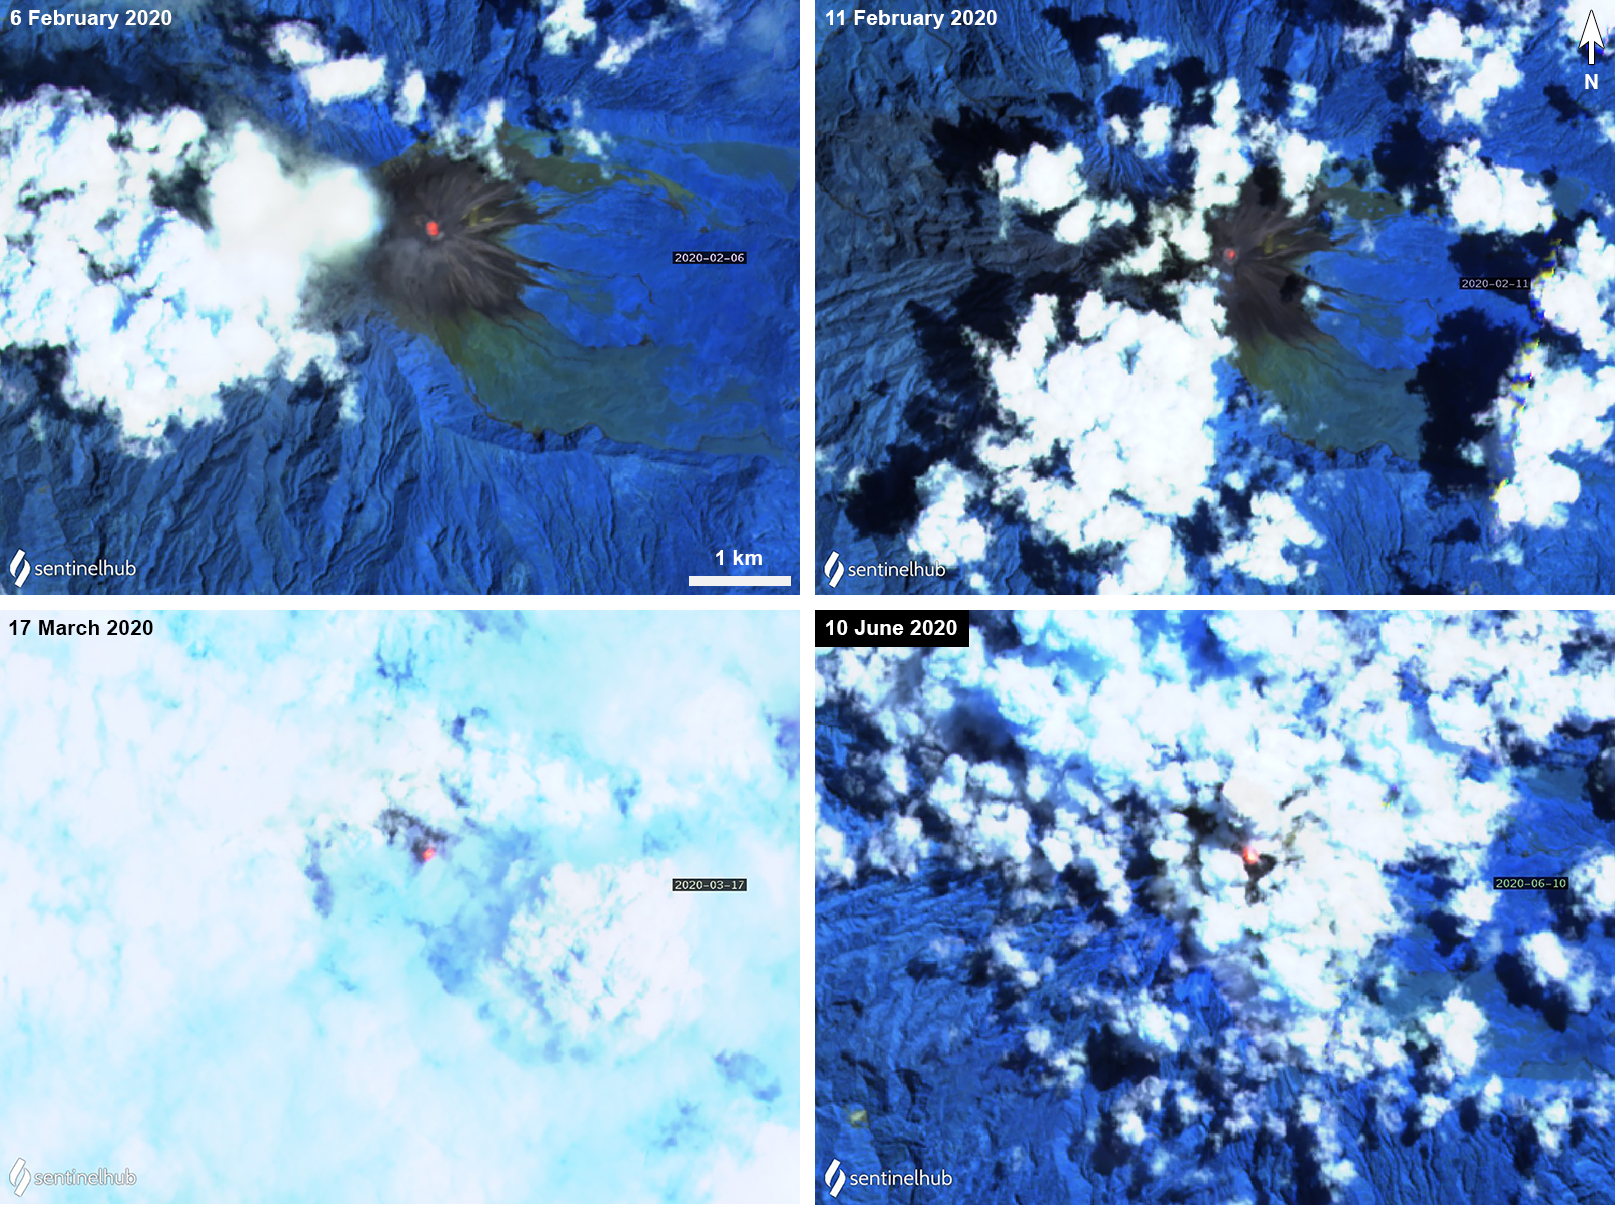 |
Figure 131. Sentinel-2 thermal satellite images of Reventador on 6 (top left) and 11 (top right) February, 17 March (bottom left), and 10 June (bottom right) showing a thermal hotspot in the central summit crater. Images with “Atmospheric penetration” (bands 12, 11, 8A) rendering; courtesy of Sentinel Hub Playground. |
Geological Summary. Volcán El Reventador is the most frequently active of a chain of Ecuadorian volcanoes in the Cordillera Real, well east of the principal volcanic axis. The forested, dominantly andesitic stratovolcano has 4-km-wide avalanche scarp open to the E formed by edifice collapse. A young, unvegetated, cone rises from the amphitheater floor to a height comparable to the rim. It has been the source of numerous lava flows as well as explosive eruptions visible from Quito, about 90 km ESE. Frequent lahars in this region of heavy rainfall have left extensive deposits on the scarp slope. The largest recorded eruption took place in 2002, producing a 17-km-high eruption column, pyroclastic flows that traveled up to 8 km, and lava flows from summit and flank vents.
Information Contacts: Instituto Geofísico, Escuela Politécnica Nacional (IG-EPN), Casilla 17-01-2759, Quito, Ecuador (URL: http://www.igepn.edu.ec/); Washington Volcanic Ash Advisory Center (VAAC), Satellite Analysis Branch (SAB), NOAA/NESDIS OSPO, NOAA Science Center Room 401, 5200 Auth Rd, Camp Springs, MD 20746, USA (URL: www.ospo.noaa.gov/Products/atmosphere/vaac, archive at: http://www.ssd.noaa.gov/VAAC/archive.html); Hawai'i Institute of Geophysics and Planetology (HIGP) - MODVOLC Thermal Alerts System, School of Ocean and Earth Science and Technology (SOEST), Univ. of Hawai'i, 2525 Correa Road, Honolulu, HI 96822, USA (URL: http://modis.higp.hawaii.edu/); MIROVA (Middle InfraRed Observation of Volcanic Activity), a collaborative project between the Universities of Turin and Florence (Italy) supported by the Centre for Volcanic Risk of the Italian Civil Protection Department (URL: http://www.mirovaweb.it/); Sentinel Hub Playground (URL: https://www.sentinel-hub.com/explore/sentinel-playground).