The Instituto Geofísico-Escuela Politécnica Nacional (IG-EPN) reported that eruptive activity continued at Reventador during 13-18 November. Seismicity included 50-73 daily explosions, long-period earthquakes, harmonic tremor, and tremor associated with emissions. Daily ash-and-gas plumes visible in webcam and/or satellite images rose as high as 2 km above the crater rim and drifted in multiple directions. Webcams recorded periodic crater incandescence and multiple nightly instances of incandescent material descending the flanks as far as 1 km below the crater rim. On 18 November a pyroclastic flow traveled 700 m down the SE flank. Secretaría de Gestión de Riesgos (SGR) maintained the Alert Level at Orange (the second highest level on a four-color scale).
Sources: Instituto Geofísico-Escuela Politécnica Nacional (IG-EPN), Secretaría de Gestión de Riesgos (SGR)
Daily explosions, gas-and-ash emissions, and block avalanches persisted during April-July 2023
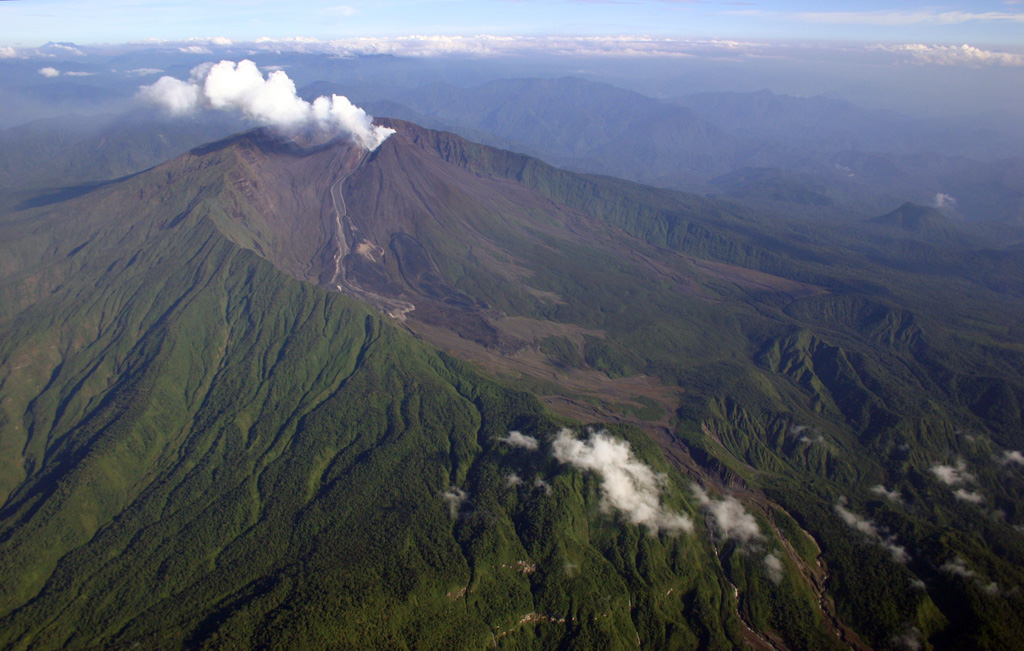
Volcán El Reventador, located in Ecuador, is a stratovolcano with a 4-km-wide avalanche scarp open to the E that was formed by edifice collapse. The largest recorded eruption took place in 2002, producing a 17-km-high eruption column, pyroclastic flows that traveled up to 8 km, and lava flows from summit and flank vents. Recorded eruptions date back to the 16th century and have been characterized by explosive events, lava flows, ash plumes, and lahars. Frequent lahars in this region of heavy rainfall have built deposits on the scarp slope. The current eruption period began in July 2008 and has recently been characterized by daily explosions, gas-and-ash emissions, crater incandescence, and block avalanches (BGVN 48:04). This report updates similar activity during April through July 2023 using daily reports from Ecuador's Instituto Geofisico (IG-EPN), the Washington Volcano Ash Advisory Center (VAAC), and satellite data.
During April through July 2023, IG-EPN reported daily explosions, gas-and-ash plumes rising as high as 3 km above the crater, and frequent nighttime crater incandescence, often accompanied by incandescent block avalanches that affected one or multiple flanks. On average, there were more daily explosions detected during May 2023, with an average total of 39 per day (table 18).
Table 18. Monthly summary of explosions and plume heights recorded at Reventador from April through July 2023. Data courtesy of IG-EPN (April-July 2023 daily reports) and the Washington VAAC.
| Month | Average number of explosions per day | Max plume height above the crater rim (km) |
| Apr 2023 | 29 | 1.6 |
| May 2023 | 39 | 3 |
| Jun 2023 | 20 | 2 |
| Jul 2023 | 31 | 1.2 |
Activity during April 2023 consisted of 18-42 daily explosions that ejected material and nighttime crater incandescence, though weather clouds often prevented clear views of the summit. Frequent seismicity was mainly characterized by long-period (LP) events and tremor associated with emissions (TREMI). Intermittent gas-and-ash emissions rose 500-1,500 m above the summit and drifted N, NW, W, SW, and NE, based on webcam images and satellite imagery (figure 175). The Washington VAAC also reported frequent ash emissions that rose 700-1,600 m above the crater and drifted E, NW, SE, NE, N, and W. During 31 March to 1 April nighttime crater incandescence was observed and ejected material landed 400 m below the crater on the E flank. Incandescent blocks were visible rolling on each of the flanks as far as 500 m below the crater during 4-5 April. During 9-16 April incandescent blocks were visible affecting one or multiple flanks, traveling as far as 500-700 m below the crater rim. A small pyroclastic flow deposit was reported on the SE flank during 10-11 April. During the night and early morning of 14-15 April several explosions were observed, accompanied by incandescent blocks descending all the flanks as far as 700 m below the crater. IG-EPN reported that the REVN station stopped working due to technical problems, so event data was not recorded during 18 April through 3 May. According to GOES-16 satellite images, ash emissions rose less than 1.5 km above the crater and drifted SE, which caused light ashfall in Gonzalo Díaz de Pinea (El Chaco, 35 km SE) on 18 April.
 |
Figure 175. Webcam image of a gas-and-ash plume rising above Reventador on 20 April 2023. Courtesy of IG-EPN (INFORME DIARIO DEL VOLCAN REVENTADOR No. 2023-111, 21 de abril de 2023). |
Gas-and-ash emissions and seismicity characterized by frequent LP- and TREMI-type events continued during May. Near-daily explosions ranged from 21-68 per day, sometimes accompanied by incandescent block avalanches, which affected one or multiple flanks and traveled 500-1,000 m below the crater rim (figure 176). Frequent gas-and-ash emissions rose 250-3,000 m above the crater and drifted in multiple directions, according to webcam and satellite imagery; the highest gas-and-ash plume rose 3 km above the crater during the morning of 23 May and drifted W and NW. Several explosions were observed in webcam images; resulting ash plumes rose 500-1,000 m above the crater and drifted W during 5-6 May. Nighttime crater incandescence was visible almost every night on clear weather days. According to the Washington VAAC, frequent ash emissions rose 400-1,300 m above the crater and drifted W, NW, N, and NE. At 1957 on 12 May webcam images showed incandescent material traveling 200 m below the crater rim. The REVS seismic station recorded a high-frequency signal possibly associated with mudflows at 1000 on 18 May. During the morning of 28 May IG-EPN reported a lahar toward the E, though no damage was noted.
 |
Figure 176. Webcam image of incandescent block avalanches descending the flanks of Reventador as far as 800 m below the crater rim on 22 May 2023. The dotted arrow is undefined. Courtesy of IG-EPN (INFORME DIARIO DEL VOLCAN REVENTADOR No. 2023-142, 22 de mayo de 2023). |
Daily explosions and ash plumes continued during June, with 7-45 explosions recorded each day. LP and TREMI-type events and crater incandescence were also frequently recorded on clear weather days, cloudy weather often obscured views of the summit. Gas-and-ash emissions rose 200-1,000 m above the summit and drifted W, NW, SW, and NE (figure 177). Nighttime crater incandescence persisted, accompanied by block avalanches that traveled 400-800 m below the summit affecting one or multiple flanks. The Washington VAAC reported that ash emissions rose 700-2,000 m above the crater and drifted NW and W. During the night of 21 June crater incandescence was reported, as well as a lava flow that descended the S flank. The flow continued into the morning of 22 June.
 |
Figure 177. Webcam image of a gas-and-ash plume rising above Reventador on 12 June 2023. Courtesy of IG-EPN (INFORME DIARIO DEL VOLCAN REVENTADOR No. 2023-163, 12 de junio de 2023). |
Daily explosions, LP- and TREMI-type events, crater incandescence, and block avalanches continued during July. There were 16-59 daily explosions detected throughout the month. Gas-and-ash emissions rose 200-1,200 m above the crater and drifted in different directions (figure 178). Nighttime crater incandescence continued, with frequent block avalanches affecting all the flanks and descending 400-800 m below the crater rim. The Washington VAAC reported that intermittent ash emissions rose 700-1,000 m above the summit and drifted W and NW. On 7 July at approximately 1100 the REVS and REVN seismic stations recorded high-frequency signals that corresponded to lahars descending the drainage system.
 |
Figure 178. Webcam image of a gray gas-and-ash plume rising above Reventador on 13 July 2023. Courtesy of IG-EPN (INFORME DIARIO DEL VOLCAN REVENTADOR No. 2023-194, 13 de julio de 2023). |
Additional satellite data. MIROVA (Middle InfraRed Observation of Volcanic Activity) analysis of MODIS satellite data showed intermittent thermal anomalies of low-to-moderate power (figure 179). The MODVOLC hotspot system identified a total of six hotspots on 5 April (3), 14 April (2), and 4 July (1). Though the summit was often obscured by weather clouds, an infrared satellite image taken on 11 April showed a strong thermal anomaly.
 |
Figure 179. Intermittent low-to-moderate strength thermal activity was detected at Reventador during April through July 2023, based on this MIROVA graph (Log Radiative Power). Courtesy of MIROVA. |
Information Contacts: Instituto Geofísico, Escuela Politécnica Nacional (IG-EPN), Casilla 17-01-2759, Quito, Ecuador (URL: http://www.igepn.edu.ec/); MIROVA (Middle InfraRed Observation of Volcanic Activity), a collaborative project between the Universities of Turin and Florence (Italy) supported by the Centre for Volcanic Risk of the Italian Civil Protection Department (URL: http://www.mirovaweb.it/); Hawai'i Institute of Geophysics and Planetology (HIGP) - MODVOLC Thermal Alerts System, School of Ocean and Earth Science and Technology (SOEST), Univ. of Hawai'i, 2525 Correa Road, Honolulu, HI 96822, USA (URL: http://modis.higp.hawaii.edu/); Copernicus Data Space Ecosystem, European Space Agency (URL: https://dataspace.copernicus.eu/browser/).
2025: January
| February
| March
| April
| May
| June
| July
| August
| September
| November
2024: January
| February
| March
| April
| May
| June
| July
| August
| September
| October
| November
| December
2023: January
| February
| March
| April
| May
| June
| July
| August
| September
| October
| November
| December
2022: January
| February
| March
| April
| May
| June
| July
| August
| September
| October
| November
| December
2021: January
| March
| June
| August
| September
| October
| November
| December
2020: January
| February
| March
| April
| May
| June
| July
| August
| September
| October
| November
| December
2019: January
| March
| April
| May
| July
| August
| October
| December
2018: January
| March
| April
| May
| June
| August
| October
2017: January
| February
| March
| April
| May
| June
| August
| September
| October
| November
| December
2016: January
| February
| March
| April
| May
| June
| August
| November
2015: January
| February
| March
| April
| May
| June
| July
| August
| September
| November
2014: January
| March
| April
| May
| June
| July
| August
| September
| November
| December
2013: January
| February
| March
| April
| May
| June
| July
| August
| September
| October
2012: January
| February
| March
| April
| August
| September
| October
| November
| December
2011: January
| August
2010: February
| April
| May
| August
| September
| October
| November
2009: March
| April
| May
| August
| September
| October
| November
2008: July
| August
| November
2007: March
| April
| May
| June
| October
2005: January
| April
| May
| June
| July
| August
| September
| November
| December
2004: February
| May
| December
2003: January
| February
| March
| May
| July
| October
| November
2002: October
| November
| December
The Instituto Geofísico-Escuela Politécnica Nacional (IG-EPN) reported that eruptive activity continued at Reventador during 13-18 November. Seismicity included 50-73 daily explosions, long-period earthquakes, harmonic tremor, and tremor associated with emissions. Daily ash-and-gas plumes visible in webcam and/or satellite images rose as high as 2 km above the crater rim and drifted in multiple directions. Webcams recorded periodic crater incandescence and multiple nightly instances of incandescent material descending the flanks as far as 1 km below the crater rim. On 18 November a pyroclastic flow traveled 700 m down the SE flank. Secretaría de Gestión de Riesgos (SGR) maintained the Alert Level at Orange (the second highest level on a four-color scale).
Sources: Instituto Geofísico-Escuela Politécnica Nacional (IG-EPN); Secretaría de Gestión de Riesgos (SGR)
The Instituto Geofísico-Escuela Politécnica Nacional (IG-EPN) reported that eruptive activity continued at Reventador during 9-16 September. Seismicity included 67-108 daily explosions, long-period earthquakes, harmonic tremor, and tremor associated with emissions. Ash-and-gas plumes visible in webcam and/or satellite images on most days rose as high as 1.4 km above the crater rim and drifted mainly NW, W, and SW. Webcams recorded multiple nightly instances of incandescent material descending the flanks as far as 1.1 km below the crater rim. Cloudy weather occasionally obscured views. Secretaría de Gestión de Riesgos (SGR) maintained the Alert Level at Orange (the second highest level on a four-color scale).
Sources: Instituto Geofísico-Escuela Politécnica Nacional (IG-EPN); Secretaría de Gestión de Riesgos (SGR)
The Instituto Geofísico-Escuela Politécnica Nacional (IG-EPN) reported that eruptive activity continued at Reventador during 19-26 August. Seismicity included 56-104 daily explosions, long-period earthquakes, harmonic tremor, and tremor associated with emissions. Daily ash-and-gas plumes visible in webcam and/or satellite images rose as high as 1.3 km above the crater rim and drifted in multiple directions, though mainly NW, W, and SW. Webcams recorded multiple nightly instances of incandescent material descending the flanks as far as 1.1 km below the crater rim. Cloudy weather occasionally obscured views. Secretaría de Gestión de Riesgos (SGR) maintained the Alert Level at Orange (the second highest level on a four-color scale).
Sources: Instituto Geofísico-Escuela Politécnica Nacional (IG-EPN); Secretaría de Gestión de Riesgos (SGR)
The Instituto Geofísico-Escuela Politécnica Nacional (IG-EPN) reported that eruptive activity continued at Reventador during 15-22 July. Seismicity included 68-110 daily explosions, long-period earthquakes, harmonic tremor, and tremor associated with emissions. Ash-and-gas plumes rose as high as 1.1 km above the crater rim and drifted mainly NW, ESE, and SE during 15-18 July. Webcams recorded multiple nightly instances of incandescent material descending the flanks as far as 1.1 km below the crater rim. Cloudy weather often obscured views. Secretaría de Gestión de Riesgos (SGR) maintained the Alert Level at Orange (the second highest level on a four-color scale).
Sources: Instituto Geofísico-Escuela Politécnica Nacional (IG-EPN); Secretaría de Gestión de Riesgos (SGR)
The Instituto Geofísico-Escuela Politécnica Nacional (IG-EPN) reported that eruptive activity continued at Reventador during 1-8 July. Seismicity included 70-112 daily explosions, long-period earthquakes, harmonic tremor, and tremor associated with emissions. Multiple daily ash-and-gas plumes rose 400-700 m above the crater rim and drifted mainly NW, W, and SW. Webcams recorded multiple nightly instances of incandescent material descending the flanks as far as 1.1 km below the crater rim. Secretaría de Gestión de Riesgos (SGR) maintained the Alert Level at Orange (the second highest level on a four-color scale).
Sources: Instituto Geofísico-Escuela Politécnica Nacional (IG-EPN); Secretaría de Gestión de Riesgos (SGR)
The Instituto Geofísico-Escuela Politécnica Nacional (IG-EPN) reported that eruptive activity continued at Reventador during 10-17 June. Seismicity included 51-94 daily explosions, long-period earthquakes, harmonic tremor, and tremor associated with emissions. Multiple daily ash-and-gas plumes rose 400-1,600 m above the crater rim and drifted downwind. Webcams recorded multiple nightly instances of incandescent material descending mainly the SE and S flanks as far as 1.1 km below the crater rim. Secretaría de Gestión de Riesgos (SGR) maintained the Alert Level at Orange (the second highest level on a four-color scale).
Sources: Instituto Geofísico-Escuela Politécnica Nacional (IG-EPN); Secretaría de Gestión de Riesgos (SGR)
The Instituto Geofísico-Escuela Politécnica Nacional (IG-EPN) reported that eruptive activity continued at Reventador during 3-10 June. Seismicity included 61-79 daily explosions, long-period earthquakes, harmonic tremor, and tremor associated with emissions. Multiple daily ash-and-gas plumes rose 200-1,200 m above the crater rim and drifted mainly NW, W, and SW. Webcams recorded multiple nightly instances of incandescent material descending the flanks as far as 1.1 km below the crater rim, specifically down the SE and ESE flanks during 4-5 June and the S flanks during 9-10 June. Starting at 1631 on 6 June a moderate-sized lahar descended the N flank based on seismic data. Weather clouds occasionally obscured views. Secretaría de Gestión de Riesgos (SGR) maintained the Alert Level at Orange (the second highest level on a four-color scale).
Sources: Instituto Geofísico-Escuela Politécnica Nacional (IG-EPN); Secretaría de Gestión de Riesgos (SGR)
The Instituto Geofísico-Escuela Politécnica Nacional (IG-EPN) reported that eruptive activity continued at Reventador during 13-20 May. Seismicity included 68-106 daily explosions, long-period earthquakes, harmonic tremor, and tremor associated with emissions. Multiple daily ash-and-gas plumes rose 200-2,000 m above the crater rim and drifted in multiple directions. Webcams recorded multiple nightly instances of incandescent material descending the flanks as far as 1.1 km below the crater rim, specifically down the ESE and SE flanks during 17-18 May. Weather clouds occasionally obscured views. Secretaría de Gestión de Riesgos (SGR) maintained the Alert Level at Orange (the second highest level on a four-color scale).
Source: Instituto Geofísico-Escuela Politécnica Nacional (IG-EPN)
The Instituto Geofísico-Escuela Politécnica Nacional (IG-EPN) reported that eruptive activity continued at Reventador during 9-15 April. Seismicity included 57-100 daily explosions, long-period earthquakes, harmonic tremor, and tremor associated with emissions. Multiple daily ash-and-gas plumes rose 300-1,300 m above the crater rim and drifted mainly NW, W, and SW. Webcams recorded multiple nightly instances of incandescent material descending the flanks as far as 1.1 km below the crater rim, particularly down the S and SE flanks. Weather clouds occasionally obscured views. Secretaría de Gestión de Riesgos maintained the Alert Level at Orange (the second highest level on a four-color scale).
Sources: Instituto Geofísico-Escuela Politécnica Nacional (IG-EPN); Secretaría de Gestión de Riesgos (SGR)
The Instituto Geofísico-Escuela Politécnica Nacional (IG-EPN) reported that eruptive activity continued at Reventador during 9-15 April. Seismicity included 60-106 daily explosions, long-period earthquakes, harmonic tremor, and tremor associated with emissions. Multiple daily ash-and-gas plumes rose 200-2,200 m above the crater rim and drifted mainly NW, SW, and W. Webcams recorded multiple nightly instances of incandescent material descending the flanks as far as 1.1 km below the crater rim. During 8-9 April several pyroclastic flows were recorded, reaching more than 700 m below the crater on the SSW flanks. On the morning of 10 April a small lahar was recorded descending the S flank. That same day, a pyroclastic flow traveled down the SSW flank. Webcam images on 11 April showed another pyroclastic flow descending the SSW flank, with another on 12 April reaching 500 m below the crater on the SW flank. Several pyroclastic flows on the SW flank reached 1 km below the crater on 13 April. On 14 April two pyroclastic flows descended the SE flank as far as 800 m below the crater. Secretaría de Gestión de Riesgos maintained the Alert Level at Orange (the second highest level on a four-color scale).
Sources: Instituto Geofísico-Escuela Politécnica Nacional (IG-EPN); Secretaría de Gestión de Riesgos (SGR)
The Instituto Geofísico-Escuela Politécnica Nacional (IG-EPN) reported that eruptive activity continued at Reventador during 1-8 April. Seismicity included 52-127 daily explosions, long-period earthquakes, harmonic tremor, and tremor associated with emissions. Multiple daily ash-and-gas plumes rose as high as 1.3 km above the crater rim and drifted mainly NW, W, and SW. Webcams recorded multiple nightly instances of incandescent material descending the flanks as far as 1.2 km below the crater rim. On 2 April pyroclastic flows traveled 250 m down the SE flank and 700 m down the S flank. A pyroclastic flow traveled 500 m down the flank on 3 April. Secretaría de Gestión de Riesgos maintained the Alert Level at Orange (the second highest level on a four-color scale).
Sources: Instituto Geofísico-Escuela Politécnica Nacional (IG-EPN); Secretaría de Gestión de Riesgos (SGR)
The Instituto Geofísico-Escuela Politécnica Nacional (IG-EPN) reported that eruptive activity continued at Reventador during 11-18 March. Seismicity included 59-106 daily explosions, long-period earthquakes, harmonic tremor, and tremor associated with emissions. Multiple daily ash-and-gas plumes rose as high as 1.1 km above the crater rim and drifted in multiple directions. Webcams recorded multiple instances nightly of incandescent material descending the flanks as far as 900 m below the crater rim. Minor ashfall was reported in Piedra Fina, 8 km SE, at around 0700 on 14 March; ashfall in that area had been persistent for the past few months. On 17 March a pyroclastic flow traveled 400 m down the SE flank. Incandescent material was ejected 400 m above the crater rim. Secretaría de Gestión de Riesgos maintained the Alert Level at Orange (the second highest level on a four-color scale).
Sources: Instituto Geofísico-Escuela Politécnica Nacional (IG-EPN); Secretaría de Gestión de Riesgos (SGR)
The Instituto Geofísico-Escuela Politécnica Nacional (IG-EPN) reported that eruptive activity continued at Reventador during 18-25 February. Seismicity included 36-84 daily explosions, long-period earthquakes, harmonic tremor, and tremor associated with emissions, though the transmission of seismic and webcam data was sometimes interrupted, especially during 21-23 February. Weather conditions on most days were clear enough to observe ash-and-gas plumes in webcam and/or satellite images rising 300-1,100 m above the crater and drifting NW, WNW, W, and SW. Webcams almost nightly recorded multiple instances of incandescent material descending the flanks as far as 1 km below the crater rim. At 1245 on 22 February a small- to moderate-sized, secondary lahar descended the Marker River on the S flank. Secretaría de Gestión de Riesgos maintained the Alert Level at Orange (the second highest level on a four-color scale).
Sources: Instituto Geofísico-Escuela Politécnica Nacional (IG-EPN); Secretaría de Gestión de Riesgos (SGR)
The Instituto Geofísico-Escuela Politécnica Nacional (IG-EPN) reported that eruptive activity continued at Reventador during 4-11 February. Seismicity included 57-101 daily explosions, long-period earthquakes, harmonic tremor, and tremor associated with emissions. Weather conditions occasionally obscured views of summit activity; however, when the weather permitted, ash-and-gas plumes were observed in webcam and/or satellite images rising 200-1,100 m above the crater and drifting N, NW, W, and SW. The surveillance camera network recorded multiple instances of incandescent material descending the flanks as far as 900 m below the crater rim. On 4 February a pyroclastic flow traveled 500 m down the S flank. Secretaría de Gestión de Riesgos maintained the Alert Level at Orange (the second highest level on a four-color scale).
Sources: Instituto Geofísico-Escuela Politécnica Nacional (IG-EPN); Secretaría de Gestión de Riesgos (SGR)
The Instituto Geofísico-Escuela Politécnica Nacional (IG-EPN) reported that eruptive activity continued at Reventador during 22-28 January. Seismicity was not reported on 22-23 January and only partly recorded on the morning of 24 January, with 22 explosions, due to data transmission issues with the seismic monitoring equipment. From the afternoon of 24 January to the morning of 28 January, seismicity included 63-79 daily explosions, long-period earthquakes, harmonic tremor, and tremor associated with emissions. Weather conditions occasionally obscured views of summit activity; however, when the weather permitted, ash-and-gas plumes were observed in webcam and/or satellite images rising 300-1,300 m above the crater and drifting W, WNW, and NW. The Washington VAAC also issued alerts for ash and gas emissions. The surveillance camera network recorded multiple instances of incandescent material descending as far as 800 m below the crater rim overnight 24-27 January. Secretaría de Gestión de Riesgos maintained the Alert Level at Orange (the second highest level on a four-color scale).
Source: Instituto Geofísico-Escuela Politécnica Nacional (IG-EPN)
Instituto Geofísico-Escuela Politécnica Nacional (IG-EPN) reported that an eruption at Reventador was ongoing during 31 December 2024-6 January 2025. Seismicity was characterized by 62-88 daily explosions, long-period earthquakes, harmonic tremor, and tremor associated with emissions. Daily ash-and-gas plumes were observed in webcam images and/or satellite images rising 300-1,000 m above the crater and drifting SE, SW, and W. Incandescent material was observed nightly descending the flanks as far as 900 m below the crater rim. Weather conditions occasionally obscured views. Secretaría de Gestión de Riesgos maintained the Alert Level at Orange (the second highest level on a four-color scale).
Sources: Instituto Geofísico-Escuela Politécnica Nacional (IG-EPN); Secretaría de Gestión de Riesgos (SGR)
The Instituto Geofísico-Escuela Politécnica Nacional (IG-EPN) reported that an eruption at Reventador was ongoing during 3-10 December. Seismicity was characterized by 13-77 daily explosions, long-period earthquakes, harmonic tremor, and tremor associated with emissions. Daily ash-and-gas plumes were observed in webcam images and/or satellite images rising 200-1,300 m above the crater and drifted SW, SSW, WNW, and NW. Incandescent material was observed in webcam images multiple times nightly descending the flanks as far as 1 km below the crater rim. Weather conditions occasionally obscured views. Secretaría de Gestión de Riesgos maintained the Alert Level at Orange (the second highest level on a four-color scale).
Sources: Instituto Geofísico-Escuela Politécnica Nacional (IG-EPN); Secretaría de Gestión de Riesgos (SGR)
Instituto Geofísico-Escuela Politécnica Nacional (IG-EPN) reported that an eruption at Reventador was ongoing during 12-19 November. Seismicity was characterized by 66-101 daily explosions, long-period earthquakes, harmonic tremor, and tremor associated with emissions. Daily or near-daily ash-and-gas plumes were observed in webcam images and/or satellite images rising 200-1,200 m above the crater and drifted in different directions. Incandescent material was observed nightly descending the flanks as far as 1 km below the crater rim. Weather conditions sometimes obscured views, especially on 16 November. Secretaría de Gestión de Riesgos maintained the Alert Level at Orange (the second highest level on a four-color scale).
Sources: Instituto Geofísico-Escuela Politécnica Nacional (IG-EPN); Secretaría de Gestión de Riesgos (SGR)
Instituto Geofísico-Escuela Politécnica Nacional (IG-EPN) reported that an eruption at Reventador was ongoing during 18-22 October. Seismicity was characterized by 59-92 daily explosions, 17-23 long-period earthquakes, and 5-17 tremor events associated with emissions. During 19-22 October there were 2-5 harmonic tremor events recorded. Ash-and-gas plumes were observed in webcam images and/or satellite images rising 200-1,000 m above the crater and drifted in different directions. Crater incandescence was visible during 18-21 October and incandescent material was reported descending the flanks as far as 1,000 m below the crater. According to a webcam image, a pyroclastic flow occurred at 1701 on 19 October, traveling 800 m below the crater on the SE flank. Secretaría de Gestión de Riesgos maintained the Alert Level at Orange (the second highest level on a four-color scale).
Sources: Instituto Geofísico-Escuela Politécnica Nacional (IG-EPN); Secretaría de Gestión de Riesgos (SGR)
Instituto Geofísico-Escuela Politécnica Nacional (IG-EPN) reported that an eruption at Reventador was ongoing during 24 September-1 October. Signals from the seismic stations were not transmitted during the first half of the week; during 28 September-1 October seismicity was characterized by 79-105 daily explosions, long-period earthquakes, harmonic tremor, and tremor associated with emissions. Ash-and-gas plumes were observed in webcam images and/or satellite images rising as high as 1.1 km above the crater rim and drifting NW, WNW, and W. Webcams occasionally did not transmit data and weather conditions sometimes obscured views. Thermal anomalies in the crater were identified in satellite images on most days. Secretaría de Gestión de Riesgos maintained the Alert Level at Orange (the second highest level on a four-color scale).
Sources: Instituto Geofísico-Escuela Politécnica Nacional (IG-EPN); Secretaría de Gestión de Riesgos (SGR)
IG-EPN reported that an eruption at Reventador was ongoing during 13-20 August. Seismicity was characterized by 43-100 daily explosions on most days, along with long-period earthquakes, harmonic tremor, and tremor associated with emissions during the beginning of the week; data transmissions from the seismic station were occasionally interrupted. Several ash-and-gas plumes were observed on most days rising 300-800 m above the crater rim and drifting N, WNW, and W. Weather conditions occasionally prevented visual observations, particularly on 16 August. Thermal anomalies in the crater were identified in satellite images on most days. Secretaría de Gestión de Riesgos maintained the Alert Level at Orange (the second highest level on a four-color scale).
Sources: Instituto Geofísico-Escuela Politécnica Nacional (IG-EPN); Secretaría de Gestión de Riesgos (SGR)
IG-EPN reported that an eruption at Reventador was ongoing during 23-30 July. Seismicity was characterized by 61-90 daily explosions, long-period earthquakes, harmonic tremor, and tremor associated with emissions. Weather conditions prevented visual observations during 23-25 July. Several ash-and-gas plumes observed during 26-30 July rose as high as 1.1 km above the crater rim and drifted N. NW, W, and SW. Avalanches of incandescent material traveled 800-900 m down the flanks during 27-29 July. On 28 July a pyroclastic flow descended the flanks as far as 600 m and on 29 July pyroclastic flows descended the SE flank 600-800 m. During 29-30 July ejected incandescent material fell onto the flanks as far as 400 m below the crater rim. Secretaría de Gestión de Riesgos maintained the Alert Level at Orange (the second highest level on a four-color scale).
Sources: Instituto Geofísico-Escuela Politécnica Nacional (IG-EPN); Secretaría de Gestión de Riesgos (SGR)
In a special report issued on 10 June IG-EPN reported that the number and amplitude of explosions at Reventador had increased beginning on 21 March and remained elevated, based on seismic data. Additionally, during this period a slight increase in sulfur dioxide emissions was identified in satellite data. The daily explosion count peaked on 26 May and again on 9 June. IG noted that the characteristics of the ash emissions had not changed and remained at normal levels with plumes typically rising 1 km above the crater rim; plumes to 1.6 km indicate higher activity, and 2 km is considered notable. Since 2 May morphological changes in the crater area reflected the generation of small pyroclastic flows that descended the S and SE flanks but did not impact residents or infrastructure. Explosive activity during 2-3 June created a small ravine on the SSE flank and a 125-m-wide depression at the crater rim, at the head of the ravine. Incandescence at the SE part of the crater became visible and persisted. Subsequent pyroclastic flows were channeled down the ravine, reaching the base of the cone.
During 1-6 June the Washington VAAC issued 584 reports of ash emissions, or an average of two reports per day, according to IG. The plumes rose 400-2,800 m above the crater rim, averaging 1 km high. There were 62-85 daily explosions during 7-11 June. Weather clouds prevented views during 7-9 June. Ash plumes during 10-11 June rose 700-800 m and drifted WNW and NW.
Source: Instituto Geofísico-Escuela Politécnica Nacional (IG-EPN)
IG-EPN reported that an eruption at Reventador was ongoing during 14-21 May. Seismicity was characterized by 46-78 daily explosions, long-period earthquakes, harmonic tremor, volcano-tectonic events, and tremor associated with emissions. Ash-and-gas plumes rose as high as 1.1 km above the crater rim and drifted NW, W, and SW during 14-18 and 21 May. Weather conditions sometimes prevented views, especially during 19-20 May. Incandescence at the crater was visible during most nights and avalanches of incandescent material descended the flanks as far as 500 m from the summit on a few of the nights. Secretaría de Gestión de Riesgos maintained the Alert Level at Orange (the second highest level on a four-color scale).
Sources: Instituto Geofísico-Escuela Politécnica Nacional (IG-EPN); Secretaría de Gestión de Riesgos (SGR)
IG-EPN reported that a moderate eruption at Reventador was ongoing during 23-30 April. Seismicity was unknown due to data transmission problems. Even though cloudy weather conditions often prevented webcam and satellite observations, daily ash-and-gas plumes were visible rising as high as 1.4 km above the crater rim and drifting NW, W, and SW. Secretaría de Gestión de Riesgos maintained the Alert Level at Orange (the second highest level on a four-color scale).
Sources: Instituto Geofísico-Escuela Politécnica Nacional (IG-EPN); Secretaría de Gestión de Riesgos (SGR)
IG-EPN reported that a moderate eruption at Reventador was ongoing during 2-9 April. Seismicity was characterized by 46-78 daily explosions, long-period earthquakes, harmonic tremor, and tremor associated with emissions. Ash-and-gas plumes rose as high as 1.1 km above the crater rim and drifted NW, W, and SW during 2-4 and 7 April. Weather conditions sometimes prevented views; emissions were not visible on the other days of the week. Avalanches of incandescent material were visible most overnights, descending the flanks as far as 800 m from the summit. Secretaría de Gestión de Riesgos maintained the Alert Level at Orange (the second highest level on a four-color scale).
Sources: Instituto Geofísico-Escuela Politécnica Nacional (IG-EPN); Secretaría de Gestión de Riesgos (SGR)
IG-EPN reported that a moderate eruption at Reventador was ongoing during 12-19 March. Seismicity was characterized by 23-48 daily explosions, long-period earthquakes, harmonic tremor, and tremor associated with emissions. Ash-and-gas plumes rose as high as 1.3 km above the crater rim and drifted in multiple directions on most days. Weather conditions sometimes prevented views; emissions were not visible during 14-15 March. Avalanches of incandescent material were visible most overnights, descending the flanks as far as 900 m from the summit. Minor crater incandescence was visible during 14-15 March. The weather was occasionally rainy during the week; a seismic signal indicating a lahar was recorded at 0210 on 19 March. Secretaría de Gestión de Riesgos maintained the Alert Level at Orange (the second highest level on a four-color scale).
Sources: Instituto Geofísico-Escuela Politécnica Nacional (IG-EPN); Secretaría de Gestión de Riesgos (SGR)
IG-EPN reported that a moderate eruption at Reventador was ongoing during 21-27 February. Seismicity was characterized by 28-62 daily explosions, long-period earthquakes, harmonic tremor, and tremor associated with emissions. Daily ash-and-gas plumes rose as high as 1.3 km above the crater rim and drifted in multiple directions, though weather conditions sometimes prevented views. Crater incandescence was occasionally visible during both overnight and morning hours; avalanches of incandescent material descended the flanks as far as 800 m from the summit on a few of the days and incandescent material was ejected 200 m above the crater during 23-24 February. A seismic signal indicating a lahar was recorded at 0015 on 24 February. Secretaría de Gestión de Riesgos maintained the Alert Level at Orange (the second highest level on a four-color scale).
Sources: Instituto Geofísico-Escuela Politécnica Nacional (IG-EPN); Secretaría de Gestión de Riesgos (SGR)
IG-EPN reported that moderate eruptive activity continued at Reventador during 7-13 February. The seismic station recorded 27-45 daily explosive events, long-period earthquakes, episodes of harmonic tremor, and episodes of tremor associated with active degassing events. Several ash-and-gas plumes rose as high as 1.7 km above the crater rim and drifted N, SW, WSW, WNW, and NW; weather clouds often prevented visual monitoring of crater activity. The webcam monitoring system occasionally recorded episodes of crater incandescence during the night and early morning hours. Incandescent material was ejected up to 200 m above the crater during the night of 8 February, and avalanches of incandescent material descended multiple flanks as far as 600 m from the summit during 7-9 February. Secretaría de Gestión de Riesgos (SGR) maintained the Alert Level at Orange (the second highest level on a four-color scale).
Sources: Instituto Geofísico-Escuela Politécnica Nacional (IG-EPN); Secretaría de Gestión de Riesgos (SGR)
IG-EPN reported that a moderate eruption at Reventador was ongoing during 2-9 January. Seismicity was characterized by 37-58 daily explosions, long-period earthquakes, harmonic tremor, and tremor associated with emissions. Several ash-and-gas plumes rose as high as 1.3 km above the crater rim and drifted S, SW, W, and NW, though cloudy conditions often prevented views. Crater incandescence was occasionally visible during both overnight and morning hours; incandescent material was ejected 200-300 m above the crater and avalanches of incandescent material descended the flanks as far as 600 m from the summit during 6-9 January. A small lahar was recorded on 6 January. Secretaría de Gestión de Riesgos maintained the Alert Level at Orange (the second highest level on a four-color scale).
Sources: Instituto Geofísico-Escuela Politécnica Nacional (IG-EPN); Servicio Nacional de Gestión de Riesgos y Emergencias (SNGRE)
IG-EPN reported that the eruption at Reventador was ongoing during 12-19 December. Seismicity was characterized by 23-51 daily explosions, long-period earthquakes, harmonic tremor, and tremor associated with emissions; data reception was interrupted during 13-14 December. Several daily ash-and-gas plumes rose as high as 1 km above the crater rim and drifted in multiple directions, though cloudy conditions prevented views at times during 18-19 December. Crater incandescence was often visible during both overnight and morning hours, and avalanches of incandescent material frequently descended the flanks to distances as far as 800 m from the summit. Weather conditions sometimes prevented views of the volcano. Secretaría de Gestión de Riesgos maintained the Alert Level at Orange (the second highest level on a four-color scale).
Sources: Instituto Geofísico-Escuela Politécnica Nacional (IG-EPN); Servicio Nacional de Gestión de Riesgos y Emergencias (SNGRE)
IG-EPN reported that the eruption at Reventador was ongoing during 21-28 November. Seismicity was characterized by 31-60 daily explosions, long-period earthquakes, harmonic tremor, and tremor associated with emissions. Several daily ash-and-gas plumes rose as high as 1.2 km above the crater rim and drifted in multiple directions. Daily crater incandescence was visible during both overnight and morning hours. Incandescent material was ejected 200 m above the crater rim during 21-23 November, and avalanches of incandescent material descended the flanks daily, traveling as far as 800 m from the summit. Weather conditions sometimes prevented views of the volcano. Secretaría de Gestión de Riesgos maintained the Alert Level at Orange (the second highest level on a four-color scale).
Sources: Instituto Geofísico-Escuela Politécnica Nacional (IG-EPN); Servicio Nacional de Gestión de Riesgos y Emergencias (SNGRE)
IG-EPN reported that the eruption at Reventador was ongoing during 31 October-7 November. Seismicity was characterized by 37-52 daily explosions, long-period earthquakes, harmonic tremor, and tremor associated with emissions. Several daily ash-and-gas plumes rose as high as 1.2 km above the crater rim and drifted mainly N, NW, N, and NE. Daily crater incandescence was visible during both overnight and morning hours. Avalanches of incandescent material descended the flanks, traveling as far as 800 m from the summit. Incandescent material was ejected as high as 300 m above the crater rim several times during 4-7 November. Weather conditions sometimes prevented views of the volcano. Secretaría de Gestión de Riesgos maintained the Alert Level at Orange (the second highest level on a four-color scale).
Source: Instituto Geofísico-Escuela Politécnica Nacional (IG-EPN)
IG-EPN reported that the eruption at Reventador was ongoing during 10-17 October. Seismicity was characterized by 15-43 daily explosions, long-period earthquakes, harmonic tremor, and tremor associated with emissions. Several daily ash-and-gas plumes rose as high as 1.3 km above the crater rim and drifted in multiple directions. Daily crater incandescence was visible during both overnight and morning hours. Incandescent material was ejected as high as 600 m above the crater rim several times during 10-11 October. Avalanches of incandescent material descended the flanks, concentrating down the SE flank during the beginning of the week, and traveling as far as 800 m from the summit. Weather conditions sometimes prevented views of the volcano. Secretaría de Gestión de Riesgos maintained the Alert Level at Orange (the second highest level on a four-color scale).
Sources: Instituto Geofísico-Escuela Politécnica Nacional (IG-EPN); Secretaría de Gestión de Riesgos (SGR)
IG-EPN reported that the eruption at Reventador was ongoing during 19-26 September. Seismicity was characterized by 22-49 daily explosions, long-period earthquakes, volcano-tectonic events, harmonic tremor, and tremor associated with emissions. Several daily ash-and-gas plumes rose 200-1,000 m above the crater rim and drifted in multiple directions. Daily crater incandescence was visible during both overnight and morning hours. Incandescent material descended the flanks, mainly to the E and SE, traveling as far as 500 m from the summit. Incandescent material was sometimes ejected 200-300 m above the crater rim. Weather conditions sometimes prevented views of the volcano. Secretaría de Gestión de Riesgos maintained the Alert Level at Orange (the second highest level on a four-color scale).
Sources: Instituto Geofísico-Escuela Politécnica Nacional (IG-EPN); Secretaría de Gestión de Riesgos (SGR)
IG-EPN reported that the eruption at Reventador was ongoing during 29 August-5 September. Seismicity was characterized by 23-48 daily explosions, long-period earthquakes, volcano-tectonic events, harmonic tremor, and tremor associated with emissions. Crater incandescence was visible overnight during 29 August-3 September; incandescent material was sometimes ejected onto the flanks and then descended as far as 500 m. Daily ash-and-gas plumes rose 600-1,000 m above the crater rim and drifted NW, W, and SW. Weather conditions sometimes prevented views of the volcano. Secretaría de Gestión de Riesgos maintained the Alert Level at Orange (the second highest level on a four-color scale).
Sources: Instituto Geofísico-Escuela Politécnica Nacional (IG-EPN); Secretaría de Gestión de Riesgos (SGR)
IG-EPN reported that the eruption at Reventador was ongoing during 15-22 August. Seismicity was characterized by 21-30 daily explosions, long-period earthquakes, harmonic tremor, and tremor associated with emissions. Crater incandescence was visible nightly and sometimes early mornings, and explosions ejected incandescent material onto the flanks. Daily ash-and-gas plumes rose 900-1,300 m above the crater rim and drifted E, NW, W, and SW during 15-21 August; weather clouds prevented views on 22 August. Secretaría de Gestión de Riesgos maintained the Alert Level at Orange (the second highest level on a four-color scale).
Sources: Instituto Geofísico-Escuela Politécnica Nacional (IG-EPN); Secretaría de Gestión de Riesgos (SGR)
IG-EPN reported that the eruption at Reventador was ongoing during 26 July through 1 August. Seismicity was characterized by 26-59 daily explosions, long-period earthquakes, harmonic tremor, and tremor associated with emissions. Weather clouds often hindered visual observations, though crater incandescence was visible on most nights and early mornings, and material was seen descending the flanks. Gas-and-ash plumes rose 600-1,200 m above the crater rim and drifted NW, W, and SW during 25-26 July. During 26-27 July incandescent material was ejected from the vent and descended the flanks. During the morning of 27 July gas-and-ash emissions rose less than 500 m above the crater rim and drifted W. During the morning of 28 July an incandescent avalanche of material was reported descending the flanks of the volcano. Three gas-and-ash emissions were recorded during the afternoon of 28 July rising to less than 600 m above the crater rim and drifting W. During the morning of 29 July crater incandescence was visible and incandescent material was ejected as far as 400 m onto the flanks. On 30 July a gas-and-ash plume rose less than 400 m above the crater rim and drifted NW. During 30-31 July gas-and-ash plumes rose 200-400 m above the crater rim and drifted NE and SW. Incandescent material was ejected 600 m from the crater, accompanied by blocks rolling down the S flank during 31 July-1 August. Servicio Nacional de Gestión de Riesgos y Emergencias (SNGRE) maintained the Alert Level at Orange (the second highest level on a four-color scale).
Sources: Instituto Geofísico-Escuela Politécnica Nacional (IG-EPN); Servicio Nacional de Gestión de Riesgos y Emergencias (SNGRE)
IG-EPN reported that the eruption at Reventador was ongoing during 18-25 July. Seismicity was characterized by 16-40 daily explosions, long-period earthquakes, harmonic tremor, and tremor associated with emissions. Weather clouds often hindered visual observations, though crater incandescence was visible on most nights and early mornings, and material was seen descending the flanks. Ash-and-gas plumes rose 400 m above the crater rim and drifted NW on 19 July. Crater incandescence was visible during the night of 20-21 July and incandescent blocks rolled 500 m down the flanks. An explosion at 0804 on 22 July produced a plume with moderate amounts of ash that rose 500 m above the crater rim. An explosion at 0509 on 23 July ejected incandescent material onto the flanks that descended 500 m. Ash emissions on 24 July rose less than 200 m and drifted NW. Incandescent material was ejected as far as 400 m onto the flanks. Servicio Nacional de Gestión de Riesgos y Emergencias (SNGRE) maintained the Alert Level at Orange (the second highest level on a four-color scale).
Sources: Servicio Nacional de Gestión de Riesgos y Emergencias (SNGRE); Instituto Geofísico-Escuela Politécnica Nacional (IG-EPN)
IG reported that the eruption at Reventador was ongoing during 20-27 June. Seismicity was characterized by 7-30 daily explosions, long-period earthquakes, harmonic tremor, and tremor associated with emissions. Weather clouds often hindered visual observations, though crater incandescence was visible on most nights and early mornings, and from the S-flank lava flow on 21-22 June. During 21-23 June ash emissions rose as high as 1 km above the crater and drifted to the NE, W, and NW. During 23-26 June gas-and-ash emissions rose as high as 1 km above the crater and drifted to the W and NW. Servicio Nacional de Gestión de Riesgos y Emergencias (SNGRE) maintained the Alert Level at Orange (the second highest level on a four-color scale).
Sources: Instituto Geofísico-Escuela Politécnica Nacional (IG-EPN); Servicio Nacional de Gestión de Riesgos y Emergencias (SNGRE)
IG reported that the eruption at Reventador was ongoing during 6-13 June. Seismicity was characterized by explosions, long-period earthquakes, harmonic tremor, and tremor associated with emissions. Though weather clouds hindered visual observations of emissions during 6-7 June, several explosions overnight ejected incandescent material onto the flanks; some of the material rolled down the E flank. During 7-10 June several steam-and-ash emissions rose as high as 1 km above the crater rim and drifted W. Crater incandescence was visible during overnight hours and incandescent blocks sometimes rolled 400-500 m down the flanks. Crater incandescence was visible overnight during 11-13 June. Weather conditions prevented views on 11 June. Gas-and-ash plumes rose 600-800 m and drifted W during 12-13 June. Servicio Nacional de Gestión de Riesgos y Emergencias (SNGRE) maintained the Alert Level at Orange (the second highest level on a four-color scale).
Sources: Instituto Geofísico-Escuela Politécnica Nacional (IG-EPN); Servicio Nacional de Gestión de Riesgos y Emergencias (SNGRE)
IG reported that the eruption at Reventador was ongoing during 23-30 May. Seismicity was characterized by 28-43 daily explosions, long-period earthquakes, harmonic tremors, and emission-related tremors. Daily gas-and-ash emissions rose as high has 1 km above the crater and drifted SW, W, NW, and NE. On most nights incandescent blocks were seen rolling 500-1,000 m down the flanks; incandescence at the crater and on the upper flanks was also periodically visible. Servicio Nacional de Gestión de Riesgos y Emergencias (SNGRE) maintained the Alert Level at Orange (the second highest level on a four-color scale).
Sources: Instituto Geofísico-Escuela Politécnica Nacional (IG-EPN); Servicio Nacional de Gestión de Riesgos y Emergencias (SNGRE)
IG reported that the eruption at Reventador was ongoing during 10-16 May. Seismicity was characterized by explosions, long-period earthquakes, harmonic tremors, and emission-related tremors. Steam, gas, and ash plumes were observed in some webcam images, though weather conditions occasionally obscured views. Ash emissions on 12 May rose 500 m above the crater rim and drifted N. On 14 May a steam-and-ash plume rose 250 m and drifted NE. On 16 May an ash plume rose as high as 1 km above the crater and drifted W and SW. Incandescence at the crater was visible at night during 10-12 and 16 May, and incandescent blocks rolled 200-700 m down the flanks. Servicio Nacional de Gestión de Riesgos y Emergencias (SNGRE) maintained the Alert Level at Orange (the second highest level on a four-color scale).
Sources: Instituto Geofísico-Escuela Politécnica Nacional (IG-EPN); Servicio Nacional de Gestión de Riesgos y Emergencias (SNGRE)
IG reported that the eruption at Reventador was ongoing during 19-25 April. Seismic activity was not characterized due to technical problems. Steam, gas, and ash plumes were observed in IG webcam images and described in Washington VAAC advisories on most days; weather conditions occasionally prevented views. The plumes rose as high as 1.6 km above the summit and drifted E, SE, W, and SW. Crater incandescence was visible at night during 20-21 April. Servicio Nacional de Gestión de Riesgos y Emergencias (SNGRE) maintained the Alert Level at Orange (the second highest level on a four-color scale).
Sources: Instituto Geofísico-Escuela Politécnica Nacional (IG-EPN); Servicio Nacional de Gestión de Riesgos y Emergencias (SNGRE)
IG described the ongoing eruption at Reventador as moderate during 29 March-4 April. Seismicity was characterized by explosions, long-period earthquakes, periods of harmonic tremor, and signals that indicated emissions. The number of daily explosions ranged from 24 to 45; though the daily seismic data transmission was sometimes interrupted. Steam, gas, and ash plumes were observed in IG webcam images and described in Washington VAAC advisories during 29-31 March; weather conditions occasionally prevented views. The plumes rose as high as 1.3 km above the summit and drifted W. Crater incandescence was visible during the night of 29 and 30 March. Incandescent blocks were seen rolling as far as 700 m down the flanks in all directions during 30-31 March. Servicio Nacional de Gestión de Riesgos y Emergencias (SNGRE) maintained the Alert Level at Orange (the second highest level on a four-color scale).
Sources: Instituto Geofísico-Escuela Politécnica Nacional (IG-EPN); Servicio Nacional de Gestión de Riesgos y Emergencias (SNGRE)
IG described the ongoing eruption at Reventador as moderate during 14-21 February. Seismicity was characterized by explosions, long-period earthquakes, periods of harmonic tremor, and signals that indicated emissions. Steam, gas, and ash plumes were observed in IG webcam images and described in Washington VAAC volcanic activity notifications during 14-19 February; weather conditions occasionally prevented views. The plumes rose as high as 1.6 km above the summit and drifted in multiple directions. A lava flow on the NE flank was visibly active during 14-15 February. Crater incandescence was visible almost nightly and incandescent blocks were seen rolling as far as 800 m down the flanks in all directions during the beginning of the week. Weather clouds prevented visual observations of the volcano during 20-21 February. Servicio Nacional de Gestión de Riesgos y Emergencias (SNGRE) maintained the Alert Level at Orange (the second highest level on a four-color scale).
Sources: Instituto Geofísico-Escuela Politécnica Nacional (IG-EPN); Servicio Nacional de Gestión de Riesgos y Emergencias (SNGRE)
IG described the ongoing eruption at Reventador as moderate during 17-24 January. Daily seismicity was characterized by explosions, long-period earthquakes, periods of harmonic tremor, and signals that indicated emissions. The daily count of explosions ranged from 22-96; seismic data transmission was interrupted during 22-23 January. Although weather clouds often prevented observations of the summit, daily gas, steam, and ash plumes were observed in IG webcam images and described in Washington VAAC volcanic activity notifications almost daily. The plumes rose as high as 2.2 km above the volcano and drifted in multiple directions. Crater incandescence was visible nightly and incandescent blocks were ejected onto the flanks sometimes in all directions; incandescent blocks were also visible rolling as far as 800 m down the flanks. Servicio Nacional de Gestión de Riesgos y Emergencias (SNGRE) maintained the Alert Level at Orange (the second highest level on a four-color scale).
Sources: Instituto Geofísico-Escuela Politécnica Nacional (IG-EPN); Servicio Nacional de Gestión de Riesgos y Emergencias (SNGRE)
IG described the ongoing eruption at Reventador as moderate during 21-27 December. Daily seismicity was characterized by explosions, long-period earthquakes, periods of harmonic tremor, and signals that indicated emissions. Gas, steam, and ash plumes, observed daily with webcams or reported by the Washington VAAC, rose as high as 1.3 km above the summit and drifted in multiple directions. Weather clouds occasionally prevented webcam and satellite views of the volcano. Crater incandescence was visible nightly or during the early morning hours; incandescent blocks rolled down all flanks, descending as far as 700 m.
Source: Instituto Geofísico-Escuela Politécnica Nacional (IG-EPN)
IG described the ongoing eruption at Reventador as moderate during 29 November-6 December. Daily seismicity was characterized by explosions, long-period earthquakes, periods of harmonic tremor, and signals that indicated emissions. Gas, steam, and ash plumes, observed almost daily with webcams or reported by the Washington VAAC, rose as high as 1.9 km above the summit and drifted in multiple directions. Weather clouds occasionally prevented webcam and satellite views of the volcano. Active lava flows on the N and NE flanks were periodically visible in webcam views.
Source: Instituto Geofísico-Escuela Politécnica Nacional (IG-EPN)
IG described the ongoing eruption at Reventador as moderate during 9-15 November. Daily seismicity was characterized by 18-47 explosions, 22-45 long-period earthquakes, and 2-18 signals that indicated emissions. During 9-12 November there were also 1-4 periods of daily harmonic tremor. Gas, steam, and ash plumes, observed almost daily with webcams or reported by the Washington VAAC, rose as high as 1.3 km above the summit and drifted S, W, SW, N, and NW. Crater incandescence was occasionally visible at night and the lava flow on the NE flank was active. Sulfur dioxide emissions averaged 22, 20.2, and 174.9 tons per day on 9, 11, and 12 November, respectively. An incandescent avalanche was visible on the N flank during the night of 9 November; by 10 November it had traveled to 800 m below the crater.
Source: Instituto Geofísico-Escuela Politécnica Nacional (IG-EPN)
IG described the ongoing eruption at Reventador as moderate during 18-25 October. Daily seismicity was characterized by 9-45 explosions, 2-67 long-period earthquakes, 4-25 signals that indicated emissions, and during 20-25 October there were 2-6 periods of harmonic tremor. Gas, steam, and ash plumes, observed almost daily with webcams or reported by the Washington VAAC, rose as high as 1.3 km above the summit and drifted SW, W, and NW. Weather clouds sometimes prevented visual observations. Crater incandescence was occasionally visible and the lava flow on the NE flank was active. Sulfur dioxide emissions averaged 52-83 tons per day during 19-23 October.
Source: Instituto Geofísico-Escuela Politécnica Nacional (IG-EPN)
IG characterized the ongoing eruption at Reventador as moderate during 20-27 September. Gas, steam, and ash plumes, observed with webcams or reported by the Washington VAAC, rose as high as 1.3 km above the summit and drifted SW, W, NW, and NE. Crater incandescence was visible nightly; the lava flow on the NE flank continued to be active, and incandescent blocks were visible rolling 600-800 m down the flanks during 20-23 and 26-27 September.
Source: Instituto Geofísico-Escuela Politécnica Nacional (IG-EPN)
IG characterized the ongoing eruption at Reventador as moderate during 23-30 August. Gas-and-ash plumes, observed with webcams or reported by the Washington VAAC, rose as high as 1.6 km above the summit and drifted in multiple directions. Crater incandescence was visible on most nights and often during early morning hours. Incandescent blocks were visible rolling 500 m down the NE flank during 24-25 August and 600 m down all flanks during 28-29 August.
Source: Instituto Geofísico-Escuela Politécnica Nacional (IG-EPN)
IG characterized the ongoing eruption at Reventador as moderate during 19-26 July. Gas-and-ash plumes, observed with the webcam or reported by the Washington VAAC, rose as high as 1.4 km above the summit and drifted in multiple directions. An active lava flow descending the NE flanks was visible in thermal webcam images during 21-24 July.
Source: Instituto Geofísico-Escuela Politécnica Nacional (IG-EPN)
IG reported that a high level of activity continued at Reventador during 14-22 June, though cloudy weather conditions sometimes prevented visual observations. Gas-and-ash plumes, often observed multiple times a day with the webcam or reported by the Washington VAAC, rose as high as 1.7 km above the summit and drifted mainly NW and W. Incandescence from the crater was often visible at night or during the early morning.
Source: Instituto Geofísico-Escuela Politécnica Nacional (IG-EPN)
IG reported that a high level of activity continued at Reventador during 10-17 May, though cloudy weather conditions sometimes prevented visual observations, particularly during 14-15 May. Gas-and-ash plumes, often observed multiple times a day as reported by the Washington VAAC, rose as high as 1 km above the summit and drifted mainly NW and W. Incandescence from the crater and incandescent blocks rolling 600 m down the flanks was visible during 10-13 May. During the morning of 17 May a new lava flow descended the NE flank.
Source: Instituto Geofísico-Escuela Politécnica Nacional (IG-EPN)
IG staff observed high levels of activity at Reventador during a field visit from 4 to 7 April, and noted sporadic emissions with moderate ash content. They viewed the volcano with a thermal camera and saw an active lava flow on the upper NNE flank, producing rock avalanches as it advanced. The flow was 1.7-2 km long and effused from a vent about 200 m below the summit on the NNE flank. Two inactive and cooling flows were located adjacent to the active flow. Activity continued to be high during 12-19 April, though cloudy weather conditions frequently prevented visual observations. Steam, gas, and ash plumes, often observed multiple times a day with the webcam or reported by the Washington VAAC, rose as high as 1 km above the summit crater and drifted W and NW. Crater incandescence was visible most nights and early mornings; incandescent material was visible descending the flanks during 13-14 April.
Source: Instituto Geofísico-Escuela Politécnica Nacional (IG-EPN)
IG reported that a high level of activity continued at Reventador during 30 March through 5 April, though cloudy weather conditions sometimes prevented visual observations. Gas-and-ash plumes, often observed multiple times a day with the webcam or reported by the Washington VAAC, rose as high as 4.6 km (15,000 ft) a.s.l. and drifted mainly NW, W, and SW. As many as 68 daily explosions were detected, in addition to long-period (LP) and emission tremors. Daily thermal anomalies were also reported. On clear weather nights, incandescence could be observed in the upper part of the E flank of the volcano. Blocks were recorded rolling 400 m below the crater on all flanks during 4 April, in addition to the incandescence in the crater.
Source: Instituto Geofísico-Escuela Politécnica Nacional (IG-EPN)
IG reported that a high level of activity continued at Reventador during 15-22 March, though cloudy weather conditions sometimes prevented visual observations. Steam-and-ash plumes, often observed multiple times a day with the webcam or reported by the Washington VAAC, rose as high as 1 km above the summit crater and drifted mainly NW, W, and SW. Crater incandescence was visible most nights; incandescent material was visible descending the S flank during 15-16 March.
Source: Instituto Geofísico-Escuela Politécnica Nacional (IG-EPN)
IG reported that a high level of activity continued at Reventador during 15-22 February, though cloudy weather conditions prevented visual observations during 20-21 February. Steam-and-ash plumes, often observed multiple times a day with the webcam or reported by the Washington VAAC, rose higher than 1.3 km above the summit crater and drifted in multiple directions. Crater incandescence was visible most nights; incandescent material was visible descending the S flank during 17-18 February.
Source: Instituto Geofísico-Escuela Politécnica Nacional (IG-EPN)
IG reported that a high level of activity continued at Reventador during 18-25 January. Gas-and-ash plumes, often observed multiple times a day with the webcam or reported by the Washington VAAC, sometimes rose higher than 1 km above the summit crater and drifted mainly NW, W, and SW. Crater incandescence was visible at night during 19-20 January. Cloudy weather sometimes prevented visual observation during 21-23 January. Lava flows on the E and NE flanks were visible during 23-25 January and continued to advance.
Source: Instituto Geofísico-Escuela Politécnica Nacional (IG-EPN)
IG reported that a high level of activity continued at Reventador during 21-28 December. Gas-and-ash plumes, often observed multiple times a day with the webcam or reported by the Washington VAAC, rose as high as 1.2 km above the summit crater and drifted mainly NW, W, and SW. Crater incandescence was visible nightly, and lava flows were active on the NE and N flanks. Explosions, crater incandescence, and incandescent blocks rolling 500 m down the N and NE flanks were observed at night during 27-28 November.
Source: Instituto Geofísico-Escuela Politécnica Nacional (IG-EPN)
IG reported that a high level of activity continued to be recorded at Reventador during 24-30 November. Gas-and-ash plumes, often observed multiple times a day with the webcam or reported by the Washington VAAC, rose higher than 1.3 km above the summit crater and drifted mainly NW, W, SW, and S. Crater incandescence was visible nightly, and incandescent blocks were observed rolling 400 m down the flanks in all directions on most nights.
Source: Instituto Geofísico-Escuela Politécnica Nacional (IG-EPN)
IG reported that a high level of activity continued to be recorded at Reventador during 26 October-2 November; cloudy weather conditions sometimes prevented webcam and satellite views. Gas-and-ash plumes, often observed multiple times a day with the webcam or reported by the Washington VAAC, rose as high as 1.4 km above the summit crater and drifted mainly W, NW, N, and NE. Ashfall was reported in El Reventador village on 27 October. At night during 26 and 30-31 October and 1 November incandescent blocks were observed rolling 500-700 m down the flanks in all directions.
Source: Instituto Geofísico-Escuela Politécnica Nacional (IG-EPN)
IG reported that a high level of activity continued to be recorded at Reventador during 29 September-3 October; cloudy weather conditions sometimes prevented webcam and satellite views. Gas-and-ash plumes, often observed multiple times a day with the webcam or reported by the Washington VAAC, rose as high as 1 km above the summit crater and drifted mainly W and NW. Crater incandescence was often observed at night along with incandescent blocks that rolled as far as 800 m down the flanks.
Source: Instituto Geofísico-Escuela Politécnica Nacional (IG-EPN)
IG reported that several ash emissions from Reventador during 18-24 August rose 500-1,400 m above the summit and drifted NW, W, SW, and S; sometimes weather conditions prevented visual confirmation. Seismicity was characterized by daily explosions, harmonic tremor, long-period earthquakes, and signals that indicated emissions. The Washington VAAC reported gas-and-steam and ash plumes to 1.4 km above the summit that drifted W, NW, and SW, often observed multiple times per day in satellite imagery or webcams. Nighttime crater incandescence was frequently observed, accompanied by incandescent blocks rolling down the NE, E, and S flanks as far as 600 m. A lava flow was reported traveling down the NE flank during 17-18 August.
Sources: Instituto Geofísico-Escuela Politécnica Nacional (IG-EPN); Washington Volcanic Ash Advisory Center (VAAC)
IG reported that a high level of activity continued to be recorded at Reventador during 29 June-6 July; adverse weather conditions sometimes prevented visual confirmation. Seismicity was characterized by daily explosions, harmonic tremor events, long-period earthquakes, and signals indicating emissions. Gas, steam, and ash plumes, often observed multiple times a day with the webcam or reported by the Washington VAAC, rose as high as 1.6 km above the summit crater and drifted mainly W, NW, and NE. Crater incandescence and incandescent blocks rolling down the S flank were often observed at night.
Source: Instituto Geofísico-Escuela Politécnica Nacional (IG-EPN)
IG reported that a high level of activity continued to be recorded at Reventador during 1-8 June; adverse weather conditions sometimes prevented visual confirmation. Seismicity was characterized by 3-23 daily explosions, volcano-tectonic and harmonic tremor events, long-period earthquakes, and signals indicating emissions. Gas, steam, and ash plumes, often observed multiple times a day with the webcam or reported by the Washington VAAC, rose higher than 1 km above the summit crater and drifted mainly W, NW, and NE. Crater incandescence and incandescent blocks rolling as far as 500 m down the S flank were occasionally observed at night. Lava flows on the N, NE, SE, and S flanks were active. The report also noted that a bulging area on the N flank first detected on 13 May had persisted.
Source: Instituto Geofísico-Escuela Politécnica Nacional (IG-EPN)
IG reported that a high level of activity continued to be recorded at Reventador during 24-30 March; adverse weather conditions sometimes prevented visual confirmation. Seismicity was characterized by 49-80 daily explosions, volcano-tectonic and harmonic tremor events, and long-period earthquakes, as well as signals indicating emissions. Gas, steam, and ash plumes, often observed multiple times a day with the webcam or reported by the Washington VAAC, rose as high as 1.4 km above the summit crater and drifted mainly W, NW, SW. Crater incandescence and incandescent blocks rolling down the NE flank were observed nightly and accompanying explosions during 24-25 March.
Source: Instituto Geofísico-Escuela Politécnica Nacional (IG-EPN)
IG reported that a high level of activity continued to be recorded at Reventador during 16-23 March; adverse weather conditions sometimes prevented visual confirmation. Seismicity was characterized by 31-81 daily explosions, volcano-tectonic and harmonic tremor events, and long-period earthquakes as well as signals indicating emissions. Gas, steam, and ash plumes were often observed multiple times a day with the webcam or reported by the Washington VAAC; they rose as high as 1.5 km above the summit crater and drifted mainly NE, E, and SW. Crater incandescence and incandescent blocks rolling at least down the N, NE, and E flanks were observed nightly.
Source: Instituto Geofísico-Escuela Politécnica Nacional (IG-EPN)
IG reported that a high level of activity continued to be recorded at Reventador during 19-26 January; adverse weather conditions sometimes prevented visual conformation. Seismicity was characterized by 42-106 daily explosions, volcano-tectonic and harmonic tremor events, and long-period earthquakes as well as signals indicating emissions. Gas, steam, and ash plumes, often observed multiple times a day with the webcam or reported by the Washington VAAC, rose as high as 1 km above the summit crater and drifted mainly NW, W, and SW. Crater incandescence and incandescent blocks rolling 600-800 m down the NE and S flanks were observed on some nights. A new lava flow was active on the N flank.
Source: Instituto Geofísico-Escuela Politécnica Nacional (IG-EPN)
IG reported that a high level of activity continued to be recorded at Reventador during 16-22 December; adverse weather conditions sometimes prevented visual conformation. Seismicity was characterized by 40-109 daily explosions, volcano-tectonic and harmonic tremor events, and long-period earthquakes as well as signals indicating emissions. Gas, steam, and ash plumes, observed sometimes multiple times a day with the webcam or reported by the Washington VAAC, rose as high as 1 km above the summit crater and drifted mainly NW and W. Crater incandescence and incandescent blocks rolling 600 m down the NE and S flanks were observed nightly. The 450-m-long lava flow on the NE flank remained active but did not advance.
Source: Instituto Geofísico-Escuela Politécnica Nacional (IG-EPN)
IG reported that a high level of activity continued to be recorded at Reventador during 17-24 November. Seismicity was characterized by explosions, volcano-tectonic and harmonic tremor events, and long-period earthquakes as well as signals indicating emissions. Gas, steam, and ash plumes, observed sometimes multiple times a day with the webcam or reported by the Washington VAAC, rose as high as 1.3 km above the summit crater and drifted mainly NW, W, and SW. Crater incandescence and incandescent blocks rolling 600 m down the NE and S flanks were observed during 17-21 and 23-24 November. The 450-m-long lava flow on the NE flank remained active but did not advance.
Source: Instituto Geofísico-Escuela Politécnica Nacional (IG-EPN)
IG reported that a high level of activity continued to be recorded at Reventador during 14-20 October. Gas, steam, and ash emissions, observed sometimes multiple times a day with the webcam or reported by the Washington VAAC, rose as high as 1 km above the summit crater and drifted NE, NW, and W. Crater incandescence and incandescent blocks rolling down the flanks were observed almost nightly; blocks rolled 600 m down the SE flank during 17-18 October. The 400-m-long lava flow on the NE flank remained active but did not advance.
Source: Instituto Geofísico-Escuela Politécnica Nacional (IG-EPN)
IG reported that a high level of activity continued to be recorded at Reventador. In a special report, IG reviewed the activity had started in mid-June, characterized by strong explosions, the ejection of blocks that rolled down the flanks, and pyroclastic flows that descended the N, NE, and W flanks less than 1 km. Additionally, at the beginning of August, a small lava flow effused at the summit and traveled 400-500 m down the NE flank. Formation of a summit lava dome was also noted on 17 August. The number of thermal alerts was the highest in August compared to the rest of the year. The cone destroyed during a 2002 eruption had been rebuilt and was as tall or slightly taller by 11 September.
During 9-15 September gas, steam, and ash emissions observed with the webcam or reported by the Washington VAAC, sometimes multiple times a day, rose as high as 1 km above the summit crater and drifted N, NW, and W. Incandescent blocks rolled down the N flank during 9-10 September and as far as 600 m down the S and SW flanks during 13-15 September. The lava flow on the NE flank had not lengthened.
Source: Instituto Geofísico-Escuela Politécnica Nacional (IG-EPN)
IG reported that a high level of activity continued to be recorded at Reventador during 11-17 August. Gas, steam, and ash emissions observed sometimes multiple times a day with the webcam or reported by the Washington VAAC rose as high as 1 km above the summit crater and drifted NW and W. Cloudy weather sometimes prevented views of the volcano. Incandescent blocks rolled 500-700 m down mainly the NE and E flanks during 12-13 and 15-16 August. A lava flow traveled 200 m down the NE flank on 13 August. The flow lengthened to 300 m by 15 August and remained active, though did not advance, through 18 August. A small pyroclastic flow descended the NE flank during 15-16 August.
Source: Instituto Geofísico-Escuela Politécnica Nacional (IG-EPN)
On 23 July IG reported that activity at Reventador remained high. A slight increase in surficial activity during the previous two weeks was characterized by ash emissions along with pyroclastic flows that descended the W, N, and NE flanks. Ash plumes rose 0.7-1.3 km above the crater rim and drifted several kilometers NW, W, and SW. Incandescent blocks preferentially rolled down the N and NE flanks, though sometimes material was ejected onto all of the flanks.
Source: Instituto Geofísico-Escuela Politécnica Nacional (IG-EPN)
IG reported that during 8-12 July seismic data from Reventador’s network indicated a high level of seismic activity, including explosions, harmonic tremor, and long-period earthquakes; there was no available seismic data during 13-14 July. Gas, steam, and ash emissions observed daily with the webcam or reported by the Washington VAAC rose as high as 1 km above the summit crater and drifted NW, W, and E. Cloudy weather sometimes prevented views of the volcano. Incandescent blocks rolled as far as 600 m down mainly the S and SE flanks during 8-9 and 12-14 July. Crater incandescence was visible almost nightly.
Source: Instituto Geofísico-Escuela Politécnica Nacional (IG-EPN)
IG reported that during 24-30 June seismic data from Reventador’s network indicated a high level of seismic activity, including explosions, harmonic tremor, long-period earthquakes, and signals indicating emissions. Gas, steam, and ash emissions observed almost daily with the webcam or reported by the Washington VAAC rose as high as 1 km above the summit crater and drifted N, NW, W, and SW. Cloudy weather sometimes prevented views of the volcano. Incandescent blocks rolled as far as 500 m down mainly the S and E flanks. Nighttime crater incandescence was often visible.
Source: Instituto Geofísico-Escuela Politécnica Nacional (IG-EPN)
IG reported that during 27 May-2 June seismic data from Reventador’s network indicated a high level of seismic activity, including explosions, long-period earthquakes, and signals indicating emissions. Gas, steam, and ash emissions observed daily with the webcam or reported by the Washington VAAC rose as high as 1.4 km above the summit crater and drifted N, NW, W, and SW. Cloudy weather sometimes prevented views of the volcano. Incandescent blocks rolled as far as 500 m down the S and E flanks during 27-28 May. Nighttime crater incandescence was visible during 27-28 and 30 May, as well as during 1-2 June.
Source: Instituto Geofísico-Escuela Politécnica Nacional (IG-EPN)
IG reported that during 21-28 April seismic data from Reventador’s network indicated a high level of seismic activity, including explosions, long-period earthquakes, and signals indicating emissions. Gas, steam, and ash emissions were observed almost daily, though cloudy weather sometimes prevented views of the volcano; IG and the Washington VAAC reported gas-and-ash emissions rising as high as 1.3 km above the crater rim and drifting W, NW, N, and NE. Incandescent blocks rolled 500-800 m down the flanks in all directions during 21-24 and 26-27 April.
Source: Instituto Geofísico-Escuela Politécnica Nacional (IG-EPN)
IG reported that during 17-24 March seismic data from Reventador’s network indicated a high level of seismic activity, including explosions, long-period earthquakes, and signals indicating emissions. Gas-and-ash emissions were observed almost daily, though cloudy weather often prevented views of the volcano; IG and the Washington VAAC reported gas-and-ash emissions rising around 500-900 m above the crater rim, and as high as 2 km, and drifting NE, SE, S, and W. Ashfall was reported in San Rafael (8 km ESE) on 17 March. Incandescent blocks rolled 900 m down the S and SE flanks during 23-24 March.
Source: Instituto Geofísico-Escuela Politécnica Nacional (IG-EPN)
IG reported that during 18-24 January seismic data from Reventador’s network indicated a high level of seismic activity, including explosions, long-period earthquakes, and signals indicating emissions. Daily gas-and-ash plumes rose as high as 1.3 km above the crater rim and drifted NW, W, and SW. Incandescent blocks rolled 600-700 m down the flanks during 18-21 February. Weather sometimes prevented views of the summit area.
Source: Instituto Geofísico-Escuela Politécnica Nacional (IG-EPN)
IG reported that during 15-22 January seismic data from Reventador’s network indicated a high level of seismic activity, including explosions, long-period earthquakes, harmonic tremor, and signals indicating emissions. Daily gas-and-ash plumes rose as high as 1.6 km above the crater rim and drifted W, NW, and N. Incandescent blocks rolled 700 m down the flanks. Weather sometimes prevented views of the summit area.
Source: Instituto Geofísico-Escuela Politécnica Nacional (IG-EPN)
IG reported that during 4-10 December seismic data from Reventador’s network indicated a high level of seismic activity, including explosions, long-period earthquakes, harmonic tremor, and signals indicating emissions. Weather sometimes prevented views of the summit area, although during clear conditions ash, gas, and steam plumes were visible rising sometimes higher than 1 km above the crater rim and drifting N, NW, W, and SW. Crater incandescence was periodically observed at night. Blocks rolled 500-700 m down the flanks in multiple directions during 7-10 December.
Source: Instituto Geofísico-Escuela Politécnica Nacional (IG-EPN)
IG reported that during 8-15 October seismic data from Reventador’s network indicated a high level of seismic activity, including explosions, long-period earthquakes, harmonic tremor, and signals indicating emissions. Weather often prevented views of the summit area, although during clear conditions ash-and-steam plumes were visible rising sometimes higher than 1 km above the crater rim and drifting NW, W, and SW. Crater incandescence was periodically observed at night. Blocks were observed rolling down the flanks on 10 and 14 October.
Source: Instituto Geofísico-Escuela Politécnica Nacional (IG-EPN)
IG reported that during 21-27 August seismic data from Reventador’s network indicated a high level of seismic activity, including explosions, long-period earthquakes, harmonic tremor, and signals indicating emissions. Weather often prevented views of the summit area, although during clear conditions ash-and-steam plumes were visible rising as high as 1 km above the crater rim and drifting W, NW, and N. Crater incandescence was periodically observed at night. Blocks were observed rolling 800 m down the flanks during 26-27 August.
Source: Instituto Geofísico-Escuela Politécnica Nacional (IG-EPN)
IG reported that during 10-16 July seismic data from Reventador’s network indicated a high level of seismic activity, including explosions, long-period earthquakes, harmonic tremor, and signals indicating emissions. Weather often prevented views of the summit area, although during clear conditions ash plumes were visible rising at least 600 m above the crater rim and drifting W and N. Blocks were observed rolling 500-600 m down the flanks on 10 and 16 July.
Source: Instituto Geofísico-Escuela Politécnica Nacional (IG-EPN)
IG reported that during 14-21 May seismic data from Reventador’s network indicated a high level of seismic activity, including explosions, long-period earthquakes, harmonic tremor, and signals indicating emissions. Weather conditions often prevented views of the summit area, although when clear (during 17-18 and 20-21 May) several ash plumes were visible rising as high as 1 km above the crater rim and drifting W and NW. Crater incandescence was visible on some mornings and evenings. On 19 May a 500-m-long pyroclastic flow deposit on the N flank was visible. Blocks were observed rolling 800 m down the flanks on 21 May.
Source: Instituto Geofísico-Escuela Politécnica Nacional (IG-EPN)
IG reported that during 23-30 April periodic seismic data from Reventador’s network indicated a high level of seismic activity, including explosions, long-period earthquakes, harmonic tremor, and signals indicating emissions. Steam, gas, and ash plumes sometimes rose higher than 1 km above the crater rim and drifted N, NW, W, and SW. Incandescent blocks were observed rolling 500-800 m down the flanks. Inclement weather sometimes prevented visual observations.
Source: Instituto Geofísico-Escuela Politécnica Nacional (IG-EPN)
IG reported that during 13-19 March periodic seismic data from Reventador’s network indicated a high level of seismic activity, including explosions, long-period earthquakes, harmonic tremor, and signals indicating emissions. Steam, gas, and ash plumes sometimes rose higher than 1 km above the crater rim and drifted W and NW. Incandescent blocks were observed rolling 500-700 m down the flanks on a few of the days. Inclement weather sometimes prevented visual observations.
Source: Instituto Geofísico-Escuela Politécnica Nacional (IG-EPN)
During 28 January-5 February IG reported a high level of seismic activity at Reventador, including explosions, long-period earthquakes, harmonic tremor, and signals indicating emissions. Steam, gas, and ash plumes sometimes rose as high as 1 km above the crater rim and drifted W and NW. Incandescent blocks were observed rolling 600-800 m down the flanks on most days.
Source: Instituto Geofísico-Escuela Politécnica Nacional (IG-EPN)
During 3-9 October IG reported a high level of seismic activity at Reventador, including explosions, long-period earthquakes, harmonic tremor, and signals indicating emissions. Steam, gas, and ash plumes sometimes rose higher than 1 km above the crater rim and drifted W, NW, N, and NE. Crater incandescence was visible at night, and incandescent blocks sometimes rolled down the flanks.
Source: Instituto Geofísico-Escuela Politécnica Nacional (IG-EPN)
During 29 August-3 September IG reported a high level of seismic activity at Reventador, including explosions, long-period earthquakes, harmonic tremor, and signals indicating emissions. Steam, gas, and ash plumes rose as high as 600 m above the crater rim and drifted NE, NW, and W. Crater incandescence was visible.
Source: Instituto Geofísico-Escuela Politécnica Nacional (IG-EPN)
IG stated that an explosion at Reventador was detected at 1116 on 2 July, producing an ash plume that was reported by the Washington VAAC to have risen 3 km above the crater rim. Ashfall was reported in the Cayambe (57 km WNW) and in the town of Juan Montalvo.
Source: Instituto Geofísico-Escuela Politécnica Nacional (IG-EPN)
During 23-28 May IG reported a high level of seismic activity including explosions, long-period earthquakes, harmonic tremor, and signals indicating emissions at Reventador. Steam, gas, and ash plumes rose 1.5 km above the crater rim and drifted NW on 23 May, and a plume of gas, water vapor, and ash rose 300 m on 26 May; cloudy weather prevented views of emissions on most days. A lava flow had advanced to 900 m on the NE flank. On 27 May incandescent blocks were observed rolling as far as 800 m down the flanks in multiple directions. An ash plume rose 3 km above the crater rim and quickly drifted W, causing ashfall in Papallacta (62 km SW), San Antonio de Pichincha (90 km W), Tabacundo (63 km WNW), Cayambe (57 km WNW), Puellaro (85 km WNW), and Puembo (80 km W).
Source: Instituto Geofísico-Escuela Politécnica Nacional (IG-EPN)
During 9-15 May, IG reported ongoing high levels of eruptive activity at Reventador. Steam, gas, and ash emissions continued, with plumes moving to the N and W. On 12 and 13 May, a small lava flow was observed on the E flank 700 m below the summit.
Source: Instituto Geofísico-Escuela Politécnica Nacional (IG-EPN)
During 24 April-1 May IG reported a high level of seismic activity including explosions, long-period earthquakes, harmonic tremor, and signals indicating emissions at Reventador. Steam, gas, and ash plumes sometimes rose higher than 1 km above the crater rim and drifted NE, NW, and W. On 27 April incandescent blocks rolled as far as 800 m down the flanks, and a small pyroclastic flow traveled down the E flank.
Source: Instituto Geofísico-Escuela Politécnica Nacional (IG-EPN)
During 6-13 March IG reported a high level of seismic activity including explosions, long-period earthquakes, harmonic tremor, and signals indicating emissions at Reventador. Steam, gas, and ash plumes sometimes rose higher than 600 m above the crater rim and drifted N, NW, and W. Incandescent blocks rolled as far as 800 m down the flanks. On 13 March a pyroclastic flow traveled 400 m down the S flank. Weather clouds sometimes prevented visual observations.
Source: Instituto Geofísico-Escuela Politécnica Nacional (IG-EPN)
During 24-30 January IG reported a high level of seismic activity including explosions, long-period earthquakes, harmonic tremor, and signals indicating emissions at Reventador. Steam, gas, and ash plumes rose at around 600 m above the crater rim and drifted mainly W and sometimes N. Incandescent blocks rolled as far as 800 m down the E flank and 200 m down the S and SE flanks. Weather clouds sometimes prevented visual observations.
Source: Instituto Geofísico-Escuela Politécnica Nacional (IG-EPN)
IG reported that on most days during 12-19 December gas, steam, and ash plumes rose 600 m above Reventador’s summit vent and drifted in multiple directions; weather clouds sometimes prevented visual observations. Crater incandescence was often visible, and blocks rolled as far as 600 m down the flanks. The Alert Level remained at Orange.
Source: Instituto Geofísico-Escuela Politécnica Nacional (IG-EPN)
During 22-28 November IG reported a high level of seismic activity including explosions, long-period earthquakes, harmonic tremor, and signals indicating emissions at Reventador. Steam and ash plumes rose at least 600 m above the crater rim and drifted NW and W. Incandescent blocks rolled as far as 800 m down the flanks. Weather clouds sometimes prevented visual observations.
Source: Instituto Geofísico-Escuela Politécnica Nacional (IG-EPN)
IG reported that during the last week of October the intensity of explosions at Reventador slightly increased; ash plumes, generated from 4-5 explosions per hour, rose to more than 2.5 km above the crater rim and had a higher ash content. Plumes typically drifted W, but also occasionally S and N. Loud “cannon shot” sounds accompanying some explosions were heard in nearby towns. IG volcanologists conducting fieldwork on 23 and 25 October noted strong explosions producing “cannon shots” that vibrated windows in Hostería Reventador, 7.2 km away. On 27 October ash plumes rose as high as 4.9 km. During 30-31 October ashfall was reported in multiple towns in the Napo Province to the S, mainly due to a change in wind direction and not increased activity.
Source: Instituto Geofísico-Escuela Politécnica Nacional (IG-EPN)
During 3-10 October IG reported a high level of seismic activity including explosions, long-period earthquakes, harmonic tremor, and signals indicating emissions at Reventador. Steam, gas, and ash plumes rose sometimes higher that 1.1 km above the crater rim and drifted mainly NW, W, and SW. Incandescent blocks rolled as far as 800 m down the flanks. Weather clouds sometimes prevented visual observations.
Source: Instituto Geofísico-Escuela Politécnica Nacional (IG-EPN)
On 15 September, in a special report, IG summarized recent activity at Reventador noting lava flows during 24 June-1 July and 23-24 August, periods of frequent small explosions in August, and periods of explosions that were less frequent but moderate-to-large in size during July and September. Data indicated no changes in the internal and external activity of the volcano, suggesting that the eruption will continue with alternation of effusive and explosive activity in the next days to weeks.
Source: Instituto Geofísico-Escuela Politécnica Nacional (IG-EPN)
During 9-15 August IG reported a high level of seismic activity including explosions, long-period earthquakes, harmonic tremor, and signals indicating emissions at Reventador. Steam, gas, and ash plumes rose as high as 550 m above the crater rim and drifted mainly W and SW. Incandescent blocks rolled as far as 800 m down the flanks. During 10-12 August pyroclastic flows traveled as far as 600 m down the ESE and W flanks. Weather clouds sometimes prevented visual observations.
Source: Instituto Geofísico-Escuela Politécnica Nacional (IG-EPN)
During 28 June-4 July IG reported a high level of seismic activity including explosions, long-period earthquakes, harmonic tremor, and signals indicating emissions at Reventador. During 28 June-1 July plumes of water vapor and ash rose as high as 500 m above the crater rim. A 2-km-long lava flow continued to slowly advance down the NW flank. Incandescent blocks from the crater rolled at most 300 m down the W, SW, and S flanks. Cloudy weather prevented visual observations during 2-4 July.
Source: Instituto Geofísico-Escuela Politécnica Nacional (IG-EPN)
IG reported that during the previous months activity at Reventador was characterized by an average of 50 explosions per day and long-period earthquakes indicating fluid movement. Ash plumes from explosions rose as high as 2 km above the crater rim, and small pyroclastic flows descended the flanks in almost all directions. However, at 1701 on 22 June the pattern of activity changed. Seismic signals indicating emissions became continuous, and spasmodic tremor emerged which was composed of numerous small explosions. Concurrent to the change in seismicity, small-to-moderate pyroclastic flows descended 4 km down the NE flank, and plumes with low-to-moderate ash content rose 2.5 km and drifted W. Pyroclastic-flow deposits were also noted in the upper basin of El Reventador river, E of the cone. During 22-23 June incandescent blocks rolled 500 m down the flanks, steam-and-ash plumes rose 2 km, and several pyroclastic flows traveled 900 m NE. Cloud cover sometimes prevented visual observations during 24-27 June though sometimes gas-and-ash plumes were seen rising no higher than 500 m above the crater rim. Incandescent blocks continued to descend the flanks, traveling as far as 650 m. “Cannon shot” sounds were heard at night during 24-25 June. During 26-27 June several episodes of incandescence at the crater were noted, and a lava flow traveled 2 km down the NE flank.
Source: Instituto Geofísico-Escuela Politécnica Nacional (IG-EPN)
During 10-16 May IG reported a high level of seismic activity at Reventador including explosions, long-period earthquakes, harmonic tremor, and signals indicating emissions. Steam, gas, and ash plumes rose as high as 700 m above the crater rim during 10-12 May. Crater glow was noted during 11-12 May.
Source: Instituto Geofísico-Escuela Politécnica Nacional (IG-EPN)
During 25 April-2 May IG reported a high level of seismic activity including explosions, long-period earthquakes, harmonic tremor, and signals indicating emissions at Reventador. Steam, gas, and ash plumes rose around 500 m above the crater rim and drifted W and SW on most days. On 25 April incandescent blocks were observed rolling 800 m down the SW and SE flanks. Crater glow was noted through 28 April. Weather clouds prevented visual observations during 29 April-1 May.
Source: Instituto Geofísico-Escuela Politécnica Nacional (IG-EPN)
During 28 March-4 April IG reported a high level of seismic activity including explosions, long-period earthquakes, harmonic tremor, and signals indicating emissions at Reventador. Although cloud cover often prevented visual observations, activity was noted almost daily. During 28 March-3 April steam, gas, and ash plumes rose as high as 1.3 km above the crater rim and drifted SW and NE. Incandescence from the crater was sometimes visible during the night. Incandescent blocks rolled 1 km down the flanks on 1 April, and 1.6 km down the SW flank on 3 April. A small lava flow was observed traveling 1.6 km down the SW flank on 3 April.
Source: Instituto Geofísico-Escuela Politécnica Nacional (IG-EPN)
During 15-21 February IG reported a high level of seismic activity including explosions, long-period earthquakes, harmonic tremor, and signals indicating emissions at Reventador. Although cloud cover often prevented visual observations, activity was noted almost daily. Minor ashfall was reported on 15 February, and the next morning crater incandescence was visible. During 17-19 and 21 February steam, gas, and ash plumes rose 1-2 km above the crater rim and mainly drifted S and W. "Gunshot” sounds were heard on 18 February.
Source: Instituto Geofísico-Escuela Politécnica Nacional (IG-EPN)
During 4-10 January IG reported a high level of seismic activity including explosions, long-period earthquakes, harmonic tremor, and signals indicating emissions at Reventador. Although cloud cover often prevented visual observations, ash plumes were noted rising as high as 1 km above the crater and drifting W and NW during 6-7 January.
Source: Instituto Geofísico-Escuela Politécnica Nacional (IG-EPN)
During 30 November-6 December IG reported a high level of seismic activity including explosions, long-period earthquakes, harmonic tremor, and signals indicating emissions at Reventador; cloud cover sometimes prevented visual observations. Incandescent blocks were observed rolling as far as 1.6 km down the flanks. Gas, water vapor, and ash plumes were observed on most days rising as high as 1.5 km and drifted SW, W, NW, and NE.
Source: Instituto Geofísico-Escuela Politécnica Nacional (IG-EPN)
During 9-15 November IG reported a high level of seismic activity including explosions, long-period earthquakes, harmonic tremor, and signals indicating emissions at Reventador; cloud cover sometimes prevented visual observations. Almost daily incandescent blocks were observed rolling as far as 1.6 km down the E, SE, and S flanks. Gas, water vapor, and ash plumes rose as high as 2 km and drifted W and NW.
Source: Instituto Geofísico-Escuela Politécnica Nacional (IG-EPN)
During 3-9 August IG reported a high level of seismic activity including explosions, long-period earthquakes, harmonic tremor, and signals indicating emissions at Reventador; cloud cover sometimes prevented visual observations. Incandescent blocks rolled as far as 1 km down the flanks. Gas, water vapor, and ash plumes rose from the crater during 3-4 and 6-7 August; the plumes rose as high as 1 km on 6 August.
Source: Instituto Geofísico-Escuela Politécnica Nacional (IG-EPN)
On 24 June IG stated that surficial activity at Reventador had remained high during recent months. While conducting routine maintenance work of the monitoring network on 8 June, IG staff noted continuous gas-and-water-vapor emissions rising 800 m above the crater and drifting NW. Explosions produced sounds similar to gunshots and generated ash plumes that rose 2 km. Deposits from pyroclastic flows and ejected incandescent blocks were evident on all flanks, but particularly the N and S flanks.
Source: Instituto Geofísico-Escuela Politécnica Nacional (IG-EPN)
During 18-24 April IG reported a high level of seismic activity including explosions, volcano-tectonic events, long-period earthquakes, harmonic tremor, and signals indicating emissions at Reventador; cloud cover sometimes prevented visual observations. Incandescent blocks rolled as far as 1.5 km down the flanks on most days. On 18 May a pyroclastic flow traveled 1.5 km down the SE flank, and a gas-and-ash plume rose 1.5 km above the crater. A gas-and-ash plume drifted W on 20 May, and on 24 May a pyroclastic flow traveled 1 km down the SE flank.
Source: Instituto Geofísico-Escuela Politécnica Nacional (IG-EPN)
During 13-19 April IG reported a high level of seismic activity including explosions, volcano-tectonic events, long-period earthquakes, harmonic tremor, and signals indicating emissions at Reventador; cloud cover often prevented visual observations. Crater incandescence was observed at night during 12-13 April. On 13 April a pyroclastic flows traveled 1 km down the E flank, and an ash-and-gas plume rose 2 km. On 18 April a steam-and-ash plume rose 2 km and drifted SW. Crater incandescence during 18-19 April was accompanied by blocks rolling1.5 km down the S and SW flanks. Emissions rose 800 m and drifted NE.
Source: Instituto Geofísico-Escuela Politécnica Nacional (IG-EPN)
During 16-22 March IG reported a high level of seismic activity including explosions, volcano-tectonic events, long-period earthquakes, harmonic tremor, and signals indicating emissions at Reventador; cloud cover often prevented visual observations. Crater incandescence was present on a few nights. Pyroclastic flows traveled 1 km on 18 March and 2 km down the E flank on 20 March. At night during 21-22 March a pyroclastic flow traveled 1.5 km down the SW flank, and on 22 March an ash plume rose 1 km and drifted W.
Source: Instituto Geofísico-Escuela Politécnica Nacional (IG-EPN)
During 9-15 March IG reported a high level of seismic activity including explosions, volcano-tectonic events, long-period earthquakes, harmonic tremor, and signals indicating emissions at Reventador; cloud cover often prevented visual observations. On 9 March an explosion at 0505 ejected blocks that fell onto the flanks 1.2 km from the crater. An explosion at 0640 produced an ash plume that rose 1 km and drifted NW. At night during 9-10 March blocks traveled 1.2 km down the flanks and a small pyroclastic flow also descended the flanks. An explosion on 10 March generated an ash-and-steam plume that rose 1 km and drifted SW. Steam-and-ash emissions were occasionally seen through cloud cover on 13 March. The next day the crater was incandescent and blocks rolled 500 m down all flanks. Steam-and-gas plumes rose 800 m and drifted NW.
Source: Instituto Geofísico-Escuela Politécnica Nacional (IG-EPN)
During 17-23 February IG reported a high level of seismic activity including explosions, volcano-tectonic events, long-period earthquakes, harmonic and spasmodic tremor, and signals indicating emissions at Reventador; cloud cover often prevented visual observations. On 18 February a gas-and-ash plume rose 500 m above the crater and drifted NW.
Source: Instituto Geofísico-Escuela Politécnica Nacional (IG-EPN)
While in the field on 15 January, IG technicians observed several explosions at Reventador that generated ash plumes which rose 1.5-2 km above the crater. A pyroclastic flow traveled 500 m down the N flank. Pyroclastic flow deposits from the previous three weeks were also noted. Activity during 19-25 January remained high. At 2200 on 19 January a major explosion, heard in El Reventador village, ejected incandescent material onto the SW flank. Gas, steam, and ash emissions rose 0.8-2 km above the crater on most days. During 21-22 January incandescent material traveled 1.2 km down the W flank.
Source: Instituto Geofísico-Escuela Politécnica Nacional (IG-EPN)
During 18-24 November IG reported a high level of seismic activity including explosions, volcano-tectonic events, long-period earthquakes, harmonic tremor, and signals indicating emissions at Reventador; cloud cover often prevented visual observations. Steam, gas, and ash emissions rose 500 m above the crater and drifted W on 20 November. Multiple steam-and-ash plumes rose as high as 2 km and drifted W on 22 November, and ejected incandescent blocks rolled 500 m down the flanks.
Source: Instituto Geofísico-Escuela Politécnica Nacional (IG-EPN)
During 23-29 September IG reported a high level of seismic activity including explosions, volcano-tectonic events, long-period earthquakes, harmonic tremor, and signals indicating emissions at Reventador; cloud cover often prevented visual observations. Daily ash-and-gas emissions rose as high as 1.5 km above the crater and drifted W, WNW, and NW.
Source: Instituto Geofísico-Escuela Politécnica Nacional (IG-EPN)
During 19-25 August IG reported a high level of seismic activity including explosions, tremor, long-period earthquakes, harmonic tremor, and signals indicating emissions at Reventador; cloud cover often prevented visual observations. On 20 August a steam-and-ash plume rose 2 km and drifted S and SW. During 23-24 August steam-and-ash plumes rose 500-700 m and drifted NW.
Source: Instituto Geofísico-Escuela Politécnica Nacional (IG-EPN)
During 15-21 July IG reported a high level of seismic activity including explosions, tremor, long-period earthquakes, harmonic tremor, and signals indicating emissions at Reventador; cloud cover often prevented visual observations. On 14 July a steam-and-ash plume rose 1 km and drifted W, and on 16 July an ash plume rose 1.3 km and drifted NW. On 17 July an ash plume rose 700 m, and light gray deposits possibly from a pyroclastic flow were observed. On 20 July explosions produced ash plumes that rose 1 km and drifted NW. The next day a steam-and-ash plume rose 1.5 km and drifted E. Explosions ejected incandescent material onto the flanks.
Source: Instituto Geofísico-Escuela Politécnica Nacional (IG-EPN)
During 1-7 July IG reported a high level of seismic activity including explosions, tremor, long-period earthquakes, harmonic tremor, and signals indicating emissions at Reventador; cloud cover sometimes prevented visual observations. Incandescent material that traveled more than 1 km down the SE flank was visible during 1-2 and 6 July in thermal images. Ash emissions were visible on 2 July, and a steam-and-ash plume that rose 2 km and drifted SW was visible the next day. A minor ash emission rose less than 500 m and drifted W on 6 July.
Source: Instituto Geofísico-Escuela Politécnica Nacional (IG-EPN)
During 10-16 June IG reported moderate seismic activity including explosions, long-period earthquakes, harmonic tremor, and signals indicating emissions at Reventador; cloud cover sometimes prevented visual observations. On 10 June a steam-and-ash plume rose 1 km above the crater. On 12 June an ash plume rose 1 km and drifted SW. The lava flow on the SW flank was visible in thermal images. A steam-and-ash plume rose 1 km and drifted NW on 14 June, and a vapor-and-ash emission drifted W on 16 June.
Source: Instituto Geofísico-Escuela Politécnica Nacional (IG-EPN)
During 27 May-2 June IG reported moderate seismic activity including explosions, long-period earthquakes, harmonic tremor, and signals indicating emissions at Reventador; cloud cover sometimes prevented visual observations. On 27 May a steam-and-ash plume rose 1 km and drifted SW. The next day frequent vapor emissions with a slight amounts of ash rose 800 m above the crater and mainly drifted NW. During 29-30 May steam plumes with minor amounts of ash rose 1 km and drifted SW and NW. On 2 June an ash plume rose 300 m and drifted NW.
Source: Instituto Geofísico-Escuela Politécnica Nacional (IG-EPN)
During 20-26 May IG reported moderate-to-high seismic activity including explosions, long-period earthquakes, harmonic tremor, and signals indicating emissions at Reventador; cloud cover sometimes prevented visual observations. A lava flow on the SW flank advanced during 20-21 May. During 24-25 May ash plumes rose 600-800 m and drifted SW, although at 1730 on 25 May a water vapor plume with moderate ash content rose 1.5 km and drifted SW.
Source: Instituto Geofísico-Escuela Politécnica Nacional (IG-EPN)
During 15-21 April IG reported moderate seismic activity including explosions, long-period earthquakes, harmonic tremor, and signals indicating emissions at Reventador; cloud cover often prevented visual observations. During 15-16 April steam-and-ash plumes rose 500-1,000 m above the crater and drifted SW. On 18 April an emission of water vapor with minor ash content rose 800 m and drifted SW.
Source: Instituto Geofísico-Escuela Politécnica Nacional (IG-EPN)
During 1-7 April IG reported moderate seismic activity including explosions, long-period earthquakes, harmonic tremor, and occasional tremor at Reventador; cloud cover often prevented visual observations. During 1-2 and 6 April incandescence from the crater and a lava flow on the SW flank were visible with the aid of an infrared camera. On 3 April a steam plume rose 600 m above the crater and drifted NW. The next day a steam-and-ash plume rose 500 m and drifted W. On 6 April a steam-and-ash plume rose 1 km and drifted NW.
Source: Instituto Geofísico-Escuela Politécnica Nacional (IG-EPN)
During 10-17 March IG reported moderate seismic activity including explosions, long-period earthquakes, harmonic tremor, and tremor at Reventador; cloud cover often prevented visual observations. A lava flow continued to descend the SW flank and was 1.2 m long by 13 March.
Source: Instituto Geofísico-Escuela Politécnica Nacional (IG-EPN)
During 25 February-3 March IG reported moderate seismic activity including explosions, long-period earthquakes, harmonic tremor, and occasional tremor at Reventador; cloud cover often prevented visual observations. On 25 February a thermal anomaly was detected from the lava flow on the SW flank. On 27 February continuous emissions of gas and ash rose 1 km and drifted SW. A steam-and-ash plume rose 600 m and drifted W on 1 March.
Source: Instituto Geofísico-Escuela Politécnica Nacional (IG-EPN)
During 18-24 February IG reported moderate seismic activity including explosions, long-period earthquakes, harmonic tremor, and tremor at Reventador; cloud cover often prevented visual observations. On 19 February observers confirmed the presence of a 1-km-long lava flow that had been advancing down the SW flank since 11 February. A diffuse steam plume with minor amounts of ash rose 1 km and drifted SW. On 21 February steam-and-ash emissions rose 600 m and drifted NW. Vapor plumes with minor amounts of ash rose 500 m and drifted SW on 24 February.
Source: Instituto Geofísico-Escuela Politécnica Nacional (IG-EPN)
IG reported moderate seismic activity including explosions, long-period earthquakes, harmonic tremor, and tremor at Reventador during 28 January-3 February. Cloudy conditions obscured views of the summit most of the time. On 28 January a steam plume with low ash content rose 1 km above the crater and drifted W. During 29-30 January steam plumes with minor amounts of ash rose 400-500 m and drifted SW and S.
Source: Instituto Geofísico-Escuela Politécnica Nacional (IG-EPN)
IG reported moderate seismic activity including explosions, long-period earthquakes, harmonic tremor, and tremor at Reventador during 14-20 January. Cloudy conditions occasionally obscured views of the summit. A vapor plume observed on 14 January, containing a small amount of ash, rose 1 km and drifted SW. On 15 January an explosion generated a steam-and-ash plume that rose 1 km and drifted NW. A smaller explosion produced a plume that rose 200 m. An explosion on 16 January generated an ash plume that rose 2 km and drifted SE. A vapor-and-ash plume rose 1 km and drifted SW on 19 January.
Source: Instituto Geofísico-Escuela Politécnica Nacional (IG-EPN)
IG reported moderate seismic activity including explosions, long-period earthquakes, harmonic tremor, and tremor at Reventador during 3-9 December. Cloudy conditions occasionally obscured views of the summit. Steam emissions on 3 December rose from the crater and drifted NW. On 4 December steam plumes with minor ash content rose 200 m and drifted S. On 5 December a webcam recorded a steam-and-gas emission associated with an incandescent lava flow on the E flank. Water vapor plumes rose 500-700 m and drifted NW on 7 December, and 1 km and drifted SW on 9 December.
Source: Instituto Geofísico-Escuela Politécnica Nacional (IG-EPN)
IG reported moderate volcanic activity including explosions, long-period earthquakes, harmonic tremor, and tremor at Reventador during 12-18 November. During 12-14 and 18 November steam plumes with a minor ash content rose at most 1 km and drifted NW and N. Cloudy conditions frequently obscured views of the summit.
Source: Instituto Geofísico-Escuela Politécnica Nacional (IG-EPN)
IG reported moderate volcanic activity including explosions, long-period earthquakes, harmonic tremor, and tremor at Reventador during 5-11 November. On 11 November steam plumes with a minor ash content rose 1 km and drifted NW. Cloudy conditions frequently obscured views of the summit.
Source: Instituto Geofísico-Escuela Politécnica Nacional (IG-EPN)
IG reported that vapor plumes with a low ash content rose 1-2 km above Reventador and drifted NW and SW during 17-22 September.
Source: Instituto Geofísico-Escuela Politécnica Nacional (IG-EPN)
IG reported moderate volcanic activity including explosions, long-period earthquakes, and tremor at Reventador during 10-16 September. On 10 September continuous steam with minor ash plumes rose 1,000 m above the summit and drifted NW. Cloudy conditions frequently obscured views of the summit.
Source: Instituto Geofísico-Escuela Politécnica Nacional (IG-EPN)
During 3-9 September IG reported moderate activity including explosions, long-period earthquakes, harmonic tremor, and tremor at Reventador. While cloud cover frequently limited observations, on 5-8 September steam emissions were observed with small quantities of ash. In the morning of 5 September an explosion generated a plume and ejected blocks from the crater that fell ~500 m below the summit on the W flank. A thermal camera detected an explosion on the following day that also included ballistics. Rumbling sounds were heard in the morning of 7 September, and that evening a 1 km plume was observed. The following morning a vapor plume persisted from the summit, and in the afternoon it contained a small amount of ash.
The MODIS sensor onboard the Terra satellite detected thermal anomalies from the region of Reventador’s summit during 4-6 September.
Sources: Instituto Geofísico-Escuela Politécnica Nacional (IG-EPN); Hawai'i Institute of Geophysics and Planetology (HIGP) Thermal Alerts Team
During 27 August-2 September IG reported moderate activity including explosions, long-period earthquakes, harmonic tremor, and tremor at Reventador. On 27 August steam emissions were observed. On most days the volcano was obscured by clouds. On 2 September instruments recorded tremor-related emissions and satellite views showed an ash plume that rose 6 km (19,700 ft) height and drifted W. On 2 September the Washington VAAC reported volcanic ash emissions.
Sources: Instituto Geofísico-Escuela Politécnica Nacional (IG-EPN); Washington Volcanic Ash Advisory Center (VAAC)
During 20-26 August IG reported moderate to high volcanic activity at Reventador, including explosions, long-period earthquakes, harmonic tremor, and tremor. On 20 August ash plumes, observed through partly cloudy skies, remained near the volcano. On 26 August in the morning hours emissions of water vapor were reported above the crater drifting SW. The volcano was obscured by clouds the other days of the week. On 24 August the Washington VAAC reported an emission with light ash to 6 km (20,000 ft) a.s.l. identified by wind and satellite data, seismic detection, and pilot report.
Source: Instituto Geofísico-Escuela Politécnica Nacional (IG-EPN)
IG reported moderate volcanic activity including explosions, long-period earthquakes, harmonic tremor, and tremor at Reventador on 13, 14, 18, and 19 August. On 13 August continuous steam with minor ash plumes rose 500 m above the summit and drifted NE. On 14 August clear views of the volcano showed no surface activity, and on 18-19 August the volcano was obscured by clouds.
Source: Instituto Geofísico-Escuela Politécnica Nacional (IG-EPN)
IG reported moderate volcanic activity including explosions, long period earthquakes, harmonic tremor, and tremor at Reventador during 6-12 August. On 6 August a dark gray plume rose 300 m above the summit and drifted NW. On 7, 8 and 10 August steam and steam-and-minor ash rose 300 to 800 m above the summit and drifted SW and NW. On 9 August views of the volcano were obscured by clouds and no report was available 11 August.
Source: Instituto Geofísico-Escuela Politécnica Nacional (IG-EPN)
IG reported moderate volcanic activity including explosions, long period earthquakes, harmonic tremor, and tremor at Reventador during 30 July-5 August. On most days IG reported inclement weather with intermittent views of steam-and-ash plumes that rose above the crater and drifted W. On 2 August IG noted a steam-and-ash plume rose 2 km above the crater accompanied by seven emission tremor events. On 31 July Washington VAAC reported on-going ash emissions and detected hotspots at the crater.
Sources: Instituto Geofísico-Escuela Politécnica Nacional (IG-EPN); Washington Volcanic Ash Advisory Center (VAAC)
IG reported moderate seismicity including explosions, long-period earthquakes, harmonic tremor, and tremor, though cloud cover mostly prevented observations of Reventador during 23-29 July. On 23 July IG reported that a column rose to 1 km above the crater and on 24 July reported strong roaring and a plume that drifted NW. On 27 July an emission was seen in satellite imagery.
Source: Instituto Geofísico-Escuela Politécnica Nacional (IG-EPN)
IG reported moderate seismicity including explosions, long-period earthquakes, harmonic tremor, and tremor, though cloud cover mostly prevented observations of Reventador during 16-21 July. On 18 July IG noted an emission that rose to 800 m above the crater, and on 22 July a minor ash emission also rose 800 m above the crater; both drifted SW.
Source: Instituto Geofísico-Escuela Politécnica Nacional (IG-EPN)
IG reported that although cloud cover often prevented observations of Reventador, during 30 June and 2, 4, and 9-12 July ash emissions were seen. In the afternoon of 30 June, a diffuse ash plume was visible rising from the summit. Activity increased on 2 July when 41 explosions were recorded, as well as 27 long-period earthquakes and 15 episodes of tremor associated with emissions. A 2-km-high gas-and-ash plume was observed rising from the summit on the morning of 2 July that drifted SE and later that night an explosion was heard. The IG reported that SOTE (Sistema de Oleoducto Transecuatoriano) personnel heard explosions during the morning of 8 July. The next morning, SOTE personnel noted that the summit was clear and a gas-and-ash plume was rising from the summit up to 2 km above the crater rim. Diffuse ash plumes were also noted on 10 and 11 July that reached 1.5 km above the crater and drifted NW.
The seismic network detected the highest number of explosion signatures during 2-5 July when 34-45 events per day were detected. Up to 12 episodes of harmonic tremor per day occurred during 4 and 5 July. The highest number of long-period earthquakes occurred during 10-11 July: 90 events per day. Tremor signatures associated with emissions had a wide range during this reporting period (0-28 per day), but typically numbered less than 15 per day.
Source: Instituto Geofísico-Escuela Politécnica Nacional (IG-EPN)
IG reported that although cloud cover often prevented observations of Reventador, during 18-24 June ash plumes were occasionally observed. At night on 17 June incandescence was observed on the S and E flanks. In the morning of 18 June a diffuse ash plume was visible rising ~600 m above the summit that dispersed to the NW. A total of 30 explosion signatures were recorded by the seismic network, along with long-period (LP) earthquakes and tremor.
Incandescence was observed in the morning of 19 June. The infrared webcamera recorded incandescent material descending onto the NE flank. Residents of San Rafael (8 km ESE) reported roaring sounds from the volcano on 19 and 20 June. The seismic network detected >=18 explosions, >20 LP, and >=7 tremor events per day during 18-24 June.
Source: Instituto Geofísico-Escuela Politécnica Nacional (IG-EPN)
IG reported that although cloud cover often prevented observations of Reventador during 21-27 May ash plumes were occasionally observed. An ash plume was observed from an aircraft on 22 May, and the next day an ash-and-vapor plume rose 1 km and drifted NW.
Source: Instituto Geofísico-Escuela Politécnica Nacional (IG-EPN)
IG reported that a small pyroclastic flow traveled a few meters below Reventador’s crater on 29 April. Cloud cover occasionally prevented visual observations during 30 April-6 May. An ash plume rose 3-4 km and drifted W on 1 May, and a steam plume with some ash rose less than 1 km the next day. People in Camp San Rafael (8 km ESE) reported that an explosion at 2040 on 4 May ejected a large amount of incandescent material onto the flanks, and generated an ash plume that rose 4-5 km above the crater and drifted NW. Explosions on 5 May produced ash plumes that rose 4 km. At 0925 an explosion vibrated windows in the camp. On 6 May explosions again rattled windows in the camp and a gas plume was observed rising 1 km and drifted W.
Source: Instituto Geofísico-Escuela Politécnica Nacional (IG-EPN)
IG reported that activity at Reventador remained high on 9-15 April; numerous explosions were detected each day. Steam-and-ash plumes rose less than 1 km above the crater and drifted W during 9-10 April. Lava flows down the SW flank were reported on 9 and 11 April. Clouds obscured views during 12-15 April.
Source: Instituto Geofísico-Escuela Politécnica Nacional (IG-EPN)
IG reported that cloud cover occasionally prevented visual observations of Reventador during 2-8 April; activity remained high. A steam-and-ash plume rose 3 km and drifted E on 2 April, and a thermal camera detected hot material on the flanks. Four lava flows on the S and SE flanks were observed on 3 April. Ash emissions were observed the next day. On 5 April sporadic ash emissions rose 1 km and drifted W. On 6 April water vapor emissions with low amounts of ash rose 500 m and drifted NW. During 7-8 April lava flows continued to descend the S and SE flanks. On 8 April vapor emissions with small amounts of ash were observed.
Source: Instituto Geofísico-Escuela Politécnica Nacional (IG-EPN)
IG reported that activity at Reventador increased on 25 March. At 1830 an explosion was followed by a pyroclastic flow that traveled 500 m down the flanks. Strombolian activity produced gas-and-ash plumes that rose 1.5 km above the crater. During 26-29 March continuous tremor was interspersed with explosions and long-period earthquakes. Although cloud cover often prevented crater views, video cameras showed a lava flow traveling down the S flank and incandescent material erupting from the crater. Emissions with small amounts of ash rose 1 km on 28 March. Ashfall was reported in Hosteria El Reventador and camp San Rafael on the flanks. A load roar reported at 0300 on 31 March was followed by observations of incandescent material traveling 1 km down the S flank. Cloud cover prevented visual observations the next day.
Source: Instituto Geofísico-Escuela Politécnica Nacional (IG-EPN)
Based on information from IG, the Washington VAAC reported that on 22 January an ash plume from Reventador rose to an altitude of km (12,000 ft) a.s.l. Ash was not identified in satellite images. IG noted that an explosions lasting several minutes was recorded.
Sources: Instituto Geofísico-Escuela Politécnica Nacional (IG-EPN); Washington Volcanic Ash Advisory Center (VAAC)
Based on a pilot observation, the Washington VAAC reported that on 31 December an ash plume from Reventador rose to an altitude of km (16,000 ft) a.s.l. Ash was not identified in satellite images due to weather clouds in the area but an occasional thermal anomaly was detected.
Source: Washington Volcanic Ash Advisory Center (VAAC)
During 30 October through 5 November, IG reported that moderate activity from Reventador continued. Elevated seismicity included explosions (8-35 per day), long period earthquakes, and tremor related to emissions and fluid movement in the crust (harmonic tremor). Plumes of steam were frequently observed when the weather permitted; ash plumes were generated on 31 October, 2 November, and 5 November. Ashfall from these events reached the town of San Rafael on 31 October and 2 November; a pilot observed ash on 2 November at an altitude of 6.7 km (22,000 ft). Observers heard roaring noises and sounds resembling "cannon shots" on 31 October and 1 November.
Sources: Instituto Geofísico-Escuela Politécnica Nacional (IG-EPN); Washington Volcanic Ash Advisory Center (VAAC)
IG reported that seismicity remained elevated at Reventador during 18-24 September. Although cloud cover often prevented observations, ash plumes were occasionally observed. On 19 September an ash plume drifted W, and on 21 September multiple low-energy steam emissions contained small amounts of ash. Deposits from a pyroclastic flow that had descended the S flank were observed on 22 September.
Source: Instituto Geofísico-Escuela Politécnica Nacional (IG-EPN)
IG reported that seismicity remained elevated at Reventador during 4-10 September. Although cloud cover often prevented observations, ash plumes were occasionally observed rising from the lava dome. On 6 September IG staff observed 1-km-long deposits from a pyroclastic flow that had descended the S flank after an explosion. Ash plumes rose 1-2 km above the lava dome during 6-7 September, and minor ash emissions were noted on 9 September.
Source: Instituto Geofísico-Escuela Politécnica Nacional (IG-EPN)
IG reported that during 7-8 August explosions at Reventador ejected incandescent material onto the SW flank. Steam emissions were observed on 8 and 9 August, and on 10 August they contained ash and rose 1 km above the crater. Cloud cover prevented observations during 11-13 August; roaring was reported on 13 August.
Source: Instituto Geofísico-Escuela Politécnica Nacional (IG-EPN)
IG reported that during 24-30 July seismic activity at Reventador remained high and was characterized by explosions, low-intensity emissions, and long-period earthquakes indicting fluid movement. Cloud cover mostly prevented visual observations. On 26 July an explosions generated a low-altitude ash plume that drifted W.
Source: Instituto Geofísico-Escuela Politécnica Nacional (IG-EPN)
IG reported that during 17-19 July seismic activity at Reventador remained high; at times periods of increased seismicity were followed by relatively quiet episodes. The seismic network recorded long-period signals, rockfalls, explosions, and emissions. Based on reports from observers at camp San Rafael, cloud cover often prevented visual observations, although on 18 July a new lava flow on the E flank was observed with a video camera, and a gas-and-ash plume was observed rising 1 km. During 21-22 July gas plumes with low ash content rose to low heights.
Source: Instituto Geofísico-Escuela Politécnica Nacional (IG-EPN)
IG reported that during 10-16 July seismic activity at Reventador was high; weather conditions mostly prevented visual observations of the crater. During partially clear views on 13 July, observers noted a new lava flow on the S flank. At 1500 on 15 July continuous tremor was detected, which intensified at 2000, and then decreased at midnight. Intense Strombolian activity during this time was characterized by variable-magnitude explosions and roaring. Explosions generated blocks that rolled down the flanks. Incandescence from the lava flow on the S flank was observed.
Source: Instituto Geofísico-Escuela Politécnica Nacional (IG-EPN)
According to the Washington VAAC a pilot observed an emission from Reventador that rose to an altitude of 4.9 km (16,000 ft) a.s.l. on 20 June. The VAAC also noted that seismic records from IG were consistent with an emission of ash or gas, and that satellite images did not detect ash.
Source: Washington Volcanic Ash Advisory Center (VAAC)
The Washington VAAC reported that on 1 June gas emissions from Reventador possibly contained diffuse ash. Ash was not detected in satellite images.
Source: Washington Volcanic Ash Advisory Center (VAAC)
IG reported that during the morning of 8 May incandescence from Reventador's crater was observed in addition to steam-and-ash plumes that rose 1 km above the crater and drifted NW. Cloud cover prevented observations the rest of the day and most of the time during 9-14 May. At 1700 on 10 May a steam plume with low ash content rose 1 km above the crater, and on 11 May a vapor plume rose 500 m and drifted SW.
Source: Instituto Geofísico-Escuela Politécnica Nacional (IG-EPN)
According to the Washington VAAC, IG reported that on 1 May seismicity at Reventador was elevated, and an ash plume rose to an altitude of 7 km (23,000 ft) a.s.l. A thermal anomaly was visible in satellite images. On 2 May ash was not identified in images and seismicity decreased.
Source: Washington Volcanic Ash Advisory Center (VAAC)
According to the Washington VAAC, on 12 April an ash plume from Reventador was observed in visible satellite images along with a corresponding thermal anomaly in short wave infrared images.
Source: Washington Volcanic Ash Advisory Center (VAAC)
IG reported that the seismic network at Reventador recorded multiple explosions during 12-17 March. Observers reported falling and rolling incandescent material on the S flank on 12 March. Explosions produced ash plumes that rose more than 1 km and drifted SW. The next day ash plumes rose as high as 3 km. On 15 and 17 March explosions were detected by the seismic network; cloud cover prevented visual observations. On 16 March an ash plume rose 1 km and drifted W.
Source: Instituto Geofísico-Escuela Politécnica Nacional (IG-EPN)
According to the Washington VAAC, the IG reported that on 2 March lava flows were observed, and a gas-and-ash plume rose to an altitude of 4 km (13,000 ft) a.s.l. and drifted SW. About an hour later a pilot observed an ash plume that rose to the same altitude. No ash plumes were identified in satellite imagery, however a weak thermal anomaly was observed during 2-3 March.
Source: Washington Volcanic Ash Advisory Center (VAAC)
IG reported that seismicity at Reventador was high during 6-7 February and moderate during 8-12 February; explosions were detected daily. An ash plume rose 3 km and drifted S on 7 February, and ashfall was reported in areas near the volcano on 9 February. Cloud cover often prevented observations.
Source: Instituto Geofísico-Escuela Politécnica Nacional (IG-EPN)
During an overflight of Reventador on 29 January scientists observed an explosion and a steam-and-ash plume that rose 1.5 km above the lava dome. Since November the dome had significantly grown to at least 100 m higher than the E rim, and about 20 lava flows had traveled down the N, SE, and S flanks.
During 29 January-5 February seismicity remained high. Cloud cover often prevented observations although emissions were observed; steam-and-ash plumes rose 2-4 km and drifted W and NW on most days. Crater incandescence was observed at night during 29-30 January.
Source: Instituto Geofísico-Escuela Politécnica Nacional (IG-EPN)
IG reported that in the morning of 22 January tremor at Reventador increased significantly and signals indicating rockfalls were detected. Explosions were heard during the afternoon and evening that same day. After an explosion in the crater a gas-and-steam plume was observed rising 1.5 km above the crater. Lava flows traveled down the SW and N flanks. The lava dome had grown at least 100 m above the crater rim.
During 23-29 January seismicity remained high. Cloud cover mostly prevented visual observations; during 22-23 January lava flow were visible at night, and on 24 January a steam-and-ash plume rose 2 km. Gas plumes rose as high as 1 km and drifted NW and W on 29 January.
Source: Instituto Geofísico-Escuela Politécnica Nacional (IG-EPN)
IG reported that during 16-21 January seismicity at Reventador was moderate; cloud cover prevented visual observations. Incandescence in the crater was observed at night during 21-22 January. Starting at 0900 on 22 January seismicity at Reventador increased and was characterized by constant low-frequency, high-energy tremor detected by seismic stations around the volcano. Observers reported lava fountains in the crater and lava flows on the flanks, both of which became more intense at 1800. Explosions produced white-to-light-gray plumes that rose 2 km and drifted W.
Source: Instituto Geofísico-Escuela Politécnica Nacional (IG-EPN)
IG reported that seismicity at Reventador was high during 5-11 December and indicated multiple explosions almost daily. Plumes were observed although cloud cover often prevented visual observations. On 5 December a steam plume rose 1.5 km and drifted NW. The next day a steam-and-ash plume rose 2 km above the lava dome and drifted SE. A steam-and-ash plume rose 1 km on 8 December and drifted WSW, towards Chaco. Another steam-and-ash plume was observed on 11 December.
Source: Instituto Geofísico-Escuela Politécnica Nacional (IG-EPN)
IG reported that scientists aboard an overflight of Reventador on 23 November observed steam-and-gas emissions with slight amounts of ash rising 500 m above the lava dome and drifting WSW. The lava dome had intense fumarolic activity and there was a new crater at the summit of the dome, which was filled with ash and large blocks. A thermal camera measured temperatures in the dome of about 300 degrees Celsius. Lava flows continued to be active on the dome flanks, and elongated block-and-ash deposits were also visible on the flanks.
According to the Washington VAAC, the IG reported that on 24 November an ash plume from Reventador rose to an altitude of 4.6 km (15,000 ft) a.s.l. Ash was not detected in satellite imagery due to cloud cover, but a thermal anomaly was detected.
Sources: Washington Volcanic Ash Advisory Center (VAAC); Instituto Geofísico-Escuela Politécnica Nacional (IG-EPN)
IG reported that seismicity at Reventador indicated falling rock and explosions during 14-15 November. Cloud cover prevented visual confirmation.
Source: Instituto Geofísico-Escuela Politécnica Nacional (IG-EPN)
On 9 November, IG reported that since February Reventador began a new phase of activity characterized by lava flows from the crater, steam plumes, and thermal anomalies detected in satellite images. The lava flows traveled as far as 2 km down the N and S flanks, and steam plumes rose 200-500 m above the crater. Field visits by volcanologists in recent months confirmed that the lava dome in the crater had continued to grow above the rim, becoming the highest point of the volcano. Blocks from the lava dome and lava-flow fronts rolled down the flanks. IG noted that during 3-4 November emissions increased; a steam-and-ash plume rose 3 km above the crater. The seismic network detected an increase in the magnitude of volcanic tremor. Steam-and-gas plumes contained ash within the previous few days.
According to the Washington VAAC, the IG reported that on 9 November an ash emission from Reventador rose to an unknown height. On 13 November a gas-and-ash plume rose to an altitude of 5.2 km (17,000 ft) a.s.l. and drifted SE. Ash was not detected in satellite imagery on either day.
Sources: Washington Volcanic Ash Advisory Center (VAAC); Instituto Geofísico-Escuela Politécnica Nacional (IG-EPN)
The IG reported that although cloud cover often prevented observations of Reventador, plumes were observed almost daily. During 31 October-1 November and 3 November plumes rose 1.5-3 km above the crater and drifted NW. At about 0400 on 5 November a steam-and-ash plume rose 3 km. An ash plume rose 2 km and drifted NW at 0600.
Source: Instituto Geofísico-Escuela Politécnica Nacional (IG-EPN)
Based on analysis of satellite imagery, the Washington VAAC reported that an ash plume from Reventador drifted 22 km SW on 20 September.
Source: Washington Volcanic Ash Advisory Center (VAAC)
Based on analysis of satellite imagery, the Washington VAAC reported a possible ash emission from Reventador on 11 August. The next day a well-defined thermal anomaly was detected and an ash plume drifted W. According to the VAAC, IG confirmed the ash plume, noting that it rose to an altitude of 5.2 km (17,000 ft) a.s.l.
Source: Washington Volcanic Ash Advisory Center (VAAC)
IG reported that on 18 April a plume with low ash content rose 2 km above Reventador's crater and drifted NW. A steam plume rose 100 m above the crater the next day. Weather conditions prevented observations during 20-23 April.
Source: Instituto Geofísico-Escuela Politécnica Nacional (IG-EPN)
IG reported that during 21-25 March storm clouds prevented observations of Reventador. During 25-26 March incandescence from a high part of the volcano was observed. On 26 March a steam emission rose 500 m above the crater. Based on analysis of satellite imagery and seismic data, the Washington VAAC reported that an ash plume drifted 25 km NNW on 26 March. Later that day the ash had dissipated and seismicity decreased.
Sources: Washington Volcanic Ash Advisory Center (VAAC); Instituto Geofísico-Escuela Politécnica Nacional (IG-EPN)
IG reported that activity continued at Reventador during 15-21 February. Satellite images showed a thermal anomaly on the NE flank from the lava flow that was observed on 12 February. Clouds prevented views on 17, 19, and 21 February. Based on analysis of satellite imagery, the Washington VAAC reported an ash plume that drifted 19 km SE on 16 February. IG observed an ash plume that rose 100 m above the crater on 18 February.
Sources: Washington Volcanic Ash Advisory Center (VAAC); Instituto Geofísico-Escuela Politécnica Nacional (IG-EPN)
IG reported that during 10-13 February new activity from Reventador was detected. Satellite images showed a thermal anomaly on 10 February. Based on pilot observations, the Washington VAAC reported an ash plume that rose to an altitude of 5.2 km (17,000 ft) a.s.l. and drifted NW. On 11 February ash-and-steam emissions drifted NW. Seismicity increased on 12 February and a lava flow descended the NE flank during 12-13 February. Crater incandescence was observed during 10-13 February.
Sources: Washington Volcanic Ash Advisory Center (VAAC); Instituto Geofísico-Escuela Politécnica Nacional (IG-EPN)
IG reported that staff conducting fieldwork at Reventador during 6-7 January observed constant emissions of gas-and-steam rising about 300 m above the crater and drifting WNW. The emissions originated from a growing lava dome that was a few tens of meters above the crater rim and almost filled the base.
Source: Instituto Geofísico-Escuela Politécnica Nacional (IG-EPN)
The IG reported that scientists conducting an overflight of Reventador on 14 July noted that the lava dome at the top of the 2008 cone continued to grow, filling the crater. The dome had reached the same height as the highest part of the crater rim, formed during 2002. Intense fumarolic activity produced continuous plumes. The dome was thought to have formed during 2011, growing at a rapid rate and producing high temperatures. IG also noted that seismicity had increased starting in May but was more pronounced during the previous few weeks. During 3-9 August cloud cover prevented observations of the lava dome, but the seismic network detected long-period and explosion-type earthquakes.
Source: Instituto Geofísico-Escuela Politécnica Nacional (IG-EPN)
Based on a pilot observation, the Washington VAAC reported that on 4 January an ash plume from Reventador rose to an altitude of 5.2 km (17,000 ft) a.s.l. Cloud cover prevented clear satellite observations of the volcano. A subsequent report stated that IG noted low seismicity, no reports of ashfall, and that satellite imagery showed no ash emissions.
Source: Washington Volcanic Ash Advisory Center (VAAC)
Based on a pilot observation, the Washington VAAC reported that on 2 November an ash plume from Reventador rose to an altitude of 4.6 km (15,000 ft) a.s.l. Cloud cover prevented clear satellite observations of the volcano.
Source: Washington Volcanic Ash Advisory Center (VAAC)
Based on analyses of satellite imagery and information from IG, the Washington VAAC reported that on 6 October a small ash cloud from Reventador drifted NE. IG also reported that a steam plume rose 1 km above the crater on that same day.
Sources: Washington Volcanic Ash Advisory Center (VAAC); Instituto Geofísico-Escuela Politécnica Nacional (IG-EPN)
According to the Washington VAAC, the IG reported ash over Reventador on 30 September. The VAAC stated that a diffuse plume was observed in satellite imagery drifting NW, although ash was not identified.
Source: Washington Volcanic Ash Advisory Center (VAAC)
The IG reported that on 28 September three seismic events from Reventador were recorded. Cloud cover prevented observations during the first event. During the second period of increased seismicity, observers noted that a steam plume with a small amount of ash rose 400-500 m above the crater and drifted N. The third episode was accompanied by a steam-and-ash plume that rose 2 km above the crater and drifted NW. Ash fell on Reventador.
Source: Instituto Geofísico-Escuela Politécnica Nacional (IG-EPN)
The Washington VAAC reported that on 9 September an ash plume from Reventador at an altitude of 5.5 km (18,000 ft) a.s.l. was observed by a pilot.
Source: Washington Volcanic Ash Advisory Center (VAAC)
The Washington VAAC reported that on 30 August an ash plume was observed near Reventador by a pilot. Ash was not seen in satellite imagery.
Source: Washington Volcanic Ash Advisory Center (VAAC)
The IG reported a lahar on Reventador's E flank, detected for 90 minutes by the seismic network on 25 May. It destroyed a bridge over the Marker River, disrupting the route from Baeza to Lago Agrio.
Source: Instituto Geofísico-Escuela Politécnica Nacional (IG-EPN)
The IG reported that during 5-9 May observations of Reventador were not possible because of weather. The Washington VAAC reported that on 7 May an ash plume seen by a pilot rose to an altitude of 5.2 km (17,000 ft) a.s.l. Cloud cover prevented satellite observations of the area. On 8 May the IG noted a small lahar inside the caldera.
Sources: Washington Volcanic Ash Advisory Center (VAAC); Instituto Geofísico-Escuela Politécnica Nacional (IG-EPN)
The IG reported that on 29 April an explosion from Reventador produced a steam plume with low ash content. Meteorological clouds mostly prevented observations during 30 April-4 May.
Source: Instituto Geofísico-Escuela Politécnica Nacional (IG-EPN)
The IG reported that on 20 April scientists conducting an overflight of Reventador saw steam-and-gas emissions. They also observed an explosion generate a pyroclastic flow that traveled 200 m down the S flank. Deposits from previous pyroclastic flows were seen on the same flank. Explosions generated steam-and-gas plumes with low ash content during 20-22 April. Weather clouds prevented views of the volcano in satellite imagery on 23 April, although a pilot reported that an ash plume rose to an altitude of 4.9 km (16,000 ft) a.s.l. On 26 April a steam-and-ash plume rose 500 m above the crater.
Sources: Washington Volcanic Ash Advisory Center (VAAC); Instituto Geofísico-Escuela Politécnica Nacional (IG-EPN)
The IG reported that during 7-13 April observations of Reventador were not possible because of weather. The Washington VAAC reported that on 8 April an ash plume seen by pilots rose to altitudes of 4.6-6.7 km (15,000-22,000 ft) a.s.l. and drifted W. Cloud cover prevented satellite observations of the area. The VAAC also noted that seismicity was elevated.
Sources: Washington Volcanic Ash Advisory Center (VAAC); Instituto Geofísico-Escuela Politécnica Nacional (IG-EPN)
The MODIS satellite detected a thermal anomaly over Reventador on 14 February. Based on information from the Guayaquil MWO, the Washington VAAC reported an ash emission on 18 February. Ash was not identified in satellite imagery. IG reported that seismic signals indicated an emission that day, but weather conditions prevented visual observations.
Sources: Instituto Geofísico-Escuela Politécnica Nacional (IG-EPN); Washington Volcanic Ash Advisory Center (VAAC); Hawai'i Institute of Geophysics and Planetology (HIGP) Thermal Alerts Team
Based on a pilot observation, the Washington VAAC reported that on 20 November an ash plume from Reventador rose to an altitude of 6.1 km (20,000 ft) a.s.l. A thermal anomaly was detected on satellite imagery.
Source: Washington Volcanic Ash Advisory Center (VAAC)
Based on analyses of satellite imagery, the Washington VAAC reported that on 14 November ash plumes from Reventador drifted 10-20 km WNW and W. An intermittent thermal anomaly was also detected.
Source: Washington Volcanic Ash Advisory Center (VAAC)
Based on a pilot observation, the Washington VAAC reported that on 5 November an ash plume from Reventador rose to an altitude of 7 km (23,000 ft) a.s.l. and drifted NE. Ash was not seen in satellite imagery, although meteorological clouds were present. IG reported that an ash plume rose 500 m above the crater on 7 November.
Sources: Washington Volcanic Ash Advisory Center (VAAC); Instituto Geofísico-Escuela Politécnica Nacional (IG-EPN)
The IG reported that on 21 October, steam-and-gas plumes from Reventador with little to no ash content rose 2-4 km above the crater and drifted NW, W, and S. An explosion that day ejected incandescent material from the crater; blocks rolled down the flanks. On 22 October, a few explosions generated ash-and-steam plumes with little to no ash content that rose 4 km and drifted NW, E, and SE. Observations during an overflight revealed a small lava flow on the N flank and a larger flow with four branches on the S flank. Some of the base of the lava dome had been removed, and small spines were present, especially on the S side of the dome. Thermal images revealed that material in the crater was 400 degrees Celsius and the lava-flow fronts were 250 degrees Celsius. Cloudy weather prevented visual observations during 23-26 October. Roaring noises were heard on 25 October.
Source: Instituto Geofísico-Escuela Politécnica Nacional (IG-EPN)
The IG reported that field observations of Reventador on 16 and 17 September confirmed the presence of a lava flow on the S flank of the cone. Gas and steam emissions were noted, as was growth of the lava dome. Thermal anomalies over the crater area were detected in satellite imagery on 6, 11, and 13 October. On 14 October, seismicity increased and harmonic tremor was detected. A seismic station on the NE flank of the cone detected rockfalls. Several people living in the area reported roaring noises and observed slight incandescence from the crater during the previous few nights.
During an overflight on 16 October, scientists saw the lava dome and a lava flow on the N flank. Bluish gases were emitted. According to a thermal camera, the incandescent parts in the crater were about 300 degrees Celsius. Other observers heard roaring noises and sounds resembling "cannon shots." Incandescent blocks were ejected from the crater, and steam and gases rose 100 m and drifted SW. Incandescent material was seen on the S flank. On 17 October, incandescence on the S flank was seen and noises similar the previous day were again heard. A small gray plume was seen the next day. On 19 October, thermal anomalies were again detected on satellite imagery. During an overflight, blue gas plumes were seen. The lava flow on the S flank occupied a large area and was divided into two branches.
Source: Instituto Geofísico-Escuela Politécnica Nacional (IG-EPN)
Based on information from IG, the Washington VAAC reported that on 4 October an ash plume from Reventador drifted W. Ash was not seen in satellite imagery, although meteorological clouds were present. An occasional thermal anomaly was seen, however.
Source: Washington Volcanic Ash Advisory Center (VAAC)
Based on a pilot observation, the Washington VAAC reported that on 21 September a plume from Reventador rose to an altitude of 7.6 km (25,000 ft) a.s.l. Ash was not seen in satellite imagery, although meteorological clouds were present.
Source: Washington Volcanic Ash Advisory Center (VAAC)
The IG reported that seismic tremor from Reventador was sporadically detected during 21 July-3 August. On 4 August, seismicity increased and periods of tremor frequently saturated the seismic stations. Thermal anomalies detected in satellite imagery on 1 and 2 August became more intense on 4, 5, and 10 August. On 6 August, a steam plume rose 1.2 km above the crater and drifted W. Incandescent blocks were ejected from the crater and fell onto the flanks. Thermal images taken from a location 7 km E of Reventador revealed a linear area of higher temperatures, confirming the presence of a new lava flow on the S flank. Incandescence in the crater was seen during observations on 9 August. According to the Washington VAAC, IG reported that an ash plume rose to an altitude of 3.6 km (11,700 ft) a.s.l. and drifted NW on 15 August.
Sources: Washington Volcanic Ash Advisory Center (VAAC); Instituto Geofísico-Escuela Politécnica Nacional (IG-EPN)
Based on a pilot observation and a SIGMET notice, the Washington VAAC reported that on 26 May a diffuse ash plume from Reventador rose to an altitude of 6.4 km (21,000 ft) a.s.l. and drifted SW. Thermal anomalies were intermittently seen on satellite imagery. Gas plumes with some possible ash were noted later that day.
Source: Washington Volcanic Ash Advisory Center (VAAC)
The Washington VAAC reported that, although ash from Reventador was observed by IG on 15 May, an ash signature or a thermal anomaly was not detected in satellite imagery.
Source: Washington Volcanic Ash Advisory Center (VAAC)
Based on analysis of satellite imagery, the Washington VAAC reported that on 1 May a thermal anomaly over Reventador was noted along with a possible low-level plume drifting W. The IG reported to the VAAC lava and gas emissions, and possible smoke from burning vegetation, but little to no ash.
Source: Washington Volcanic Ash Advisory Center (VAAC)
The IG reported that seismicity from Reventador decreased to low levels on 26 March, after the seismic network had detected an earthquake swarm the same day. On 23 April, increased seismicity was characterized by long-period events interspersed with bands of spasmodic and harmonic tremor. Observers reported that steam plumes with low ash content rose to altitudes of 5.6-6.6 km (18,400-21,700 ft) a.s.l. and drifted W. Intense noises from the volcano were also reported. A thermal anomaly and a steam plume drifting 26 km WSW were detected on satellite imagery.
Source: Instituto Geofísico-Escuela Politécnica Nacional (IG-EPN)
The IG reported that seismicity from Reventador increased during 25-26 March. On 26 March, the seismic network detected an earthquake swarm consisting of long-period and hybrid events, interspersed with bands of harmonic tremor. Observers reported steam emissions with low ash content.
Source: Instituto Geofísico-Escuela Politécnica Nacional (IG-EPN)
Inclement weather prevented observations of Reventador during 19-23 November. A seismic station situated on the NE flank of the central cone recorded a high number of rockfall signals that presumably originated from the active lava-flow fronts.
Source: Instituto Geofísico-Escuela Politécnica Nacional (IG-EPN)
The IG reported that slight incandescence from Reventador's crater was seen at night during 11-12 November. Inclement weather prevented observations during 13-16 November. On 17 and 18 November, a seismic station situated on the NE flank of the central cone recorded a high number of rockfall signals that presumably originated from the active lava-flow fronts. Steam emissions rose from the crater.
Source: Instituto Geofísico-Escuela Politécnica Nacional (IG-EPN)
The IG reported that SOTE (Sistema de Oleoducto Transecuatoriano) personnel and residents near Reventador observed incandescence in the crater on 7 November. The reports were confirmed by the presence of thermal anomalies in satellite imagery. The next day, seismicity increased and a steam-and-ash plume rose to an approximate altitude of 5.6 km (18,400 ft) a.s.l. and drifted SW. Incandescent blocks were ejected from the inner crater to the S. Residents in El Chaco (about 35 km SE) and in the Quijos area heard strong explosions and saw steam plumes with low ash content. A pilot reported that a steam plume with little ash content at an altitude of 7.6 km (25,000 ft) a.s.l. drifted NW. On 9 November incandescent blocks were ejected 100 m into the air, and roaring and "cannon shot" sounds were reported. Strombolian activity and two lava flows that descended the N and S flanks of the central cone were observed using a permanent camera. Slight ashfall was noted in Cayambe, about 55 km WNW. A thermal anomaly was detected by satellite imagery on 9 and 10 November. On 10 November, seismicity considerably decreased and gas emissions continued. The lava flows continued to advance.
According to a news article, officials suspended flights into Quito airport due to ash plumes on 10 November for three hours as a preventative measure.
Sources: Washington Volcanic Ash Advisory Center (VAAC); Instituto Geofísico-Escuela Politécnica Nacional (IG-EPN); Associated Press
The IG reported that steam-and-gas from Reventador was emitted during 6-8 August. Incandescence from the crater was observed at night on 8 August.
Source: Instituto Geofísico-Escuela Politécnica Nacional (IG-EPN)
The IG reported that seismicity from Reventador decreased during 30-31 July. On 31 July, steam-and-gas plumes with a low ash content were detected on satellite imagery and drifted W and SW. On 1 August, steam-and-gas plumes were emitted and a lava flow in the caldera was active. Diffuse ash emissions were noted on 2 August. On 3 August, IG scientists observed the lava flow in the caldera and estimated that it advanced at a rate of 100 m per day. They also heard sporadic roaring noises. Gas-and-steam plumes were noted on 5 August.
Source: Instituto Geofísico-Escuela Politécnica Nacional (IG-EPN)
The IG reported that the number of earthquakes per day from Reventador increased during July and were the greatest on 24 and 25 July. At 1500 on 27 July, continuous seismic tremor was registered and was followed by observations of incandescence around the crater. Thermal anomalies were also identified on satellite imagery. At 1900 explosions produced ash plumes and ejected incandescent material that fell onto and rolled down the flanks. On 28 July, ash plumes drifted NW and W. Ashfall was reported in Olmedo, about 50 km NW. Later that day, ash plumes rose to altitudes of 4-6 km (13,100-19,700 ft) a.s.l. and drifted NW. On 29 July, steam plumes rose from the crater and drifted NW. A sulfur smell was reported at areas around the volcano. A lava flow traveled S.
Source: Instituto Geofísico-Escuela Politécnica Nacional (IG-EPN)
Based on information from the Guayaquil MWO, the Washington VAAC reported that an eruption from Reventador on 11 October produced an ash plume that rose to an altitude of 4.6 km (15,000 ft) a.s.l. and drifted S. Ash was not observed on satellite imagery due to cloud cover.
Source: Washington Volcanic Ash Advisory Center (VAAC)
Based on seismic interpretation, IG reported that lahars occurred on the flanks of Reventador on 20, 21, and 23 June. Clouds inhibited visual observations during 20-24 June.
Source: Instituto Geofísico-Escuela Politécnica Nacional (IG-EPN)
Based on seismic interpretation, IG reported that lahars occurred on the flanks of Reventador on 15 and 19 June. According to the Washington VAAC, the IG reported that activity on 18 June possibly produced ash plumes that drifted NW. Ash was not visible on satellite imagery.
Sources: Washington Volcanic Ash Advisory Center (VAAC); Instituto Geofísico-Escuela Politécnica Nacional (IG-EPN)
Based on information from IG, the Washington VAAC reported that an ash plume from Reventador rose to an altitude of 3.7 km (12,000 ft) a.s.l. on 18 May and drifted NW. Ash was not observed on satellite imagery.
Source: Washington Volcanic Ash Advisory Center (VAAC)
On 16 May, IG reported that a steam plume from Reventador rose to an altitude of 3.6 km (11,900 ft) a.s.l. and drifted to the NW. The plume was visible on satellite imagery. On 18 May, strong rains resulted in a lahar that lasted approximately 40 minutes. A lahar was also noted on 22 May. Visual observations were hindered during most of the reporting period due to inclement weather.
Source: Instituto Geofísico-Escuela Politécnica Nacional (IG-EPN)
On 27 April, a steam plume from Reventador rose to an altitude of 3.7 km (12,000 ft) a.s.l. Later that night, incandescent material was ejected from the crater. On 30 April, a steam plume was observed on satellite imagery drifting NW. Based on the Guayaquil MWO and satellite imagery, the Washington VAAC reported that an ash plume rose to an altitude of 3.7 km (12,000 ft) and drifted NW. Visual observations were hindered during 25 April-1 May due to inclement weather.
Sources: Washington Volcanic Ash Advisory Center (VAAC); Instituto Geofísico-Escuela Politécnica Nacional (IG-EPN)
On 18, 20, and 23 April, steam-and-gas emissions from Reventador hung near the summit. On 18 April, a plume was seen drifting NW on satellite imagery. On 20 April, a bluish haze of gases was observed. Clouds occasionally inhibited views of the summit during 18-24 April.
Source: Instituto Geofísico-Escuela Politécnica Nacional (IG-EPN)
On 11 April, a steam plume from Reventador rose to an altitude of 3.8 km (12,500 ft) a.s.l. Visual observations were hindered during 12-17 April due to inclement weather. On 13 April, the lava flow on the S flank, first observed on 28 March, was 15 m thick and possibly active.
Source: Instituto Geofísico-Escuela Politécnica Nacional (IG-EPN)
Incandescent blocks ejected from the summit of Reventador that subsequently rolled down the S flanks were observed at night during 3-4 April. Satellite imagery revealed ash plumes drifting W and a large thermal anomaly over the crater. On 4 April, a plume rose to an altitude of 4.6 km (15,100 ft) a.s.l. Crater incandescence was observed on 4 and 6 April and "cannon shots" were heard on 6 April. Ash-and-steam emissions were observed during 8-9 April. Steam emissions from the flanks on 8 April possibly originated from a lava flow.
Source: Instituto Geofísico-Escuela Politécnica Nacional (IG-EPN)
On 28 March, observers reported roaring noises and an ash column from Reventador that rose to an altitude of 5.6 km (18,400 ft) a.s.l. and drifted W. A small lava flow traveled 200 m down the S flank. Incandescent material and ash emissions were observed during 29-31 March. On 1 April, ash plumes rose to an altitude of 7.6 km (24,900 ft) a.s.l. and incandescent rocks were ejected about 50 m above the crater. Incandescent material was again seen at the summit on 2 April. The Washington VAAC reported that a strong hotspot was present on satellite imagery during 1-3 April. Based on pilot reports, IG reported that a steam-and-gas plume with little ash content rose to an altitude of 6.1 km (20,000 ft) a.s.l. and drifted W on 3 April.
Sources: Washington Volcanic Ash Advisory Center (VAAC); Instituto Geofísico-Escuela Politécnica Nacional (IG-EPN)
IG reported that during early March, the number of tectonic earthquakes from Reventador increased. Steam-and-ash plumes were sporadically visible and rose to altitudes of 4 km (13,000 ft) a.s.l. occasionally during 8-22 March. On 21 March, noises were reported. The next day, seismic signals changed and indicated possible emissions. On 24 March, local people saw ash plumes and incandescent material near the crater and heard roaring noises. An explosion produced a plume that rose to an altitude of 6.6 km (21,700 ft) a.s.l. and drifted W. Based on reports from IG, the Washington VAAC reported an ash plume to altitudes of 3.7-7 km (12,000-23,000 ft) a.s.l. that drifted NE and WNW during 26-27 March. A thermal anomaly was present on satellite imagery during 24-27 March.
Sources: Washington Volcanic Ash Advisory Center (VAAC); Instituto Geofísico-Escuela Politécnica Nacional (IG-EPN)
IG reported that during 19-25 December, seismicity was at low levels at Reventador and several small explosions occurred. According to the Washington VAAC, satellite imagery showed an ash plume at a height around 7.6 km (25,000 ft) a.s.l. extending NW on 29 December.
Sources: Washington Volcanic Ash Advisory Center (VAAC); Instituto Geofísico-Escuela Politécnica Nacional (IG-EPN)
During 7-13 November, the number of earthquakes at Reventador increased slightly in comparison to the previous week. Small explosions produced ash plumes that rose to a height of ~4.6 km (15,000 ft) a.s.l.
Sources: Washington Volcanic Ash Advisory Center (VAAC); Instituto Geofísico-Escuela Politécnica Nacional (IG-EPN)
During 31 October to 6 November, seismicity was at low levels at Reventador and several small explosions occurred. Based on information from IG, the Washington VAAC reported that ash from an explosion on 12 November rose to a height of ~3.7 km (12,000 ft) a.s.l.
Sources: Washington Volcanic Ash Advisory Center (VAAC); Instituto Geofísico-Escuela Politécnica Nacional (IG-EPN)
During 19-25 September, several small explosions occurred at Reventador. An explosion on 20 September produced an ash plume to a height of ~5.8 m (19,000 ft) a.s.l. Small amounts of ash fell in the towns of El Chaco, San Francisco de Borja, and Baeza. During the report week, there was a reduction in the number of earthquakes at the volcano.
Source: Instituto Geofísico-Escuela Politécnica Nacional (IG-EPN)
During 21-27 September, there were intermittent emissions of ash from Reventador, with the highest rising plumes reaching ~8.5 km (28,000 ft) a.s.l. on 24 September. Hot spots were occasionally visible on satellite imagery during the report week.
Source: Washington Volcanic Ash Advisory Center (VAAC)
On 1 and 2 September, lahars traveled down Reventador's flanks. During 5-11 September, there was a substantial decrease in seismicity at Reventador, except for tremor, in comparison to the previous week. Pilots reported ash clouds on 13 and 15 September at a height of ~7 km (23,000 ft) a.s.l. No ash was visible on satellite imagery.
Sources: Washington Volcanic Ash Advisory Center (VAAC); Instituto Geofísico-Escuela Politécnica Nacional (IG-EPN)
During 22-28 August, there was a decrease in activity at Reventador in comparison to the previous week. Seismicity and gas emissions decreased at the volcano, and no surficial changes were observed. On 1 September a pilot reported an ash cloud to the Washington VAAC, but no ash was visible on satellite imagery.
Sources: Washington Volcanic Ash Advisory Center (VAAC); Instituto Geofísico-Escuela Politécnica Nacional (IG-EPN)
Volcanic activity continued at Reventador during 18-21 August, with ash plumes rising to a maximum height of ~5.8 km (19,000 ft) a.s.l. on 18 August. A hotspot was occasionally visible on satellite imagery during the report period.
Source: Washington Volcanic Ash Advisory Center (VAAC)
A pilot observed ash from Reventador on 11 August at 1150 at heights between 3.7 km and 6.4 km (12,000 and 21,000 ft.) a.s.l. IG reported that on 13 August a narrow plume of ash was visible drifting W.
Source: Washington Volcanic Ash Advisory Center (VAAC)
Based on information from IG, the Washington VAAC reported a possible ash cloud over the volcano at 1818 on 4 August. No ash was detected in satellite imagery through 1815 due to cloud cover.
Sources: Washington Volcanic Ash Advisory Center (VAAC); Instituto Geofísico-Escuela Politécnica Nacional (IG-EPN)
Ash emissions occurred at Reventador during 27 July to 2 August, with plumes rising to 5.2 km (~17,000 ft) a.s.l.
Source: Washington Volcanic Ash Advisory Center (VAAC)
During 7-17 July, scientists noted that a lava flow (lava number 5) was no longer flowing in a direction that threatened a highway or pipe lines. In addition, plumes of steam, gas, and ash rose to heights of 0.5-2 km above the crater (13,300-18,200 ft a.s.l.) and typically drifted NW.
Source: Instituto Geofísico-Escuela Politécnica Nacional (IG-EPN)
Based on information from IG, the Washington VAAC reported that an ash eruption at Reventador on 18 July at 1115 produced a plume to ~3.7 km (~12,100 ft) a.s.l. Ash was not visible on satellite imagery.
Source: Washington Volcanic Ash Advisory Center (VAAC)
As of 6 July, harmonic tremor, occasional explosions, and long-period and volcano-tectonic earthquakes continued at Reventador. Strong Strombolian fountaining was observed during the evening and one of the lobes of a lava flow (Lava number 5) was advancing down the caldera wall following the Río Marker. The flow abruptly slowed to ~20 m/day in comparison to flow-front velocities of ~70 m/day during 19-23 June, and ~50 m/day during 23-30 June. Lava number 5 was ~1.2 km from a steep incline, where it could begin to rapidly descend to the alluvial fan where the highway and petroleum pipeline are located.
Based on information from IG, the Washington VAAC reported that an ash plume extended N of the volcano's summit on 11 July. No ash was visible on satellite imagery.
Sources: Washington Volcanic Ash Advisory Center (VAAC); Instituto Geofísico-Escuela Politécnica Nacional (IG-EPN)
During 30 June to 5 July, gas-and-ash emissions continued at Reventador. Plumes rose to a maximum height of 7 km (23,000 ft) a.s.l.
Sources: Washington Volcanic Ash Advisory Center (VAAC); Instituto Geofísico-Escuela Politécnica Nacional (IG-EPN)
On 24 June the Geophysical Institute observed ash over the volcano moving NW. No ash or hot spot activity was visible in satellite data, but detection may have been hindered by low-level weather clouds.
Sources: Washington Volcanic Ash Advisory Center (VAAC); Instituto Geofísico-Escuela Politécnica Nacional (IG-EPN)
According to IG, during 11-12 June lobes of a lava flow traveled down Reventador's S and SE flanks. A lava flow that was traveling SE earlier in June had ceased to move. Plumes of gas-and-ash rose 1-2 km above the volcano's crater and typically drifted NW. The Washington VAAC reported that low-level gas-and-ash emissions continued during 15-21 June.
Sources: Washington Volcanic Ash Advisory Center (VAAC); Instituto Geofísico-Escuela Politécnica Nacional (IG-EPN)
During the last week of May, there was an increase in the number of long-period earthquakes at Reventador associated with a new lava flow. A lava flow emitted previously continued to travel SE towards the Marquer and Montana rivers. During 2-3 June, incandescence was visible in the crater. On 6 June ash-and-gas plumes were emitted from the volcano.
Source: Washington Volcanic Ash Advisory Center (VAAC)
On 4 June, a hotspot and a steam-and-gas plume extending NW of Reventador were visible on satellite imagery. The plume was below 6.1 km (20,000 ft) a.s.l.
Source: Washington Volcanic Ash Advisory Center (VAAC)
Based on information from IG, the Washington VAAC reported that an eruption at Reventador on 19 May around 0900 produced a NW-drifting ash plume to 3.7-4.9 km (12,000-16,000 ft) a.s.l. Ash was not visible on satellite imagery due to meteorological clouds near the volcano.
Source: Washington Volcanic Ash Advisory Center (VAAC)
Based on a pilot report to the Guayaquil MWO, the Washington VAAC reported that ash from Reventador was seen on 25 April around 0826 at a height of ~7.9 km (~26,000 ft) a.s.l. drifting S. Ash was not visible on satellite imagery.
Source: Washington Volcanic Ash Advisory Center (VAAC)
A change in seismic behavior was noted at Reventador during 1-8 April that was marked by episodes of tremor. About 45 tremor episodes occurred regularly during the week. During the evening of 6 April, incandescence was visible at the volcano. Based on information from IG, the Washington VAAC reported that ash from Reventador was visible on 8 April around 1430 at a height of ~4.6 km (15,000 ft a.s.l.). Ash was not visible on satellite imagery.
Sources: Washington Volcanic Ash Advisory Center (VAAC); Instituto Geofísico-Escuela Politécnica Nacional (IG-EPN)
On 14 January at 0700, the Washington VAAC reported that an ash plume was observed at Reventador. The plume rose to a height of ~4.5 km a.s.l. On 16 January at 0430, satellite imagery indicated a brief emission of steam and very light ash that rose to ~6 km a.s.l. and moved E.
Source: Washington Volcanic Ash Advisory Center (VAAC)
During 19-26 December, seismic signals at Reventador revealed that lava emission that began in early November continued. Seismic signals also suggested that mudflows occurred on 17 and 19 December.
Source: Instituto Geofísico-Escuela Politécnica Nacional (IG-EPN)
On 16 December, a block lava flow from Reventador extended more than 1.5 km from the 2002 crater through a breach in the S portion of the crater wall. The flow front was ~600 m below the central vent and extended to the ESE. Lava extrusion from a vent in the crater likely began in early November, accompanied by a dramatic increase in volcano-tectonic earthquakes.
Source: Instituto Geofísico-Escuela Politécnica Nacional (IG-EPN)
According to the Washington VAAC, satellite imagery on 2 December showed an ash plume from Reventador at a height of ~5 km extending W of the volcano. Also, IG reported to the VAAC that ash was seen drifting NW on 4 December. A hot spot was visible on infrared satellite imagery. On 4 December, Strombolian activity was seen in Reventador's crater. Since 9 November, volcanic material continued to gradually fill the crater and generate a lava flow down one flank. Activity was accompanied by a gas column that reached a maximum height of 3 km.
Sources: Washington Volcanic Ash Advisory Center (VAAC); Instituto Geofísico-Escuela Politécnica Nacional (IG-EPN)
Strong rain on 15 May caused several lahars to travel down Reventador's flanks. They persisted through 16 May.
Source: Instituto Geofísico-Escuela Politécnica Nacional (IG-EPN)
During 3-9 May, the level of seismicity at Reventador did not change significantly. During 7-8 May, lahars traveled down Reventador's flanks, disrupting travel on the Chaco-Lumbaquí road for about a day.
Source: Instituto Geofísico-Escuela Politécnica Nacional (IG-EPN)
During 16-22 February, the average number of long-period earthquakes (4.1) and volcano-tectonic earthquakes (17) at Reventador nearly doubled in comparison to the previous week. Satellite imagery on 21 February showed a plume from Reventador drifting NNE.
Source: Instituto Geofísico-Escuela Politécnica Nacional (IG-EPN)
Many unconsolidated deposits remain on Reventador's flanks following its sudden eruption on 3 November 2002, and strong rain fell there during 7 and 9 November 2003. During those days seismometers recorded signals interpreted as lahars. In addition, after these signals diminished, the seismometers detected the more subtle signals of tremor. Multiple volcanic earthquakes per day also occurred.
Source: Instituto Geofísico-Escuela Politécnica Nacional (IG-EPN)
During 13-19 October at Reventador, 77 volcano-tectonic and 17 long-period earthquakes were recorded, averaging eleven and two earthquakes per day, respectively. Lahars were reported on 13, 14, and 19 October. The lahar on 13 October was the largest of the week, lasting ~75 minutes.
Source: Instituto Geofísico-Escuela Politécnica Nacional (IG-EPN)
Rainfall at Reventador during 7-13 July remobilized ash on the volcano's flanks, causing lahars down Montana River. Travel on the Baeza highway was interrupted. Permanent tremor associated with degassing was recorded.
Source: Instituto Geofísico-Escuela Politécnica Nacional (IG-EPN)
Heavy rainfall (200 mm in less than 24 hours) at Reventador on 6 May led to the remobilization of ash that was deposited on the volcano's flanks during the November 2002 eruption. Lahars traveled down the volcano's SE flank via Marker and Reventador gorges. According to IG, seismic signals indicated that lahars occurred in seven main pulses, with the longest pulse lasting ~2 hours. Lahars crushed a portion of the sole petroleum pipeline in Ecuador, located on the volcano's SE flank, and dragged it 22 m. According to news reports, about 5,600 barrels of crude oil escaped the damaged pipeline and entered Reventador River. News reports also stated that a large area of the Amazon jungle was polluted. Lahars also destroyed a bridge and blocked a highway that crosses the Amazon.
Sources: Instituto Geofísico-Escuela Politécnica Nacional (IG-EPN); El Comercio; Reuters; IRIB News
During 1-7 March, lahars continued to travel down Reventador's flanks as they had for several weeks. On 2 March lahars descended Marker Gorge, disrupting travel in the area. On the 3rd lahars traveled down Marker and Reventador gorges. Flooding occurred on the 4th. During the report period, seismicity and gas emissions remained at low levels, and there was no indication of increased volcanism.
Source: Instituto Geofísico-Escuela Politécnica Nacional (IG-EPN)
Heavy rain fall at Reventador caused lahars to flow down Márker gorge on 23 February, affecting travel in the area. On the 24th, lahars traveled mainly down Márker and Reventador gorges. On the 28th, rain caused small lahars in Márker, Reventador, and Montana gorges. During 22-28 February, seismicity remained at low levels, only small amounts of steam were emitted from the volcano, and there was no indication of increased volcanism.
Source: Instituto Geofísico-Escuela Politécnica Nacional (IG-EPN)
During 20-21 February, heavy rain mixed with fine volcanic material on Reventador's flanks, generating mudflows that traveled down the Montana River. The mud flows obstructed travel on a highway. During 15-21 February, seismic activity remained at low levels and there was no indication of increased volcanism. IG stated that since the rainy season is beginning near Reventador, residents must be aware of the danger of possible mudflows.
Source: Instituto Geofísico-Escuela Politécnica Nacional (IG-EPN)
During 10-14 January, volcanic and seismic activity were relatively low at Reventador. On the 10th several lahars traveled down the Marquer and Reventador rivers. Lava flows continued to slowly advance and steam plumes were seen rising above the volcano.
Source: Instituto Geofísico-Escuela Politécnica Nacional (IG-EPN)
During 18-23 December, volcanic and seismic activity were low at Reventador. Seismicity was characterized by low-frequency tremor. No new activity was recorded at the volcano.
Sources: Washington Volcanic Ash Advisory Center (VAAC); Instituto Geofísico-Escuela Politécnica Nacional (IG-EPN)
During 12-15 December, volcanic and seismic activity was low at Reventador; however, weather clouds thwarted visual observations.
Sources: Instituto Geofísico-Escuela Politécnica Nacional (IG-EPN); Washington Volcanic Ash Advisory Center (VAAC)
Low-level seismicity continued at Reventador through 8 December. White emission columns were observed on the afternoon of 3 December, but meteorological clouds prevented observations during most of the week. White steam-and-gas emissions were seen again on 7 December rising about 500 m above the summit. There were no reports of lahars.
Sources: Instituto Geofísico-Escuela Politécnica Nacional (IG-EPN); Washington Volcanic Ash Advisory Center (VAAC)
During 26 November- 1 December, Reventador mainly emitted gas and steam and occasionally small amounts of ash, and seismicity was low. IG stressed to the public that the sulfuric odor in the city of Quito was not indicative of renewed volcanism. During a flight over the volcano on 27 November, IG scientists determined that reports of a second lava flow made the previous week were false; rather, a pyroclastic flow had descended the volcano's NE flank. They also confirmed that a lava flow on the volcano's E flank had been emitted from a small crater that opened ~600 m below the volcano's summit. They believe it began to flow on 24 November and was accompanied by the emission of ash and incandescent rocks. On 2 December incandescence was visible on the E flank of the cone, which was thought to be from a new pulse of lava emitted from the 24 November flow the night of 1 December. On 2 December mudflows traveled down the Montana River, causing problems at a highway.
Sources: Washington Volcanic Ash Advisory Center (VAAC); Instituto Geofísico-Escuela Politécnica Nacional (IG-EPN)
IG reported that during 20-25 November seismicity decreased at Reventador in comparison to the previous week and mostly gas-and-steam emissions occurred with little ash content. On 20 and 21 November 16 earthquakes were recorded each day, whereas about 150 earthquakes were recorded on each of the previous days. At this time gas-and-steam plumes reached to 2 km above the volcano and incandescence was sometimes visible within the crater. Lahars traveled down the volcano's flanks into Montana and Marker gorges. There were many reports of a strong scent of sulfur in the city of Quito, caused by the large amount of SO2 being emitted from Reventador (15,000-29,000 tons of SO2 measured by satellite on the 21st). Eruptions on 24 and 25 November produced ash-and-gas clouds that rose ~1 km above the volcano.
Sources: Washington Volcanic Ash Advisory Center (VAAC); Instituto Geofísico-Escuela Politécnica Nacional (IG-EPN)
During 12-16 November, seismic and volcanic activity continued at Reventador. Constant tremor, and hybrid and volcanotectonic earthquakes were recorded. On 12 November a column of steam and ash was seen rising 6-7 km above the volcano and drifting to the W. There was only a moderate amount of ash in the cloud, therefore there was not much ashfall. Mudflows traveled down Reventador's flanks and during several evenings incandescence was visible on the NE flank. During a flight over the volcano on the 18th, a lava flow was seen on the crater's S wall advancing slowly. Also, pyroclastic-flow deposits were seen that IG warned may be remobilized during heavy rain, becoming dangerous mud flows.
Sources: Washington Volcanic Ash Advisory Center (VAAC); Instituto Geofísico-Escuela Politécnica Nacional (IG-EPN)
Volcanic activity decreased following the large eruption at Reventador on 3 November, but small-to-moderate eruptions continued during 5-12 November. IG reported that on the 5th, explosions produced SW-drifting ash-and-gas clouds to heights between 3 and 6 km. Ash fell in the town of Chaco. On the 7th an eruption sent an ash-and-gas cloud to 7 km that drifted W. Rain during the evening of the 9th caused mudflows to travel down the volcano's flanks, closing the Chaco-Reventador highway. According to the Washington VAAC, the maximum height reached by ash clouds during the report period was ~10 km a.s.l. On 10 November the Quito airport was reopened, after being closed for a week. Ash from previous eruptions descended on Quito on 11 November, causing officials to close schools and warn residents to protect themselves from inhaling ash.
Sources: Washington Volcanic Ash Advisory Center (VAAC); Instituto Geofísico-Escuela Politécnica Nacional (IG-EPN); Associated Press; Reuters; Reuters
After 26 years with no explosive activity, a large eruption began at Reventador on 3 November that sent pyroclastic flows down the volcano's flanks. Based on seismic data and observations made by people near Reventador, IG reported that the first pyroclastic flows produced from the eruption occurred on the 3rd around 0900. Then, during 1000-1900 continuous tremor was recorded that may have been associated with continuous ash emissions and small explosions. Between 2000 on the 3rd and 0100 on the 4th, there was an increase in the amount and intensity of the tremor. After 0100 the activity level decreased, but a pulse of activity occurred between 0200 and 0300. A new cycle of activity began during 0700-0800. Small-to-moderate explosions occurred during the day and small pyroclastic flows descended the volcano's flanks. On the morning of the 5th explosive sounds were not heard, no ash fell in towns near the volcano, and meteorological clouds obscured Reventador. In addition, seismicity was low, but some small earthquakes and low-amplitude volcanic tremor occurred.
According to the Washington VAAC, the first eruption on 3 November produced an ash cloud that reached a height of ~16.8 km a.s.l. Subsequent explosions generated more ash clouds and satellite imagery showed discrete ash clouds on the 5th; a thin area of ash at ~16.8 km a.s.l. was located over S Colombia and N Brazil moving E, and a thicker ash cloud drifted W over the Pacific Ocean towards the Galapagos Islands at a height of ~10.7 km. In addition, a nearly stationary area of ash was observed over the Pacific Ocean off the coast of Ecuador at a height of ~9.1 km a.s.l.
According to OCHA, pyroclastic flows on the 3rd reached the Baeza-Lumbaqui highway, blocking inter-city traffic. Ash fell in the towns of Baeza, Cayambe, Yaruqui, El Quinche, Tumbaco, Pifo, Sangoqui, and Quito, Ecuador's capital ~70 km W of Reventador. Quito was paralyzed by ash fall; schools and businesses were closed, residents were told to remain indoors, and all operations at the Mariscal Sucre airport in Quito were suspended. The approximately 3,000 people living in towns at the base of the volcano were evacuated and no deaths or injuries were attributed to volcanic activity.
Sources: Instituto Geofísico-Escuela Politécnica Nacional (IG-EPN); El Comercio; UN Office for the Coordination of Humanitarian Affairs (OCHA); Washington Volcanic Ash Advisory Center (VAAC); El Universo
Reports are organized chronologically and indexed below by Month/Year (Publication Volume:Number), and include a one-line summary. Click on the index link or scroll down to read the reports.
Mid-December 1973 eruption from cone in SW corner of caldera
Card 1774 (11 January 1974) Mid-December 1973 eruption from cone in SW corner of caldera
Minard Hall reported the following by cable. "Visited Reventador on 15 December 1973 for one hour. Cone (1,000 feet high) in SW corner of caldera in eruption. Vapor plume, 1 km long, heads SW. Considerable noise from crater, no explosions, no material being ejected. Small lava lake in crater. Narrow lava flow 1.5 km long leaves lake, flows due E down cone and out onto plain. Flow began November 1973 and is in motion. It is a blocky flow of olivine-rich basaltic andesite. The flow is dark black in color, but grey on sides due to fresh exposure of new material by avalanching. Flow steadily heading E for main road, oil pip line, and Rio Coca. To N, extensive mud flow (3 km long, 1 km wide), grey in color, flowed NE. Black basalt flow of July 1972 lies immediately N of lahar, flowed NE from cone. N side of cone: grey and black blocky flows up to 5 km long. W side: grey blocky flows one-half km long abut against caldera wall. S side: same as W side. SE side: old overgrown flows, green in color. From border of caldera outward, dense green jungle. Area of recent activity, and not overgrown by jungle, approximately 4 km in diameter. Plan expedition for longer stay in February 1974."
Information Contacts: Minard Hall, Escuela Politécnica Nacional, Quito.
Explosive activity every 20-30 minutes in late February
Card 1813 (12 March 1974) Explosive activity every 20-30 minutes in late February
The volcano El Reventador is a 1,500-m-high composite cone that is growing in the calder of the older El Reventador. After many years of only fumarolic activity, major flows of lava occurred in June-August 1972 that had a volume of approximately six million cubic meters. The volcano remained relatively inactive until November 1973 when a smaller flow left that crater and traveled on e and one-half kilometers to the southeast. Numerous laharic flows related to this activity have carried boulders up to five meters in length up to three kilometers from the cone.
Six days (23-28 February 1974) were recently spent on the volcano studyng the present activity. The blocky lava flow of November 1973 has backed off the flanks and remains still active halfway up the cone. The explosive nature of the volcano has increased dramatically. When visibility permitted, explosive activity was recorded every 20-30 minutes. It was accompanied by loud explosions that, at times, shook our campsite 3 km distant, by red flashes from the crater, by gray-brown eruption clouds that rose a kilometer above the crater, and by incandescent red ejecta (often blocks up to 5 m in diameter) that rolled down the sides of the cone. This explosive activity was not observed in December 1973 and marks an important change in the nature of the activity. Inaccessibility and poor weather condition preclude frequent monitoring of this volcano.
Information Contacts: Minard Hall, Escuela Politécnica Nacional, Quito.
Explosive eruption begins on 4 January; lava flows enter the jungle
An explosive eruption began during the early morning of 4 January. At dawn an ash column 1 km high was observed. Fine ash was carried W and SW over the Andes, dusting Quito through 10 January. Bombs blown 100 m vertically from the crater were large enough to be seen by the naked eye from a distance of 3 km. Strange seismic signatures, detected 90 km away (at Quito) and attributed to Reventador, began at 0115 on 4 January and continued until 0900 on 9 January. A portable seismograph 10 km from the cone measured continuous harmonic tremor.
Two lava flows descended from the breached crater and divided into three lobes at the base of the cone. During the first 40 hours flows traveled approximately 1.5 km E at 37 m/hour. By 9 January the three lobes had traveled 2.5 km and were advancing approximately 5 m/hour over lahar deposits and jungle. As of 27 January the lava flows had stopped, but infrequent explosive activity, including nuées ardentes, was continuing. The continual ash column had terminated by 25 January. The flows were a black basaltic andesite with olivine, augite, hypersthene, and oxyhornblende.
Reventador had similar eruptions in July 1972 and November 1973. When last visited before the current eruption, on 10 December 1975, it was producing a large steam column.
Further Reference. Hall, M.L., 1980, El Reventador, Ecuador: un volcán activo de los Andes Septentrionales: Revista Politécnica, v. 5, no. 2, p. 123-136.
Information Contacts: M. Hall, Escuela Politécnica, Quito.
Low-temperature fumarolic activity
Abundant small fumaroles were observed 17-19 August, within the crater and in concentric cracks near the rim. These fumaroles emitted little gas and were fairly quiet. Fumarole temperatures, measured using infrared thermometry, reached 71.0°C (figure 1).
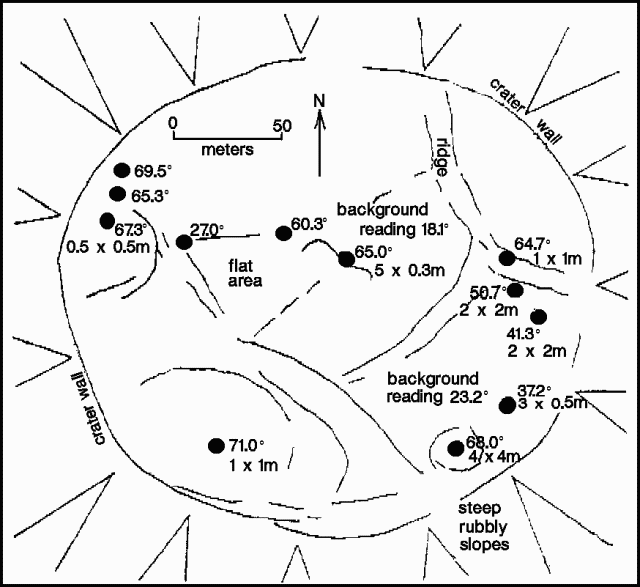 |
Figure 1. Sketch map of the crater of Reventador showing fumarole locations (solid circles), sizes, and temperatures, August 1990. Courtesy of Sean Hodges. |
Information Contacts: S. Hodges, Univ of Oxford. The Oxford field team also included J. Bass, S. Crampton, J. Dinares, S. Hart, R. Hartley, C. Mandeville, M. More, K. Ogden, J. Scarrow, and A. Whittingham.
Strong, sudden 3 November eruption; 8-km-long pyroclastic flow
After a 26 year repose without signs of unusual activity, Reventador burst unexpectedly into a VEI 4 eruption on 3 November 2002. Seismometers, including some located 15 and 24 km away, only began to detect anomalous seismicity 4 hours prior to the eruption's visual confirmation. A preliminary evaluation implies that this was one of Ecuador's most powerful eruptions of the past 100 years.
A vertical aerial photograph of Reventador's edifice taken in 1983 (figure 2) has been annotated by Minard (Pete) Hall to show the age and distribution of lava flows. During the 2002 eruption onlookers took a series of photos; a side view captured at an early stage appears in figure 3.
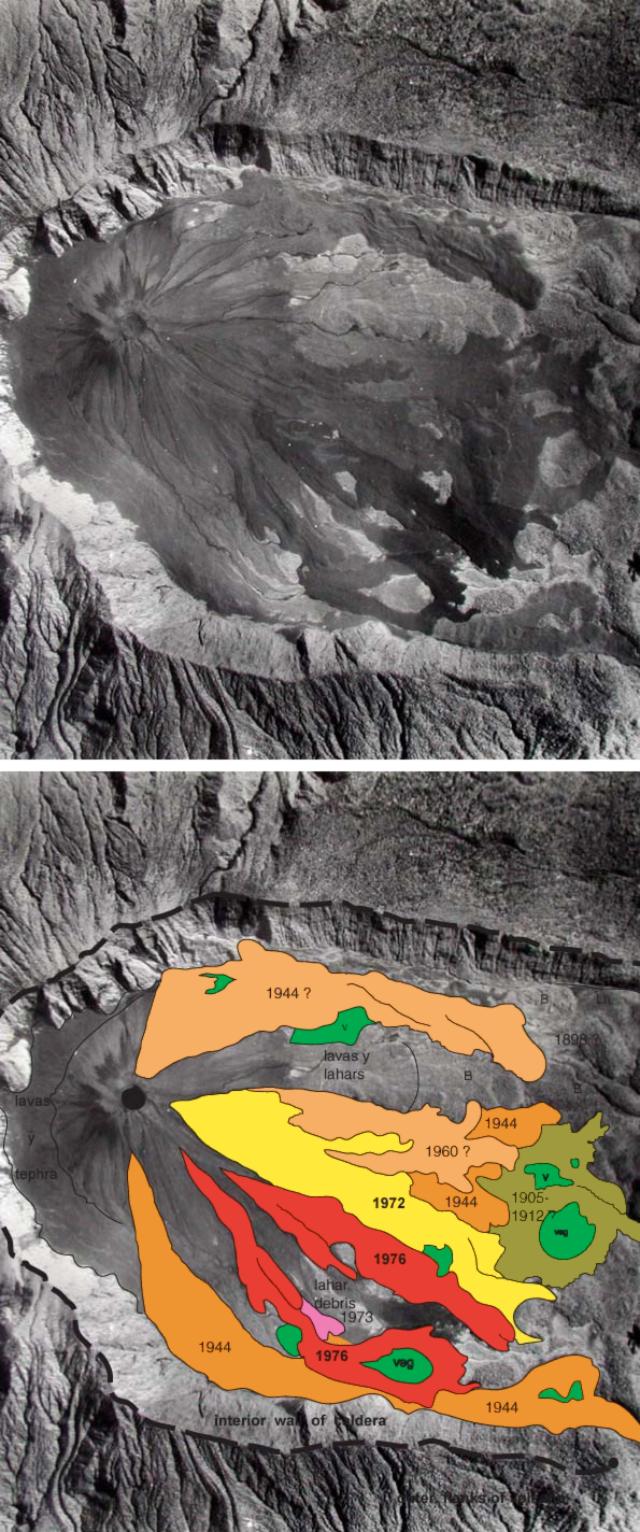 |
Figure 2. Aerial photo of Reventador caldera taken in 1983. Top of photo lies to the N; the walls of the E-breached caldera are 3-4 km apart. The bottom image is the same photo with map overlays of lava flows and key features. Although cut off in this cropped figure, the caldera's W wall is intact. Courtesy of Instituto Geografico Militar de Quito and Instituto Geofisico, Escuela Politecnica Nacional, Quito, Ecuador (IG). |
The following tentative chronology of the eruption is based upon IG seismic and NOAA data, as well as eyewitness accounts and photos. The chronology of the events on 3 November is detailed in table 1. At press time editors were unable to learn the latest details regarding timing but these will appear in a subsequent report.
Table 1. Chronology of events that took place at Reventador on 3 November 2002. Courtesy IG and NOAA.
| Time | Activity |
| 0300 | Beginning of seismic swarm of 100 events, most of a hybrid tendency characterized by frequencies of 1.8 to 4.2 Hz and seismic tremor of low frequency (0.7-1.0 Hz). Workers at base camp located 8 km from cone were awakened by earthquakes. |
| 0530 | At daylight workers reported a steam column 2-3 km high above cone. |
| 0715 | Pilots from TAME Airline reported ash plume in the direction of Reventador. |
| 0715-0745 | NOAA GOES images first show eruption cloud. |
| 0745 | Witnesses reported increased intensity of eruptive column, now reaching ~6 km above the cone and drifting to the SW. |
| 0803 | Photos show that eruption column had reached 7,300 m above cone and suggest small pyroclastic flows. Successive explosions and a constant roar were heard at 8 km distance, but not at closest town at 15 km distance. |
| 0815 | GOES images show eruption cloud beginning to travel to SW. |
| 0912 | Main eruption begins. Column soon rises to 16-17 km above cone. |
| 1415 and 1615-1715 | Other important pulses of the eruption. |
| 1300 approx. | Ash cloud reaches InterAndean Valley and Quito, ~100 km from the volcano, causing almost total obscurity by late afternoon. It left a layer up to 3-5 mm thick of fine gray ash everywhere. Some closer towns received up to 3 cm of ash. Most residents of the region complained about the strong odor of both SO2 and H2S. |
| 2005 | Another intensification of eruptive activity (which continued until 0100 on 4 November). |
On 6 October 2002 a M 4.1 seismic event occurred beneath the volcano, accompanied by nine smaller VT events; the tentative epicenter was slightly SW and W of the cone. Around 20 October a local guide with tourists reached the top of the cone and saw only normal fumarolic activity. No anomalous activity was detected by satellite monitoring during this period.
Table 1 summarizes seismic, visual, and satellite observations of the initial eruptions on 3 November that led to the main eruption's starting at 0912. In that energetic phase a column rose 16-17 km above the intracaldera cone. At least five significant pyroclastic flows (PFs) were produced. A photo sequence showed PFs descending SE along the southern caldera floor and obliquely overriding the 200-400-m-high southern caldera rim (figure 3).
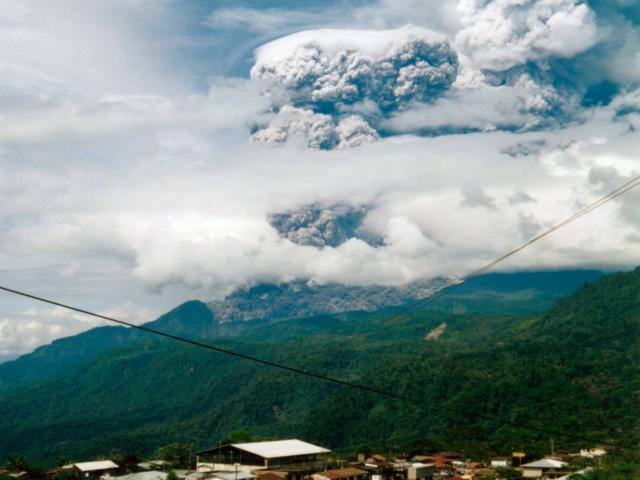 |
Figure 3. A photo showing the young intracaldera cone and main eruption column (on right) of Reventador at 0912 (local time) on 3 November 2002. The view is looking SW from the town of Reventador, 14 km to the volcano's NE. The shot captured a pyroclastic flow traveling along the S side of the caldera floor and overtopping the caldera rim; a topographic boundary 200-400 m high. Note the expansive ash cloud above the pyroclastic flow. Photo taken by R. Saca; provided courtesy IG. |
The longest PF traveled 8 km; it flowed out of the breached caldera and down steep slopes to reach the Quijos river. In doing so, it crossed important oil and gas pipelines, pushing them ~20 m downslope without inducing failure. It destroyed an oil pipeline still under construction, and carried away small bridges on the main dirt highway leading to the oilfields. The PF buried one small house and 20 head of cattle. No casualties were reported.
Two segments of the ash column took different paths. The segment of the column that rose up to 16 km high blew to the SW and WSW toward Quito and the populated InterAndean Valley, traveling at 30-45 km/hour. The ash cloud above 16 km moved E and reached southern Colombia and northwestern Brazil. J.L. LePennec (IRD) estimated that ~282 x 106 m3 of pyroclastic material was erupted.
This eruptive event largely destroyed the old summit crater in the intracaldera cone. It was left with two deep notches in its uppermost NNW and SSW sides. These notches apparently served as the source of both the PFs and lava flow number 1. An eyewitness observed rock ejection during this episode. The eruptive event that began at 0912 lasted ~45 minutes, but eyewitnesses indicated that most of the PF activity lasted only 10 minutes.
Throughout the day on 3 November seismic activity was pronounced and included seismic tremor (1-2 Hz), long-period (LP) events (1.5-1.7 Hz), a few volcano-tectonic (VT) events (2-4 Hz and 12-14 Hz), but mainly hybrid events (with initial phases at 2-8 Hz, followed by a main phase at 1-2 Hz).
On 4 November, during 1200-1300, explosions continued but with much less intensity. Ash and steam continued to rise. During the day, TOMS satellite measured up to 60,000 metric tons/day of SO2 (figure 4). In subsequent days, TOMS estimates remained around 5,000 to 20,000 metric tons/day through 21 November (figure 4).
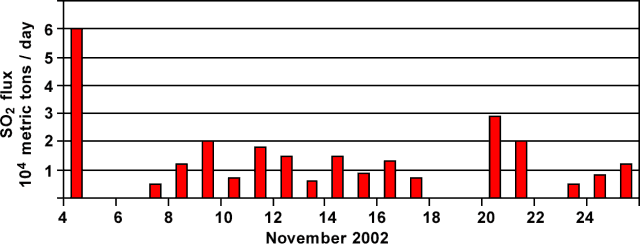 |
Figure 4. Reventador's SO2 output based upon TOMS satellite data reflecting the interval 4-26 November 2002. Courtesy of Simon Carn and Arlin Krueger. |
The next day, on 5 November, small explosions continued, but at 1300 a significant explosion may have generated PFs. Debris flows formed in the days following the PF emplacement mainly covered parts of the PF deposits and also reached the Quijos river, ~8 km from the crater.
During 6-7 November the volcano continued to emit ash, gases, and steam, but at reduced levels. Lava flow number 1 was presumed to have begun during this time, which was later confirmed by NOAA thermal images to have begun at 1900 on 7 November. The lava flow, several hundred meters wide, left the crater area and cone, and traveled SE down the caldera floor near the S caldera wall. An 8 November overflight by Jorge Anhalzer visually confirmed a 4-km-long lava flow, overriding the PF deposits and lahar plain. By 3 December it had traveled 5 km, but it was advancing at only ~1-3 m/day. Through late December observers confirmed that the lava flow continued to move.
During 8-21 November a short eruption column continued, but with increasingly more steam and gas relative to ash. No clear explosions were heard. Variable debris-flow activity occurred, depending upon the intensity of local rainfall. Sulfur gases were occassionally noted in the InterAndean Valley and in Quito.
On 21 November a second lava flow broke out on the lower SE foot of the cone at ~2,600 m elevation and descended to the ESE. By 3 December it had traveled 2 km and was accumulating against the side of the first lava flow.
From 21 November until 3 December there was no additional explosive or PF activity, the steam-rich plume rose to only 1-2 km, and the two lava flows continued moving at a rate of a few meters/day. Debris flows remained a threat to the workers repairing the pipelines and travelers along the main highway.
Setting and sketch map. Reventador stratovolcano is on the E flank of the Ecuadorian Andes in jungles of the western Amazon basin. It contains a 3-km-wide caldera with a young, unvegetated cone that rises ~1,300 m above the caldera floor. The caldera is breached to the E and frequent lahars in this region of heavy rainfall have constructed a debris plain on the E caldera floor. No population centers exist nearby; however, the principal oil and gas pipelines and an important highway cross the lower flanks of the volcano, precisely where most flows exited the caldera (figure 5).
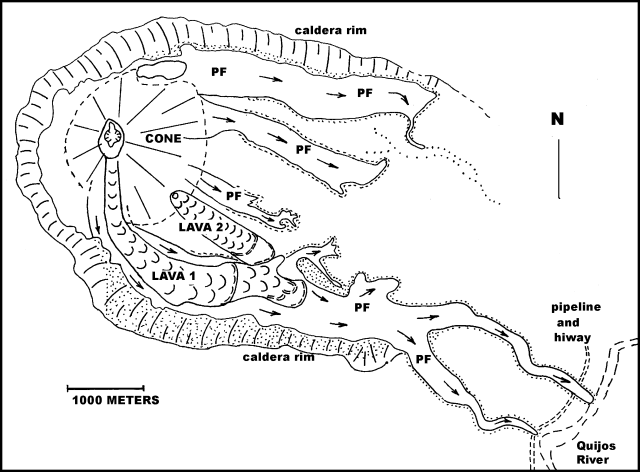 |
Figure 5. Sketch map showing deposits resulting from the November 2002 eruption of Reventador. PF signifies pyroclastic-flow deposits; stippled area shows downed trees and burned vegetation caused by PF's. The map shows the lava flow's advance as of 25 November. Note the oil and gas pipeline near the terminal ends of the PFs. This map omits the debris-flow deposits, which largely covered the PF deposits. Courtesy M. Hall. |
The young andesitic cone is within an older caldera (figures 2 and 5). The caldera's interior walls reach heights of 200-400 m, especially at its higher W end. Traces of an older somma rim lie concentrically outside the present W walls of the caldera. The caldera contains older lava flows and pyroclastic-flow and debris-flow deposits; the resulting caldera floor is higher in its W corner, slopes downward to the SE, and drains into the Quijos river.
The symmetrical composite cone of Reventador is presently at an elevation of ~3,500 m, 1,500 m above the lowest point at the SE end of the caldera. The slopes of the young cone average 34 degrees. The cone is slightly higher than the adjacent caldera rim, although a 1931 report stated that it was lower than the rim. Prior to this eruption the summit crater had a diameter of ~200 m and typically displayed mild fumarolic activity. Recent magmas are typically 56-58% SiO2 and carry olivine, two pyroxenes, and plagioclase.
Some 14 eruptions of sufficient magnitude to have been detected at appreciable distances occurred between 1541 and 1926 (Hall, 1977). The volcano was first visited in 1931, following its 1926-1929 eruption period. K.T. Goldschmid, a Shell Oil Company geologist, visited the volcano during its 1944 eruption. Eruptive activity occurred in 1960. Another cycle began in July 1972 and lasted until 1976, during which lava flows, small PFs, and debris flows were generated in four eruptive episodes; however, neither ashfalls nor strong sulfur gases were noted in the InterAndean Valley. A detailed listing of past eruptions is available from IG upon request.
Monitoring. Just months prior to the eruption, in April 2002, IG staff installed two new seismic stations (1 Hz, vertical, telemetered). With respect to the crater, the new stations sit 15 km ENE and at 24 km SW. They were operating during the November 2002 crisis (figure 6). After 3 November two similar stations were installed 7.5 km SE and 8 km E of the crater. Older stations important in monitoring the eruption include the two Cayambe stations, located ~40 km NW of Reventador, and Pino station on Guagua Pichincha, located about 100 km WSW. Most locatable earthquakes had shallow hypocenters beneath either the caldera's outer western flanks or under the young cone.
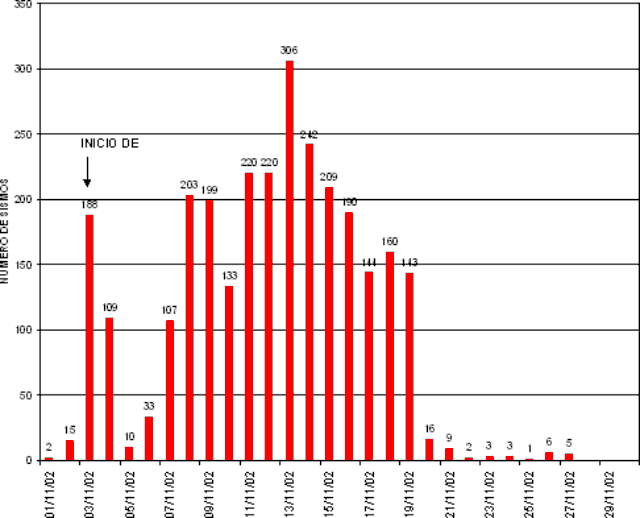 |
Figure 6. A histogram showing the daily number of all types of earthquakes registered at Reventador during November 2002. Courtesy Instituto Geofisico. |
Daily numbers of seismic events detected in November are show graphically on figure 6. Prior to the current eruption, the volcano averaged ~7 events/day. During the eruption, the average stood at ~142 events/day, chiefly hybrid earthquakes that began with higher frequencies and after a few seconds dropped to lower frequencies.
The eruption's first day was associated with more than 188 events, while the 2nd thru 5th days had only 50-100 events. By 8 November, the number of events generally remained above 200/day, dropping on 17 November to under 150/day, and dropping still further by 20 November. This abrupt decline was possibly associated with the eventual breakout of the second lava flow on 21 November.
No deformation or chemical monitoring was being carried out on the volcano prior to this eruption. TOMS SO2 monitoring as well as thermal monitoring by satellite have been extremely important, given the remoteness and inaccessibility of Reventador. Flights by an UltraLight and light planes have resulted in some photographic coverage and thermal imaging with a FLIR camera.
Effects of the 2002 eruption. Widespread ashfall to the W and SW caused visibility problems, respiratory ailments, some roof collapses, an undisclosed number of deaths and injuries to people attempting to clean their roofs of ash, crop damages, cattle illnesses, closure of Quito's airport for eight days, and power outages in some areas for up to four days. Legally enforced cleaning of all public streets and sidewalks by broom-wielding residents limited the amount of ash entering sewer systems. Lower speed limits were put in place to reduce airborne ash kicked up by passing vehicles. Ecuador's principal crude oil pipeline, although not severed, remained threatened by daily debris flows. One approach to this problem may be to bury the pipeline where it traverses the volcano's vulnerable E slopes.
References. Belloni, L.C., 1989, Slope failures on the volcano "El Reventador" in eastern Ecuador (discussions on volcanic debris), in Proceedings of the Twelfth international conference on Soil mechanics and foundation engineering—Comptes rendus du douzieme congres international de Mechanique des sols et des travaux de foundations, no. 12, v. 5, p. 2851.
Hall, M.L., 1980, El Reventador, Ecuador; un volcan activo de los Andes Septentrionales (El Reventador, Ecuador; an active volcano in the northern Andes): Politecnica 5, p. 123-136.
Hall, M.L., 1979, Volcan Reventador, Ecuador.Volcano News, v. 1, p. 1-3.
Hoyt, D.V., 1978, An explosive volcanic eruption in the Southern Hemisphere in 1928. Nature (London). 275; 5681, Pages 630-632.
Salazar, M.E., 1983, Expedicion vulcanologica el Volcan Reventador (Volcanologic expedition to Reventador Volcano): Flysch, v. 4, p. 1-4.
Information Contacts: P. Ramon, M. Hall, P. Mothes, and H. Yepes, Instituto Geofísico (IG), Escuela Politécnica Nacional, Quito (URL: http://www.igepn.edu.ec/); J.P. Eissen and Jean-Luc LePennec, French IRD (Institut de recherche pour le Développement) Representatives, Mission IRD-Whimper 442 y Corúa-Apartado Postal 17-12-857, Quito, Ecuador; Franz Böker, BGR (Bundesanstalt für Geowissenschaften und Rohstoffe), Alfred-Bentz-Haus, Stilleweg 2, D-30655 Hannover, Germany; George Stephens, Operational Significant Event Imagery (OSEI) team, World Weather Bldg., 5200 Auth Rd Rm 510 (E/SP 22), NOAA/NESDIS, Camp Springs, MD 20748USA; Arlin Krueger and Simon A. Carn, Joint Center for Earth Systems Technology (NASA/UMBC), University of Maryland-Baltimore County, 1000 Hilltop Circle, Baltimore, MD.
Ashfall in January, mudflows in February-March; additional data from November
On 3 November 2002, an unexpected eruption occurred at Reventador (BGVN 27:11). The following report provides an update on recent activity and additional information about the November eruption, including discussion of a site visit after the eruption and satellite data.
Recent activity. Seismicity was low during mid-December 2002. On 10 January, Instituto Geofísico (IG) reported that several lahars occurred that day in the Marquer and Reventador rivers. Ashfall was reported in the N sector of Quito, ~90 km to the WSW. In the afternoon a bluish gas column was observed exiting the crater. IG personnel stated that lava was slowly advancing and that 80-90% of the 3 November 2002 pyroclastic-flow deposits were covered by lahars.
During late February, rain generated mudflows that ended near the Montana River and disrupted traffic on a highway. White steam exited the volcano. Seismicity remained low, and was characterized by bands of harmonic tremor and volcano-tectonic (VT) earthquakes.
Intense rains during the first few days of March caused mudflows and again disrupted traffic. A gas column reached 300-500 m above the summit. Low-level seismicity was characterized by bands of harmonic tremor and a few isolated earthquakes. The seismic station in Copete registered high-frequency signals associated with lahars.
Site visit during 17-19 November 2002. The following report of an investigation of the 3 November 2002 explosion (BGVN 27:11) was submitted by Claus Siebe (Instituto Geofísico (IG), UNAM). Siebe, Jesús Manuel Macías, and Aurelio Fernández were able to fly to Quito on 17 November. On 18 November they interviewed Ing. Marcelo Riaño (general manager of the Trans-Equatorian Oil-Pipeline) as well as Patricia Mothes, Minard Hall, and Hugo Yepes (IG).
On 19 November they arrived in El Chaco (~34 km from Reventador) and traveled to the confluences of the Ríos Marker and Montana with the Río Coca (both are located 8 km from the crater). A small apron of fresh lahar deposits ~300 m wide covered the area adjacent to the Río Marker where the road had been before the 3 November eruption. Several dozens of workers with heavy machinery were trying to make a temporary passage over the gravel and boulder surface for the waiting trucks. For a few minutes they could see for the first and only time a ~1-km-high brownish ash column rising from the crater before incoming clouds hindered further visual contact.
"At the time of our visit, the Río Marker was diminished to such an extent that we could jump from boulder to boulder from one side to the other of the stream without getting wet. The vegetation around the confluence of the rivers was completely destroyed, and surviving trees were scorched and defoliated. The base layer of the fresh deposits consisted of up to 2.5-m-thick, partly matrix-supported, partly clast-supported pyroclastic-flow deposit with abundant wood and charcoal fragments (abundant scoriaceous boulder- and gravel-sized clasts were subrounded while dense clasts were angular). This was overlain by a sequence of several sandy-gravelly lahar units with abundant charcoal supporting larger boulders as well as clasts from the underlying pyroclastic-flow deposit.
About 400 m from the Río Marker, after passing a narrow zone of unaffected vegetation, we were able to reach the Río Montana, where a similar situation was encountered (figure 7). Here, at places the lahar deposits were still steaming with a sulfurous smell. The bridge over the river was destroyed, but the oil pipeline was still basically intact (figure 8). Since the area did not seem safe (the last lahar had been emplaced less than 24 hours prior) the team returned to El Chaco, where they interviewed several people and obtained photographs of the pyroclastic flow and its deposits taken on 3 November 2002 (figures 9-11).
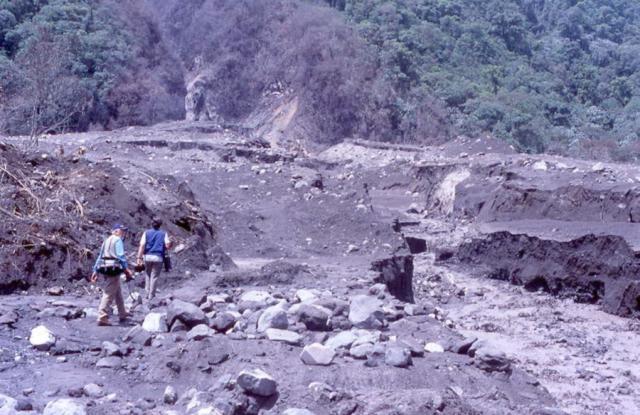 |
Figure 7. Fresh lahar deposits at Reventador near the confluence of Río Montana with Río Coca on 19 November 2002. According to workers trying to repair the road the still-warm and steaming surface of the lahar deposit shown in the photo was produced during the afternoon of 18 November after heavy rain. This was the 10th lahar event since 3 November. Courtesy of Claus Siebe. |
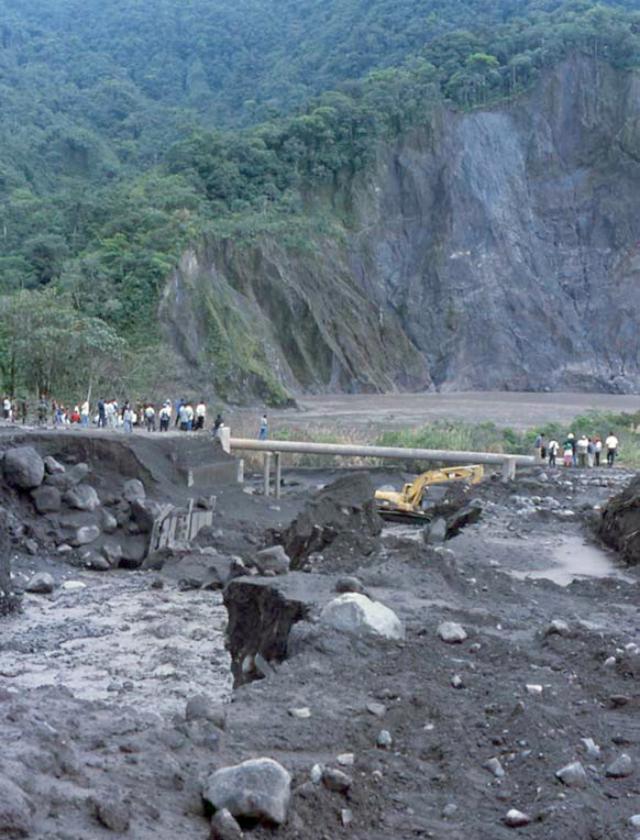 |
Figure 8. Photo looking downstream near the confluence of Río Montana with Río Coca on the ESE flank of Reventador. In the foreground are the fresh lahar deposits. In the middle ground is the destroyed concrete bridge over the Río Montana as well as the oil-pipeline immediately behind. The bulldozer is trying to built a temporary passage for hundreds of trucks waiting on both sides of the road. In the background is the Río Coca with distal-debris avalanche deposit (19,000 Y BP) forming the vegetated hills behind the river. Photo taken on 19 November shortly after 1300 by Claus Siebe. Courtesy of Claus Siebe. |
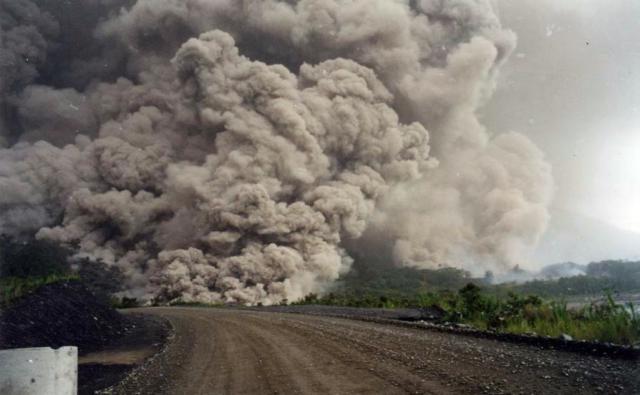 |
Figure 9. Pyroclastic flow descending Reventador's SE slopes during the morning of 3 November 2002. Photo was taken from the E (Transoceanic road in the foreground). This anonymous photo was purchased at a small hotel in El Chaco. Courtesy of Claus Siebe. |
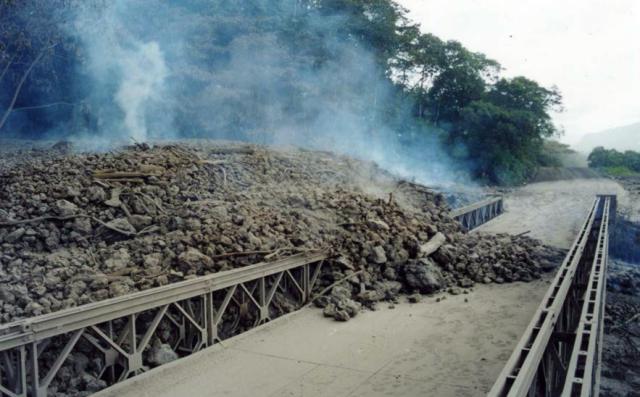 |
Figure 10. Fresh pyroclastic-flow deposits from Reventador, produced on 3 November 2002, ponding against the bridge over the Río Montana. This anonymous photo was purchased at a small hotel in El Chaco. Courtesy of Claus Siebe. |
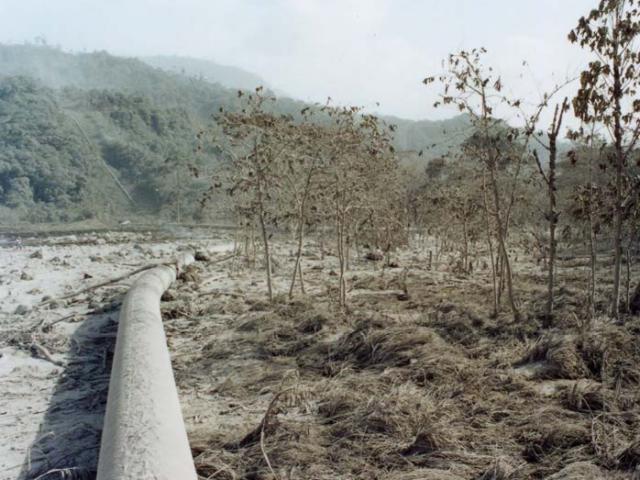 |
Figure 11. Distal pyroclastic-flow deposits from Reventador and scorched vegetation along the Transandean oil-pipeline near the confluence of the Río Montana with the Río Coca. This anonymous photo was purchased at a small hotel in El Chaco. Courtesy of Claus Siebe. |
At about 2200 we drove to the summit of a hill (2,959 m elevation) N of Sta. Rosa, 27.5 km from the summit of Reventador. Although the night was clear and we had a good view, the summit was covered by clouds and no incandescence from an advancing lava flow could be seen.
From conversations with personnel from PETROECUADOR, road workers, peasants, etc., the team obtained the following information. Workers from TECHINT, an Argentinian company building a second pipeline parallel to the existing one, were at their campsite near the Río Montana when the eruption started in the early hours of 3 November (it was still dark). The eruption came without prior warning, but they were able to evacuate before strong explosions around 0900 sent pyroclastic flows along the Ríos Montana and Marker. These flows destroyed the road and parts of the new pipeline still under construction. The old pipeline was displaced several meters horizontally but never broke. At places the pyroclastic-flow deposits came to rest in direct contact with the tube. Temperature measurements at points of contact yielded values of 80°C. In subsequent days several lahars came down the Ríos Montana and Marker after heavy rains, further damaging the road (but not the pipeline). The pipeline has continued its operation; it delivers more than 400,000 barrels of oil per day to the Pacific coast.
Inhabitants of the small village of El Reventador, located ~12 km downstream from the confluence of the Ríos Montana and Coca voluntarily evacuated their homes when they heard the explosions around 0900.
One of the scoriaceous juvenile rock samples collected near the confluence of Río Marker with Río Coca was analyzed by X-ray fluorescence and thin sections were made of the same sample. The results revealed that the rock is an andesite (SiO2= 58.1%) similar in composition to those erupted in 1976 (55-58% SiO2).
Satellite data. Simon Carn (NASA/UMBC) reported that TOMS observations of the Reventador eruption clouds during 3-4 November suggest modest SO2 burdens and spatial separation of the emitted SO2 and ash. Carn, with input from Andy Harris, also constructed a timeline of notable events during 3-6 November along with potentially useful satellite images and overpasses (table 2).
Table 2. Preliminary timeline of the November 2002 eruption of Reventador, compiled using satellite imagery and information from IG and the Washington VAAC. Courtesy of Simon Carn and Andy Harris.
| Date | Time (UTC) | Satellite | Event |
| 3 Nov 2002 | 0700 | -- | Seismic events recorded |
| 3 Nov 2002 | 0945 | GOES-8 | Clear - no hot spot |
| 3 Nov 2002 | 1000 | -- | Eruption begins; 3 km ash column, incandescent ejecta |
| 3 Nov 2002 | 1015, 1045, 1115 | GOES-8 | Clear - no hot spot |
| 3 Nov 2002 | 1245, 1315, 1345 | GOES-8 | Ash |
| 3 Nov 2002 | 1400 | -- | Main eruption phase; pyroclastic flows reported |
| 3 Nov 2002 | 1415 | GOES-8 | Ash, ring-shaped cloud? |
| 3 Nov 2002 | 1445 | GOES-8 | Ash |
| 3 Nov 2002 | 1510 | MODIS Terra | Ash |
| 3 Nov 2002 | 1515 | GOES-8 | Ash |
| 3 Nov 2002 | 1530 | GOME | SO2 |
| 3 Nov 2002 | 1543 | EP TOMS | SO2, ash |
| 3 Nov 2002 | 1545, 1615, 1645 | GOES-8 | Ash |
| 3 Nov 2002 | 1707 | NOAA-16 AVHRR | Ash |
| 3 Nov 2002 | 1715 | GOES-8 | Ash |
| 3 Nov 2002 | 1722 | SeaWiFS | Ash |
| 3 Nov 2002 | 1745 | GOES-8 | Ash |
| 3 Nov 2002 | 1810 | -- | Ash begins to fall in Quito |
| 3 Nov 2002 | 1815, 1845, 1915, 1945 | GOES-8 | Ash |
| 3 Nov 2002 | 2000 | -- | Ash covers large area of Ecuador, reaching coast |
| 3 Nov 2002 | 2015 | GOES-8 | Ash, gravity waves? |
| 3 Nov 2002 | 2045, 2115, 2145, 2215 | GOES-8 | Ash, gravity waves |
| 4 Nov 2002 | 0345, 0415, 0445, 0515, 0545, 0615 | GOES-8 | Cloud-covered |
| 4 Nov 2002 | 0625 | MODIS Aqua | Ash, SO2 |
| 4 Nov 2002 | 0645 | GOES-8 | Cloud clearing- possible hot spot |
| 4 Nov 2002 | 0710 | NOAA-16 AVHRR | Ash |
| 4 Nov 2002 | 0715, 0745 | GOES-8 | Hot spot |
| 4 Nov 2002 | 0815, 0845 | GOES-8 | Strong hot spot and plume |
| 4 Nov 2002 | 0915 | GOES-8 | Strong hot spot and minor plume |
| 4 Nov 2002 | 0945, 1015 | GOES-8 | Strong hot and detached minor plume |
| 4 Nov 2002 | 1045 | GOES-8 | Hot spot |
| 4 Nov 2002 | 1115 | GOES-8 | Ash, strong hot spot and main plume |
| 4 Nov 2002 | 1145, 1215, 1245, 1315, 1345, 1415 | GOES-8 | Ash, main plume extends W |
| 4 Nov 2002 | 1445 | GOES-8 | Ash, main plume (N arm) reaches coast |
| 4 Nov 2002 | 1515 | GOES-8 | Ash |
| 4 Nov 2002 | 1530 | GOME | SO2 |
| 4 Nov 2002 | 1555 | MODIS Terra | SO2 |
| 4 Nov 2002 | 1632 | EP TOMS | SO2, ash |
| 4 Nov 2002 | 1715 | GOES-8 | Plume still attached to hot spot |
| 4 Nov 2002 | 1835 | NOAA-16 AVHRR | Ash |
| 4 Nov 2002 | 1845 | MODIS Aqua | SO2 |
| 5 Nov 2002 | 1645, 1715, 1745 | GOES-8 | Low-level ash |
| 5 Nov 2002 | 1815, 1845, 1915 | GOES-8 | Low-level ash |
| 6 Nov 2002 | 1530 | GOME | SO2 |
| 6 Nov 2002 | 1544, 1634, 1545, 1634, 1546 | EP TOMS | SO2 |
The TOMS overpass at 1543 UTC on 3 November captured the early phase of the eruption. An ash signal was localized over the volcano and a more extensive SO2 cloud containing ~12 kilotons SO2 was spreading E and W.
At 1632 UTC on 4 November, TOMS detected several distinct cloud masses. A cloud containing no detectable ash and ~11 kilotons SO2 was situated E of Ecuador on the Perú/Colombia border, a maximum distance of ~600 km from Reventador beyond which a data gap intervened. A second cloud containing ~42 kilotons SO2 and a weak ash signal was observed over the Pacific Ocean around 700 km from the volcano. The highest ash concentrations were detected in a cloud straddling the coast of Ecuador ~260 km W of the volcano that covered ~70,000 km2. This cloud contained little SO2. It is assumed that these clouds (total ~53 kilotons SO2) were erupted on 3 November.
A plume was also detected extending ~200 km W of Reventador, containing ~10 kilotons SO2. Based on high temporal resolution GOES imagery this plume first appeared sometime between 1045 UTC and 1115 UTC on 4 November. Nearby Guagua Pichincha was also reported active at this time by the Washington VAAC, and may have contributed some SO2; the highest SO2 concentrations in the Reventador plume were measured in the TOMS pixel covering Guagua Pichincha.
On 5 November neither SO2 nor ash were detected by TOMS, although a ~700-km-wide data gap occurred off the coast of Ecuador. The TOMS orbit was better placed on 6 November but no SO2 or ash were apparent. However, renewed SO2 emissions were detected on 7 November.
Information Contacts: P. Ramon, M. Hall, P. Mothes, and H. Yepes, Instituto Geofísico (IG), Escuela Politécnica Nacional, Quito (URL: http://www.igepn.edu.ec/); Simon A. Carn, Joint Center for Earth Systems Technology (NASA/UMBC), University of Maryland-Baltimore County, 1000 Hilltop Circle, Baltimore, MD (URL: https://jcet.umbc.edu/); Andy Harris, HIGP/SOEST, University of Hawaii at Manoa, HI 96822 USA (URL: http://goes.higp.hawaii.edu/); Claus Siebe and Gabriel Valdez Moreno, Instituto de Geofísica, UNAM, Mexico, D.F.; Jesús Manuel Macías, CIESAS-Mexico, Juarez 87, Tlalpan, DF. CP14000; Aurelio Fernández Fuentes, Centro Universitario de Prevencion de Desastres, Universidad de Puebla, Mexico; Washington Volcanic Ash Advisory Center (VAAC), Satellite Analysis Branch (SAB), NOAA/NESDIS E/SP23, NOAA Science Center Room 401, 5200 Auth Road, Camp Springs, MD 20746, USA (URL: http://www.ospo.noaa.gov/Products/atmosphere/vaac/).
Lahars, mudflows, and steam emissions continue through mid-July
After a 26-year repose without signs of unusual activity, Reventador burst unexpectedly into a VEI 4 eruption on 3 November 2002 (BGVN 27:11). A preliminary evaluation indicated that this was one of Ecuador's most powerful eruptions of the past 100 years. The following report provides an update on activity since March 2003 (BGVN 28:02) through mid-July 2003. Available seismic records are incomplete for this period (table 3). However, by late April all types of recorded seismic events had declined to very low levels.
Table 3. Summary of seismic activity at Reventador, 8 March-13 July 2003. Note that data are incomplete. Courtesy of the Instituto Geofísico.
| Date | Long-period | Hybrid | Volcano-tectonic |
| 08-14 Mar 2003 | 120 avg./day | -- | 15 avg./day |
| 24-31 Mar 2003 | 50-60/day | -- | 20-30/day |
| 01-06 Apr 2003 | 42-98/day | 26-65/day | 5-13/day |
| 07-12 Apr 2003 | 63.5 avg./day | 30 avg./day | 2.33 avg./day |
| 13 Apr 2003 | 58 | -- | 6 |
| 14 Apr 2003 | 29 | -- | 3 |
| 15 Apr 2003 | 35 | -- | 8 |
| 16 Apr 2003 | 37 | -- | 6 |
| 17 Apr 2003 | 31 | -- | 8 |
| 18 Apr 2003 | 22 | -- | 8 |
| 19 Apr 2003 | 20 | -- | 6 |
| 28 Apr-02 May 2003 | 0 | -- | 0 |
| 03 May 2003 | 1 | -- | 1 |
| 04 May 2003 | 0 | -- | 0 |
| 30 Jun-06 Jul 2003 | 1 | -- | 4 |
| 07-13 Jul 2003 | 2 | -- | 2 |
Heavy rains in March 2003 mixed with ash on Reventador's flanks, causing mudflows and lahars that disrupted traffic along routes crossing rivers draining the volcano (figure 12). A gas column reached 300-500 m above the summit early in the month. Low-level seismicity was characterized by bands of harmonic tremor and a few isolated earthquakes; long-period (LP) seismic events were possibly associated with gas discharges. The seismic station in Copete registered high-frequency signals associated with lahars; however, only a few lahars were observed. Activity during the last week of March was characterized by persistent low-energy emissions of white steam and yellowish gases. Seismicity was also low during this time. The reference seismic station was moved nearer to the volcano, allowing detection of smaller magnitude earthquakes.
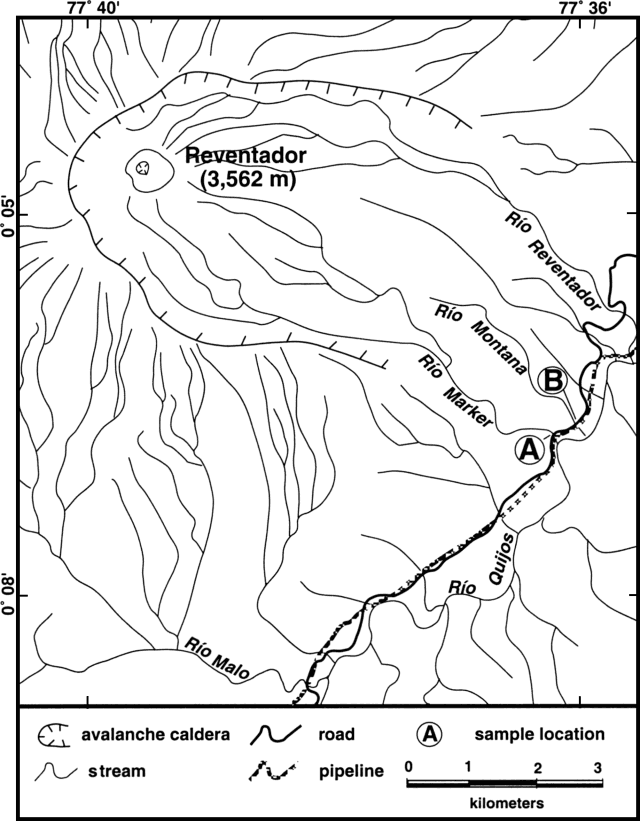 |
Figure 12. Map showing drainages from Reventador and the location of roads and pipelines SE of the volcano. Courtesy of the Instituto Geofisico. |
When the weather permitted in April and May 2003, observers saw continuous low-level emissions of white steam and yellow gases rising several hundreds of meters above the volcano's cone. This was corroborated by the seismicity recorded at station LAVA2 (inside the caldera near the lava front). Rains have been frequent, generally of short duration, and accompanied by some lahars. Low-frequency tremor on 12 April was recorded at LAVA2 (0.9 Hz) and CONE (1.3 Hz), in the caldera NE of the cone near the head of the Rio Reventador. During April, rivers swelled with water and mud that blocked river crossings. Seismicity was characterized by a fairly constant number of long-period (LP)/hybrid and volcano-tectonic (VT) events, with a slight diminution in the number of LPs (table 1). Lahars on 18-19 April produced significant flooding in Rio Reventador and Rio Marker. Seismic activity stayed at very low levels.
On 1 May strong rains in the area of the volcano generated mud flows or lahars that destroyed the highway in the Rio Reventador sector. Heavy rainfall of up to 200 mm in less than 24 hours on 6 May led to the remobilization of ash from the November 2002 eruption. Lahars traveled down the SE flank via the Rio Marker and Rio Reventador gorges. Seismic signals indicated that lahars occurred in seven main pulses, with the longest pulse lasting ~2 hours. Lahars crushed a portion of the petroleum pipeline on the SE flank and dragged it 22 m. Lahars also destroyed a bridge and blocked a highway. On 8 May, satellite images showed a plume that extended ~50 km NW.
During much of June and July 2003, the volcano was not visible due to cloudiness. Seismic activity during June was characterized by bands of continuous tremor, some related to increased volume of the rivers and/or mud flows. On 19 June, a steam plume reached a height of ~300 m. Seismic tremor was associated with flowing gas and observed emissions. Small seismic events (magnitudes less than 3.4) occurred on 23 and 25 June. During 30 June-1 July a gas column was observed that rose ~200 m and drifted W. Seismicity was at low levels in early July, but continuous tremor occurred associated with degassing.
Information Contacts: Geophysical Institute, National Polytechnical School, Campamento, San Rafael, Ecuador (URL: http://www.igepn.edu.ec/).
Variable seismicity, degassing, and recurring lahars
This report contains updates from Reventador for July through November 2003. During this time seismicity varied from generally low to occasionally high. Lahars recurred, as rain and drainage systems continued to move tephra left after the eruptions that began on 3 November 2002 (BGVN 27:11, 28:02, and 28:06). Except for degassing, steam plumes, and the cooling of lava flows, further eruptive behavior (or cessation of activity) was not mentioned.
Activity during July-August 2003. Rainfall at Reventador during 7-13 July caused renewed movement of ash on the volcano's flanks. This led to lahars down the Montana River, and a consequent interruption in highway travel. Tremor associated with degassing was noted, with an increase during the last week of July and early August. Steam plumes were noted on 30 July and 2 August and lahars coincident with tremors were observed on 30 July. Seismicity was moderate, with about five volcano-tectonic (VT) events per day and a total of four tectonic events between 30 July and 3 August. These four events were located between 5.4 and 35 km away. The tectonic earthquake on 3 August registered the highest magnitude, M 3.2.
On 9 August detectors in three locations registered a lahar; this was later confirmed by staff from the Chaco-Santa Rosa station. Seismicity was low between 4 and 10 August, with six local tectonic events. Three of these occurred on 8 August, at varying depths, but all were within 10-12 km of the volcano. The second of these was the largest of any event that week, M 2.9. Seismicity stayed low through the end of the month, with an average of one VT event per day during the last week of August. Small fracture events related to the cooling of lava flows were noted. However, no rains capable of generating lahars were recorded, and there were no reports of steam or gas emissions.
Activity during September-October 2003. Reports were not available for the first three weeks of September and the first two weeks of October. During the week of 22-28 September, two lahar signals were registered, as well as 44 hybrid events, 43 VT events, and seven long-period (LP) events. During the following week, hybrid and LP events dropped to 17 and two events, respectively, but the number of VT events increased considerably, to 78. Lahars lasting ~ 4 hours each were recorded on 30 September and 1 October, following moderate rain on the 30th. During 13-19 October instruments registered 77 VT and 17 LP earthquakes (i.e., averaging 11 VT earthquakes and two LP earthquakes per day). Lahars were reported on 13, 14, and 19 October. During the following week, seismicity stayed at similar levels. Due to intense rains, more lahars were registered, on 20 and 22 October and again on 28 and 29 October. Traffic was again affected as a route had to be closed. Also between 27 October and 2 November, there was a small increase in the number of volcano-tectonic events.
Activity during November 2003. Seismicity remained constant, averaging 8-9 earthquakes each day. Following strong rains on 7 and 9 November, seismometers detected signals attributed to lahars. After the lahar signals had diminished, tremor was again detected. Lahar signals were also recorded on 11, 12, 14, and 26 November.
Information Contacts: Geophysical Institute (IG), Escuela Politécnica Nacional, Apartado 17-01-2759, Quito, Ecuador (URL: http://www.igepn.edu.ec/).
Late 2004 visits find renewed venting and thick intracaldera lava flows 2 km long
A 16 December 2004 report from the Instituto Geofísico (IG) of the Escuela Politécnica Nacional calls attention to renewed lava effusion from the crater that lies within Reventador's large summit cone (figure 13). A block-lava flow escaped the cone's crater. It ran out at a breach in the S wall, and by 16 December it had advanced ~ 2 km farther. The flow advanced SE along a narrow, E-curving path, remaining atop lavas from 2002. Thus far in 2004, lava flows remained well within the larger caldera.
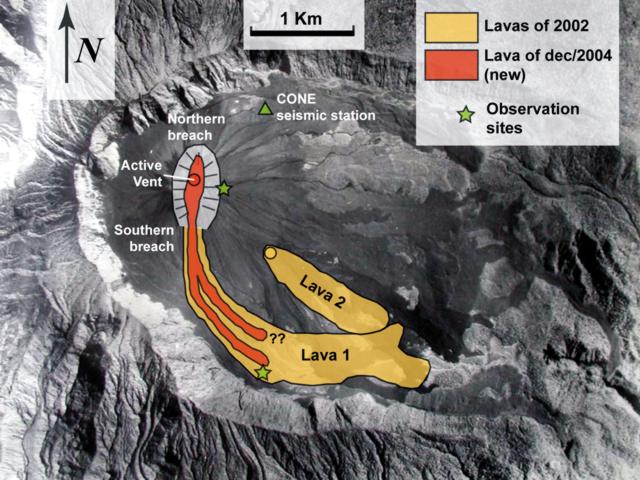 |
Figure 13. An aerial photo of Reventador's 4-km-diameter caldera as a base for mapping the lava flows of 2002 and those of 2004 through mid-December. The 2002 flows are labeled Lava 1 and Lava 2. The 2004 lava flow followed and partly covered Lava 1. At a distance of ~ 1 km from the vent, the 2004 lava flow bifurcated into two closely spaced parallel lobes. The caldera has an E-tilting floor, is open on its E side, and contains a prominent cone on its W side. The cone forms the volcano's summit, and contains an elongate crater that hosts the 2004 vent ("active vent"). The crater has a rim that is indicated by a solid curving line; the crater's inward-sloping walls are indicated by light shading and lines resembling the trends of gullies. The cone's floor at its southern breach lies at ~ 3,200 m elevation. The aerial photo was taken by Instituto Geográfico Militar in 1983. Figure courtesy of IG. |
Reports in 2003 chiefly discussed events outside the caldera. A road, one gas pipeline, and two oil pipelines traverse Reventador's flanks 7 km ESE of the active vent. All of these installations were affected in 2003 (but not appreciably since then). The pipelines were destroyed due to heavy lahars coming down the Reventador river on 6 May 2003 (BGVN 28:06). Our last report (BGVN 28:11) discussed events during July through most of November 2003.
Lava venting in the crater likely began in early November 2004, a time when seismic station CONE registered dramatic increases in volcano-tectonic events (figure 14). In response to the elevated seismicity, the IG-EPN began more intensive monitoring, including overflights with thermal imaging, repeat visits to the remote volcano, and on 9 November 2004, installation of the additional short-period seismic station LAV3, ~ 2 km from the crater's vent.
 |
Figure 14. Seismicity (number of earthquakes) versus time registered at Reventador (station CONE) during mid-February 2003 through mid-December 2004. Anomalously elevated seismicity consisting mainly of volcano-tectonic began in August 2004. Activity increased on 4 November 2004 and included hybrid events. Previously unseen emergent, extended-duration, broad-band earthquakes began on 22 November 2004. Courtesy of IG. |
A helicopter overflight by IG-EPN staff on 10 November 2004 confirmed the presence of a small lava dome, which appeared then to be confined to the crater floor. This feature was not present on photos taken during an IG overflight on 19 October 2004. During the 10 November overflight, a continuous 2.5 km-high gas column escaped from the crater, accompanied by sulfurous odors detected by personnel in the helicopter.
The date when lava began escaping the crater was not precisely known, but it was thought to have been around 22 November, coincident with the emergence of distinct seismic signals not previously observed at Reventador (figure 11). The signals occurred in swarms and consisted of low-frequency (1-10 Hz) waves of relatively low-amplitude. Their seismic records were emergent (i.e. growing in amplitude with time) and of long duration (up to 60 seconds). They are thought to have been possibly associated with rock falls from lava flowing down the cone's southern flank. As many as 200 of these events were recorded each day at station CONE.
A return visit to the crater rim on 28 November (this time on foot) documented abundant fresh lava in the crater (figure 15), a dramatic increase in the volume of lava there. At least 0.5 x 10⁶ m3 of new lava then covered the entire crater floor and appeared to be already flowing out of the southern breach and into the surrounding caldera. Because of cloudy weather, the exact extent of the flow remained indeterminate. The surface of this lava flow also extended to the N and reached a level ~ 20 m below the northern breach. Continuous lava extrusion or flowing or both were heard within the crater, making sounds akin to glass breaking, and vigorous roaring gas emissions originated from the crater's western margin. These gas emissions and other smaller fumaroles contributed to a plume that was continuously present, extending at least 1 km above the vent.
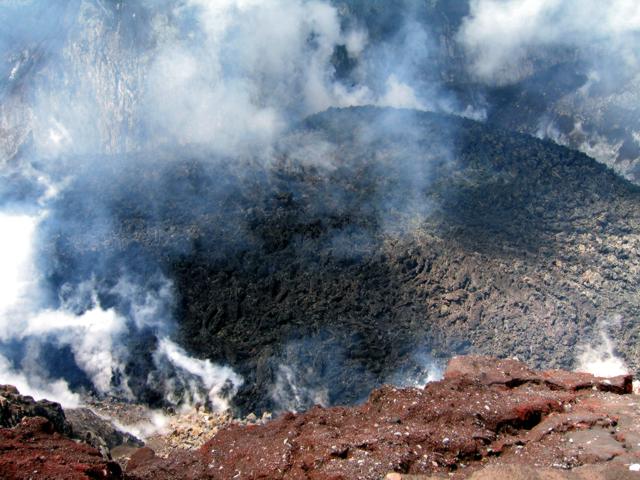 |
Figure 15. Reventador's 2004 lava flow/dome as seen on 28 November 2004. The photo was taken looking W and downward from the cone's eastern crater rim (see vantage point indicated by the star on figure 11). Courtesy of IG. |
IG observers estimated that the total mid-December lava flow volume was ~ 3 x 10⁶ m3. The inferred 22 November date of flow onset would imply a steady-state extrusion rate of ~ 0.1 x 10⁶ m3 per day and a flow front advancing at ~ 80 m per day. These observations appear to conform with satellite thermal infrared observations, which noted no significant anomalies until the end of November, due presumably in large part to the lava being confined within the steep-walled crater. Inclement weather occurred and also may have impeded some of the satellite thermal observations.
The most recent visit to the crater rim, on 11 December 2004, traced the source of degassing and lava outflow to the most elevated portion of a small dome-like feature at the central western margin of the crater. Figure 16 shows how instrumentally aided nighttime incandescence observations disclosed both the vent area and surficial flow-textures extending S towards the southern breach of the cone. Figure 14 also documents a comparatively narrow arm of lava trending towards the cone's northern breach. Nighttime incandescence from the lava flow was also visible from local communities such as El Chaco, ~ 20 km distant.
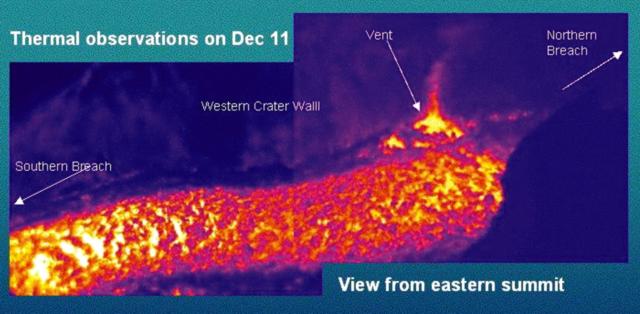 |
Figure 16. Thermal image of the lava flow in the interior of Reventador crater taken with a Forward Looking Infrared (FLIR) imager at 2000 on 11 December 2004. Courtesy of IG. |
Figure 17 illustrates the scene on 12 December 2004 during a visit to the front of the most advanced lobe of lava (for location, see star at end of flow lobe, figure 9). IG-EPN staff estimated the flow front at ~ 20 m high and saw incandescent blocks falling off of it.
|
Figure 17. A N-looking view of Reventador's gray-colored lava-flow front taken on 12 December 2004 at ~ 2,600 m elevation. Person at right indicates scale of the advancing flow front. The lava flow emanated from the breach in the S side of the cone's crater, a spot seen in the photo's upper left. Courtesy of IG. |
Information Contacts: Patricio Ramón, Daniel Andrade, David Rivero, Alexandra Alvarado, Sandro Vaca, and Pete Hall, Geophysical Institute (IG), Escuela Politécnica Nacional, Apartado 17-01-2759, Quito, Ecuador (URL: http://www.igepn.edu.ec/); Jeffrey B. Johnson, Dept. of Earth Sciences, James Hall University of New Hampshire, Durham, NH 03824; MODIS Thermal Alert System, Hawaii Institute of Geophysics and Planetology (HIGP), School of Ocean and Earth Science and Technology, University of Hawaii at Manoa (URL: http://modis.higp.hawaii.edu/).
Lava flow reaches 4 km from summit, approaching road and petroleum pipeline
Crisis escalates. Instituto Geofísico (IG) members noted that eruptions at Reventador in Ecuador's eastern cordillera continued into at least early July 2005. Observers documented thick blocky lava flows, occasional Vulcanian explosions, new fumarolic activity on the N flank of the cone, and venting of vapor, gases, and fine ash. This followed a spate of increased seismicity during April to early June 2005. Lava flows had extended 4 km from the summit vent toward the SE, in the direction of the main highway across this region, a route that links the important oilfields in the Amazon basin with Quito, the capital. The lava flows were sequentially numbered (Lava ##3, ##4, etc.).
Lava ##3, a flow that began in November 2004 (BGVN 29:11), advanced slowly and ceased movement by early January 2005. Following relatively low seismic activity in late 2004 and early 2005, the IG monitoring network began to register bands of harmonic tremor starting 1 April (figure 18). Through 8 April 2005, instruments recorded 45 tremor episodes, each lasting 10 to 60 minutes. Dominant frequency peaks were between 1 and 1.5 Hz. Given that strong incandescence was observed by a guard of PetroEcuador from 14 km away, the tremor was interpreted to signal the rise of magma into the upper part of the cone through an open conduit.
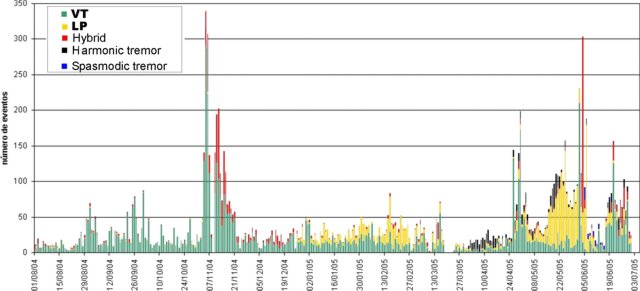 |
Figure 18. Seismic events registered at Reventador since August 2004. Courtesy of IG. |
Lava ##4 erupted coincident with this strong tremor and was the most important surface manifestation. It was first observed in an overflight on 12 April, escaping from a summit crater conduit that had formed a carapace. It was seen flowing down the SW crater notch onto the cone's flanks and then onto the SW and SE caldera floor. The flow partially covered Lava ##3 (figure 19), resulting in layers of recent lava in some places reaching more than 50 m thick. This emplacement was observed during several days of work on the seismic instrumentation and sampling within the caldera carried out by IG personnel during 19-22 April. During the same overflights, a new fumarole field was observed on the lower S flank of the cone, a spot very close to the upper Reventador River, in the same place where thermal anomalies were observed on 11 March 2005.
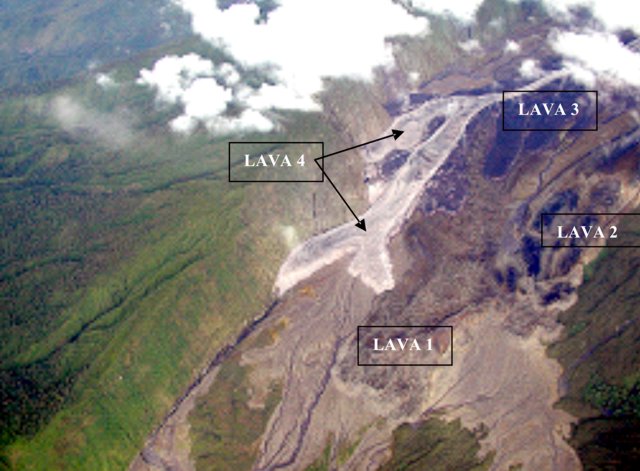 |
Figure 19. Location of lava flows related to eruptive activity within the Reventador caldera since 2002. Photo taken looking at the SE flank on 6 May 2005 by P. Ramón. Provided courtesy of IG. |
Starting on 15 May there was an important increase in the intensity of harmonic tremor, often preceded by low frequency (< 1 Hz) long-period events, a conspicuous aspect of behavior that was absent in April. Many of the long-period events, particularly those occurring during 17-21 May, were of such magnitude that they registered at seismic stations on other volcanoes (e.g., Cerro Negro and Guagua Pichincha) more than 100 km distant.After this elevated activity in mid May, there was a decrease in the number of events, dropping to an average of 88 per day. During this period Lava ##4 continued to flow, moving at the rate of about 20 m/day, advancing particularly strongly along the caldera's S wall in a stream channel (Rió Marker) cut through the 2002 pyroclastic deposits. Lava reached 25 meters thick when seen during a 22-23 May visit, during which time strong roars and the sounds of 'many jet planes' blared from the vent. These sounds indicated a strong gas flux, although little vapor was observed. At this time, there was an absence of both explosions and incandescence in the summit crater.
An overflight on 25 May confirmed the emergence of a new flow (Lava ##5). It followed the same route as ##4, but was comprised of three principal lobes. The middle lobe, which represented the most conspicuous and largest volume, advanced down the Río Marker's channel (figure 20).
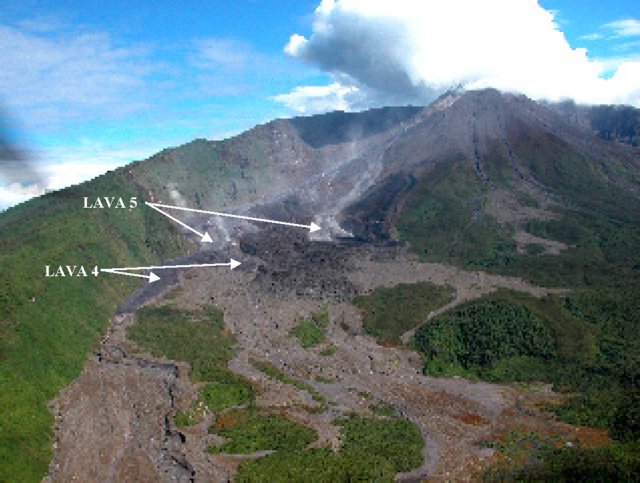 |
Figure 20. Lavas 4 and 5 flowing down the Marker's stream channel along the SE margin of Reventador's caldera. Photo taken on 17 June 2005 by P. Ramón. Provided courtesy of IG. |
Reventador's activity in June 2005 began with an important swarm of volcano-tectonic and hybrid seismic events—starting on the 2nd and continuing through the 3rd. Of particular note, tremor continued for more than 10 hours, and provided background to the discrete volcano-tectonic and hybrid events Hybrid events had not been registered since November 2004. Following these important swarms, instruments registered strong, full-amplitude bands of spasmodic tremor, comprised to some extent by packages of long-period events lasting for hours to days on end.
During these early days of June, there was an intensification of incandescence in the crater and later, the emission of gases and slight ash. On 8 June, a 100 km long vapor/ash column extended from the volcano into the S part of Quito at ~ 7 km altitude and caused a very slight powdering of ash, which was brought down by a gentle rain and left cars dappled with circular spots.
A trip by IG volcanologists into the caldera on 11-12 June disclosed strong Strombolian fountaining in the summit crater. Lava ##5 continued to flow atop the stalled Lava ##4. Measurements of SO2 flux with a mini-DOAS (differential optical absorption spectroscopy) resulted in an estimate of ~ 2,500 metric tons/day.
Three other seismic stations were installed around the caldera with the helicopter help of the petroleum company OCP during 16-19 June. One broad-band seismograph and infrasound system was also installed, thanks to collaboration with Jeff Johnson of the University of New Hampshire. During this period no Strombolian activity was observed, but Vulcanian explosions (figure 21) occurred with little warning. A 24-hour period during 18-19 June included at least seven discrete explosions, producing strong infrasound and seismic responses. Many of these explosions discharged columns that rose 2-3 km above the summit (and some, up to as high as ~ 6 km above the summit) and were clearly heard within the caldera. Large incandescent blocks could be seen thrown several hundreds of meters into the air, falling on the cone's upper slopes. Ash content in the columns was moderate. Explosions were discrete and often terminated within 4 minutes. Thermal alerts were identified by the Hawaii Institute of Geophysics and Planetology (HIGP). Observations on 30 June and 1 July noted recent lava flows in the upper Marker river valley (figure 22).
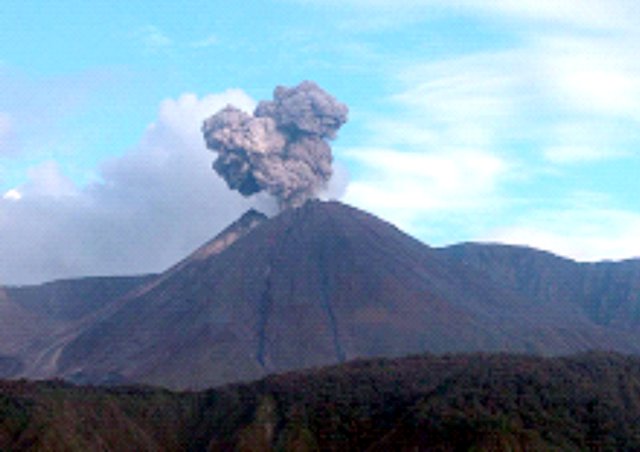 |
Figure 21. One of Reventador's discrete Vulcanian explosions observed during a 19 June 2005 helicopter flight. The view is from the E of Reventador caldera looking toward the W. Photo taken on by P. Ramón; provided courtesy of IG. |
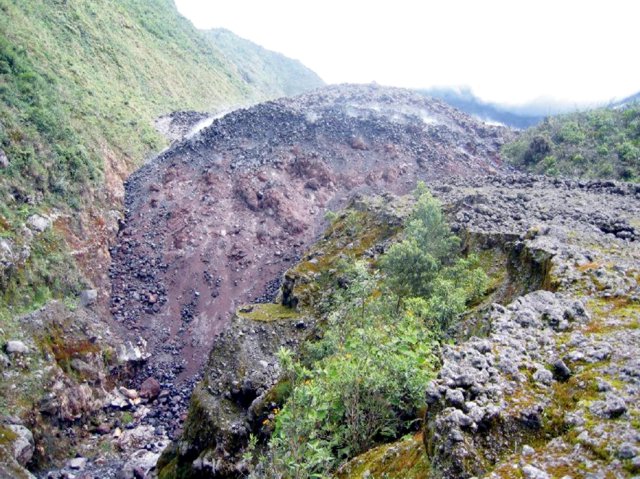 |
Figure 22. A photo of Reventador's Lava ##4 flow front (which had reddish hues) overtopped by Lava ##5 (more nearly white). The shot was taken in the Río Marker at 1100 on 30 June 2005. By 1 July, Lava ##5 had still not advanced beyond the terminus of Lava ##4. Photo by P. Ramón, provided courtesy of IG. |
The 4-6 discrete explosive degassing events/day observed in June led the IG authors to surmise that there were a series of temporary plugs in the upper part of the conduit. This behavior was thought to reflect magma becoming more crystal rich.
As of 6 July, harmonic tremor, occasional explosions, and long-period and volcano-tectonic signals all continued to register at Reventador on the IG's telemetered monitoring network. Strong Strombolian fountaining was observed from distances of 6.5 and 14 km during the evening and one of the lobes of Lava ##5 was advancing down the caldera wall (following the Río Marker), but abruptly slowed to perhaps only ~ 20 m/day. In comparison, this flow-front velocity had earlier attained ~ 70 m/day (during 19-23 June) and ~ 50 m/day (during 23-30 June). The diminished rate of advance and continuing high-amplitude tremor suggested that perhaps a new lava flow (Lava ##6) had broken out high on the flanks, a conjecture yet to be confirmed by press time. Lava ##5 was still 1.2 km from the steep incline, a point where it could begin rapid descent to the alluvial fan where the highway and petroleum pipeline are located.
Information Contacts: Patricia Mothes, Patricio Ramón, Pete Hall, Daniel Andrade, and Liliana Troncoso, Geophysical Institute (IG), Escuela Politécnica Nacional, Apartado 17-01-2759, Quito, Ecuador (URL: http://www.igepn.edu.ec/); Jeffrey B. Johnson, Dept. of Earth Sciences, James Hall University of New Hampshire, Durham, NH 03824, USA.
Generally, activity shifting from effusive towards explosive
Reventador ceased extruding significant new lava flows in early July 2005. Subsequent activity through this report interval, late September, was manifested as intermittent explosive eruptions. These were characterized alternately as Strombolian activity and short-duration Vulcanian events.
After the post-effusive phase and during the explosive phase a significant Vulcanian event took place at 2058 on 12 September, producing an ash column more than 5 km above the summit. Large bombs were ejected more than 2 km from the vent and small pyroclastic flows were evident in gullies descending from the cone. This event was preceded by more than a week of relative quiescence, indicating that future Vulcanian eruptions may occur with little warning.
This report was submitted by Jeffrey B. Johnson (University of New Hampshire), who collaborated with colleagues including Patricio Ramón, Liliana Troncoso, Guillermo Viracucha, Jaime Lozada, Daniel Andrade, David Rivero, Gorky Ruiz, Pete Hall, and Wilson Enriquez (Geophysical Institute, Escuela Politécnica Nacional, IG-EPN). They adhered to the practice of numerically naming lava flows, for example Lava ##5.
End of significant lava effusions. BGVN 30:05 provided a detailed overview of recent active lavas erupted by Reventador between April 2005 and the end of June 2005. Visits to the caldera on 1 July revealed dramatic diminution in the advance rate of Lava ##5 along the southern caldera margin. Within the first few days of July, Lava ##5 had stagnated. Its furthest extent was ~ 4.5 km from the vent and about 50 m short of the furthest extent of Lava ##4 (erupted in May 2005), which it was overriding.
Since the first few days in July, major lava extrusion had terminated. Despite intermittent MODIS thermal alerts (~ 1 per week from University of Hawaii (HIGP)), no significant lava flows have been directly observed by IG-EPN personnel or reported by the local populace. During July, it is likely that small lava flow(s) (under 1 km in length) were extruded from the southern breach of the cone during short-lived events lasting a few days or less. For instance, a photo taken on 1 August (figure 23) indicates a short, fresh lobe (named Lava ##6), which was no longer incandescent during a night-time visit on 3 August.
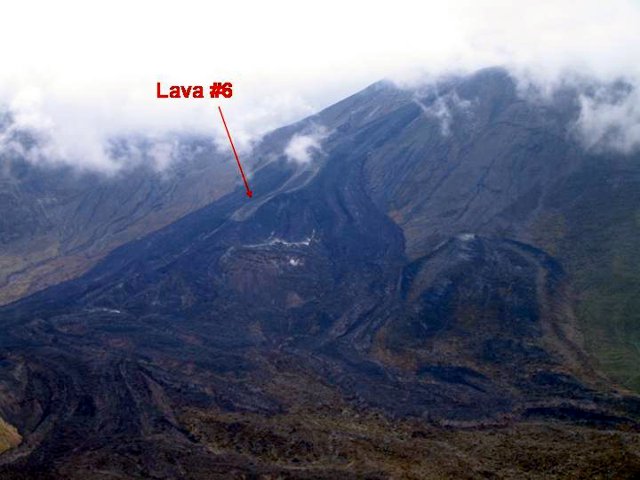 |
Figure 23. Photograph of a fresh lava flow at Reventador on 1 August 2005. The flow, which appears as a white lobe, was stagnant. Courtesy of J. Johnson and the Geophysical Institute. |
Explosive activity. Pyroclastic explosions, which first occurred in early June 2005, continued intermittently until 25 September 2005. Significant Strombolian activity was noted at night by the local populace in the first few days of July, coincident with the decline of Lava ##5 extrusion. In mid-July, explosive activity was minimal, but increased towards the end of the month and during August. Between explosions, voluminous vapor plumes were often observed and loud degassing sounds were often audible, but at times the volcano was also completely silent. Incandescence was also often visible in the cone, suggesting an open-vent configuration. Periods of quiescence separated explosive activity and generally lasted hours to days. Typical eruptive events, which occurred as many as 26 times a day (i.e., on 15 September), are identified clearly by seismic records. These emissions tend to alternate between discrete pyroclastic-laden, ash-rich explosions and extended-duration Strombolian-type fountaining (figure 24). Both types of events were capable of erupting large blocks up and over the crater rim (~ 200 m above the vent), which were often sufficiently massive to be visible from the highway ~ 7.5 km distant.
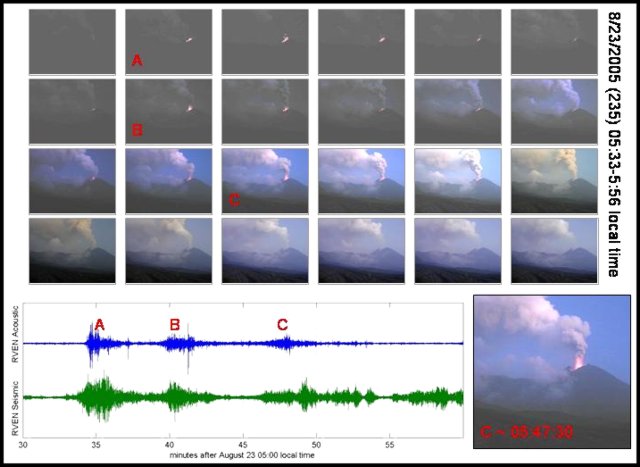 |
Figure 24. Strombolian activity at Reventador depicted in a sequence of still images taken at one-minute intervals along with accompanying infrasonic and seismic traces (signals recorded ~ 1.8 km from the vent). Courtesy of J. Johnson and the Geophysical Institute. |
A period of relative quiescence, marked by an absence of large ash-generating plumes, was evident at the end of August and during first days of September. Vent incandescence was also notably absent during several days up until the large explosion at ~ 2058 on 12 September.
Preceded by a swarm of small volcano-tectonic events, the explosion was manifested by very short-duration transient signals, with arriving infrasonic and seismic waves lasting less than ~ 1 minute. However, peak-to-peak amplitudes the respective signals (~ 211 Pa and 4.9 mm/s) were substantially greater than other explosive events occurring at the volcano during recent months.
As previously mentioned, this short-duration explosion generated a more than 5 km-high ash-cloud and ejected large bombs aerially to more than 2 km. Small pyroclastic flows were confined to gullies on the cone and reached at least 1.5 km from the vent (figure 25).
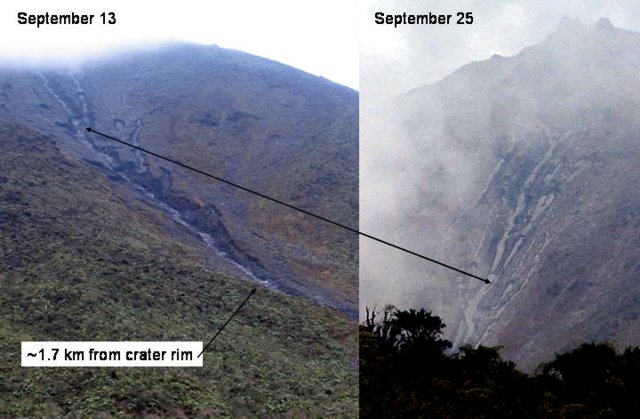 |
Figure 25. Photos of Reventador cone taken 12 days apart (13 and 25 September 2005, from different angles) show the channels and deposits of small pyroclastic flows. Arrow connects same location on cone in both frames. Courtesy of J. Johnson and the Geophysical Institute. |
Since this large event, incandescence has been routinely present in the crater and explosions have occurred with greater frequency (figure 26). Further large explosions occurring in the morning of 24 September were likely responsible for more pyroclastic deposits evident on the upper cone and in upper-flank gullies (figure 25, right-hand photo).
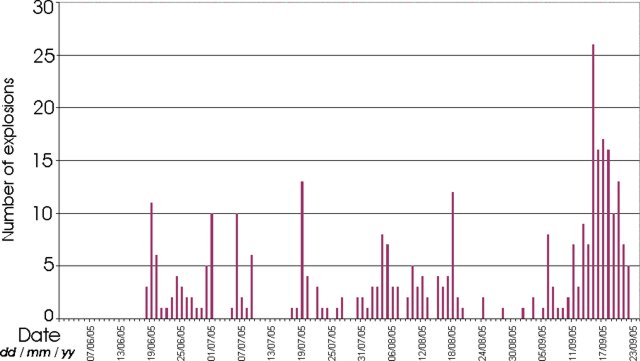 |
Figure 26. Summary of explosion counts at Reventador as identified by the IG-EPN seismic network between 1 June and 23 September 2005. Courtesy of J. Johnson and the Geophysical Institute. |
Monitoring. Reventador continues to be closely monitored by the IG-EPN (figure 27). A telemetered seismic network, consisting of three local short-period seismometers, is used to quantify the eruptive chronology of the volcano, including the quantities of volcano-tectonic events (VT), long-period events (LP), hybrid events, and harmonic and spasmodic tremor, and explosion events. Three temporary stand-alone dataloggers with broad-band seismometers and infrasonic microphones, installed with collaboration from the University of New Hampshire and the University of North Carolina, have supplemented this network throughout the summer.
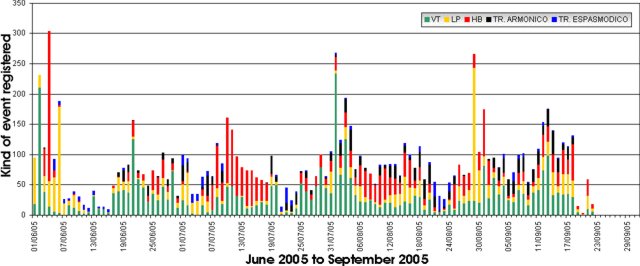 |
Figure 27. Summary of Reventador seismicity since 1 June 2005. Many of the tremor events were associated with vigorous degassing at the vent. Courtesy of J. Johnson and the Geophysical Institute. |
Additionally, field visits by IG-EPN personnel have been conducted regularly. During an expedition on August 28, Differential Optical Absorption Spectroscopy (DOAS) and Forward Looking Infrared (FLIR) measurements were made to assess gas and thermal flux, respectively. DOAS measurements revealed a continuing flux of SO2 estimated at ~ 850 tons/day. The FLIR measurements confirmed near-magmatic temperatures at the vent. It also confirmed stagnation of all lava flows on the volcano since their maximum surface temperatures had cooled into the range of ~ 50°C.
Information Contacts: Jeffrey B. Johnson, Dept. of Earth Sciences, University of New Hampshire, Durham, NH 03824, USA; Patricio Ramón, Liliana Troncoso, Guillermo Viracucha, Jaime Lozada, Daniel Andrade, David Rivero, Gorky Ruiz, Pete Hall, and Wilson Enriquez, Geophysical Institute (IG), Escuela Politécnica Nacional, Apartado 17-01-2759, Quito, Ecuador (URL: http://www.igepn.edu.ec/).
Quiet, January 2006-February 2007; emissions, March-October 2007
Our previous report on Reventador documented intermittent explosive eruptions through September 2005, with Strombolian activity and short-duration Vulcanian events. These events were accompanied by small pyroclastic flows, small lava flows, large bombs, and ash columns (BGVN 30:08). This report discusses reported events into 2008.
According to the Instituto Geofísico (Escuela Politécnica Nacional) (IG), seismicity at Reventador was low at the end of December 2005. There were no reports on this volcano during January 2006 through February 2007. The volcano was apparently only weakly eruptive or non-eruptive around this interval. MODVOLC thermal alerts were absent during late December 2005 to late March 2006.
In early March 2007, however, the IG reported an increase in the number of tectonic earthquakes at Reventador. Steam-and-ash plumes were sporadically visible and occasionally rose to altitudes of 4 km during 8-22 March. On 21 March, noises were reported. The next day, seismic signals changed that indicated possible emissions. On 24 March, local residents saw ash plumes and incandescent material near the crater and heard roaring noises. An explosion produced a plume that rose to an altitude of 6.6 km and drifted W. Based on reports from IG, the Washington VAAC reported an ash plume during 26-27 March that reached an altitude of 3.7-7 km and drifted NE and WNW. A thermal anomaly was present on satellite imagery during 24-27 March.
On 28 March, observers reported roaring noises and an ash column from Reventador that rose to an altitude of 5.6 km and drifted W. A small lava flow traveled 200 m down the S flank. Incandescent material and ash emissions were observed during 29-31 March. On 1 April, ash plumes rose to an altitude of 7.6 km and incandescent rocks were ejected about 50 m above the crater. Incandescent material was again seen at the summit on 2 April. The Washington VAAC reported that a strong hotspot was present on satellite imagery during 1-3 April. Based on pilot reports, IG reported that a steam-and-gas plume with little ash content rose to an altitude of 6.1 km and drifted W on 3 April.
On 3-4 April, incandescent blocks ejected from the summit subsequently rolled down the S flanks. Satellite imagery revealed ash plumes drifting W and a large thermal anomaly over the crater. On 4 April, a plume rose to an altitude of 4.6 km. Crater incandescence was observed on 4 and 6 April and "cannon shots" were heard on 6 April. Ash-and-steam emissions were observed during 8-9 April. Steam emissions from the flanks on 8 April possibly originated from a lava flow.
On 11 April, a steam plume from Reventador rose to an altitude of 3.8 km. Visual observations were hindered during 12-17 April due to inclement weather. On 13 April, the lava flow on the S flank, first observed on 28 March, was 15 m thick and possibly active.
On 18, 20, and 23 April, steam-and-gas emissions from Reventador hung near the summit. On 18 April, a plume was seen drifting NW on satellite imagery. On 20 April, a bluish haze of gases was observed. Clouds occasionally inhibited views of the summit during 18-24 April.
On 27 April, a steam plume from Reventador rose to an altitude of 3.7 km. Later that night, incandescent material was ejected from the crater. On 30 April, a steam plume was observed on satellite imagery drifting NW. Based on the Guayaquil Meteorological Watch Office (MWO) and satellite imagery, the Washington VAAC reported that an ash plume rose to an altitude of 3.7 km and drifted NW. Visual observations were hindered during 25 April-1 May due to inclement weather.
On 16 May, the IG reported that a steam plume from Reventador rose to an altitude of 3.6 km and drifted to the NW. The plume was visible on satellite imagery. On 18 May, strong rains resulted in a lahar that lasted approximately 40 minutes. A lahar was also noted on 22 May. Visual observations were hindered during most of the reporting period due to inclement weather.
On 18 May, an ash plume from Reventador rose to an altitude of 3.7 km and drifted NW. Ash was not observed on satellite imagery. Lahars occurred on the flanks of Reventador on 15, 19, 20, 21, and 23 June. Clouds inhibited visual observations during 20-24 June.
MODVOLC thermal alerts were frequent during late March and throughout April 2007. One alert occurred in late May 2007; two also appeared on 6 August 2007 (local dates and times). No further alerts were issued in data accessed 9 June 2008.
A VAAC report noted an eruption on 11 October 2007. It emitted an ash plume that rose to an altitude of 4.6 km and drifted S. Ash was not observed on satellite imagery due to cloud cover.
Information Contacts: Washington Volcanic Ash Advisory Center, Satellite Analysis Branch (SAB), NOAA/NESDIS E/SP23, NOAA Science Center Room 401, 5200 Auth Rd, Camp Springs, MD 20746, USA (URL: http://www.ospo.noaa.gov/Products/atmosphere/vaac/); P. Ramón, Instituto Geofísico-Departamento de Geofísica (IG), Escuela Politécnica Nacional, Casilla 17-01-2759, Quito, Ecuador.
Eruptions, seismicity, and hot spots in late July and early August 2008
Eruptions from Reventador (figure 28) occurred between March and May 2007, and an ash plume was reported in October 2007. The eruptions were characterized by steam-and-ash plumes that rose to altitudes as high as 7.6 km, thermal anomalies on satellite imagery, roaring noises, and a small lava flow (BGVN 33:03 and 33:04).
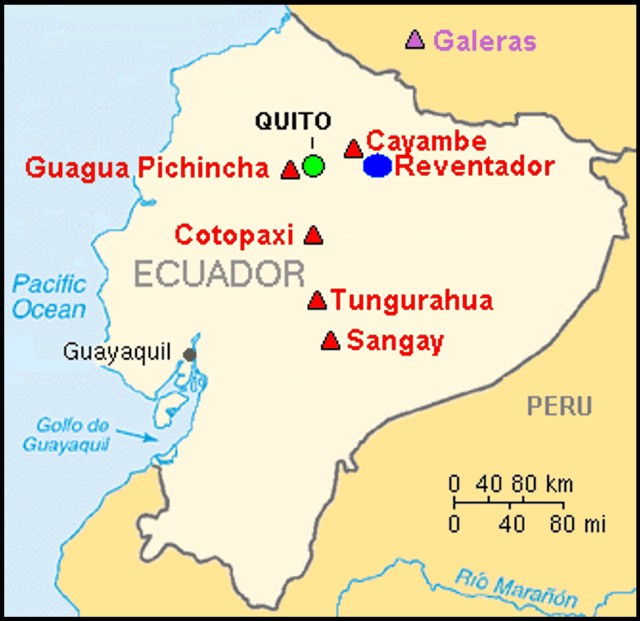 |
Figure 28. Map of Ecuador showing Reventador and selected other volcanoes. Courtesy of USGS. |
MODVOLC thermal alerts were issued on 28 and 31 July 2008 (local dates). Mapping of the MODIS anomaly locations indicated that thermally radiant material was within the crater (no anomalies outside the crater).
According to the Instituto Geofísico-Escuela Politécnica Nacional (IG), seismic activity showed a progressive and constant increase from the beginning of July. The number of earthquakes per day were the greatest on 24 and 25 July. On 27 July continuous seismic tremor was followed by incandescence around the crater. Thermal anomalies were also identified on satellite imagery. In the evening, explosions produced ash plumes and ejected incandescent material that rolled down the flanks. On 28 July ash plumes rose to altitudes of 4-6 km and drifted NW and W; ashfall was reported in Olmedo, ~ 50 km NW. On 29 July, ash-free steam plumes rose from the crater and drifted NW, and a sulfur smell was noted near the volcano. A lava flow directed S from the caldera halted but the location of the flow front was ambiguous in the reporting.
According to the IG, seismicity from Reventador decreased during 30-31 July, and remained low thereafter. A lava flow within the caldera was observed. On 31 July, steam-and-gas plumes with a low ash content were detected on satellite imagery and drifted W and SW. On 1 August, steam-and-gas plumes were emitted and a lava flow in the caldera was noted. Diffuse ash emissions were noted on 2 August. On 3 August, IG scientists observed the lava flow in the caldera and estimated that it advanced at a rate of 100 m per day. They also heard sporadic roaring noises.
On 2 August, the Washington Volcanic Ash Advisory Center (VAAC) began to advise that light ash and gas was being emitted. An occasional hotspot was observed on 3 August. By 4 August, the VAAC reported that emissions had ceased and seismicity was decreasing.
According to the IG, during 5-8 August, gas-and-steam plumes were noted. By 7 August the lava flow had ceased. On 8 August, incandescence from the crater was observed at night. There were no further reports through 1 October.
During July-August 2008 the government did not believe the risk to human health was sufficient to increase the alert status or evacuate the residents. However, officials activated some emergency responses in nearby towns.
Information Contacts: P. Ramón, Escuela Politécnica Nacional, Casilla 17-01-2759, Quito, Ecuador (URL: http://www.igepn.edu.ec/); Washington Volcanic Ash Advisory Center, Satellite Analysis Branch (SAB), NOAA/NESDIS E/SP23, NOAA Science Center Room 401, 5200 Auth Road, Camp Springs, MD 20746, USA (URL: http://www.ssd.noaa.gov/).
Lava extrudes down two flanks during November 2008-April 2009
Our previous report covered activity through early August 2008, a period that included extrusions of lava flows (BGVN 33:08). This report continues through late April 2009, including a hiatus for much of August into November 2008. In early November observers saw repeated small eruptions emitting plumes with generally minor ash, Strombolian eruptions, and lava flows down two flanks. What follows summarizes reports from the Instituto Geofísico-Escuela Politécnica Nacional (IG).
The last paragraph of the main section of this report discusses an important temporal and spatial correlation made at the volcano on 23 April 2009. The IG correlated satellite thermal data and ground-based observations with high tremor and acoustical noise.
An IG daily report issued 8 August 2008 noted a lack of movement in the lava flows and the emission of gas plumes without ash. That night, glow was observed from the crater. On 18 August, amid rainy conditions, a possible lahar was noted. Except for ongoing seismicity, relative calm prevailed until early November.
The IG noted glow from the crater the night of 7 November, an observation confirmed in satellite thermal data. At 1900 on 8 November high-amplitude seismic signals saturated the seismic stations. Local observers saw an ash-and-steam column that evening to 2 km above the crater. The ash content was moderate. Another IG report noted that in the settlements of Chaco and Quijos residents could hear strong explosions and see gas plumes with low ash content. A pilot report stated the plume blew NW and reached an approximate estimated altitude of 7.6 km.
Special Report 6 (9 November) included a plot of seismicity since 1 February 2007 (figure 29). Long-period (LP) earthquakes began to dominate in March 2008 and the large spike around 8-9 November 2008 was outstanding compared to the recent pattern. Another larger spike in seismicity had been seen during mid-March 2007, but it was composed of volcano-tectonic (VT) earthquakes.
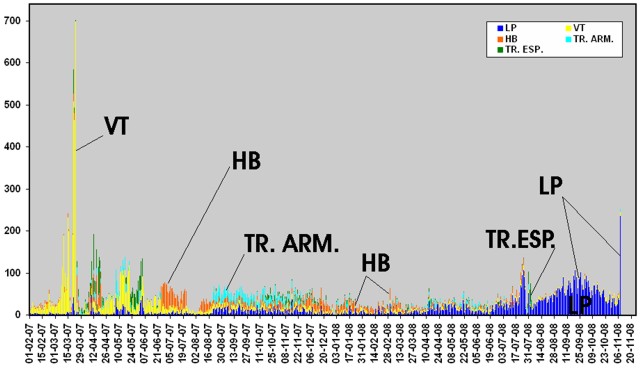 |
Figure 29. A histogram of daily seismicity for Reventador during 1 February 2007 to 8 or 9 November 2008. The plot includes harmonic tremor (TR. ARM.) and special kinds of tremor (TR. ESP.) in addition to more typically plotted event types (LP earthquakes, VT earthquakes, and hybrid (HB) earthquakes). Courtesy of IG (from their Special Report No. 6, issued 9 November 2008). |
A follow up report on 11 November stated that Reventador had discharged moderate strombolian explosions on 9-10 November, with ongoing lava flows on the N and S flanks of the central cone. Both the summit eruptions and the flank flows were conspicuous at night.
SO2 emissions were clear in Aura/OMI imagery of 9 and 10 November (figure 30). About a day later, Reventador calmed considerably (with seismicity dropping strongly after 1000 on 11 November). The escalating activity drove IG to install two more seismometers, two infrasonic sensors, and a monitoring camera.
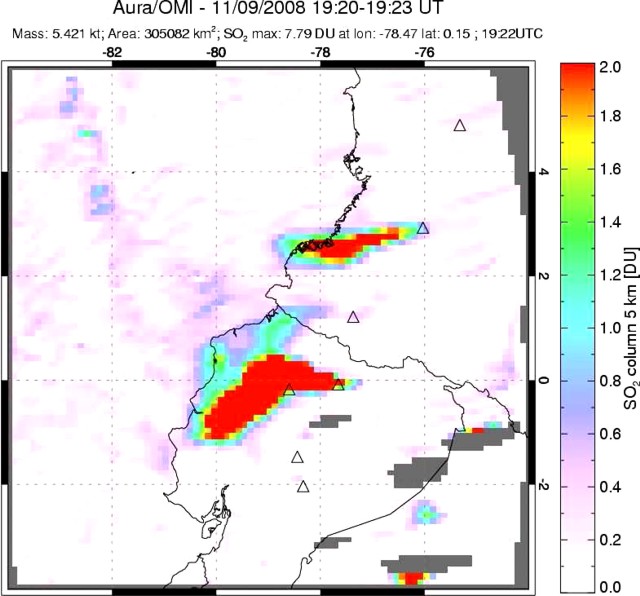 |
Figure 30. Spectroscopic measurements of SO2 taken by the Aura/OMI satellite on 9 November 2009 from eruptions at Reventador. The smaller plume to the N is from Galeras. Courtesy of Simon Carn and the OMI Sulfur Dioxide Group. |
The IG's Special Reports of 10 and 11 November (Numbers 7 and 8) offered further information. Lava flows had descended to below 2,600 m elevation (the summit is at 3,562 m elevation but the vent elevation was not stated). During the night of 9 November incandescent ejecta rose 100 m above the crater, along with continuous roars and canon-shot noises. Although light ash fell in Cayambe on 9 November, other towns in the region had not been affected. Strombolian emissions had calmed some on the night of 10 November. After 1000 on 11 November, both gas emissions and seismicity calmed.
Seismicity increased starting on 15 December 2008, and remained elevated through 8 January 2009. During 3-8 January there were almost constant gas emissions (with ash contents moderate to low), small-to-moderate explosions, and tremor lasting several hours. The tremor was accompanied by roaring noises and the ejection of blocks that landed near the summit. Explosions and emission tremors were of variable intensity, causing windows in nearby towns to vibrate. Ash rose 2 km above the summit and drifted W, causing ashfall in the towns of El Manzano, Choglontus, Palictahua, and Cahuají.
After 8 January 2009, the IG reported the steady decrease of seismic activity. There were a few explosions and water vapor emissions with low ash content reaching heights of 1-1.5 km above the crater. These plumes drifted W and SW, with reported minor ashfall in the towns mentioned above. Associated with these emissions, observers heard sporadic roaring noises. Seismic activity continued to decrease during the latter part of January 2009 and into February 2009. Although in mid-February 2009 there was a mild increase in seismicity, overall the level remained low. A single observation revealed the presence of a small column of steam and gas.
During 16-22 February seismic activity remained low, with few seismic events and signals associated with fluid movements at depth. The number of rockfalls was significant, even compared to that seen during cooling of the lava flow from November 2008. During this week there were various episodes of harmonic tremor and explosions. During 23 February-15 March 2009 there was a slight increase in the number of low-intensity seismic events attributed to fluids at depth. There was a later decrease in seismicity.
IG's 2009 Special Report Number 1 (26 March) noted a seismic increase on 26 March, which they again attributed to fluids moving within the volcanic edifice. After 1000 on the 26th, instruments detected a seismic swarm consisting of both LP and hybrid earthquakes, intercalated with banded tremor, the later of which had a 4-hour duration. From past experience, the IG inferred these signals could reflect the onset of new lava approaching the surface.
Special Report Number 2 (23 April) noted that later on the 26th the signals dropped off and remained low through at least early 23 April. Despite low seismicity, there were both episodes of banded tremor and intercalated LP earthquakes.
The tremor was of variable amplitudes, including some that saturated local seismic stations, particularly between 0500 and 0700 on 23 April 2009. On that day, a low, gas-rich cloud blew W from Reventador. Several residents living near the volcano also heard loud noises. A satellite-detected thermal hotspot on the volcano beginning at 0300 continued, with high intensity, between 0500 and 0700. The presence of the highest intensity thermal anomalies coincided with the highest tremor amplitudes and audible noises. Multiple MODVOLC thermal alerts were detected on 24-25 April and on 8 and 10 May 2009.
Information Contacts: Geophysical Institute (IG), Escuela Politécnica Nacional, Apartado 17-01-2759, Quito, Ecuador (URL: http://www.igepn.edu.ec/); Simon Carn, Dept of Geological and Mining Engineering and Sciences, Michigan Technological University, 1400 Townsend Dr., Houghton, MI 49931, USA (URL: https://so2.gsfc.nasa.gov/); Hawai'i Institute of Geophysics and Planetology (HIGP) Thermal Alerts System, School of Ocean and Earth Science and Technology (SOEST), Univ. of Hawai'i, 2525 Correa Road, Honolulu, HI 96822, USA (URL: http://modis.higp.hawaii.edu/).
Lava flows seen and SO2 fluxes recorded during 16-17 September 2009
Activity at Reventador between August 2008 and late April 2009 was a period of generally low seismicity (BGVN 34:03). During early November 2008 repeated small eruptions occurred with steam-and-ash plumes, Strombolian eruptions, and lava flows. This report continues coverage through October 2009, an interval that included new lava flows advancing ~ 500 m by mid-September 2009.
Based on analysis of satellite imagery, the Washington Volcanic Ash Advisory Center (VAAC) reported that on 1 May a thermal anomaly over Reventador occurred along with a possible low plume drifting W. The Instituto Geofísico-Escuela Politécnica Nacional (IG) reported to the VAAC the presence of lava and gas emissions and possible smoke from burning vegetation, but little to no ash.
On 15 May, the IG observed an ash emission, although neither an ash signature nor a thermal anomaly was detected in satellite imagery. On 26 May, a diffuse ash plume rose to an altitude of 6.4 km and drifted SW. Thermal anomalies were intermittently seen on satellite imagery.
On 21 July-3 August, tremor was sporadic. On 4 August, seismicity increased and periods of tremor frequently saturated the seismic stations. Thermal anomalies, detected in satellite imagery on 1 and 2 August, became more intense on 4, 5, and 10 August. On 6 August, a steam plume rose 1.2 km above the crater and drifted W. Incandescent blocks were ejected from the crater and fell onto the flanks. Thermal images taken from a location 7 km E of Reventador revealed a linear area of higher temperatures, confirming the presence of a new lava flow on the S flank. Incandescence in the crater was seen on 9 August. According to the Washington VAAC, based on information from the IG, an ash plume on 15 August rose to an altitude of 3.6 km and drifted NW.
Field observations on 16-17 September 2009. IG scientists visited Reventador during 16-17 September 2009; among their objectives was to map, sample, and collect thermal images of the new lava flows and to measure the sulfur dioxide (SO2) concentrations with a mobile DOAS.
The team noted that recent lava flows had descended the flanks in a SE to E direction, continuing the same pattern that had begun with the 2005 eruption (figure 31). A dome within the crater showed constant growth (figure 32). Gas was emitted to a height of less than 200 m and drifted mainly W. A small lava flow originating in the dome area had descended ~ 500 m from the cone's S flank.
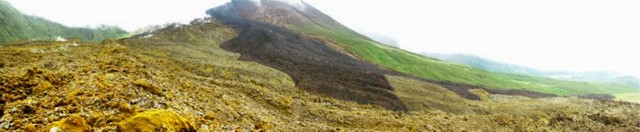 |
Figure 31. Panoramic view from the sequential camera of lava flows at Reventador. Courtesy of S. Vallejo. |
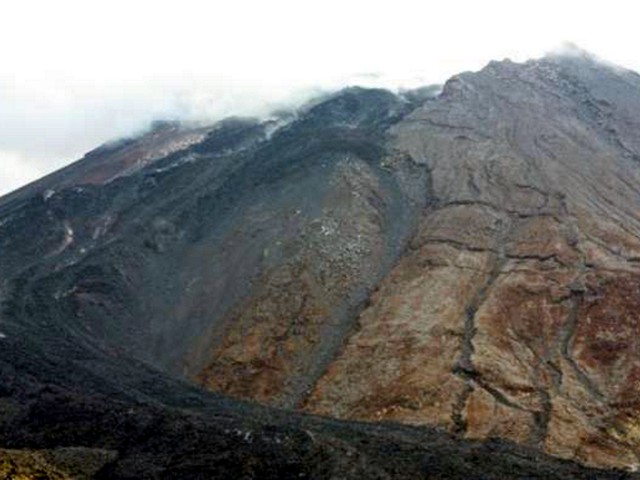 |
Figure 32. At Reventador, a photo taken on 16-17 September 2009 of the actively growing dome in the summit crater. Courtesy of J. Bourquin. |
Thermal images and SO2 measurements were collected near the caldera, and lavas were sampled. SO2 flux measurements (table 4) were collected both by helicopter and by car (figure 33). A telescope for the SO2 measurements sat below the helicopter blades and those spinning blades may have interfered with the measurements. The values presented may thus underestimate the SO2 fluxes.
Table 4. Reventador SO2 data collected from helicopter on 16 and 17 September 2009. The transects in the first column are indicated on figure 33. Transect 34 measurements clearly indicated that the SO2 gas plume had divided (bifurcated) and the two plumes appear as 34a and 34b. For this transect, the SO2 fluxes were calculated separately for each lava plume segment, than added to get the total emission. Land-based measurements, transects 43 and 46, were collected S and W of the vent. Courtesy of IG.
| Transect/Route | Wind speed (m/s) | Wind direction | Data number | Offset | SO2 flux (t/d) | Plume Width | Traverse Length | Intensity Limit |
| 31 | 5 | 281 | 191 | -28 | 811 | 1.9 km | 52.2 km | 7 |
| 34a | 5 | 270 | 95 | -1 | 1,425 | 3.6 km | 22.2 km | 7 |
| 34b | 5 | 326 | 124 | -8 | 795 | 2.5 km | 49.2 km | 7 |
| 34 Total | -- | -- | 215 | -- | 2,220 | -- | -- | -- |
| 35 | 5 | 337 | 84 | -28 | 616 | 1.6 km | 22.8 km | 5 |
| 36 | 5 | 349 | 147 | -16 | 557 | 2.1 km | 30.2 km | 8 |
| 43 | 5 | 202 | 471 | -14 | 283 | 5.2 km | 42.8 km | 5 |
| 46 | 5 | 236 | 1222 | -14 | 1,264 | 16 km | 116 km | 5 |
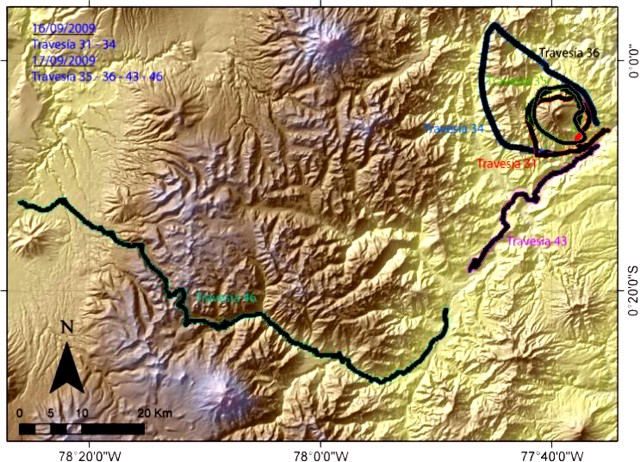 |
Figure 33. Map of Reventador illustrating transects made (in colored version, each transect is in a different color). Transects 31 and 34 were conducted on 16 September; transects 35, 36, 43 and 46 were conducted on 17 September. Courtesy of IG. |
Based on a pilot observation, the Washington VAAC reported that on 21 September a plume rose to an altitude of 7.6 km. An ash plume on 4 October drifted W. In both cases, ash was not seen in satellite imagery, although meteorological clouds were present. In the latter case, an occasional thermal anomaly was observed.
Thermal anomalies over the crater area were detected in MODIS satellite imagery on 6, 11, and 13 October. On 13 October, the OMI satellite sensor indicated that the SO2 concentration in the atmosphere near the volcano had increased. On 14 October, seismicity increased and harmonic tremor was detected. A seismic station located at ~ 2,600 m elevation on the NE flank of the cone detected rockfalls. Several people living in the area reported roaring noises and had observed slight incandescence from the crater during the previous few nights.
During an overflight on 16 October, scientists saw the lava dome and a lava flow on the NE flank (figure 34). Bluish gases were being emitted. According to a thermal camera, the incandescent parts in the crater were about 300°C. Other observers heard roaring noises and sounds resembling "cannon shots." Incandescent blocks were ejected from the crater, and steam and gas rose 100 m and drifted SW. Incandescent material was seen on the S flank.
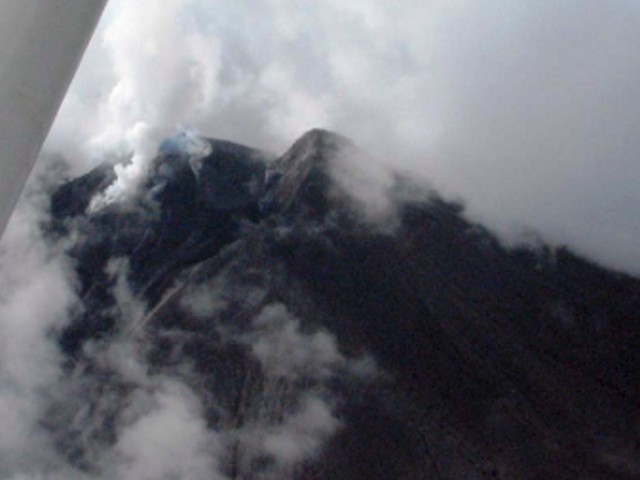 |
Figure 34. Aerial photo taken on the N side of Reventador on 16 October 2009 showing the lava dome amid weather clouds and some heavy steaming from the NE-flank lava flow. Courtesy of IG. |
On 17 October, long period (LP) earthquakes and volcanic explosions lasting up to 10 hours were registered, incandescence on the S flank was noted, and noises similar to the previous day were again heard. A small gray plume was seen the next day. On 19 October, thermal anomalies were again detected on satellite imagery. During an overflight, blue gas plumes containing SO2 were seen (figure 35). The lava flow on the S flank occupied a large area and was divided into two branches.
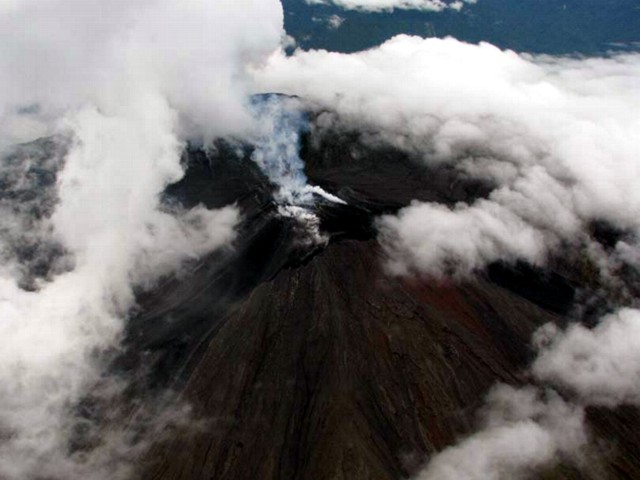 |
Figure 35. Photograph of the E side of Revantador's cone taken the morning of 19 October 2009. Note steam rising from dome summit and lava flows on volcano's flanks. Courtesy of IG. |
According to the IG, on 21 October, steam-and-gas plumes with little to no ash rose 2-4 km above the crater and drifted in various directions. An explosion that day ejected incandescent material from the crater and blocks rolled down the flanks. On 22 October, a few explosions generated ash-and-steam plumes that rose 4 km. Observations during an overflight revealed a small lava flow on the N flank and a larger flow with four branches on the S flank (figure 36). Part of the lava dome base had disappeared and small spines were present, especially on the S side of the dome. Thermal images revealed that material in the crater was 400°C and the lava-flow fronts were 250°C. Cloudy weather prevented visual observations during 23-26 October. Roaring noises were heard on 25 October.
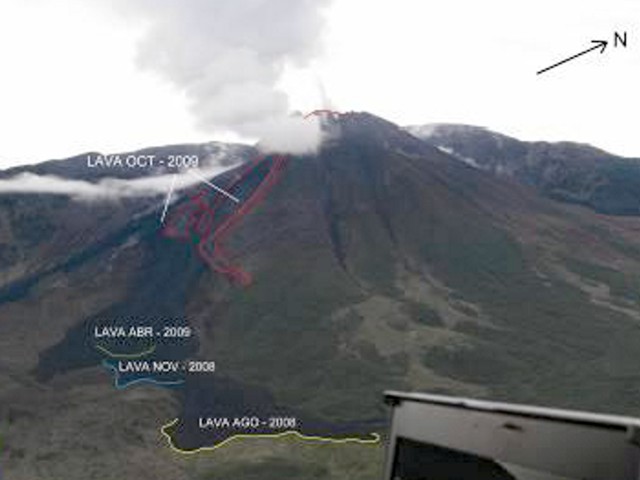 |
Figure 36. Aerial photograph displaying the distribution of lava flows on the N side of Reventador's caldera on 22 October 2009. Courtesy of S. Vallejo. |
Information Contacts: Geophysical Institute (IG), Escuela Politécnica Nacional, Apartado 17-01-2759, Quito, Ecuador (URL: http://www.igepn.edu.ec/); Washington Volcanic Ash Advisory Center, Satellite Analysis Branch (SAB), NOAA/NESDIS E/SP23, NOAA Science Center Room 401, 5200 Auth Rd, Camp Springs, MD 20746, USA (URL: http://www.ospo.noaa.gov/Products/atmosphere/vaac/); Hawai'i Institute of Geophysics and Planetology (HIGP) Thermal Alerts System, School of Ocean and Earth Science and Technology (SOEST), University of Hawai'i, 2525 Correa Road, Honolulu, HI 96822, USA (URL: http://modis.higp.hawaii.edu/).
Dome growth; lava and pyroclastic flows; lahar takes bridge
Reventador discharged a series of small eruptions and lava flows during 2007-2009 (BGVN 33:04; 33:08; 34:03; and 34:09). Our last report (BGVN 34:09) discussed events through 26 October 2009. Since then seismicity generally remained moderate to low through at least April 2012, and ash emissions accompanying lava-dome growth intermittently occurred. Much of this report stems from work by the Instituto Geofísico-Escuela Politécnica Nacional (IG). The andesitic volcano contains a 4-km summit caldera that opens to form a large U-shaped scarp that funnels material SE (see map in BGVN 28:06). A VEI 4 eruption on 3 November 2002 (BGVN 27:11) occurred unexpectedly after a 26-year repose.
During this reporting interval, October 2009-April 2012, small plumes with occasional ash emissions accompanied dome growth (table 5). In August 2011, the top of the growing lava dome first reached the same height as the highest part of the rim. MODVOLC thermal alerts, which are satellite based using the MODIS instrument, were absent during 2011, possibly due to masking effects of cloud cover. The two tallest plumes noted in table 5 rose to approximately 7 km altitude. In addition, as discussed below in text, pyroclastic flows were also seen during the reporting interval. Lahars were common, including one that destroyed a bridge over a river on the SE flank on 25 May 2010.
Table 5. Summary of behavior and plumes at Reventador between mid-October 2009 and 18 April 2012. Some aspects of the October 2009 activity were previously reported (BGVN 34:09). Cloud cover frequently prevented observations of the volcano, and minor plumes may not have been recorded or were omitted. Heights above crater were converted to altitude by adding the summit elevation of 3.6 km. '-' indicates data not reported. Data provided by the Instituto Geofísico-Escuela Politécnica Nacional (IG), the Guayaquil Meteorolgical Watch Office (MWO) in Ecuador, and the Washington Volcanic Ash Advisory Center (VAAC).
| Date | Plume altitude (km) | Plume drift direction | Remarks |
| 14 Oct 2009 | -- | -- | Increased seismicity and harmonic tremor. Residents during the middle of October heard roaring and booming noises and saw glowing. |
| 16-17 Oct 2009 | -- | -- | An IG field party saw a lava flow on the cone's S flank on the 16th and 17th. An overflight on the 16th also revealed a lava flow on the N flank. |
| 19 Oct 2009 | -- | -- | An areal infrared (FLIR) camera took images of S flank lava flows that covered a large area. A plume with little or no ash rose to 7.5 km altitude and drifted NW, W, and S. An explosion ejected glowing material from the crater and blocks rolled down the flanks. |
| 21-22 Oct 2009 | -- | -- | Aerial infrared observations again imaged the N flank lava flow, and detected multiple lobes in the S-flank flows. A part of the lava dome's base had been removed but the dome itself had gained some small spines, especially towards the S. Material near the crater had temperatures up to 400°C. |
| 05 Nov 2009 | 7 | NE | Pilot report. Ash not seen in satellite imagery, although weather clouds were present. |
| 07 Nov 2009 | 4 | -- | -- |
| 14 Nov 2009 | -- | 10-20 km W, WNW | -- |
| 20 Nov 2009 | 6.1 | -- | -- |
| 18 Feb 2010 | -- | -- | Ash not identified in satellite imagery. |
| 08 Apr 2010 | 4.6-6.7 | W | Pilot report. Cloud cover prevented satellite observation. |
| 20-23 Apr 2010 | 4.9-5.5 | S | 200-m-long pyroclastic flow seen during IG flight on 20th (see text). Plume height and direction from aviation reports on 23rd. |
| 26 Apr 2010 | 4 | -- | -- |
| 29 Apr 2010 | -- | -- | Low ash content. |
| 07 May 2010 | 5.2 | -- | Pilot report. Cloud cover prevented satellite observation. |
| 08 May 2010 | -- | -- | IG reported lahars including some that later destroyed a bridge over Marker river (see text). |
| 30 Aug 2010 | -- | -- | Pilot report. Ash not seen in satellite imagery. |
| 09 Sep 2010 | 5.5 | -- | Pilot report. |
| 28 Sep 2010 | 5.6 | NW | Ash fell on Reventador amid seismic episodes (see text). |
| 30 Sep 2010 | -- | NW | Satellite detected diffuse plume but no ash. IG reported ash over Reventador. |
| 06 Oct 2010 | -- | NE | Steam plume also emitted that day. |
| 02 Nov 2010 | 4.6 | -- | Cloud cover prevented satellite observation. |
| 04 Jan 2011 | 5.2 | -- | Ash not detected by satellite, and no reports of ashfall. IG later inferred extensive dome growth during 2011 (see text). |
| 14 Jul 2011 | -- | -- | An IG flight revealed the dome's top had reached as high as the highest point on the rim. Plumes were continuous though fumarolic (probably not ash bearing). Seismicity had started in May 2011 but became more pronounced around the start of July. |
| 03-09 Aug 2011 | -- | -- | Cloud cover hid the lava dome but IG seismic instruments recored both long-period and explosion earthquakes. |
| 06-07 Jan 2012 | -- | -- | IG field inspection revealed constant steam-and-gas emissions a lava dome that rose ten's of meters above crater rim. |
| 11 Feb 2012 | 5.2 | NW | Pilot report. IG noted that on the 12th, seismicity increased a lava flow was detected on the NE flank. |
| 16 Feb 2012 | -- | 19 km SE | Ash detected by satellite. |
| 18 Feb 2012 | 3.6 | -- | -- |
| 26 Mar 2012 | -- | 25 km NNW | -- |
| 18 Apr 2012 | 5.6 | NW | -- |
On 20 April 2010, IG scientists flying over Reventador saw an explosion that generated a pyroclastic flow. It traveled ~200 m down the S flank. Recent deposits from earlier pyroclastic flows were also seen on the same flank. Steam-and-gas emissions also continued. On 8 May 2010, IG noted a small lahar inside the caldera.
On 25 May a destructive lahar took place that was detected for 90 minutes by the seismic network. It traveled down the SE flank and destroyed a bridge over the Marker River, ~8 km SE of the summit area. The loss of the bridge disrupted travel along Route E45 between Baeza (~34 km SSW) to Lago Agrio (also called Nueva Loja, ~121 NE).
On 28 September 2010, IG recorded three seismic episodes from Reventador. Cloud cover prevented observations during the first episode. The second seismic episode was accompanied by a steam plume containing a small amount of ash that rose 400-500 m above the crater. The third episode occurred in conjunction with a steam-and-ash plume that rose 2 km above the crater. Ash fell on the flanks.
In May 2011, seismicity began to increase and became more pronounced by early July.
During an overflight on 14 July 2011, IG scientists noted that the lava dome at the top of the 2008 cone had continued to grow (figures 37 and 38). The dome had reached the same height, or higher, as the highest part of the crater rim formed during 2002 (figures 37 and 38). Intense fumarolic activity produced continuous plumes.
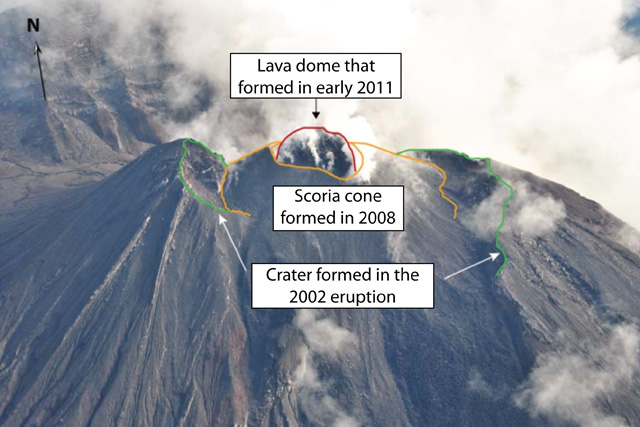 |
Figure 37. Annotated photo of Reventador taken looking NW on 14 July 2011. The green lines trace the topographic margin of the summit caldera initially formed in the sudden 2002 eruption. The conical structure outlined in orange is a scoria or tephra cone (which includes some lavas) and spills out of the breach toward the viewer. The red line outlines the dome, initially seen in 2004, that grew substantially in 2011. Courtesy of J. Bustillos/Instituto Geofísico-Escuela Politécnica Nacional. |
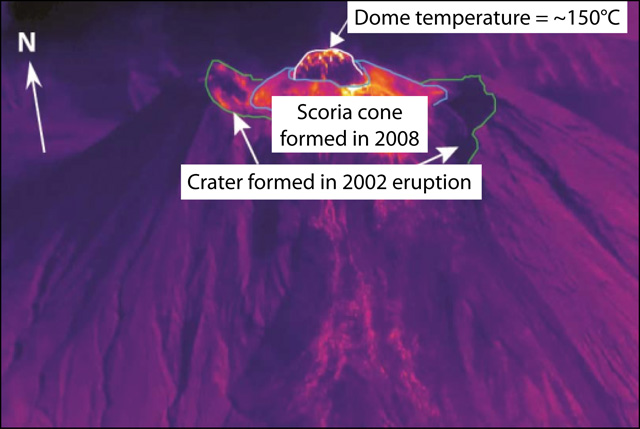 |
Figure 38. Thermal image of Reventador crater for comparison with the visual image (figure 37), also taken 14 July 2011. The measured temperature of the growing dome was ~150°C. Courtesy of S. Vallejo/Instituto Geofísico-Escuela Politécnica Nacional. |
During 3-9 August cloud cover prevented observations of the lava dome, but the seismic network detected long-period and explosion-type earthquakes.
During a field trip on 6-7 January 2012, IG staff observed constant emissions of gas and steam that originated from the growing lava dome. At this point in time the dome had broadened and stood a few ten's of meters above the crater rim.
During 10-13 February 2012, IG detected new activity, including a thermal anomaly, an ash plume, and crater incandescence. This elevated activity continued during 15-21 February. Incandescence near the summit was again observed during 25-26 March but seismicity decreased around this time.
In accordance with these other observations, occasional MODVOLC thermal alerts were posted. Between 1 November 2009-1 April 2012, there were 12 days with MODVOLC thermal alerts. No thermal alerts were detected in 2011. As of 26 April 2012, six days in 2012 had thermal alerts (10, 13, 22, 26 February, 18 March, and 26 April).
Information Contacts: Instituto Geofísico-Escuela Politécnica Nacional (IG), Casilla 17-01-2759, Quito, Ecuador (URL: http://www.igepn.edu.ec/); Guayaquil Meteorological Watch Office (MWO); Washington Volcanic Ash Advisory Center (VAAC), Satellite Analysis Branch (SAB), NOAA/NESDIS E/SP23, NOAA Science Center Room 401, 5200 Auth Rd, Camp Springs, MD 20746, USA (URL: http://www.ospo.noaa.gov/Products/atmosphere/vaac/); Hawai'i Institute of Geophysics and Planetology (HIGP), MODVOLC Thermal Alerts System, School of Ocean and Earth Science and Technology (SOEST), Univ. of Hawai'i, 2525 Correa Road, Honolulu, HI 96822, USA (URL: http://modis.higp.hawaii.edu/).
Lava dome's summit rises above rim in late 2012
The last report on Reventador covered activity through 26 April 2012 (BGVN 37:03) and this one covers activity through April 2013.
In its Special Report of 9 November 2012, Ecuador's Instituto Geofísico-Escuela Politécnica Nacional (IG) summarized the new phase of activity that began in February 2012. The Special Report noted that lava flows traveled as far as 2 km from the crater down the N and S flanks. Later reports noted that in November-December 2012, lava flows reached 1.3 km in length; in January 2013 they reached up to 1.1 km in length. During this reporting interval, ash plumes rose as high as 5.2 km altitude both in August 2012 and November 2013.
The lava dome in the interior of the crater continued to grow and between November 2012 and January 2013 established a new summit that reached to at least 100 m above the E rim, having completely filled the crater developed in November 2002. This enabled blocks from the lava dome to roll down the flanks.
Table 6. A non-comprehensive synthesis of Reventador's steam and ash plumes generated during the reporting period. Courtesy of IG and the Washington VAAC.
| Date | Plume altitude OR height above (3.5 km a.s.l.) rim / direction / distance | Comments |
| 11 Aug 2012 | Ash plume rising to 5.2 km trended W | -- |
| 20 Sep 2012 | Ash plume drifted 22 km SW | -- |
| 17-18 Oct 2012 | Steam and gas plume rose to 1 km and trended W | -- |
| 3-4 Nov 2012 | Steam and ash plume rose to 3 km above the crater. | -- |
| 5 Nov 2012 | Steam and ash plume rose to 3 km; ash plume rose to 2 km and drifted NW | -- |
| 13 Nov 2012 | Gas and ash plume rose to 5.2 km and drifted SE | -- |
| 16 Nov 2012 | Ash plume rose to 4 km above the rim and drifted W and NW | Ashfall reported between Reventador and El Chaco (35 km SSW) |
| 22 January 2013 | Gas and steam plume rose 1.5 km above the crater; white-to-light grey plumes rose 2 km and drifted W | -- |
| 24 January 2013 | Steam and ash plume rose 2 km | -- |
| 29 January 2013 | Gas plumes rose as high as 1 km and drifted NW and W | -- |
| 29 January 2013 | Overflight revealed steam and ash plume rising to 1.5 km above the lava dome; | -- |
| 4 February 2013 | Ash plume rose to 4 km and drifted NW | -- |
| 7 February 2013 | Ash plume rose to 3 km and drifted S | -- |
| 2 March 2013 | Ash plume rose to 4 km and drifted SW | -- |
| 8 March 2013 | Steam emission rose to 500 above the crater | Glow reported |
| 12 March 2013 | Emission rose to 2 km and drifted W | -- |
| 13 March 2013 | Ash plumes rose to 3 km | -- |
| 16 March 2013 | Ash plume rose to 1 km and drifted W | -- |
| 31 March 2013 | Steam emission rose to 500 above the crater and trended W | -- |
| 8 April 2013 | Emissions reached to 3 km above the crater | -- |
| 12 April 2013 | Steam emissions reached to 2 km | -- |
Between late April and early August 2012, activity at Reventador remained moderate, and although cloud cover often obscured visual observations, there were occasional reports of steam emissions rising to as high as 1 km above the crater. Long-period (LP) earthquakes occurred with moderate-to-high intensity, a behavior interpreted as the movement of fluids at depths. Seismic signals attributed to rock fall were also prominent, inferred to come from lava flows that descended the N flank, as aerial observers witnessed on both 29 May and 4 June.
Based on analysis of satellite imagery, the Washington Volcanic Ash Advisory Center (VAAC) reported that on 12 August they detected a well-defined thermal anomaly. Thermal images obtained in overflights carried out on 17 and 18 October 2012 revealed a lava flow that descended the flank of the cone and verified that another flow had descended during the preceding days or weeks and at the moment of observation was still warm. The flows did not exceed 1 km in length, and in light of their location within the crater, were not a danger to the public (figure 39).
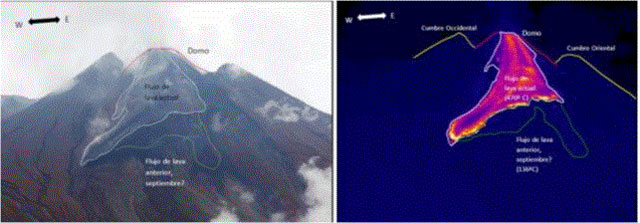 |
Figure 39. A) On the left photo, the S flank of Reventador seen on 19 October 2012. A lava flow descending on the upper flank covered much of the flows from previous days and weeks. At right is a corresponding thermal image, permitting definition of the extent of the new hotter flows. Photo and image, courtesy of P. Ramon (Instituto Geofisico). |
On 17 and 18 October, IG also verified the presence of a previously known lava dome within the crater, with steep slopes, the top of which was then the highest point of the volcano. Similar observations were carried out on 19 October by IGEPN technicians maintaining the monitoring network, who also stressed the continuous flow of lava blocks spilling off both the fronts of new flows and from the lava dome.
During 31 October-11 December 2012, the IG reported that although cloud cover often prevented visual observations, ash plumes were often seen.
Seismicity increased during this time period. Around 5 November, the seismic network detected an increase in the magnitude of volcanic tremor. IG reported that seismicity indicated falling rock and explosions during 14-15 November. Beginning 16 November IG's seismic network indicated a significant increase in tremor and in signals indicative of emissions and explosions. IG reported that scientists aboard an overflight on 23 November observed intense fumarolic activity and a new crater at the summit of the dome, which contained ash and large blocks. A thermal camera measured temperatures at the dome of ~ 300°C. Lava flows continued to be active on the dome flanks, and elongated block-and-ash deposits were also visible on the flanks. IG reported high seismicity during 5-11 December 2012, indicating multiple explosions almost daily. At least one lava flow was generated between November - December 2012 that descended the N flank to ~1.3 km in length.
2013. Throughout this January-April 2013 reporting period, cloud cover often prevented visual surface observations. The lava dome grew between November 2012 through January 2013 to at least 100 m above the E rim, completely filling the crater generated by the eruption of November 2002. Between November 2002 and 31 January 2013, ~ 20 lava flows had traveled down the N, SE, and S flanks, and affected zones within the caldera.
IG reported moderate seismicity during 16-21 January 2013. During the morning of 22 January seismicity, including tremor, increased significantly, signals indicating that rock falls were detected. Low frequency, high-energy tremor was detected by seismic stations around the volcano with an average of 20 seismic events and an average of 29 explosions. Explosions were heard. Lava flows traveled down the SW and N flanks. Observers reported lava fountains in the crater and lava flows on the flanks, both of which became more intense at 1800. Explosions produced white-to-light-gray plumes that rose 2 km and drifted W (figure 40).
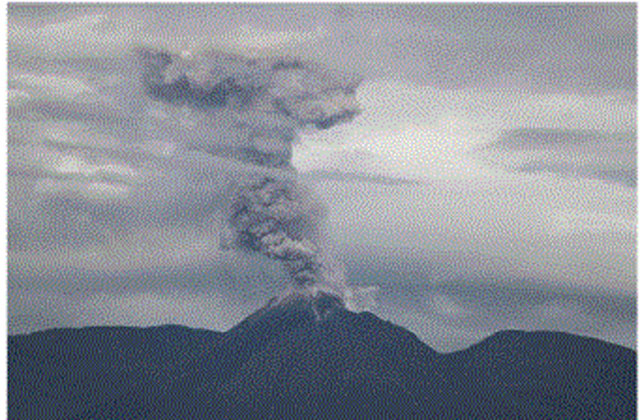 |
Figure 40. Emission column seen late in the day on 22 January 2013 associated with the explosive activity at Reventador. Courtesy Walter Garcia Synohidro and Instituto Geofisico. |
During the night of 22 January a lava flow descending the SE flank had reached a width of 350 m and extended at least 1.1 km (figure 41). Other smaller lava flows up to 200 m long were observed on the N and S flanks.
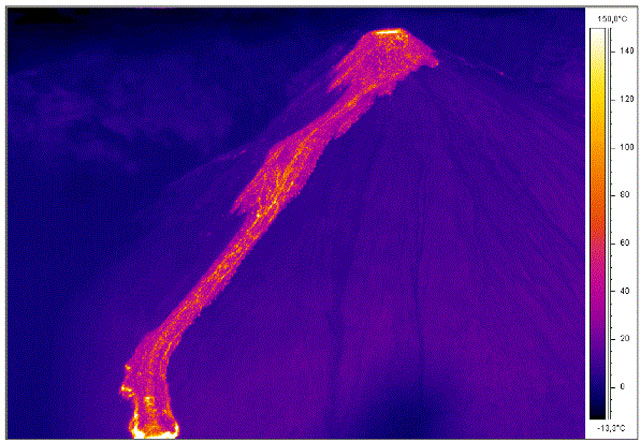 |
Figure 41. Thermal image of Reventador on 22 January 2013 shows the dome from which a lava flow descends to the SE. Courtesy S. Vallejo, Instituto Geofisico (IG-EPN). |
During 23 January-7 February 2013 seismicity remained high. Lava flows were visible at night. Crater incandescence was observed at night during 29-30 January.
IG reported that seismicity became more moderate during 8-12 February; explosions were detected daily. Ashfall was reported in areas near the volcano on 9 February. Between 16-20 February, activity remained moderate, with continued ash emissions, but an absence of reported ashfall. For the remainder of February 2013, no reports of surface activity were received, and seismic signals ceased transmission.
According to the Washington VAAC, the IG reported that on 2 March lava flows were observed. IG reported that the seismic network recorded multiple explosions during 13-17 March. Observers reported falling and rolling incandescent material on Reventador's S flanks on 12 March. On 15 and 17 March explosions were detected by the seismic network. IG characterized activity as being at a moderate level for most of the remainder of March.
IG noted that moderate activity continued into April 2013 (table 6). Through 12 April seismicity remained moderate. On 15 April IG reported an increase in the number of seismic events. Seismic and surface activity remained moderate to high through 24 April, but became more moderate thereafter and remained so for the remainder of April 2013.
Information Contacts: Instituto Geofísico-Escuela Politécnica Nacional (IG), Casilla 17-01-2759, Quito, Ecuador (URL: http://www.igepn.edu.ec/); and Washington Volcanic Ash Advisory Center (VAAC), Satellite Analysis Branch (SAB), NOAA/NESDIS E/SP23, NOAA Science Center Room 401, 5200 Auth Rd, Camp Springs, MD 20746, USA (URL: http://www.ospo.noaa.gov/Products/atmosphere/vaac/).
Ongoing ash emissions, lava flows, and pyroclastic flows through July 2014
The last Bulletin report covered activity at Reventador through April 2013 (BGVN 38:06). This report details activity occurring between May 2013 and July 2014, and is primarily based on available reports published by Ecuador's Instituto Geofísico-Escuela Politécnica Nacional (IG) and Washington Volcanic Ash Advisory Center (VAAC) notices. Activity during this interval was characterized by periods of varying seismicity; lava flow production; emissions of ash, water vapor, and gases; pyroclastic flows (PFs); incandescence; and lahars.
This report represents a synthesis of activity at Reventador, emphasizing events that occurred during intervals of higher activity described in various IG publications. Data from IG was not available during all or parts of June-July and October-December 2013, and Jan-March and June 2014 (figure 42). Emission columns of water vapor, ash and gas were often observed, along with some incandescence at night in the crater area (table 7). The tallest plumes during this reporting interval reached between 7.6 and 8.6 km altitude. Pyroclastic flows also sometimes occurred during periods of moderate seismicity.
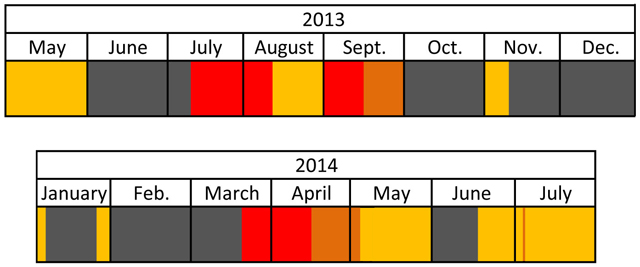 |
Figure 42. Timeline of IG data availability and seismicity levels at Reventador during May 2013-July 2014. Key to colors: high seismicity (red); moderate to high seismicity (burnt orange); moderate seismicity (golden yellow); IG data unavailable (gray). |
Table 7. Summary of Reventador's emissions reaching 4.6 km and greater in altitude (1 km height above the summit) during May 2013 through July 2014. Reports courtesy of IG and Washington VAAC.
| Date | Description of activity |
| 01 May 2013 | VAAC reported seismicity was elevated during the night. Ash plume to 7 km. |
| 08 May 2013 | Incandescence at dawn. Vapor emissions with ash to 4.6 km, drifting NW. |
| 10 May 2013 | Vapor emission with low ash content to 4.6 km. |
| 20 Jun 2013 | The VAAC stated seismic activity was consistent with emissions containing ash or gases, to 4.9 km. |
| 18 Jul 2013 | Ash dispersed in the surroundings of the cone. Emission of gases and ash to ~4.6 km. |
| 10 Aug 2013 | Small emissions of vapor and in some cases, ash; some rose up to 4.6 km. |
| 06 Sep 2013 | Pyroclastic flow (PF) on SE flank. Emissions with ash to 6.6 km |
| 07 Sep 2013 | Low energy emissions of gas and ash to less than 5.6 km. |
| 22 Sep 2013 | Deposit of a PF on S side of cone. Low energy water vapor emissions containing ash to less than 5.6 km. |
| 02 Nov 2013 | Emission was generated by a moderate sized explosion at 0754 local time to ~5.6 km drifting SE. PF generated on W flank of cone. Ashfall reported in San Rafael (8 km ESE). |
| 02 Nov 2013 | At 1037 local time, VAAC reported that a pilot observed volcanic ash to 6.7 km. |
| 31 Dec 2013 | VAAC reported that the ash plume was observed by a pilot to 4.9 km. |
| 25 Mar 2014 | Sustained emission tremor produced the ash and gas emission columns to 5.1 km drifting W and SW. PFs and lava flows also observed. |
| 28 Mar 2014 | Emissions observed during the morning with small amount sof ash to 4.6 km. |
| 02 Apr 2014 | Vapor emission with high content of ash to ~6.6 km drifting SE. |
| 01 May 2014 | Brightness observed in the area of the crater at night. Emissions containing small amounts of ash at 6.6-7.6 km drifting W. |
| 04 May 2014 | Various explosions occurred during the night, one of which ejected a large amount of incandescent material that descended most flanks. Continuous emissions of gas and ash to 7.6-8.6 km drifting NW. |
| 05 May 2014 | Brightness observed at the summit. Mainly white emissions produced, rising up to 7.6 km drifting NW |
| 20 May 2014 | Emissions of vapor to 5.6 km drifting NW. |
| 23 May 2014 | Water vapor and ash emissions to 4.6 km drifting NW. |
| 30 May 2014 | Ash plume was generated by a moderate sized explosion to 6.5 km; reported by a pilot. |
| 20 Jun 2014 | Emission column to 5.6 km drifting NW. |
| 02 Jul 2014 | An explosion during the morning generated a column of vapor and ash to 5.6 km drifting SE. PF also reported. |
| 09 Jul 2014 | Vapor emissions with moderate amounts of ash to 5.6 km observed in the morning. |
| 10 Jul 2014 | Diffuse ash emission observed in the afternoon to 5.1 km drifting NW; hidden by clouds for most of the morning. |
| 11 Jul 2014 | Diffuse ash emission in the morning to 5.1 km drifting NW. |
| 23 Jul 2014 | Emission column to 4.6 km. |
Activity during July-November 2013. Seismicity was high from 10 July to 8 August 2013, consisting of long-period (LP) events (30-130/day), explosions (1-51/day), emission tremor episodes (2-18/day), and harmonic tremor episodes (2-7/day). The elevated seismicity corresponded to lava flows, incandescence, and explosions. On 13 July 2013 a new lava flow on the S flank was detected. Continuous tremor was detected during the afternoon of 15 July and, at 2000 that night, the tremor intensified. Intense Strombolian activity, with explosions of variable magnitudes, associated roars, and 'cannon shots' were reported. Incandescence was also observed on the SW flank on 16 July. Another new lava flow was seen on the E flank on 18 July and, on 19 July lava flows descended the S and E flanks. Numerous rockfalls were recorded between 15 and 25 July; with a high of 65 on 23 July. During the night of 7 August, incandescent material was ejected onto the SW flank and explosions were heard.
A period of high seismic activity also occurred during 4-14 September 2013, again with LPs (40-90/day), explosions (2-50/day), emission tremor episodes (3-19/day), and harmonic tremor episodes (2-36/day). Explosions triggered pyroclastic flows which traveled ~1.5 km down the SE flank on 6 September. Explosive events were frequent between 4 and 7 September, and small pyroclastic flows affecting the top part of the cone were observed on 7 September. A new lava flow that had traveled 1 km down the SE flank was identified in the morning of 8 September. There was a great accumulation of pyroclastic material in the crater and on the upper flanks, which caused continuous avalanches of tephra. Moderate to high seismic activity was recorded during 15-25 September 2013. A strong explosion and pyroclastic flow on the S side of the cone was reported on 22 September.
A moderate explosion at 0754 on 2 November 2013 generated a vapor-and-ash plume that rose to an altitude of 5.6 km and drifted SE.
Activity during March-July 2014. Another period of high seismicity was recorded between 25 March and 13 April 2014. Daily recordings for seismic events during this period ranged from 40-103 for LPs, 10-30 for explosions, 6-195 for episodes of emission tremor, and 2-55 for episodes of harmonic tremor. Elevated activity that began on 25 March 2014 began at 1500 was characterized by a sustained emission tremor, gas emissions containing variable amounts of ash, and ejected material being deposited around the crater. Partial dome collapse caused pyroclastic flows down the E, SE and S flanks, travelling up to 1.5 km from the summit (figures 43 and 44). At least two lava flows were observed descending ~500 m from the crater along the E and SE flanks.
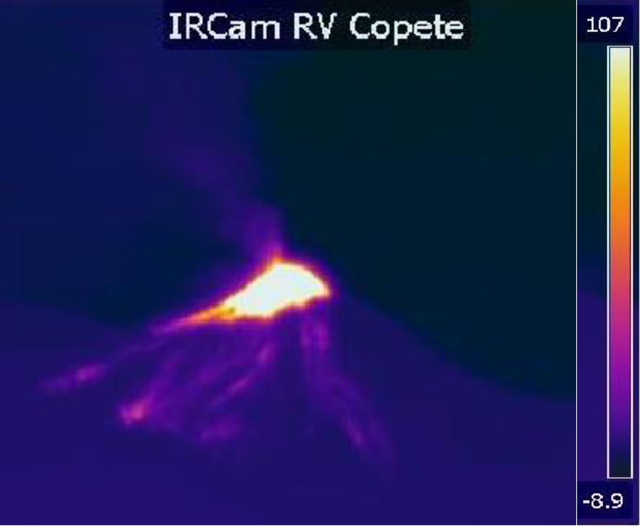 |
Figure 43. Thermal infrared image showing secondary pyroclastic flows at Reventador as thin trails, below a larger bright spot of hot material, which was described as an ash cone. This image was captured at 1820 local time (2320 UTC) on 25 March 2014. The thermal camera that captured this image is located in the Copete Sector of Reventador. Thermal scale on the right side of the figure is in degrees Celsius (°C). Courtesy of Instituto Geofísico-Escuela Politécnica Nacional (IG). |
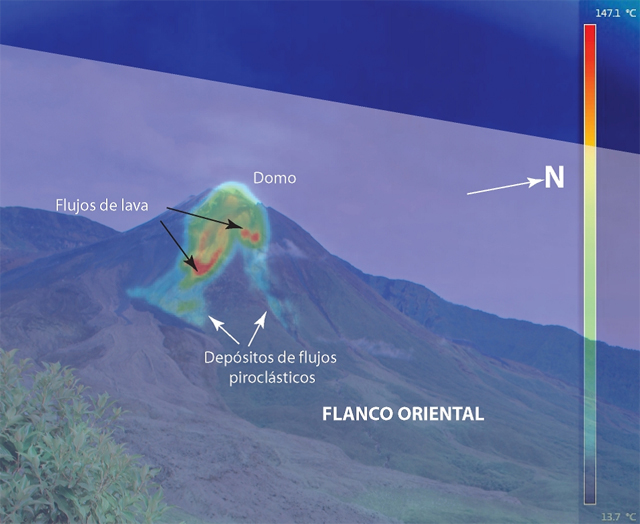 |
Figure 44. The superposition of a thermal image and a photo showing deposits of the secondary PFs and lava flows that developed due to the increased activity on 25 March 2014. The English translations of the Spanish words on the figure are as follows: flanco oriental, E flank; domo, dome; flujos de lava, lava flows; and depósitos de flujos piroclásticos, pyroclastic flow deposits. Courtesy of Instituto Geofísico-Escuela Politécnica Nacional (IG). |
From 27 March to 11 April 2014, numerous lava flows were observed. On 27 March a lava flow on the S flank was observed by video cameras, and hot spots on that flank were captured through thermal images on 29 March. In the early morning of 31 March, after a large roar was reported, incandescent blocks and lava flows traveled 1 km down the S flank. Lahars produced by rainfall were reported during the morning of 2 April 2014. Four lava flows on the S and SE flanks were observed on 3 April and continued to be active through 8 April. Lava flows were also observed on the SW flank on 9 and 11 April.
During the moderate to high seismicty of 14 April-2 May 2014, IG reported that a small PF descended only a few meters below the crater. On 2 May, thermal cameras captured the movement of lava flows on the S and SE flanks. On the night of 4 May 2014, at 2040 local time, an explosion ejected a great quantity of incandescent material which descended most of Reventador's flanks. Infrared cameras detected the descent of incandescent material on the S and E flanks on the night of 17 June. Incandescent material on 19 June moved down the NE flank and an emission plume was generated.
At 0650 local time on 2 July 2014, a large explosion produced a plume which subsequently collapsed and formed a PF (figure 45). The PF moved about 1.5 km down the S flank and the plume contained moderate amounts of ash drifted W. Another explosion released a column of vapor and ash that rose to an altitude of 5.6 km and drifted SE. On 3 July 2014, there were 42 LP events recorded, which was higher than the number of LP events recorded on 1 and 2 July (18 and 27, respectively). During the evening of 26 July 2014, an explosion formed a PF which traveled almost 1 km down the SW flank.
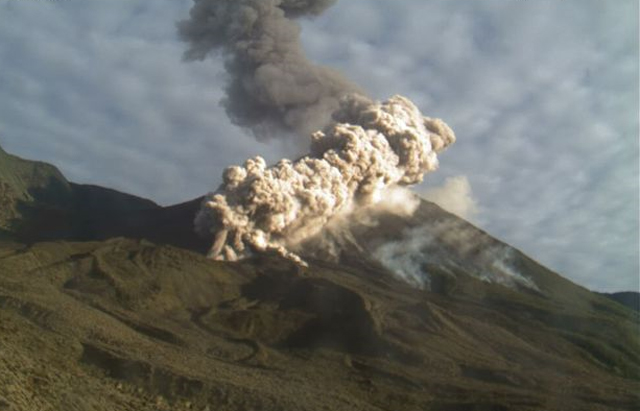 |
Figure 45. Photo of a pyroclastic flow and ash column at Reventador on the morning of 2 July 2014. This image was captured by an IG camera, located on the SE flank. Courtesy of IG. |
Information Contacts: Instituto Geofísico-Escuela Politécnica Nacional (IG), Casilla 17-01-2759, Quito, Ecuador (URL: http://www.igepn.edu.ec/); Washington Volcanic Ash Advisory Center (VAAC), Satellite Analysis Branch (SAB), NOAA/NESDIS E/SP23, NOAA Science Center Room 401, 5200 Auth Rd, Camp Springs, MD 20746, USA (URL: http://www.ospo.noaa.gov/Products/atmosphere/vaac/).
Lava flows, pyroclastic flows, and ash plumes monthly during June 2014-December 2015
The andesitic Volcán El Reventador lies well east of the main volcanic axis of the Cordillera Real in Ecuador and has historical observations of eruptions of numerous lava flows and explosive events going back to the 16th century. The largest historical eruption took place in November 2002 and generated a 17-km-high eruption cloud, pyroclastic flows that traveled 8 km, and several lava flows. This report briefly summarizes activity between 2002 and June 2014, and covers details of activity from July 2014 through December 2015. The volcano is monitored by the Instituto Geofisico-Escuela Politecnicia Nacional (IG) of Ecuador, and the Washington Volcanic Ash Advisory Center (VAAC).
Summary of 2002-2014 activity. Intermittent activity including pyroclastic flows, ash plumes, lava flows and explosive events took place between 2003 and 2008. Since July 2008 there have been persistent gas-and-ash plumes, dome growth, and both pyroclastic and lava flows. Lahars are also very common in this high-rainfall area, and cause damage to infrastructure on a regular basis. A lava dome was first observed growing in September 2009 within the crater that formed during the 2002 eruption. By July 2011, it had reached the height of the highest part of the crater rim; by January 2013 it filled the crater and formed a new summit, 100 m above the E rim. This led to lava blocks travelling down the flanks, in addition to the lava flows and pyroclastic flows traveling down the flanks of the cone inside the crater during 2012-2014. A summary of thermal anomalies compiled from MIROVA data (figure 46) demonstrates the ongoing but intermittent nature of heat flow between 2002 and 2014.
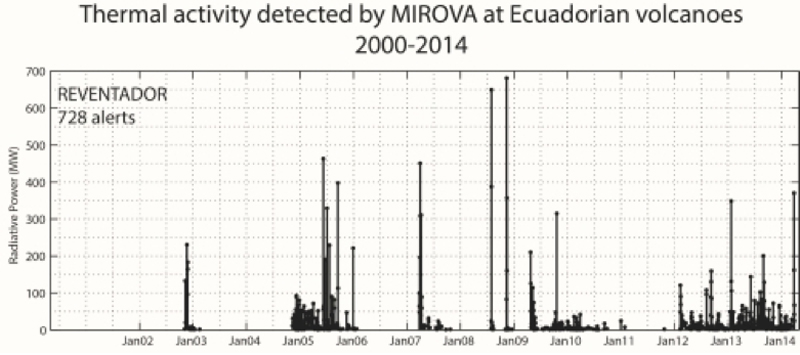 |
Figure 46. Thermal activity detected by the MIROVA system at Reventador, January 2002-January 2014. Courtesy of IG (Informe Especial del Volcan Reventador No. 3, 7 July 2014). |
Summary of June 2014-December 2015 activity. Activity was very consistent throughout the period of June 2014 through December 2015. The thermal webcam captured images of lava flows, pyroclastic flows and ejected incandescent blocks nearly every month. MODVOLC thermal alerts were reported every month except March 2015. Satellite imagery of hot spots were common as well. The Washington VAAC reported observations of ash plumes every month, although they generally rose only to altitudes below 5.6 km (2 km above the summit). IG reported seismicity as varying between moderate and high during the period.
Activity during June-December 2014. Activity during June 2014 was characterized by numerous explosions and small pyroclastic flows that descended the flanks of the cone. The Washington VAAC issued two series of reports on 11-12 and 19-20 June. A pilot reported an ash plume on 11 June rising 2.8 km above summit at 6.4 km altitude and drifting W, and the next day ash was observed 1.8 km above the summit. Weather generally obscured satellite views. On 19 June, multiple small emissions of volcanic ash were seen in the observatory webcam along with incandescent material on the flanks. MODVOLC thermal alerts were issued on 5, 21, and 30 June.
IG reported a new lava flow on 2 July 2014 descending 400 m on the SSW flank. A pyroclastic flow was also reported on 2 July (figure 45, BGVN 39:07) extending 1,500 m down the S flank. IG noted ash emissions on 2, 4, 9-12, 18, 22-24, and 27 July rising 800 m to 2 km above the summit. MODVOLC reported multi-pixel thermal alerts on 2, 16, and 27 July, and single pixel alerts on 10 and 25 July. In addition to the ash plumes reported by IG, the Washington VAAC reported on-going ash emissions and detected hotspots at the crater on 31 July.
The Washington VAAC issued a report of hot spots visible in satellite imagery on 1 August 2014 and a pilot report of an ash plume at 6.1 km altitude (2.5 km above the summit) on 25 August. The only MODVOLC thermal alerts were issued on 31 August. IG reported lower level plumes (300-800 m above the summit) with minor ash on 6 other days during the month.
Activity increased during September 2014. The Washington VAAC issued reports during 2-4, 18, and 23 September. On 2 September, ash plumes were observed extending about 45 km W of the summit at 5.5 km altitude. Another faint plume of volcanic ash was observed within 20 km of the summit the next day. An ongoing hotspot with possible small ash emissions was noted on 4 September. IG reported an explosion on the morning of 5 September that generated a plume and ejected blocks from the crater that fell ~500 m below the summit on the W flank. A thermal camera detected an explosion on the following day that also included ballistics. MODVOLC thermal alerts were issued on eight days during September. Steam plumes with minor ash rose to around 1 km above the summit and dispersed generally W several times during the month.
A single MODVOLC thermal alert was reported on 6 October 2014. The Washington VAAC reported short 2-3 minute bursts of minor volcanic ash on 19 October which was seen drifting WNW and dispersing within 16 km of the summit below 5.8 km altitude. An additional single pixel thermal alert was issued on 25 October, and a three-pixel alert appeared on 29 October.
IG reported steam-and-ash plumes rising up to 1 km above the summit a few times during the month, which were visible on the rare clear-weather days (figure 47). Only two days in November, 5 and 21, had MODVOLC thermal alerts. The Washington VAAC, however, issued reports during 11-12, 18-19, and 27 November of possible low-level ash-bearing plumes. The IG webcam LAVA on the SE flank captured images of pyroclastic flows on 20 and 25 November (figure 48).
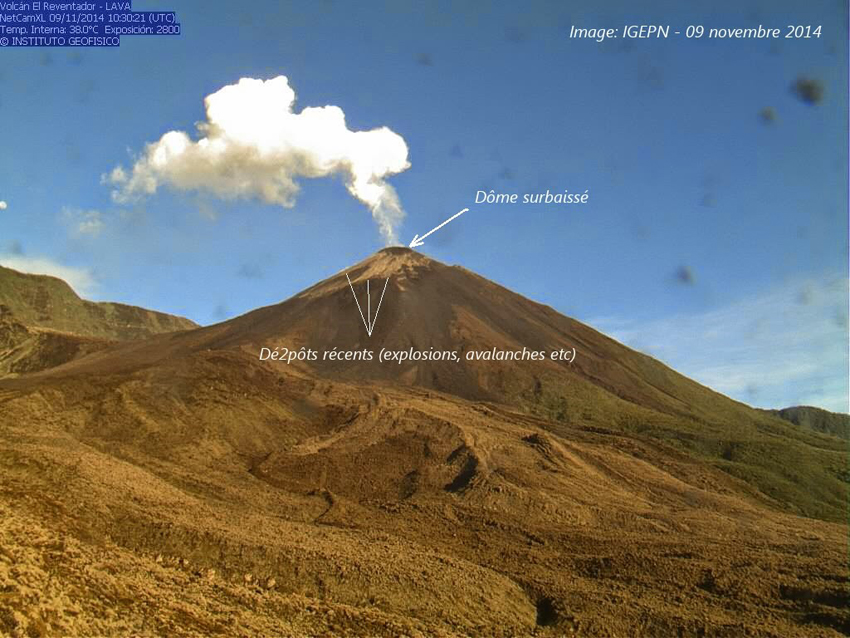 |
Figure 47. The active cone at Reventador on 9 November 2014 with a low-level steam plume. Image taken from the IG Webcam LAVA on the SE flank. Courtesy of IG via La Culture Volcan. |
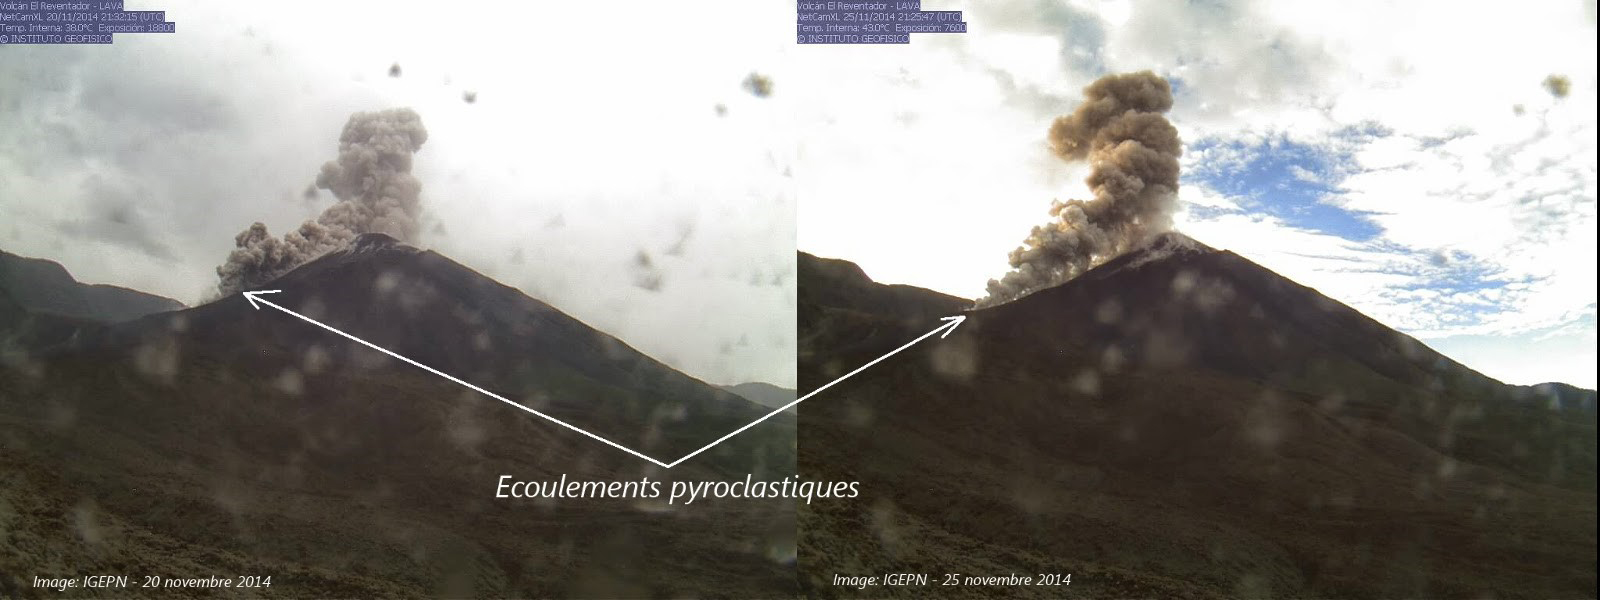 |
Figure 48. Pyroclastic flows at Reventador, 20 (left) and 25 (right) November 2014 taken from the IG LAVA webcam on the SE flank. Courtesy of IG via Culture Volcan. |
On 5 December 2014 a webcam recorded a steam-and-gas emission associated with an incandescent lava flow on the E flank. MODVOLC thermal alert pixels appeared on four days in December 2014 (3, 7, 14, and 23), and VAAC reports of ash plumes were issued on 5, 13-14, 21-22, and 30 December. The largest plume, on 14 December, rose to 6.1 km (2.5 km above the summit) and drifted NE. IG reported moderate seismicity and low-level steam plumes with minor ash content on several occasions.
Activity during 2015. Moderate seismic activity continued during January 2015 with low-level steam-and-ash plumes from explosions rising a few hundred meters above the summit, according to IG. A larger explosion reported by IG on 16 January generated an ash plume that rose 2 km and drifted SE. The Washington VAAC reported activity from 14-18 January, and again on 26 January. Their reports were of small puffs of ash within a kilometer of the summit drifting for a few hours before dissipating. MODVOLC thermal alerts were issued on 15 and 29 January.
Steam plumes containing minor amounts of ash were recorded a few times during February 2015 during periods of moderate seismicity. The Washington VAAC issued several reports, during 7-9, 13-17, 19-21, 24, and 26-28 February, noting occasional plumes with ash rising to less than one km above the summit, and hot-spots seen in satellite imagery on 13-14, 17, 19, and 27 February. An aircraft reported volcanic ash on 19 February at 6.1 km altitude. A new lava flow first observed on the SW flank on 11 February had advanced 1 km by 19 February. This is consistent with the four-pixel MODVOLC thermal alert issued on 18 February. Single pixel alerts were issued on 7, 19, and 23 February as well.
No MODVOLC thermal alerts were issued during March 2015, but the Washington VAAC continued to note low-level small bursts of ash emissions several times a week within 15 km of the summit, as reported by IG. The webcam captured a hotspot at the summit on 11 March. A thermal camera image of a lava flow taken on 13 March showed the visible part of it to be over 500 m long (figure 49), and IG noted in their 13 March report that is was actually about 1.5 km long that day.
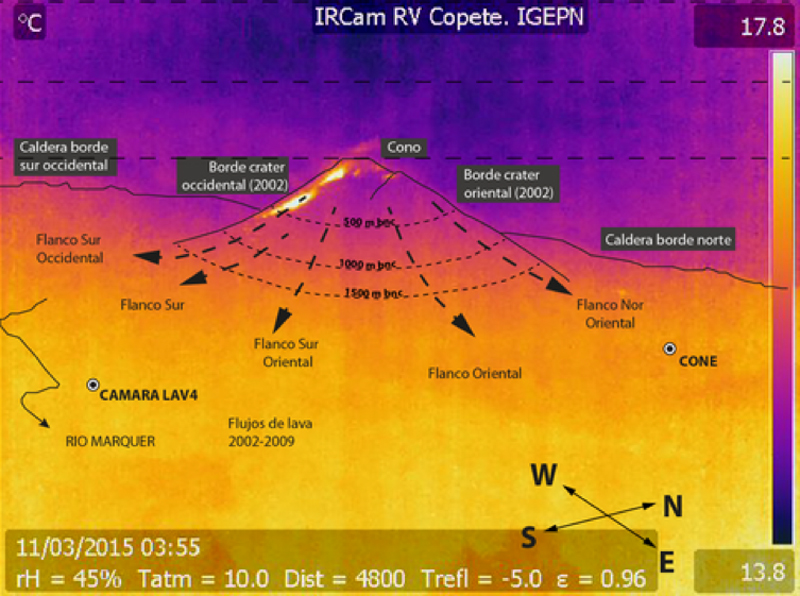 |
Figure 49. Annotated thermal camera image at Reventador of an 11 March 2015 lava flow. Camera is located SE of the volcano. Courtesy of IG (Informe especial del Volcan Reventador No. 1, 13 March 2015). |
Activity during April 2015 included moderate seismicity and incandescence at the crater reported by IG. A lava flow on the SW flank was visible with the infrared camera during the first week; this agrees with the 5-pixel MODVOLC thermal alert recorded on 5 April and the bright hotspot observed in both satellite imagery and the webcam during 3-5 April. Hot spots were observed via satellite and webcam several additional times during the month. Additional thermal alerts also appeared on 10 and 21 April. Steam-and-ash plumes rising to 1 km above the summit were intermittent throughout the month, mostly observed from the webcam.
Multi-pixel MODVOLC thermal alerts appeared during 2-3, 20, and 30 May, indicating continued sources of heat from lava flows. In a special report issued on 19 May, IG noted a new lava flow during the previous week that descended the S flank, forming a fan with three lobes on the SE and SW flanks. The length was greater than 1,000 m from the summit on 19 May, although the flows remained on the flanks of the summit cone within the caldera (figure 50). IG noted an increase in emission tremor on 17 May which may have been related to the extrusion of the lava, but weather conditions prevented visual confirmation. During 17-30 May, intermittent low-level gas-and-ash plumes within 15 km of the summit were reported on most days.
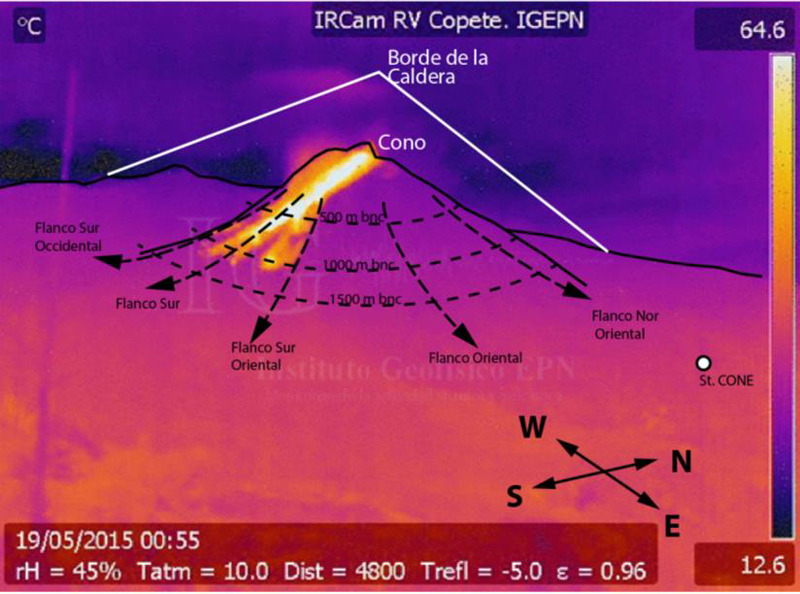 |
Figure 50. Annotated thermal image of the summit cone of Reventador on 19 May 2015 showing a 3-lobed lava flow descending the S flank of the cone for more than 1 km. Courtesy of IG (Informe especial del Volcan Reventador No. 2, 19 May 2015). |
MODVOLC thermal alerts diminished during June 2015, occurring only on 8 and 15 June. Nonetheless, thermal images showed lava flows down the SW and S flanks of the cone several times, and hot spots were observed in satellite images and on the webcam when the weather permitted. Steam-and-ash plumes were generally reported to rise to 1 km or less above the summit and drift usually NW or SW within 15 km of the volcano. A pilot reported volcanic ash on 30 June at 6.7 km, but no ash was seen in satellite imagery under cloudy conditions. IG issued a special report on 24 June noting increased seismicity in the form of increased tremor signal and explosions on 23 June. The thermal camera located in the area of El Copete, 5 km S of the crater, showed an increase in surface activity characterized by several lava flows on the SW, S, and SE flanks exceeding one km in length (figure 51).
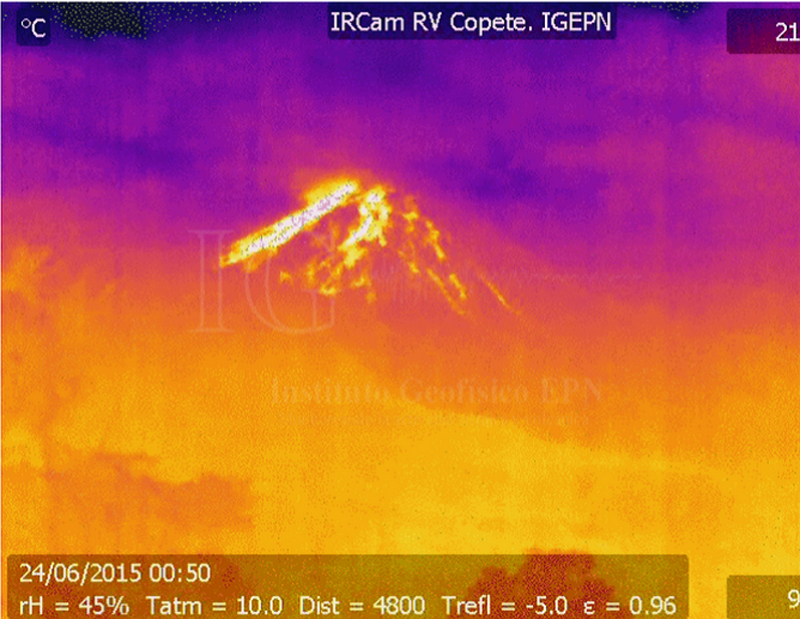 |
Figure 51. Thermal image of Reventador taken on 23 June at 1950 by the webcam near El Copete. Courtesy of IG (Informe especial del Volcan Reventador No. 3, 24 June 2015). |
Seismic activity was reported as high during July 2015 by IG, and included explosions, tremor, long-period earthquakes, harmonic tremor, and emission signals. During the first week, incandescent material was visible more than 1 km down the SE flank in thermal images. On 17 July, light gray deposits possibly from a pyroclastic flow were observed; on 21 July explosions again ejected incandescent material onto the flanks. Steam and ash emissions were intermittent and generally remained below 5.1 km altitude. MODVOLC thermal alerts appeared on 1, 3, 15, and 17 July.
High levels of seismic activity continued during August 2015. The Washington VAAC reported possible ash plumes on 14 days during the month, and MODVOLC thermal alerts were issued on six dates, including four-pixel alerts on 4 and 27 August suggestive of lava flows and/or incandescent material on the flanks of the cone. A discrete volcanic ash emission on 6 August was reported by the Washington VAAC at 7 km altitude (3.4 km above the summit) with a plume extending about 25 km NW of the summit. Other plumes that were reported by pilots (on 25 August at 8.8 km altitude moving NW, and on 26 August at 6.7 km moving W) were not observed in cloudy satellite imagery.
Ash-and-gas emissions were reported by the Washington VAAC during 14 days in September 2015, generally drifting N and W at altitudes less than 2 km above the crater (5.6 km altitude); high levels of seismicity also continued, according to IG. The Guayaquil MWO reported volcanic ash at 6.1 km on 19 September. Puffs of ash seen in the webcam were reported at 7.3 km altitude on 25 September and thought to have quickly dissipated. MODVOLC thermal alerts appeared on seven days during the month; five of them were two- or three-pixel alerts. An SO2 plume drifting WNW from Reventador was captured by NASA's OMI instrument on 22 September (figure 52).
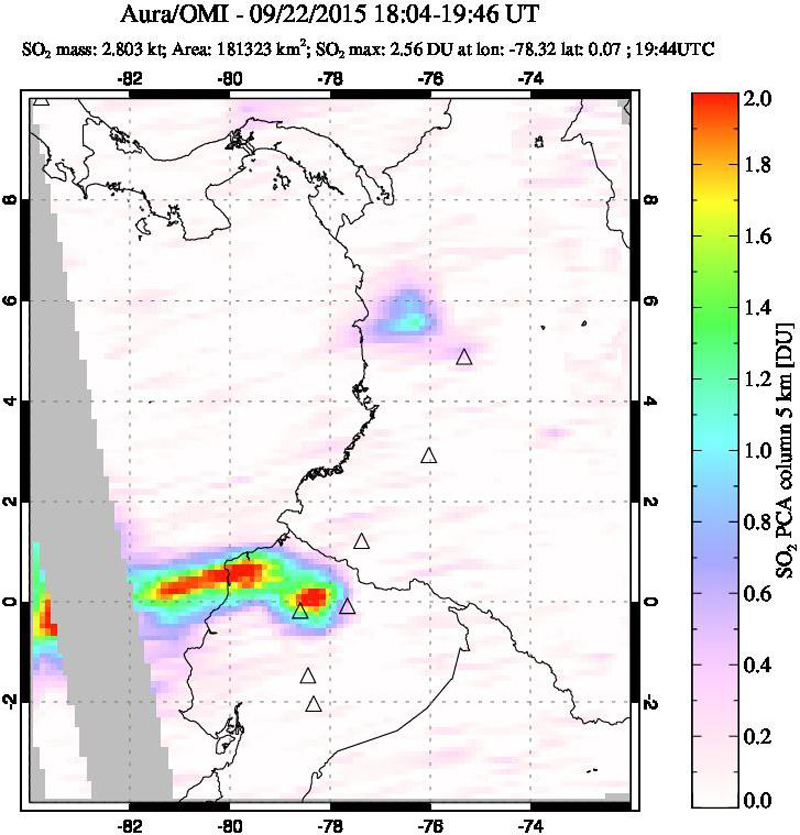 |
Figure 52. An SO2 plume drifting W from Reventador on 22 September 2015. Reventador is represented by the triangle south of the NW-SE trending Ecuador/Colombia border in the bottom center of the image near longitude 78 W just south of the equator. A small plume in the top half of the image is likely SO2 from Nevado del Ruiz. Courtesy of NASA/GSFC. |
A series of VAAC reports of low-level minor ash emissions were issued during 1-5 October 2015. After two weeks of no activity, multi-pixel MODVOLC thermal alerts and VAAC reports increased during 20-30 October. The peak MODVOLC activity included 4-6 daily pixels during 26-28 October, and the VAAC reports noted a bright hotspot on the satellite images beginning on 20 October and present for most of the rest of the month. Continuous emissions were observed in the webcam during 22-26 October, generally below 4.6 km, moving NW, and extending up to 40 km from the summit. Continuous emissions appeared again on 30 October at 5.1 km moving W.
During the last two weeks of November 2015, steam, gas, and ash emissions rose to less than 2 km above the summit and incandescent blocks rolled 500 m down the flanks of the cone. MODVOLC thermal alerts were reported for five days between 15 and 29 November. Similar activity was reported during December, although the Washington VAAC only issued reports on four different days, and MODVOLC thermal alerts were recorded only on 6 and 24 December. VAAC reports noted hotspots in satellite imagery on 7 December. The VAAC reports on 11 and 16 December indicated ash plumes at 5.5 km moving W and SW.
Information Contacts: Instituto Geofísico (IG), Escuela Politécnica Nacional, Casilla 17-01-2759, Quito, Ecuador (URL: http://www.igepn.edu.ec/); Washington Volcanic Ash Advisory Center (VAAC), Satellite Analysis Branch (SAB), NOAA/NESDIS OSPO, NOAA Science Center Room 401, 5200 Auth Rd, Camp Springs, MD 20746, USA (URL: http://www.ospo.noaa.gov/Products/atmosphere/vaac/, archive at: http://www.ssd.noaa.gov/VAAC/archive.html); MIROVA (Middle InfraRed Observation of Volcanic Activity), a collaborative project between the Universities of Turin and Florence (Italy) supported by the Centre for Volcanic Risk of the Italian Civil Protection Department (URL: http://www.mirovaweb.it/); Hawai'i Institute of Geophysics and Planetology (HIGP), MODVOLC Thermal Alerts System, School of Ocean and Earth Science and Technology (SOEST), Univ. of Hawai'i, 2525 Correa Road, Honolulu, HI 96822, USA (URL: http://modis.higp.hawaii.edu/); NASA Goddard Space Flight Center (NASA/GSFC), Global Sulfur Dioxide Monitoring Page, Atmospheric Chemistry and Dynamics Laboratory, 8800 Greenbelt Road, Goddard, Maryland, USA (URL: https://so2.gsfc.nasa.gov/); Culture Volcan, Journal d'un volcanophile (URL: https://laculturevolcan.blogspot.fr/).
Lava flow emerges from summit cone, January 2016; continued explosions, pyroclastic flows, and ash emissions
The andesitic Volcán El Reventador lies well east of the main volcanic axis of the Cordillera Real in Ecuador and has historical observations of eruptions with numerous lava flows and explosive events going back to the 16th century. The largest historical eruption took place in November 2002 and generated a 17-km-high eruption cloud, pyroclastic flows that traveled 8 km, and several lava flows. From June 2014-December 2015, monthly eruptive activity included ash plumes, lava flows, pyroclastic flows, and ejected incandescent blocks (BGVN 42:06). Similar activity during January-April 2016 is described below with information provided by the Instituto Geofisico-Escuela Politecnicia Nacional (IG) of Ecuador, and the Washington Volcanic Ash Advisory Center (VAAC).
Almost daily eruptive activity continued during January-April 2016. Steam and gas emissions, usually containing minor amounts of ash, were visible at the summit crater on most clear days rising 500-1,000 m above the 3.6-km-high summit. Explosions sent incandescent blocks 500-1,500 m down all flanks several times each month. Pyroclastic flows also traveled similar distances down the flanks a few times each month. A lava flow was observed descending the N flank of the summit cone on 28 January 2016.
Steam and gas emissions, usually with minor amounts of ash, rose daily from the summit crater during January 2016. Plumes generally rose 500-1,000 m and drifted NW or W. A pyroclastic flow descended 1,000 m down the NE flank on 5 January. Loud explosions were heard in the community of El Reventador (15 km E) on 6 and 7 January, and plumes were observed 1.5 km above the crater. The Washington VAAC reported an ash emission moving SW on 9 January at 4.6 km altitude; it extended 65 km SW before dissipating. The Guayaquil Meteorological Weather Office (MWO) reported an ash emission on 12 January at 6.7 km altitude, but extensive cloud cover prevented satellite observation.
The Washington VAAC observed emissions in satellite imagery moving 25 km NW on 15 and 16 January at about 4.9 km altitude. Technical crews performing maintenance on 15 January observed and documented several explosions with ash plumes that reached 2 km above the summit (about 5.5 km altitude) and observed a pyroclastic flow that moved 500 m down the N flank (figure 53). They also noted pyroclastic deposits that had been emplaced during recent weeks along the N flank. Small pyroclastic flows during the night of 18 January descended the flanks of the cone for 1,000 m. Additional explosions the next day sent blocks down the SW flank. On 21 January, incandescent blocks traveled 1,200 m down the W flank; on 27 January, they were observed 500 m below the summit crater. The Washington VAAC observed a hotpot in infrared imagery on 24 January.
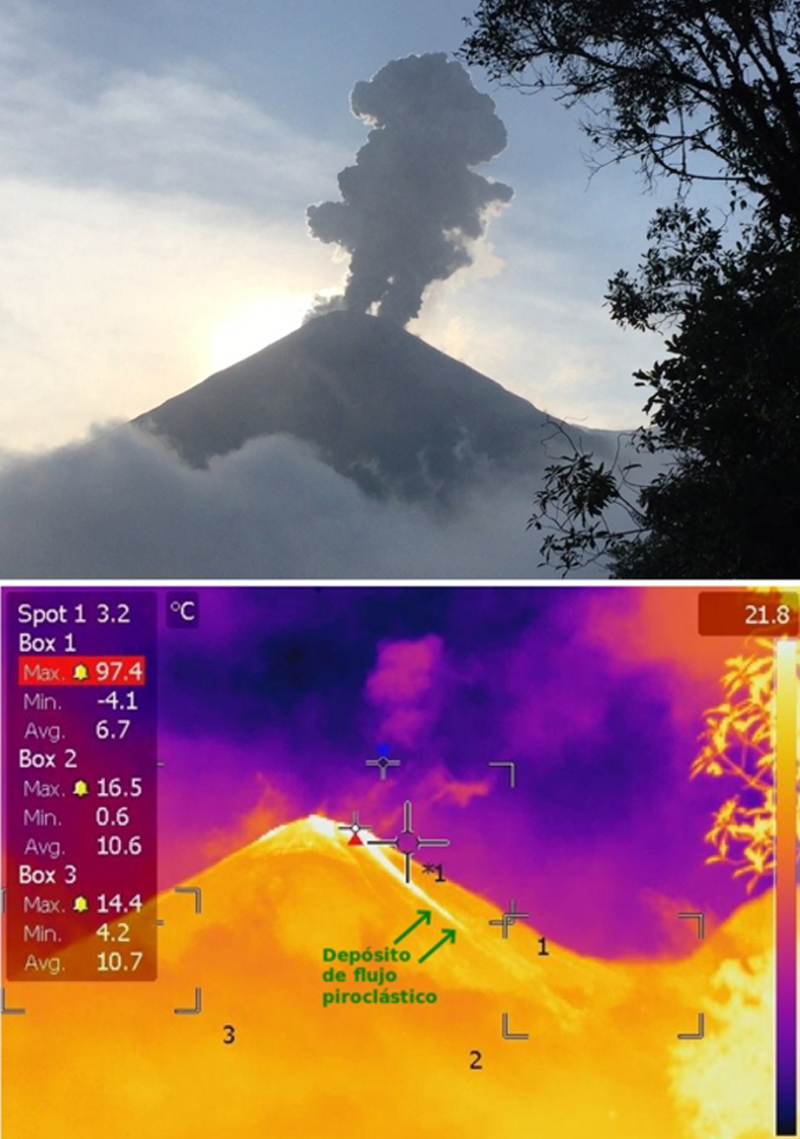 |
Figure 53. Activity at Reventador on 15 January 2016 was documented by technicians working on monitoring equipment. Top: an ash column reached 1.5 to 2 km above the summit during the afternoon. Bottom: A pyroclastic flow traveled 500 m down the flank as seen in this thermal image. Top photo by J. Córdoba, courtesy of IG-EPN (Actualization de la Actividad eruptive del volcán Reventador Informe 2016-1). |
On 28 January 2016, IG conducted an overflight and observed pulsing fumarolic activity producing plumes with low to moderate ash emissions drifting W. They noted pyroclastic flow deposits on all the flanks that did not go beyond the foot of the active cone. They also witnessed an active lava flow descending the N flank, emerging from a vent on the N side of the summit of the cone (figure 54). Thermal measurements were taken at the N vent (501°C ), the central vent (372.8°C), and the base of the flow (324.6°C) (figure 55). MODVOLC thermal alerts were reported on eight days during January (6, 9 (4), 14, 16 (3), 18 (3), 25 (2), 27 (3), 29, 31).
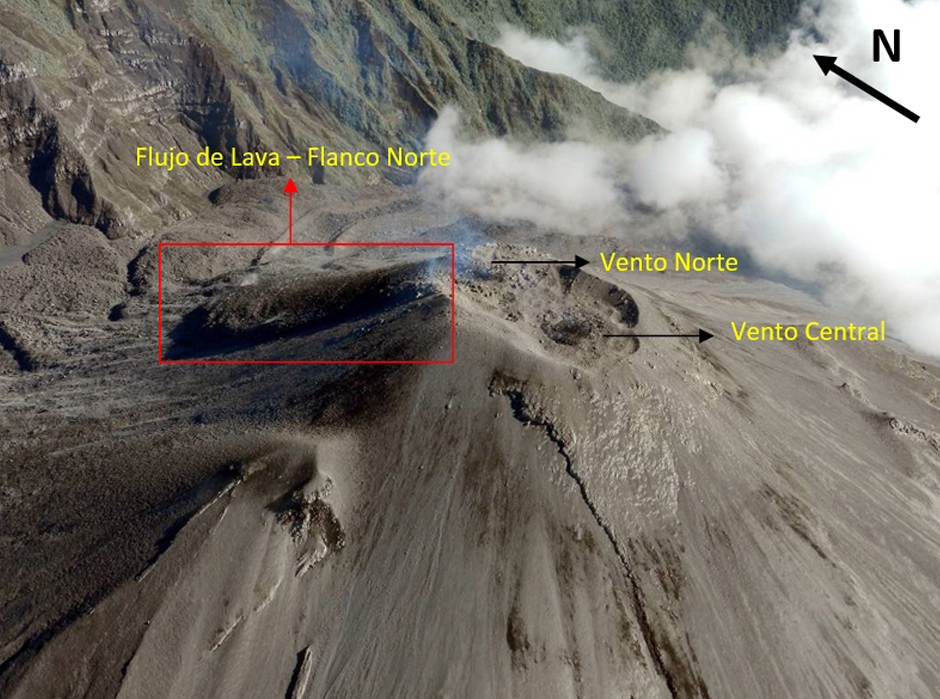 |
Figure 54. A lava flow descends the N flank of the summit cone at Reventador on 28 January 2016 as seen during an overflight by IG. The lava is emerging from a vent on the N side of the summit 'Vento Norte,' distinct from the vent at the center of the summit 'Vento Central.' Photo by M Almeida, courtesy of IG-EPN (Resumen de las Observaciones efectuadas durante el vuelo efectuado el 28 de enero de 2016). |
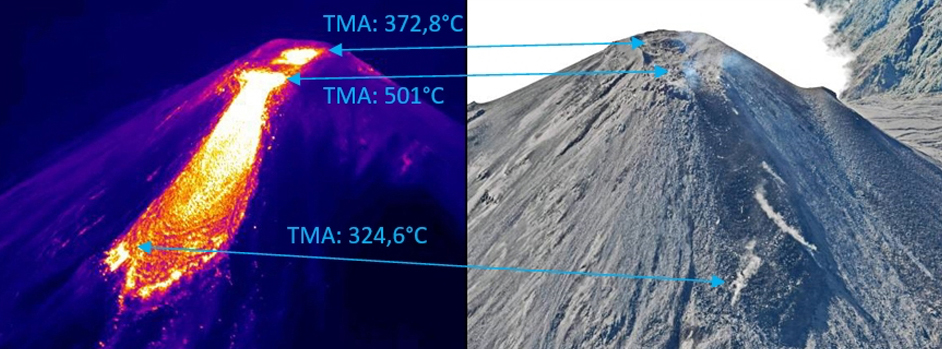 |
Figure 55. Closeup view of the 28 January 2016 lava flow at Reventador showing the temperature values from three different locations. The temperature at the central vent was 372.8°C, at the N vent from which the flow emerged it was 501°C, and 324.6°C at the base of the flow. The points of thermal measurement are shown in the corresponding photograph on the right. Minor gas emissions drifted W. Thermal image by P. Ramón, photograph by M. Almeida, courtesy of IG-EPN (Resumen de las Observaciones efectuadas durante el vuelo efectuado el 28 de enero de 2016). |
Reventador was quieter during February 2016 than in January. Steam and gas emissions with minor ash were observed often, with emissions generally below 500 m above the crater. Incandescent blocks observed on 4 February were 1,000 m below the summit crater. The Washington VAAC reported ash emissions visible in satellite imagery on 5 February moving SSW, extending about 25 km at 4.3 km altitude (about 700 m above the summit crater); they also observed incandescence at the crater. Incandescence was again observed on 6 and 7 February; blocks traveled 700 m down the SW flank on 13 February. A diffuse, narrow plume of ash was drifting NW from the summit on 14 February at 4.6 km altitude. The Guayaquil MWO reported an ash plume at 6.1 km altitude moving W on 23 February, but weather clouds obscured views in satellite imagery. Although it was cloudy on 27 February, loud explosions were heard during the night. MODVOLC thermal alerts were reported on seven days of the month; 1 (3), 3 (5), 5 (4), 6, 14 (3), 19, and 26 (3).
Tourists visiting the Hostería el Reventador observed steam, gas, and ash emissions on 2 March 2016. On many clear days during March, emissions of steam with minor ash were observed rising 1 km above the summit crater, drifting NW, W or SW. Incandescence and pyroclastic flows were seen much more frequently than during February. A pyroclastic flow traveled down the SE flank on 5 March. Explosions that afternoon sent incandescent blocks 1,200 m down the E and SE flanks. This activity continued through 9 March with blocks traveling daily 500-1,000 m down the flanks. On 9 March, ash emissions rose to 1 km above the crater and drifted NW; morning explosions sent blocks 1,200 m down the flanks and a small pyroclastic flow was observed that night. Explosions with steam and ash rising 1 km above the summit were observed on 10 March. Incandescence at the summit, and blocks rolling up to 1,500 m down the flanks were observed on most clear nights during the second half of March. A pyroclastic flow on 20 March descended 2 km down the SW flank. Steam and ash were reported drifting W 1 km above the crater on 21 March.
The Guayaquil MWO reported ash emissions on 7 March to 4.9 km, but weather clouds prevented observations by the Washington VAAC. On 10 March, ash emissions were confirmed in satellite imagery at 6.1 km altitude drifting W. The MWO reported ash emissions at 6.4 km altitude on 15 March, but weather clouds again prevented satellite observation. Webcam images showed ash emissions on 18 March at 4.3 km altitude drifting NW. The next day, the Washington VAAC was able to observe emissions in both satellite imagery and the webcam drifting W at 5.5 km altitude. Possible emissions on 31 March were also obscured by weather clouds. MODVOLC thermal alerts were reported on 7 days during March; 6, 15 (2), 16 (2), 22 (4), 26 (4), 29, 31.
Explosions that sent incandescent blocks down the flanks were observed nine times during April 2016, on days 3, 4, 7, 9, 12, 19, 23, 25, and 26. They generally travelled 1,000 m or more down various flanks. They were observed 2,000 m down the SW flank after a large explosion on 23 April. Pyroclastic flows were observed three times. On 6 April they traveled 1,500 m down the NW flank; on 13 and 21 April they traveled 1,000 m down the E flank. Steam and gas emissions were observed on most clear days, and generally contained minor amounts of ash. The plumes usually rose 300 to 800 m above the summit and drifted W, but on 13 and 18 April they rose 2 km above the summit, according to INSIVUMEH.
The Washington VAAC reported a possible ash emission on 4 April drifting NW at 4.3 km altitude based on a brief emission witnessed from the webcam. Weather clouds prevented satellite imagery views. There were also reports of volcanic ash at 6.7 km altitude drifting SE on 12 April, but both the webcam and satellite imagery were obscured by clouds. Observers reported an ash plume moving NE at 5.5 km altitude the next day. Ash emissions were reported moving NW at 5.8 km altitude on 29 April, but weather clouds again obscured satellite imagery. MODVOLC thermal alerts were reported on 8 days of April: 3, 11 (2), 14 (2), 19 (2), 20, 25 (4), 26 (3), 30.
Information Contacts: Instituto Geofísico (IG), Escuela Politécnica Nacional, Casilla 17-01-2759, Quito, Ecuador (URL: http://www.igepn.edu.ec/); Washington Volcanic Ash Advisory Center (VAAC), Satellite Analysis Branch (SAB), NOAA/NESDIS OSPO, NOAA Science Center Room 401, 5200 Auth Rd, Camp Springs, MD 20746, USA (URL: http://www.ospo.noaa.gov/Products/atmosphere/vaac/, archive at: http://www.ssd.noaa.gov/VAAC/archive.html); Hawai'i Institute of Geophysics and Planetology (HIGP) - MODVOLC Thermal Alerts System, School of Ocean and Earth Science and Technology (SOEST), Univ. of Hawai'i, 2525 Correa Road, Honolulu, HI 96822, USA (URL: http://modis.higp.hawaii.edu/).
Ongoing ash emissions, block avalanches, and pyroclastic flows through December 2016
The andesitic Volcán El Reventador lies well east of the main volcanic axis of the Cordillera Real in Ecuador and has historical observations of eruptions with numerous lava flows and explosive events going back to the 16th century. The largest historical eruption took place in November 2002 and generated a 17-km-high eruption cloud, pyroclastic flows that traveled 8 km, and several lava flows. Eruptive activity has been continuous since 2008. From January-April 2016, monthly eruptive activity included ash plumes, pyroclastic flows, and ejected incandescent blocks (BGVN 42:07), along with a lava flow observed in January. Similar ongoing activity during May-December 2016 is described below with information provided by the Instituto Geofisico-Escuela Politecnicia Nacional (IG-EPN) of Ecuador, and the Washington Volcanic Ash Advisory Center (VAAC).
Ash emissions and incandescent blocks traveling down all the flanks of Reventador persisted throughout May-December 2016 (table 8, figure 56). Ash emissions averaged 12 or 13 per month, although they were only observed during clear days. Emission heights were generally less than 1,000 m above the 3,210-m-high summit, but they were reported at 2 km above the summit once in May, several times in November, and once in December. Incandescent blocks were mostly reported traveling 800-1,500 m down the flanks, although larger events during September sent them as far as 2.2 km. Pyroclastic flows were much less common, reported three times in May, twice in September, and twice in December. A single lava flow was noted in November 2016.
Table 8. Number of eruptive events at Reventador during May-December 2016. Reported events include ash emissions, observations of incandescent blocks traveling down the flanks, and pyroclastic flows. The number of clear days per month during which these observations were made is shown in the right hand column. Information from IG daily reports.
| Month | Ash Emissions | Incandescent Blocks | Pyroclastic Flows | Clear Days |
| May 2016 | 10 | 12 | 3 | 22 |
| Jun 2016 | 5 | 9 | 0 | 13 |
| Jul 2016 | 14 | 7 | 0 | 22 |
| Aug 2016 | 13 | 7 | 0 | 23 |
| Sep 2016 | 11 | 19 | 2 | 25 |
| Oct 2016 | 10 | 14 | 0 | 26 |
| Nov 2016 | 18 | 11 | 0 | 27 |
| Dec 2016 | 20 | 4 | 2 | 23 |
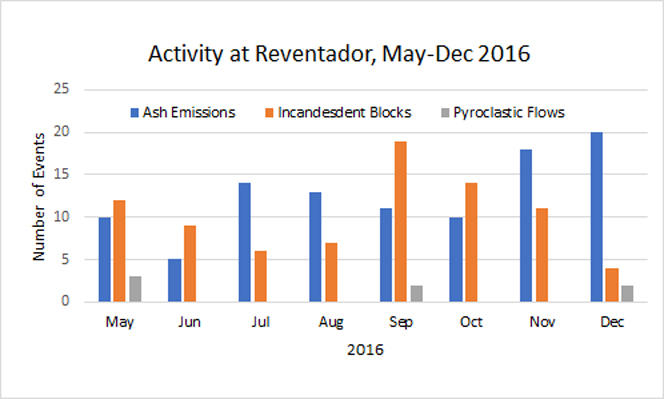 |
Figure 56. Chart showing numbers of emission events per month at Reventador, May-December 2016. Reported events include ash emissions (blue), incandescent blocks rolling down the flanks (orange) and pyroclastic flows (gray). Data from IG daily reports. Numbers include observations on clear days only, not every day of the month. Number of clear days per month are shown in table 8. |
Thermal anomalies recorded by the MIROVA system at Reventador showed that the nature of the ongoing eruptive activity during May-December 2016 included significant sources of heat (figure 57). Moderate to high heat levels of thermal anomalies were recorded numerous times every month during the period.
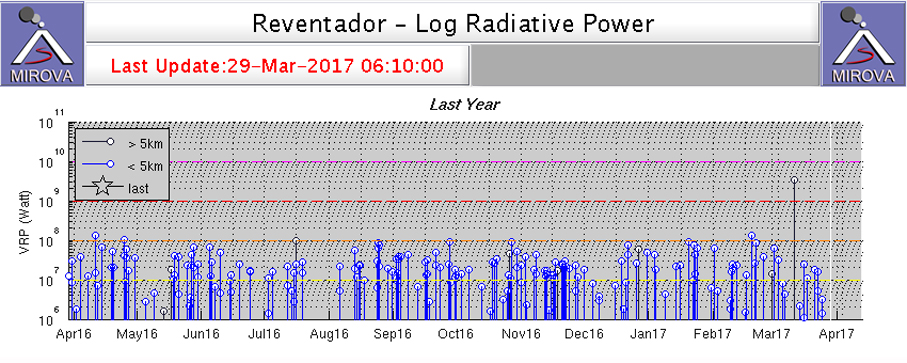 |
Figure 57. Thermal anomalies were persistent at Reventador for the year ending 29 March 2017. Activity was variable, but power output remained largely in the moderate to high value range with anomalies reported every week. Courtesy of MIROVA. |
Incandescent blocks descended the flanks on 12 days during May 2016, typically to distances between 1-1.5 km; the NE, S, and SE flanks were most affected. IG reported ash emissions during ten days of the month, rising 300-1,500 m above the summit crater, except for a 2,000-m-high plume reported on 25 May. The prevailing winds sent the plumes to the NW or SW. The Washington VAAC observed ash emissions in satellite imagery at 4.6 km altitude (1 km above the summit) on 27 May extending 10 km WNW from the summit. On 30 May, they observed ash emissions extending both N and S at 7 km altitude. Pyroclastic flows descended the flanks three times; 1.5 km down the SE flank on 18 May, 1 km down the SE flank on 24 May, and 2 km down the SW flank on 25 May.
During fieldwork from 8 to 10 June 2016, IG staff working near the base of Reventador witnessed persistent activity, noting a 2-km-high ash plume on 9 June (figure 58) and audible sounds. They also reported evidence of recent pyroclastic flows visible primarily on the N and S flanks, and fine gray ash covering vegetation within the E and NE sides of the summit caldera (figure 59).
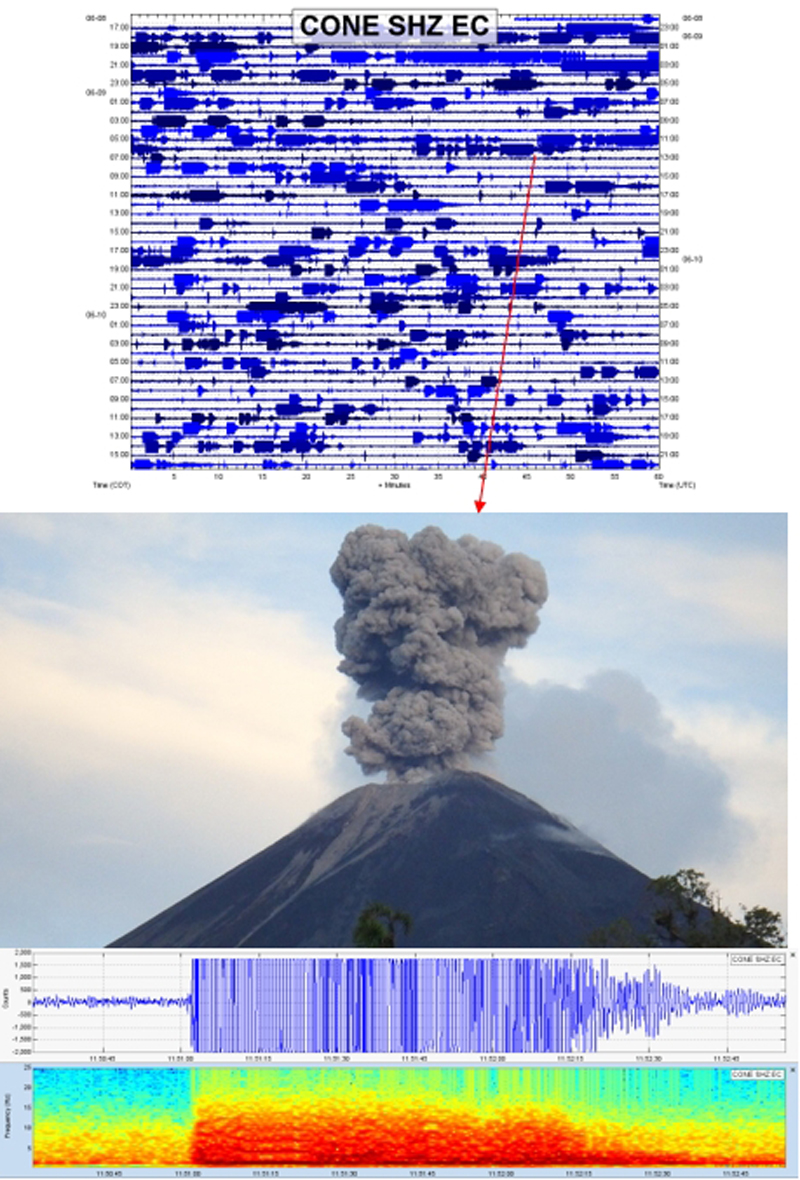 |
Figure 58. Photo showing Reventador erupting on 9 June 2016, along with the coincident seismic and spectral signals from the eruption. The 2-km-high plume was dense with ash. View from the SW flank. Photo by G. Viracucha, courtesy of IG (Actividad superficial del Volcan el Reventador, 24 Junio 2016). |
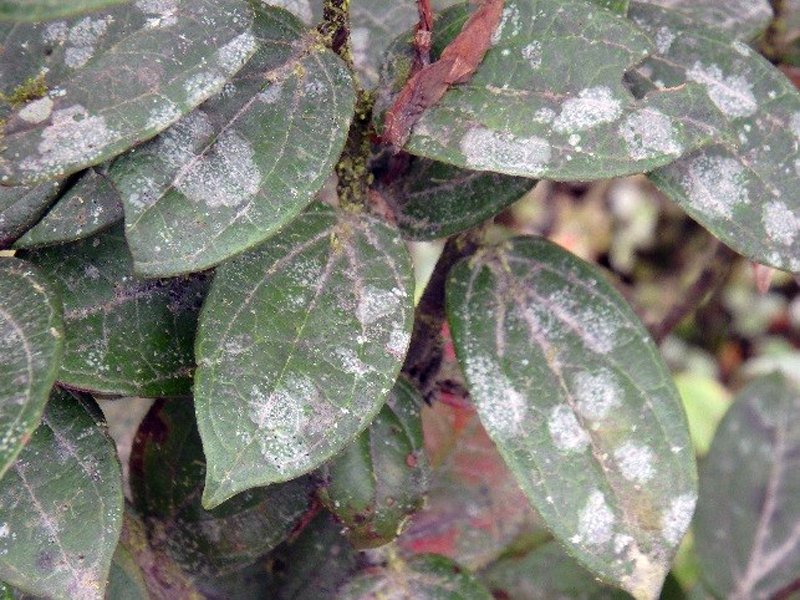 |
Figure 59. Vegetation covered with fine gray ash inside the summit caldera at Reventador during 8-10 June 2016. Photo by G. Viracucha, courtesy of IG-EPN (Actividad superficial del Volcan el Reventador, 24 Junio 2016). |
The weather during June 2016 prevented visual observations of activity during 17 days of the month. Even so, IG reported nine observations of incandescent blocks travelling 800-1,500 m down most of the flanks, and five observations of ash emissions, most of them rising only a few hundred meters above the summit. The Washington VAAC reported an ash emission at 6.7 km altitude (3.5 km above the summit) visible in clear satellite imagery on 5 June. It was drifting W about 75 km from the summit. They also noted a small emission of possible ash at 4.9 km altitude drifting W the next day. IG reported a plume on 10 June at 1,500 m above the summit drifting NW.
Persistent activity during July and August 2016 included 14 and 13 reports of ash emissions, respectively, and 6 and 7 reports of incandescent blocks from the summit. The ash emissions ranged from 300-800 m above the summit in July and 100-1,000 m above the summit during August. The incandescent blocks traveled down all the flanks at various times to distances up to 1,000 m from the summit. The Washington VAAC reported that satellite imagery on 16 July showed a possible ash cloud centered 30 km W of the summit at 4.6 km altitude. On 8 August they observed an ash emission in multi-spectral imagery moving WNW extending about 35 km from the summit at 6.1 km altitude. Another plume the next day was picked up in multi-spectral imagery at 5.2 km altitude the same distance from the summit.
Activity generating incandescent blocks down the flanks increased during September 2016, and was reported on 19 days. Most reports indicated blocks travelling 1,000 m down several different flanks. Larger events during 19-20 September sent blocks 2,000-2,200 m down the SW and SE flanks. Ash emissions were reported ten times by IG during the month, with plume heights ranging from 200 to 1,200 m above the summit. The Washington VAAC only reported a single ash emission rising to 4.3 km altitude and drifting SE on 8 September. Two pyroclastic flows traveled down the SE flank; on 14 September one traveled 1,800 m, and on 19 September one traveled 1,500 m.
During October 2016, there were 10 ash emission events and 14 incandescent block events; during November, there were 18 ash events and 11 incandescent block events. Ash plume heights above the crater during October were all under 1,000 m, but several rose as high as 2 km during 12-17 November. The Washington VAAC reported an ash emission at 3.9 km altitude on 20 October moving WNW about 25 km from the summit. They also observed a hotpot in satellite imagery the same day. On 31 October, they observed two diffuse ash emissions extending 30 km NW from the summit at 5.8 km altitude. A lava flow extended 300 m down the SE flank on 26 November.
Ash emissions were reported by IG on 20 days during December, the most for this reporting period. Plume heights ranged from 400 to 2,000 m above the summit crater, usually drifting W or NW. Incandescent blocks were only reported four times. Except for 13 December when they traveled 1,500 m down the SSW flank, they traveled 800 m down various flanks. The ash emission reported by the Washington VAAC on 9 December was moving SW near 6.1 km altitude. Other VAAC reports during December indicated only puffs of gas with minor volcanic ash noted in the webcam. Pyroclastic flows were reported on 9 and 26 December.
Information Contacts: Instituto Geofísico (IG), Escuela Politécnica Nacional, Casilla 17-01-2759, Quito, Ecuador (URL: http://www.igepn.edu.ec/); Washington Volcanic Ash Advisory Center (VAAC), Satellite Analysis Branch (SAB), NOAA/NESDIS OSPO, NOAA Science Center Room 401, 5200 Auth Rd, Camp Springs, MD 20746, USA (URL: www.ospo.noaa.gov/Products/atmosphere/vaac, archive at: http://www.ssd.noaa.gov/VAAC/archive.html); MIROVA (Middle InfraRed Observation of Volcanic Activity), a collaborative project between the Universities of Turin and Florence (Italy) supported by the Centre for Volcanic Risk of the Italian Civil Protection Department (URL: http://www.mirovaweb.it/); NASA Goddard Space Flight Center (NASA/GSFC), Global Sulfur Dioxide Monitoring Page, Atmospheric Chemistry and Dynamics Laboratory, 8800 Greenbelt Road, Goddard, Maryland, USA (URL: http://so2.gsfc.nasa.gov/index.html).
Large pyroclastic and lava flows during late June and late August 2017; continuing ash emissions and block avalanches throughout January-September 2017
Reventador has exhibited historical eruptions with numerous lava flows and explosive events since the 16th century. Eruptive activity has been continuous since 2008. Persistent ash emissions and incandescent block avalanches characterized activity during 2016; occasional pyroclastic and lava flows were also reported (BGVN 42:11). Similar activity continued during January-September 2017; information for this period is provided primarily by the Instituto Geofisico-Escuela Politecnicia Nacional (IG-EPN) of Ecuador and also from satellite-based MODIS infrared data.
Summary of activity, January-September 2017. Activity remained high at Reventador during January-September 2017. The strongest (4 km long) pyroclastic flow since 2002 occurred in late June along with a large lava flow that traveled over 2.5 km, the longest since 2008. Visual observations of ash emissions and block avalanches were often difficult due to weather conditions that obscured views of the summit certain times of the year (figure 60, table 9). Thermal alerts and anomalies recorded by satellite instruments complemented the visual information reported by IG-EPN (figure 61) and showed near-continuous activity as well. Variation in the frequency of the different types of seismic events fluctuated throughout the period (figure 62) and generally corresponded to variations in the surface activity.
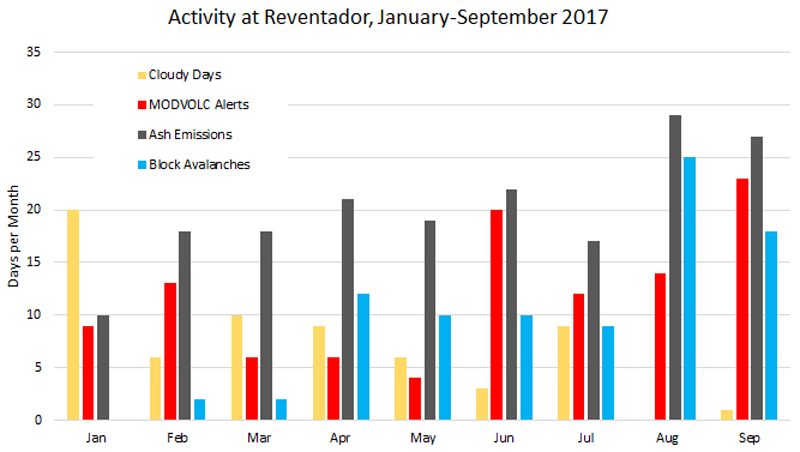 |
Figure 60. Activity at Reventador during January-September 2017 included MODVOLC alerts (red), ash emissions (gray) and block avalanches (blue) reported many times each month. The number of cloudy days (yellow) affected the number of observed events during most months. Data courtesy of IG-EPN, compiled from daily reports. |
Table 9. High levels of activity at Reventador during January-September 2017 were evident from the numbers of MODVOLC thermal alerts, and days with reported ash emissions and block avalanches. Cloudy weather impacted observations of activity during most months. Compiled from IG-EPN daily reports, VAAC reports, and MODVOLC data.
| Date | MODVOLC alerts | Cloudy days | Days with ash emissions | Plume heights above summit (m) | Days with block avalanches | Block avalanche runout distances (m) |
| Jan 2017 | 9 | 20 | 10 | 700-3,000 | 0 | -- |
| Feb 2017 | 13 | 6 | 18 | 900-2000 | 2 | 1,000-1,500 |
| Mar 2017 | 6 | 10 | 18 | 500-2,000 | 2 | 1,000 |
| Apr 2017 | 6 | 9 | 21 | 200-2,000 | 12 | 600-1,800 |
| May 2017 | 4 | 6 | 19 | 300-over 800 | 10 | 500-800 |
| Jun 2017 | 20 | 3 | 22 | Less than 200–2,000 | 10 | 200-800 |
| Jul 2017 | 12 | 9 | 17 | 200-800 | 9 | 200-800 |
| Aug 2017 | 14 | 0 | 29 | 300-over 1,000 | 25 | 200-1,000 |
| Sep 2017 | 23 | 1 | 27 | 400-over 1,200 | 18 | 500-1,500 |
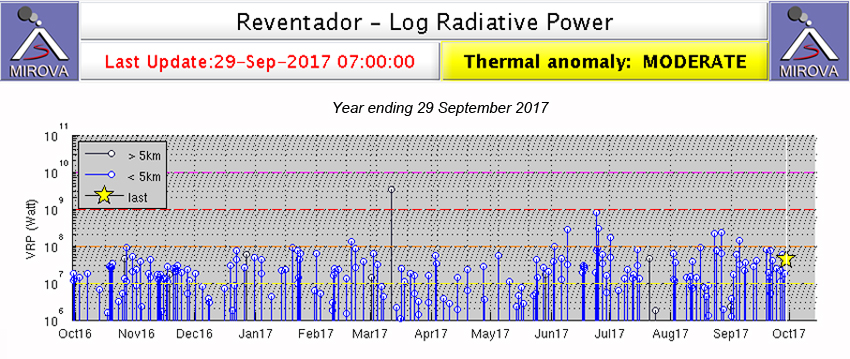 |
Figure 61. MIROVA thermal anomalies for Reventador for the year ending 29 September 2017 show a persistent record of heat flow from the volcano. Significant cloudiness during certain times of the year affected the completeness of the MODIS infrared satellite data on which this is based. Courtesy of MIROVA. |
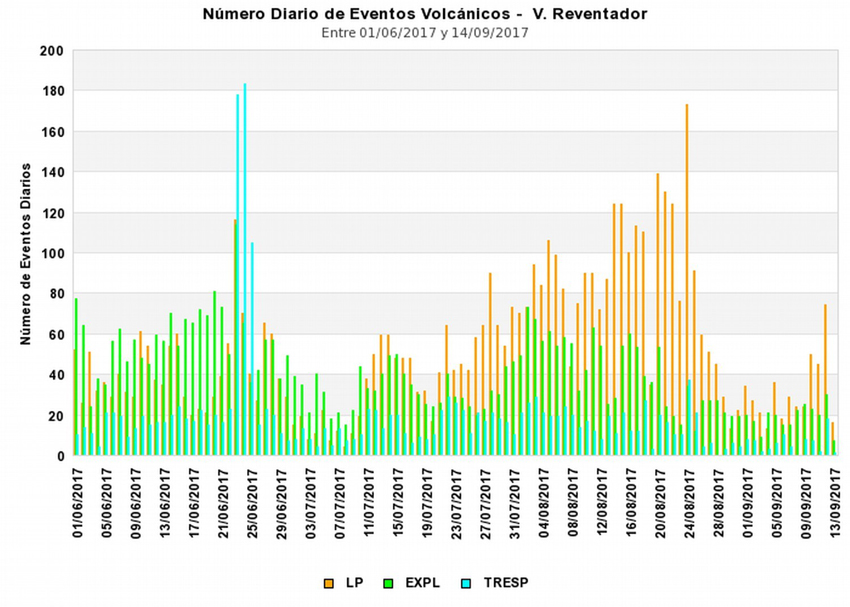 |
Figure 62. Frequency of daily seismic events at Reventador between 6 January and 14 September 2017. LP: Long Period, EXPL: Explosions, TRESP: Tremors. A significant tremor event took place during the lava flow event of late June, and LP seismic events peaked during the eruptive activity of late August. Courtesy of IG-EPN (Informe Especial del Volcán El Reventador, 2017, N° 4, Continúa la erupción, alternancia de actividad efusiva y explosive, 14 de septiembre del 2017). |
Ash emissions occurred many times each month, with the highest plumes exceeding 3,000 m above the summit of the pyroclastic cone inside the caldera. The number of block avalanches reported each month increased steadily throughout the period, with blocks falling hundreds of meters from the summit on all flanks numerous times. Pyroclastic flows were reported a few times most months; the largest event in June sent flows nearly 4 km. Four lava flow events were recorded during the period; on 3 April, a flow traveled 1,600 m down the SW flank, a small flow in early June travelled 200 m down the NE flank, the large flow of 23 June-1 July traveled over 2.5 km down the NE flank, and multiple flows overflowed the summit crater and traveled in five different directions on 24 August 2017.
Activity during January-May 2017. Steam, gas, and ash emissions were reported during 10 of the 12 clear days of January 2017 when observations could be made. The plume heights varied up to 3,000 m above the 3,600-m-altitude summit. Ashfall was reported in El Chaco (30 km SW) on 18 January; nine MODVOLC thermal alerts were reported during the month.
Clearer skies during February 2017 resulted in observations of gas, steam, and ash emissions during 18 days of the month. The plume heights ranged from 900-2,000 m above the summit crater. On 7-8 February, in addition to steam and ash emissions rising 1,500 m and drifting W, block avalanches were observed traveling 1,000-1,500 m down all the flanks. A pyroclastic flow also traveled 800 m down the S flank. On 13 February at 0806 local time, the pilot of a plane from Aerogal observed a vertical plume that reached 2,000 m above the summit; nearby lookouts reported explosion sounds, and slight ashfall was observed in Gonzalo Pizarro in the Sucumbíos province (about 40 km NE). Incandescence appeared at the summit six times in February, triggering 13 MODVOLC thermal alerts.
Ash plume heights in March 2017 ranged from 500-2,000 m during the 18 days they were observed. Although incandescence was seen at the summit seven times, block avalanches were observed on the flanks only twice, on 11 and 23 March, traveling 1,000 m down the flanks each time. A pyroclastic flow traveled 500 m from the summit on 16 March.
Activity increased significantly during April 2017; ash emissions, ranging from 200-2,000 m high were recorded on 21 days, and block avalanches were observed 12 days, traveling 600-1,500 m down the SE flank most of the time. The largest event, on 20 April, sent large blocks 1,800 m down all the flanks. A lava flow moved 1,600 m down the SW flank on 3 April. On 10 April, multiple emissions of steam and gas with moderate ash content reached 2,000 m above the summit crater. On 24 April, a 1,300-m-high ash plume was witnessed during a flyover.
Block avalanches continued at a high rate during May 2017, traveling 500-800 m down all the flanks on at least 10 days of the month. Ash emissions persisted and were observed on 18 of the 25 clear days, rising from 300 to over 800 m. In the early hours of 26 May, a cloud of material was observed on the S flank, likely from a pyroclastic flow.
Activity during June 2017. The technical staff of IG-EPN visited the NE flank of Reventador to monitor activity during 29 May-1 June 2017. They observed a small lava flow on the NE flank, several explosions and emissions associated with both the N and S vents at the summit, pyroclastic flows, 'chugging' (audible, closely spaced intermittent gas emissions), and the projection of ballistic material.
The new lava flow was located on the upper NE flank; the only movement they detected was collapsing of the front of the flow, which sent blocks down to the base of the cone. Explosions with ash emissions from the two vents generally occurred every 15-30 minutes. Gas and ash emissions generally rose 1-2 km high, and the larger explosions produced pyroclastic flows. The sounds of the explosions were audible 5-8 km from the volcano. The researchers used a thermal camera to record a small pyroclastic flow that lasted for about 1 minute and 16 seconds and reached 800 m in length. They also observed avalanche blocks from the S vent that rolled 1,200 m down the flank. The thermal camera measured temperatures as high as 521°C.
During a flyover on 7 June 2017, scientists observed recent pyroclastic flows around all the flanks, the largest ones, on the N and S flanks, reached 1.2 km. Volcanic bombs were visible around the periphery of the crater rim. The lava flow observed a few days earlier by the ground crew extended 200 m down the NNE flank, and did not appear to be associated with either of the summit vents. Several explosions were witnessed from the two vents at the summit crater (figure 63).
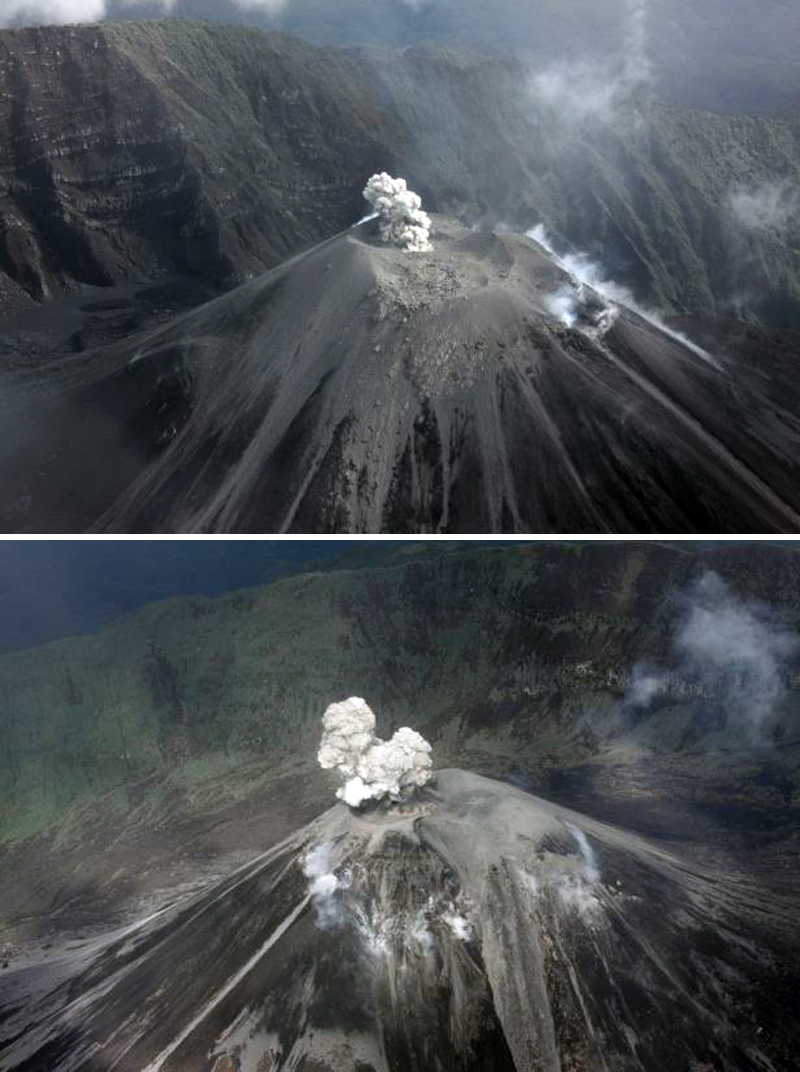 |
Figure 63. Two active vents were visible at the summit crater of the central cone at Reventador on 7 June 2017. Top: Steam and ash emerged from the N vent at the summit crater, and fumarolic activity rose from the NE flank in this view to the NE. Bottom: A lava flow created a pale scar on the NE flank (foreground), while ash and steam emissions rose from the summit crater in this view looking SW. Photos by P Ramón, courtesy of IG-EPN (Informe Especial No. 2-Volcan El Reventador, Observaciones entre 29 de mayo -01 junio y 7 de junio 2017, 26 junio 2017). |
Thermal imagery taken during the 7 June overflight revealed three emission centers at the summit; the two vents inside the crater that produced explosions with ash, larger bombs, and pyroclastic flows, and a fissure on the NE flank about 70 m below the summit that produced the lava flow (figure 64). The highest temperatures were measured in the N vent (Vento Norte).
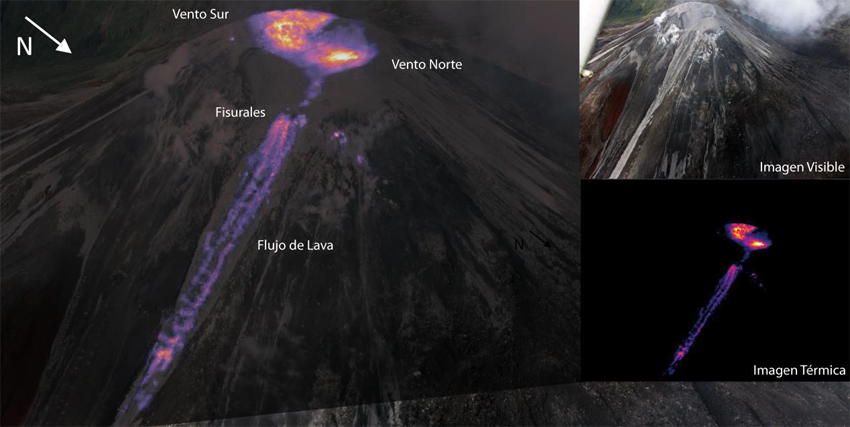 |
Figure 64. Thermal imagery taken during the overflight of Reventador on 7 June 2017 revealed three emission centers at the summit; the two vents inside the crater (Vento Sur, Vento Norte) produced explosions with ash, larger bombs and pyroclastic flows, and a fissure on the NE flank (fisurales) that produced a small lava flow (flujo de lava). Inset photos show visible image (top right) and thermal image (bottom right) of summit. Courtesy of IG-EPN (Informe Especial No. 2-Volcan El Reventador, Observaciones entre 29 de mayo -01 junio y 7 de junio 2017, 26 junio 2017). |
In a special report on 23 June 2017, IG-EPN noted that Reventador had averaged about 50 daily explosions in recent months, as well as a similar number of LP earthquakes. During 22-24 June, a continuous seismic tremor was recorded (figure 62), along with more episodic tremors that included small explosions. Surface activity included pyroclastic flows down all the flanks, and ash plumes that rose about 2.5 km and drifted W. The pyroclastic flows sent material as far as 4 km to the E of the cone, into the headwaters of the El Reventador River (figure 65). IG-EPN reported that the pyroclastic flows generated during this event were the strongest since 2002.
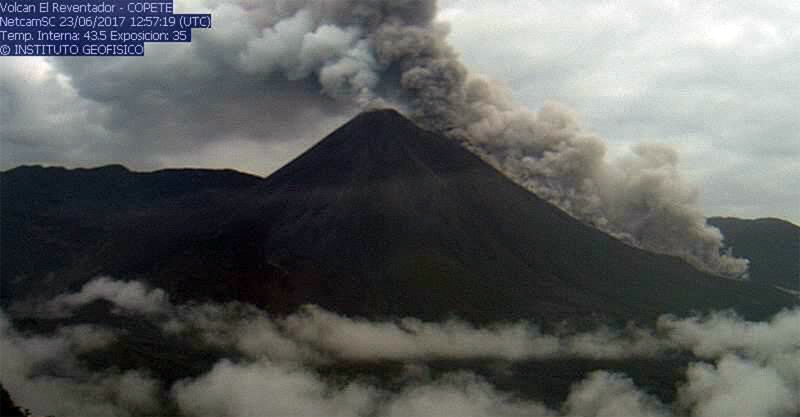 |
Figure 65. A large pyroclastic flow on 23 June 2017 traveled down the NE flank of Reventador at 0757 local time, as viewed from the Copete webcam on the SE edge of the caldera. Courtesy of IG-EPN (Informe Especial No. 1-Volcan El Reventador, Cambio en la actividad eruptive, 23 junio 2017). |
The tremors were associated with a new emission of lava that advanced rapidly down the NE flank of the cone and was active until 1 July. It traveled about 2.65 km before stopping, and was nearly 250 m wide near the base (figure 66). IG-EPN reported that the lava flow was the longest since 2008 and covered and area of just under 0.5 km2. In addition to pyroclastic flows and a lava flow, a significant SO2 plume was released on 24 June 2017 (figure 67). Ash emissions were reported on 22 days during June. Plume heights ranged substantially from less than 200 m to over 2,000 m. Block avalanches traveling up to 800 m down the flanks were reported on ten days, and 20 MODVOLC thermal alerts were issued.
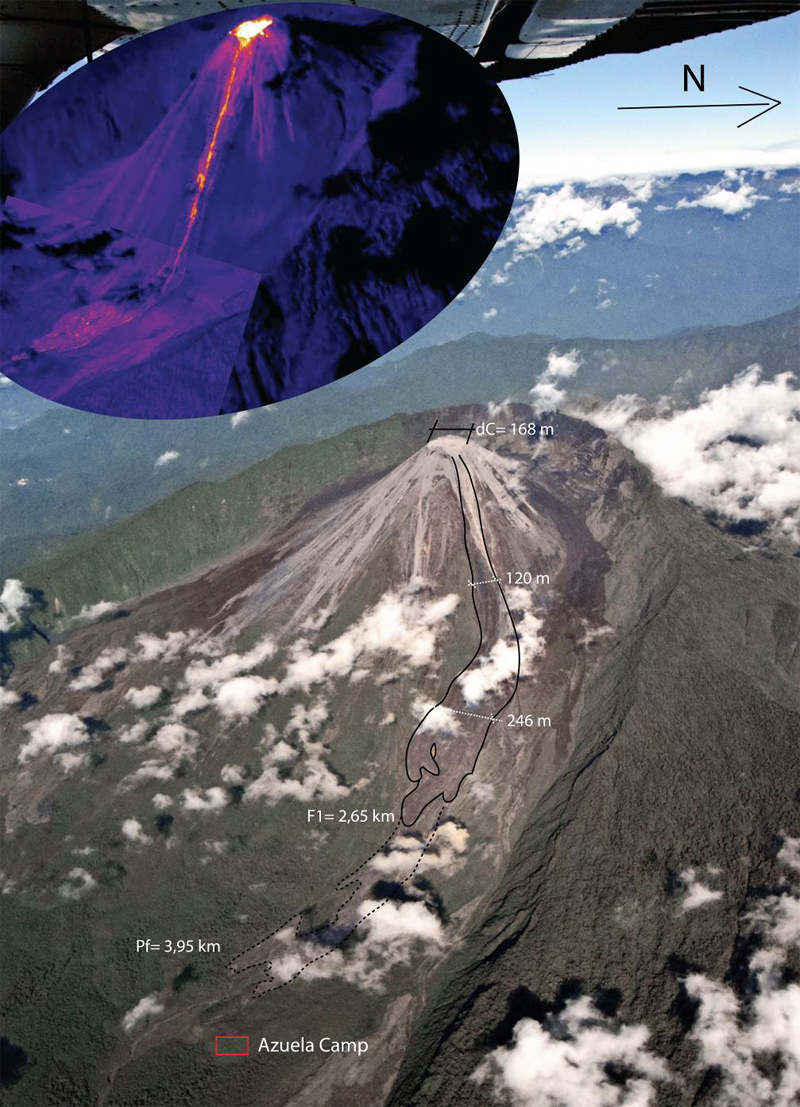 |
Figure 66. The lava flow and pyroclastic flows of 23 June-1 July 2017 at Reventador were measured in an overflight on 21 July by IG-EPN. dC is the diameter of the summit crater (168 m). The width of the flow was about 120 m partway down the flank, and 246 m at its widest point. It traveled a distance of 2.65 km (F1) from the summit. The pyroclastic flow was measured at 3.95 km (Pf) from the summit. Inset thermal image shows lava flow during the same overflight. Photo by St. Almeida, courtesy of IG-EPN (Erupción de junio de 2017 del volcán El Reventador, Reporte de erupción, volcán El Reventador, 2017-01, Publicado el 19 de septiembre de 2017). |
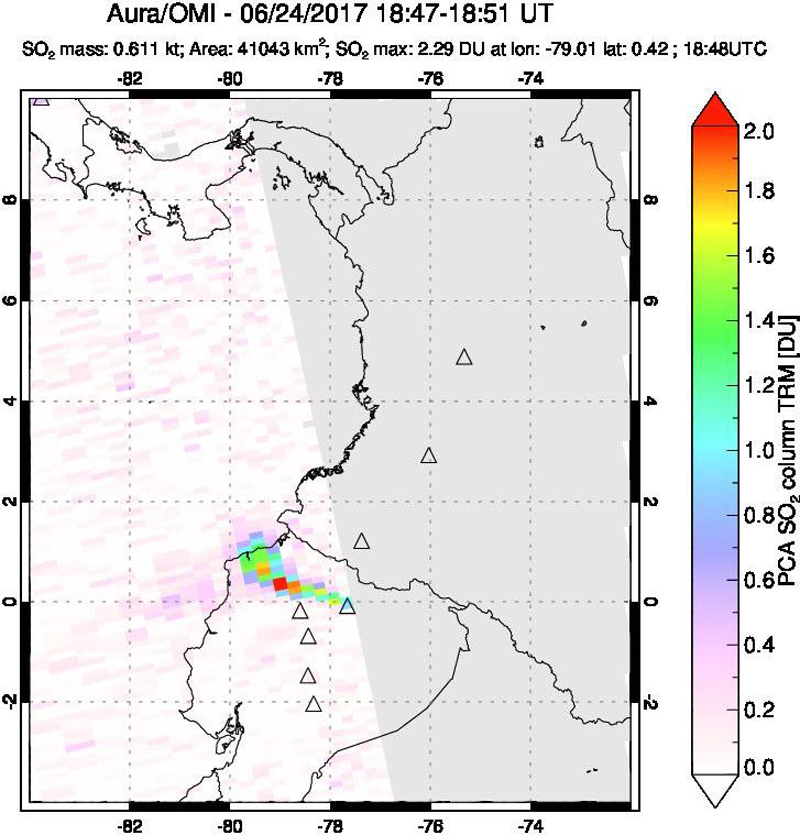 |
Figure 67. An SO2 plume captured by the OMI instrument on the Aura satellite on 24 June 2017 drifted WNW from Reventador. It coincided in time with an eruptive episode that also produced several pyroclastic flows and a 2.65-km-long lava flow. Courtesy of NASA Goddard Space Flight Center. |
Activity during July-September 2017. There were fewer observations of ash emissions during July, on only 17 days, with plume heights ranging from 200-1,500 m (figure 68). Twelve MODVOLC thermal alerts were issued and block avalanches were reported on nine different days moving 200-800 m down all the flanks. A pyroclastic flow reported on 6 July traveled 800 m down the E flank. By the time of the 21 July overflight by IG-EPN, the two summit vents had merged, block avalanches surrounded the rim, and the still-warm flow was visible on the NE flank (figure 69). A visit by IG-EPN scientists on 1 August confirmed the continuing audible explosions, as well as the cooling of the late June lava flow (figure 70).
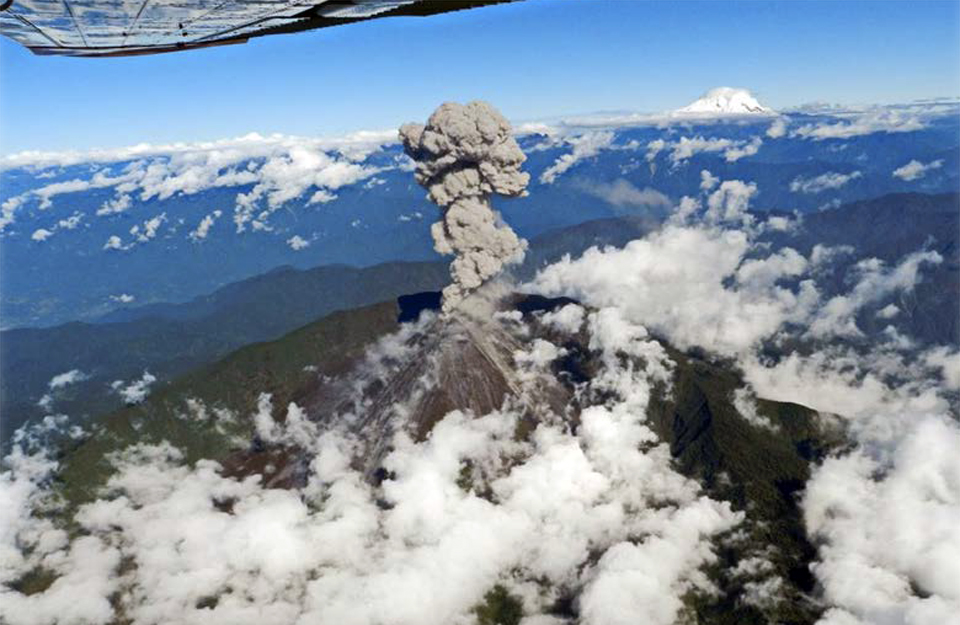 |
Figure 68. A dense ash plume rose 1.5 km above the summit crater and drifted N at Reventador during a flyover by IG-EPN on 21 July 2017. Glacier-covered Volcán Cayambe appears in the distance to the NW (right of the ash plume). Courtesy of IG-EPN (Erupción de junio de 2017 del volcán El Reventador, Reporte de erupción, volcán El Reventador, 2017-01, Publicado el 19 de septiembre de 2017). |
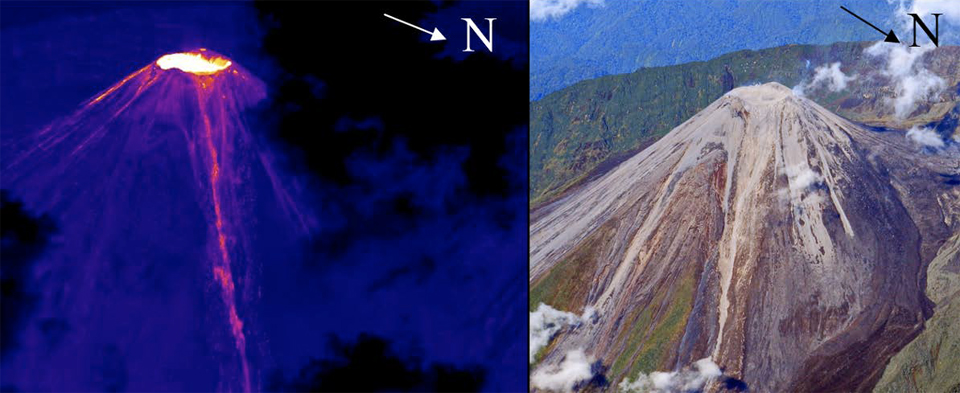 |
Figure 69. Thermal and visible images of Reventador on 21 July 2017 reveal a single strong thermal anomaly at the summit, block avalanches and bombs around the rim, and a still warm lava flow on the NE flank, dark brown in the visible image on the right. Photo by Almeida, courtesy of IG-EPN (Erupción de junio de 2017 del volcán El Reventador, 2017-01, Publicado el 19 de septiembre de 2017). |
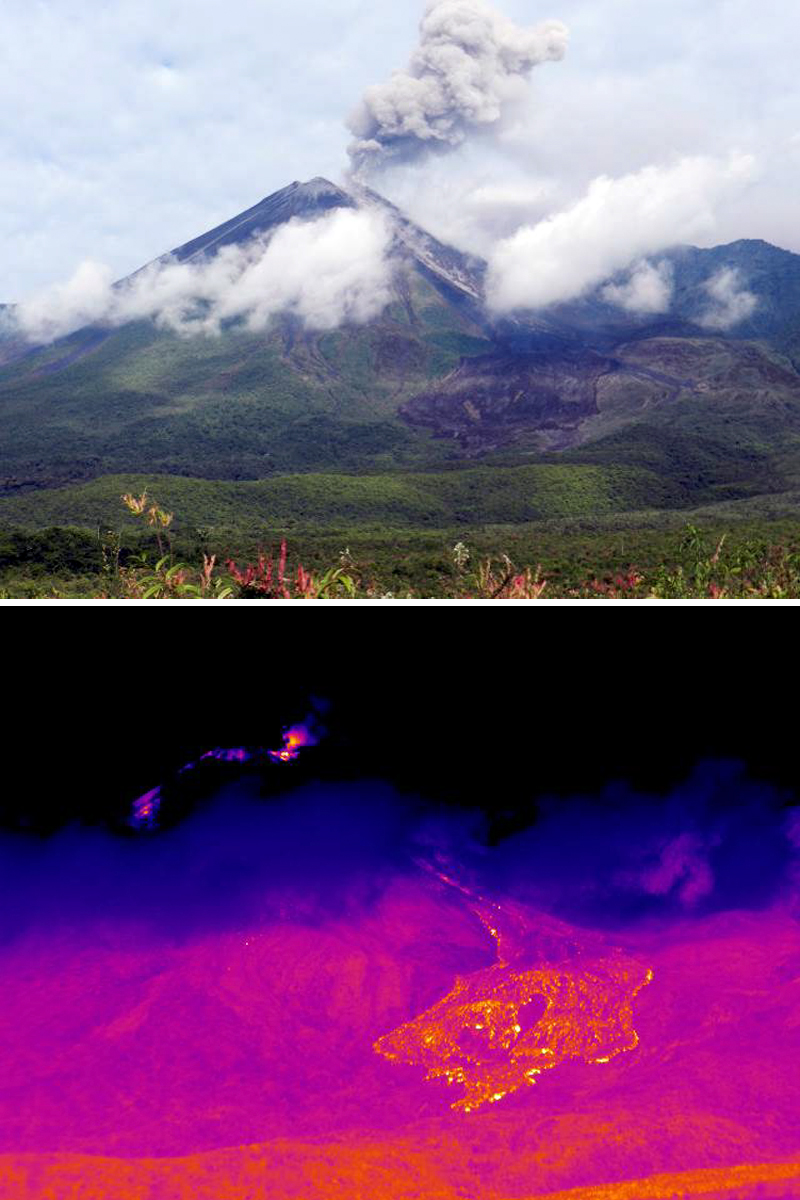 |
Figure 70. Ash emissions and the cooling lava flow on the NE flank of Reventador on 1 August 2017. Top: An ash-laden emission rose from the summit of the cone; the fresh dark brown lava flow is visible on the lower flank. Bottom: The same image from the thermal camera showed the residual heat from the lava flow (lower right), active heat from the ash emission, and a warm area on the upper flank (upper left), likely from block avalanches or a smaller flow. Photo and Image by M. Almeida, courtesy of IG-EPN (Erupción de junio de 2017 del volcán El Reventador, Reporte de erupción, volcán El Reventador, 2017-01, Publicado el 19 de septiembre de 2017). |
The frequency of eruptive activity increased substantially during August 2017. Ash emissions were reported on 29 days of the month most rising over 500 m; block avalanches occurred on at least 25 days sending debris as far as 1,000 m down all the flanks. Pyroclastic flows were reported twice, during 11-12 and 23-24 August (figure 71). Lava flows descended multiple flanks simultaneously on 23 August (figure 72).
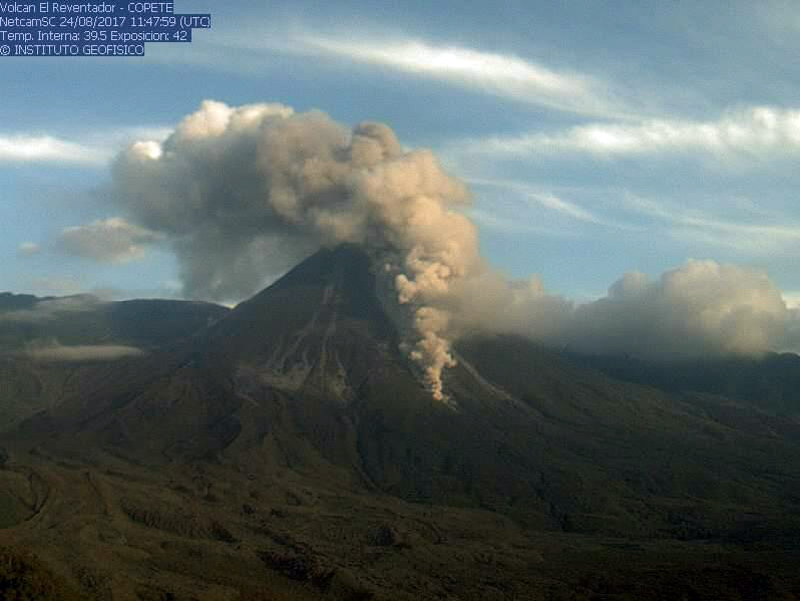 |
Figure 71. A pyroclastic flow descended the SE flank of Reventador during the early morning of 24 August 2017 in this image taken by the IG Copete webcam. Courtesy IG-EPN (Informe del estado del Volcan Reventador No. 236, Jueves, 24 de agosto de 2017). |
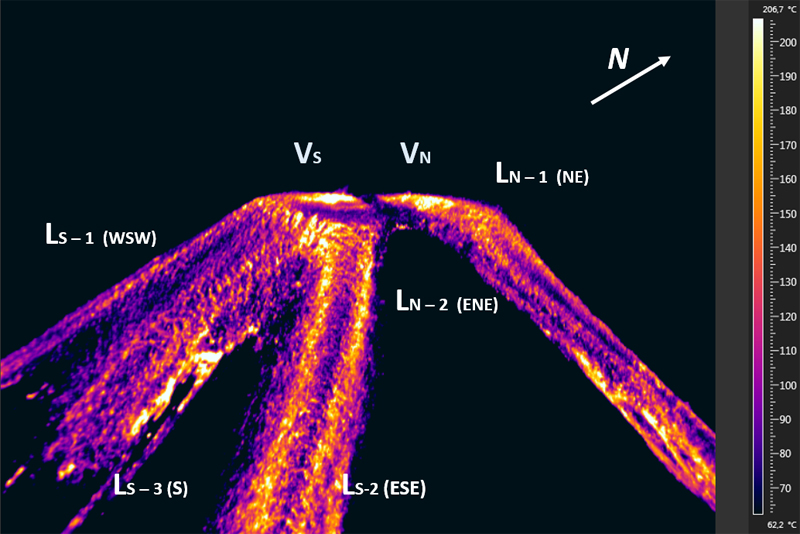 |
Figure 72. Lava flows descended multiple flanks of Reventador simultaneously on 23 August 2017 in this infrared image. Five lava flows emerged from both the N and S vents at the summit of the central cone. Ln-1 flowed NE from the N vent and Ln-2 flowed ENE from the N vent. Three flows emerged from the S vent, Ls-1 flowed WSW, Ls-2 flowed ESE, and Ls-3 flowed S. Image by M. Almeida, processing by M.-F. Naranjo, courtesy of IG-EPN (Informe Especial del Volcán El Reventador, 2017, N° 4, Continúa la erupción, alternancia de actividad efusiva y explosive, 14 de septiembre del 2017). |
The Washington VAAC issued 114 aviation alerts during August 2017 and 123 during September, indicating a continued level of high eruptive activity; plume heights were reported as high as 3,500 m above the summit, and block avalanches covered most of the upper cone down to 900 m a number of times during both months (figure 73).
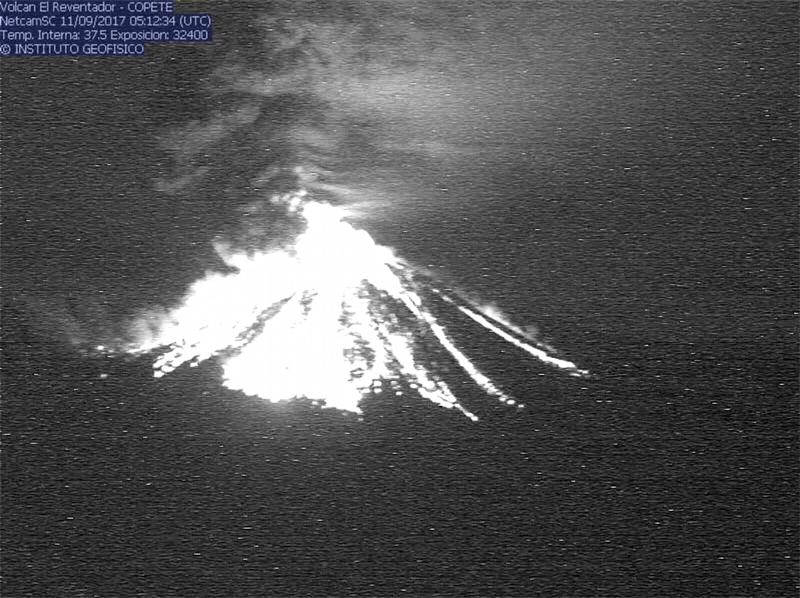 |
Figure 73. Explosions with rolling incandescent blocks descend 900 m on all sides of Reventador on 11 September 2017 in this image from the Copete webcam. Courtesy of IG-EPN (Informe Especial del Volcán El Reventador, 2017, N° 4, Continúa la erupción, alternancia de actividad efusiva y explosive, 14 de septiembre del 2017). |
Information Contacts: Instituto Geofísico (IG), Escuela Politécnica Nacional, Casilla 17-01-2759, Quito, Ecuador (URL: http://www.igepn.edu.ec/); Washington Volcanic Ash Advisory Center (VAAC), Satellite Analysis Branch (SAB), NOAA/NESDIS OSPO, NOAA Science Center Room 401, 5200 Auth Rd, Camp Springs, MD 20746, USA (URL: www.ospo.noaa.gov/Products/atmosphere/vaac, archive at: http://www.ssd.noaa.gov/VAAC/archive.html); MIROVA (Middle InfraRed Observation of Volcanic Activity), a collaborative project between the Universities of Turin and Florence (Italy) supported by the Centre for Volcanic Risk of the Italian Civil Protection Department (URL: http://www.mirovaweb.it/); Hawai'i Institute of Geophysics and Planetology (HIGP), MODVOLC Thermal Alerts System, School of Ocean and Earth Science and Technology (SOEST), Univ. of Hawai'i, 2525 Correa Road, Honolulu, HI 96822, USA (URL: http://modis.higp.hawaii.edu/); NASA Goddard Space Flight Center (NASA/GSFC), Global Sulfur Dioxide Monitoring Page, Atmospheric Chemistry and Dynamics Laboratory, 8800 Greenbelt Road, Goddard, Maryland, USA (URL: https://so2.gsfc.nasa.gov/).
Near-daily explosions produce 1-km-high ash plumes and incandescent blocks on all flanks, October 2017-March 2018.
Historical records of eruptions at Ecuador's Volcán El Reventador date back to 1541 and include numerous lava flows and explosive events (figure 74). The largest historical eruption took place in November 2002 and generated a 17-km-high eruption cloud, pyroclastic flows that traveled 8 km, and several lava flows. Eruptive activity has been continuous since 2008. Persistent ash emissions and incandescent block avalanches characterized activity during January-September 2017 with large pyroclastic and lava flows during June and August (BGVN 43:01). Explosions that produced ash plumes and incandescent blocks continued throughout October 2017-March 2018. Information is provided primarily by the Instituto Geofisico-Escuela Politecnicia Nacional (IG-EPN) of Ecuador, the Washington Volcanic Ash Advisory Center (VAAC), and also from satellite-based MODIS infrared data.
 |
Figure 74. Aerial image of Reventador's inner caldera with its pyroclastic cone emitting a plume of steam and ash. View is looking to the W. Photograph taken during 1-7 December 2017, copyright by Martin Rietze and used with permission. |
Persistent, near-daily ash emissions were typical for Reventador during October 2017-March 2018 (figure 75). In general, the plumes drifted W and NW over sparsely populated nearby areas, but occasional wind-direction changes resulted in ashfall in larger communities within 30 km to the S and SW. The plume heights were commonly 1,000 m above the summit, with the highest plume rising 5 km (to 8.5 km altitude) in October. Most days that the summit and slopes were not obscured by weather clouds, there were observations of incandescent blocks falling at least 300-500 m down the flanks. Larger explosions generated Strombolian fountains and incandescent blocks that traveled 800 m down the flanks every week, even farther on occasion (figure 76). Heavy rains caused one lahar in late November; no damage was reported. Small pyroclastic flows on the flanks were observed once or twice each month (figure 77). The lava flows of June and August 2017 continued to cool on the flanks (figure 78). Thermal activity was somewhat higher during October 2017 with 19 MODVOLC thermal alerts issued, but it remained constant throughout the rest of the period with 8-11 alerts each month. The MIROVA radiative power data showed a similar pattern of moderate, ongoing activity during this time.
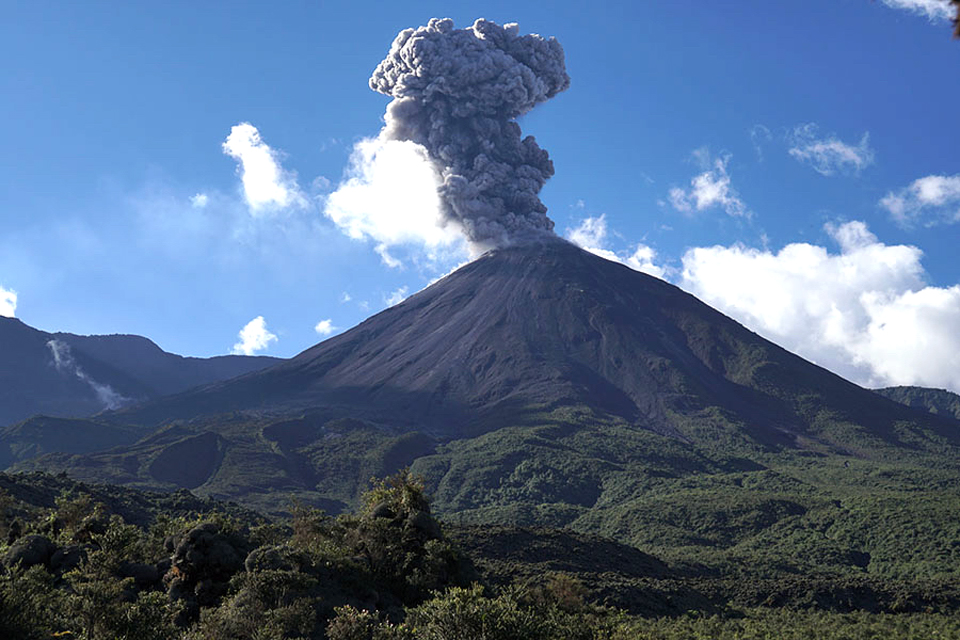 |
Figure 75. A dense ash plume rose from Reventador during the first week of December 2017, viewed from a shelter 3.5 km E of the summit. Photograph taken during 1-7 December 2017, copyright by Martin Rietze and used with permission. |
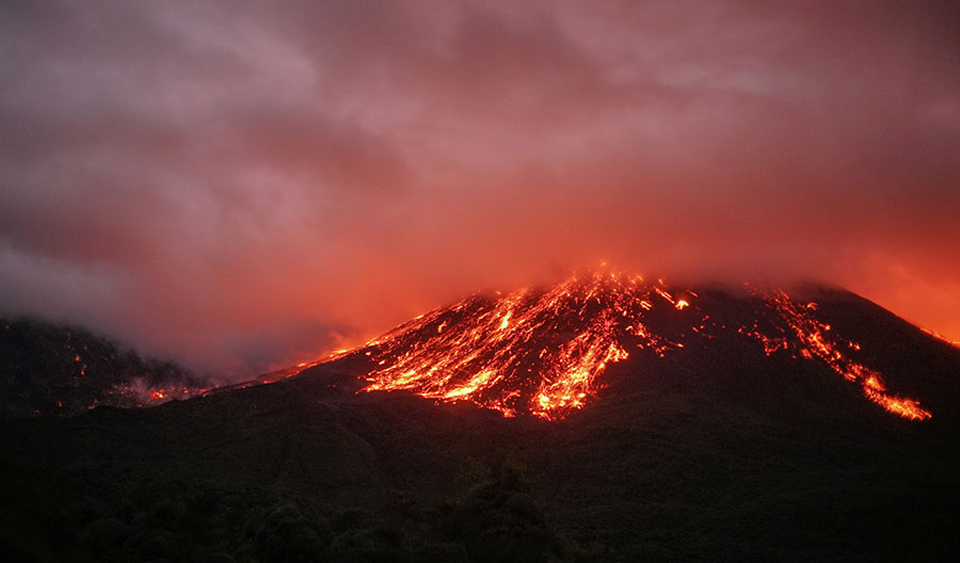 |
Figure 76. Incandescent blocks rolled hundreds of meters down the flanks of Reventador during the first week of December 2017. Photograph taken during 1-7 December 2017, copyright by Martin Rietze and used with permission. |
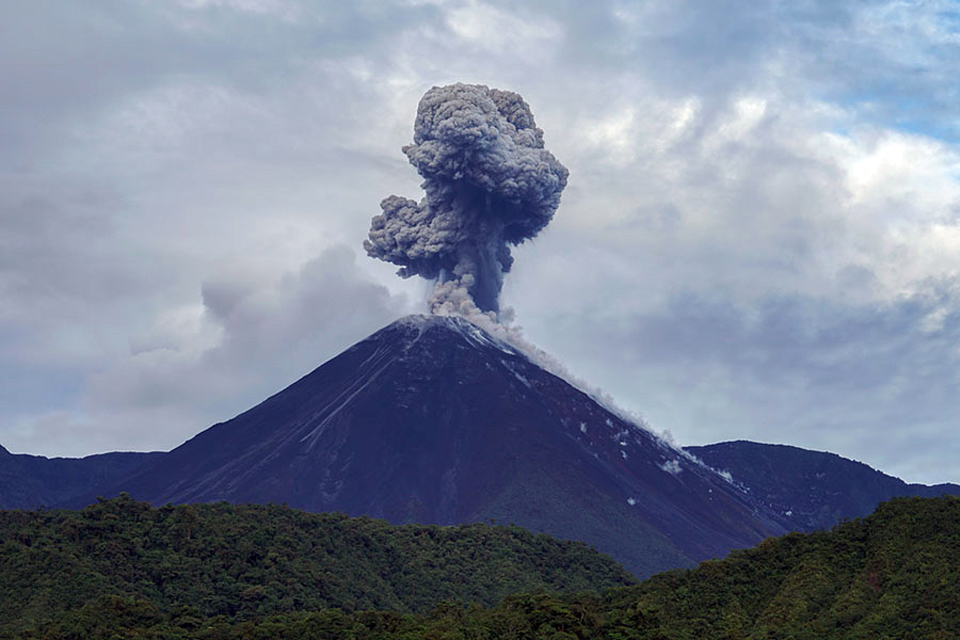 |
Figure 77. A small pyroclastic flow traveled down the flank of Reventador during the first week of December 2017 while an ash plume rose about 1 km above the summit. Photograph taken during 1-7 December 2017, copyright by Martin Rietze and used with permission. |
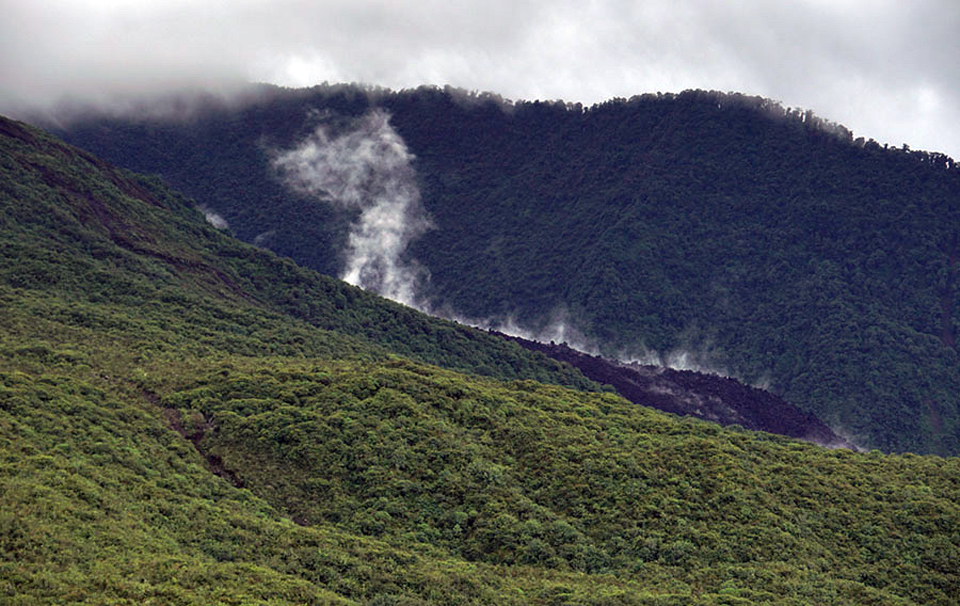 |
Figure 78. The lava flows from June and August 2017 were still cooling on the flanks of Reventador during the first week of December 2017. Photograph taken during 1-7 December 2017, copyright by Martin Rietze and used with permission. |
Activity during October-December 2017. The Washington VAAC issued ash advisories every day but one during October 2017. IGEPN reported near-daily emissions of ash, with plumes rising over 1,000 m many days of the month and rising to 500-800 m the other days. Plume drift directions were generally W or NW. Incandescence at the summit crater was visible on most nights, and incandescent block avalanches were seen rolling 400-800 m down the flanks during 15 nights of the month. Explosive activity intensified for several days near the end of the month (figure 79). A possible pyroclastic flow traveled down the SE flank in the morning of 24 October.
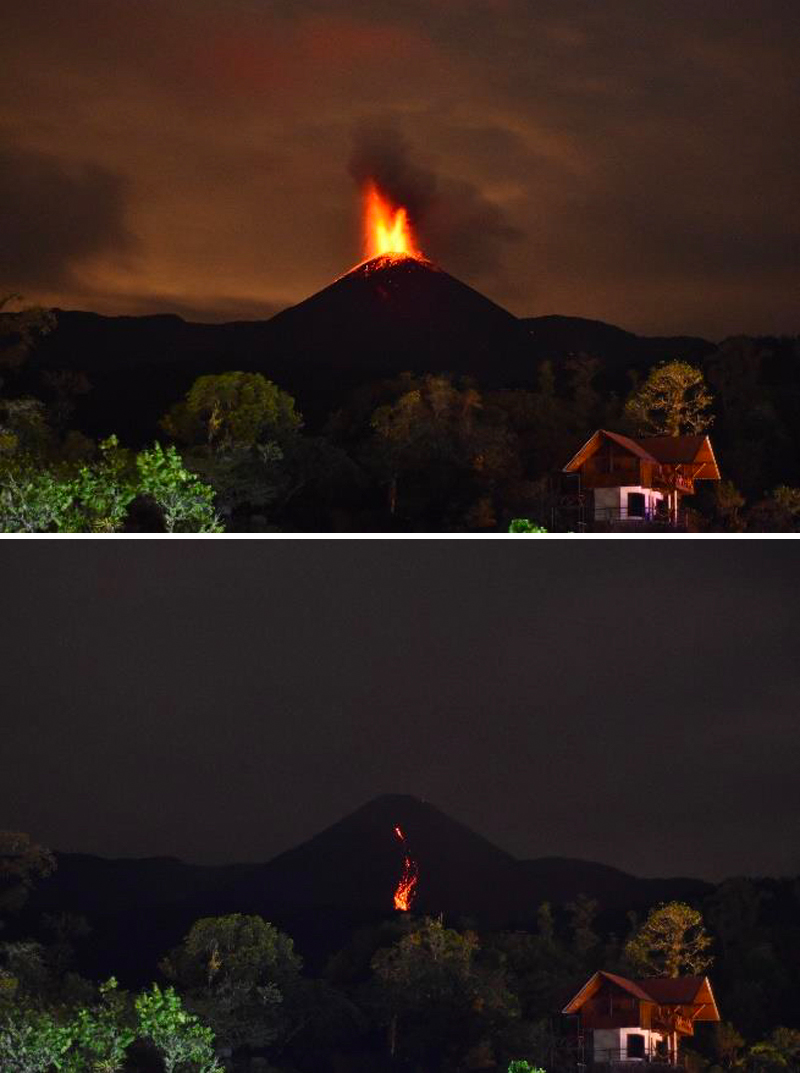 |
Figure 79. Strombolian explosions from two vents at the summit and incandescence on the SE flank of Reventador were captured on 24 October 2017 by B. Bernard. Photo taken from the Hosteria Reventador, 7.2 km SE from the summit. Courtesy of IGEPN (Informe Especial del Volcán El Reventador – 2017 – No. 5, Actualización de la actividad del volcán, 30 de octubre del 2017). |
IGEPN scientists in the field during 23-25 October 2017 noted a high level of explosive activity with loud noises and vibrations felt in the vicinity of Hostería Reventador, about 7.2 km SE of the volcano. Thermal imaging data gathered during their trip indicated that the maximum temperatures of the explosions were over 500°C and that the lava flows of June and August were much cooler with temperatures ranging between 100 and 150°C (figure 80). A dense ash plume rose to more than 2,800 m above the summit and drifted N and E on 25 October (figure 81).
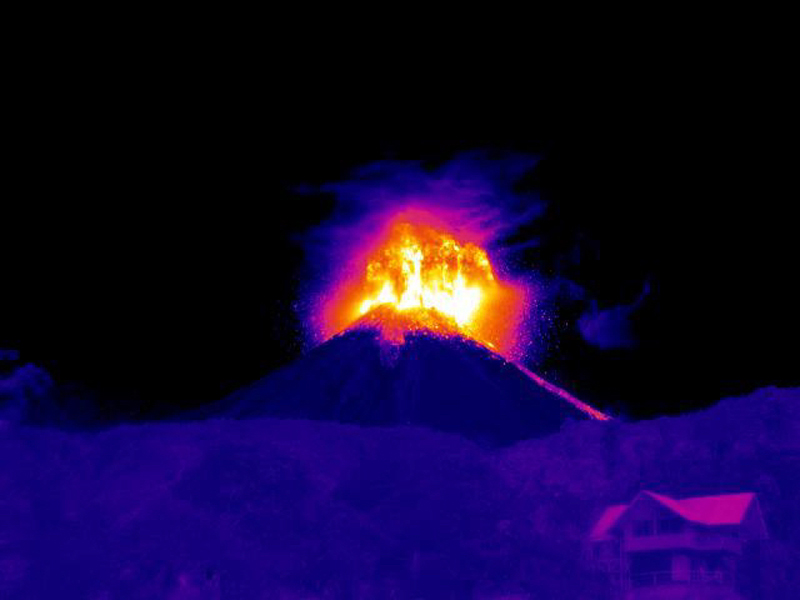 |
Figure 80. Thermal imaging at Reventador on 24 October 2017 indicated that the temperatures of explosions were over 500°C, and that the lava flows of June and August 2017 were much cooler, around 100-150°C. Image taken by M. Almeida from the Hosteria Reventador, 7.2 km SE from the summit. Courtesy of IGEPN (Informe Especial del Volcán El Reventador – 2017 – No. 5, Actualización de la actividad del volcán, 30 de octubre del 2017). |
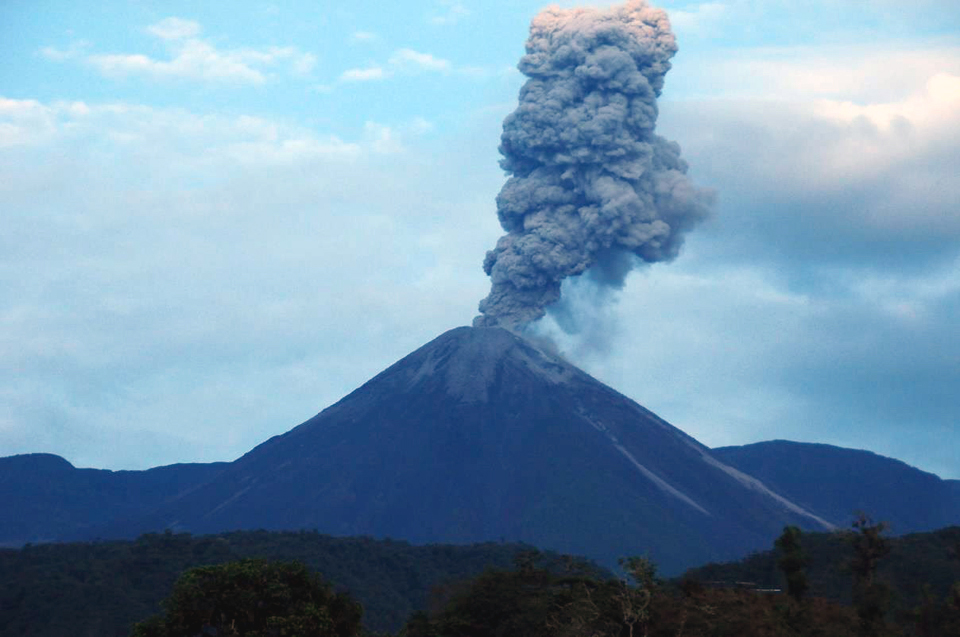 |
Figure 81. A dense ash plume rose at least 2,800 m above the summit of Reventador on 25 October 2017 and drifted NE. Photo by B Bernard, courtesy of IGEPN (Informe Especial del Volcán El Reventador – 2017 – No. 5, Actualización de la actividad del volcán, 30 de octubre del 2017). |
The Washington VAAC reported numerous ash emissions during 24-26 October 2017 at altitudes of 5.8-6.1 km, drifting N and NE from the summit about 35 km. IGEPN reported continuing ash emissions beginning on 27 October that lasted for several days, including observations that day of a plume that rose to 4,900 m above the summit. The Washington VAAC reported the plume at 8.5 km altitude, the highest for the period of this report. During the last few days of October, the wind changed to the S, resulting in reports of moderate ashfall in Napo province in the towns of San Luis, San Carlos (9 km S), El Salado (14 km S), El Chaco (33 km SW), and Gonzalo Díaz de Pineda (El Bombón, 26 km SW).
Persistent ash emissions continued during November 2017 along with observations of incandescence at the summit crater. Plumes of steam, gas, and ash were reported over 600 m above the summit throughout the month; the Washington VAAC issued multiple daily aviation alerts with plume heights averaging 4.3-4.9 km altitude, usually drifting W. Higher altitude plumes over 6.0 km were reported a few times with the highest during 11-12 November rising to 6.7 km. There were reports in the morning of 1 November of ashfall in Borja and San Louis (SE) and on 4 November of minor ashfall in the communities adjacent to the volcano. Incandescent blocks were seen rolling 300 m down the flanks during 7-9 November. Heavy rains on 20 November resulted in a lahar on the E flank. During 22-27 November blocks rolled as far as 800 m down all the flanks, with many on the S and SE flanks (figure 82).
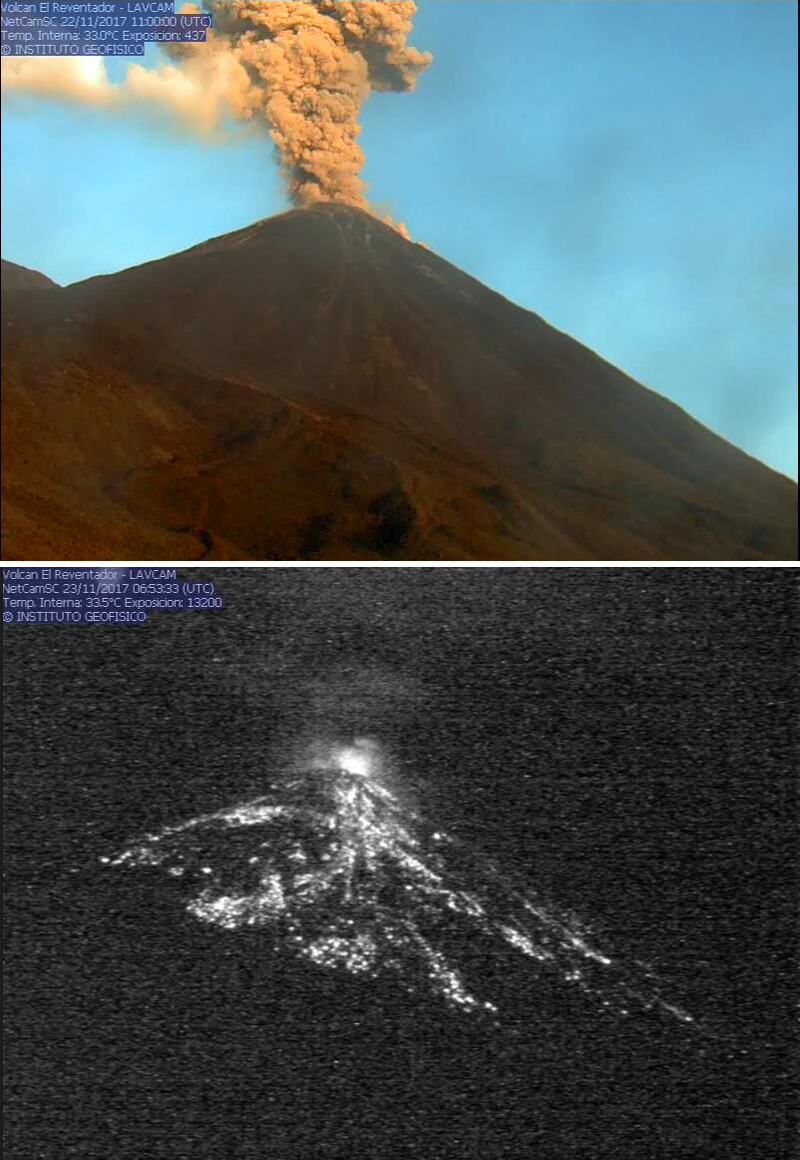 |
Figure 82. Steam, gas, and ash plumes, and incandescent blocks rolling down the flanks were common occurrences at Reventador throughout November 2017. Top: An ash and steam plume on 22 November 2017 rose over 600 m and drifted W. Bottom: Incandescent blocks rolled as far as 800 m down the flanks on 23 November 2017, mostly on the S and SE flanks. Courtesy of IGEPN webcam (Informe Diario del Estado del Volcán Reventador Nos. 2017-326, and 2017-327). |
Although multiple daily aviation alerts continued throughout December 2017 from the Washington VAAC, weather clouds often prevented satellite observations of the ash plumes. When visible, plume heights were generally 4-5 km altitude, drifting W or NW; the highest plume on 17 December reached 5.5 km and drifted WNW before dissipating. IGEPN noted incandescence at the summit on almost all nights it was visible; incandescent blocks traveled as far as 900 m down all the flanks on 11 December, and 400-800 m most nights. They also reported ash plumes rising more than 600 m above the summit 24 days of the month. A video of typical activity at Reventador was taken by Martin Rietze during 1-7 December 2017, along with numerous excellent photographs (figures 83-85).
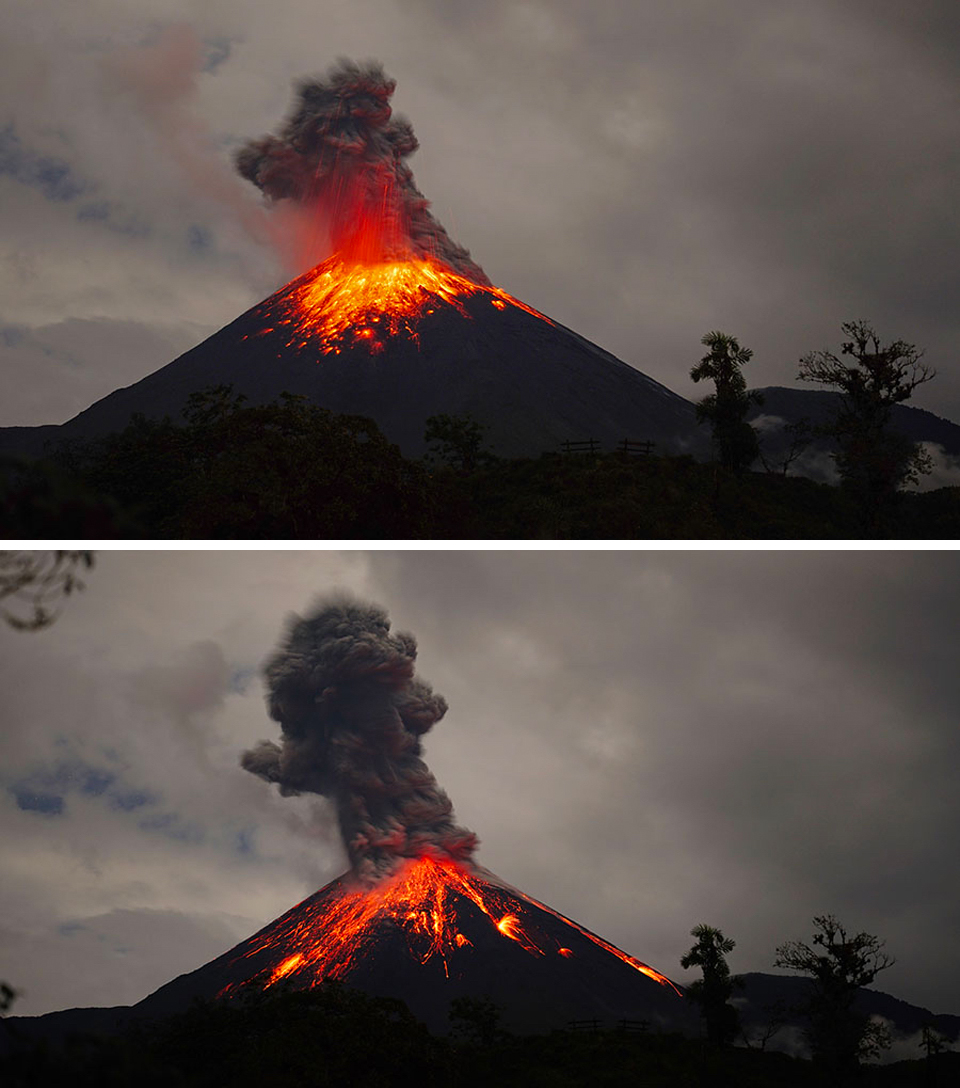 |
Figure 83. Strombolian explosions at Reventador during the first week of December 2017 sent showers of incandescent debris skyward (upper photo) before sending larger incandescent blocks hundreds of meters down the flanks of the cone (lower photo) while a dense ash plume rose from the summit area. Photographs taken during 1-7 December 2017, copyright by Martin Rietze and used with permission. |
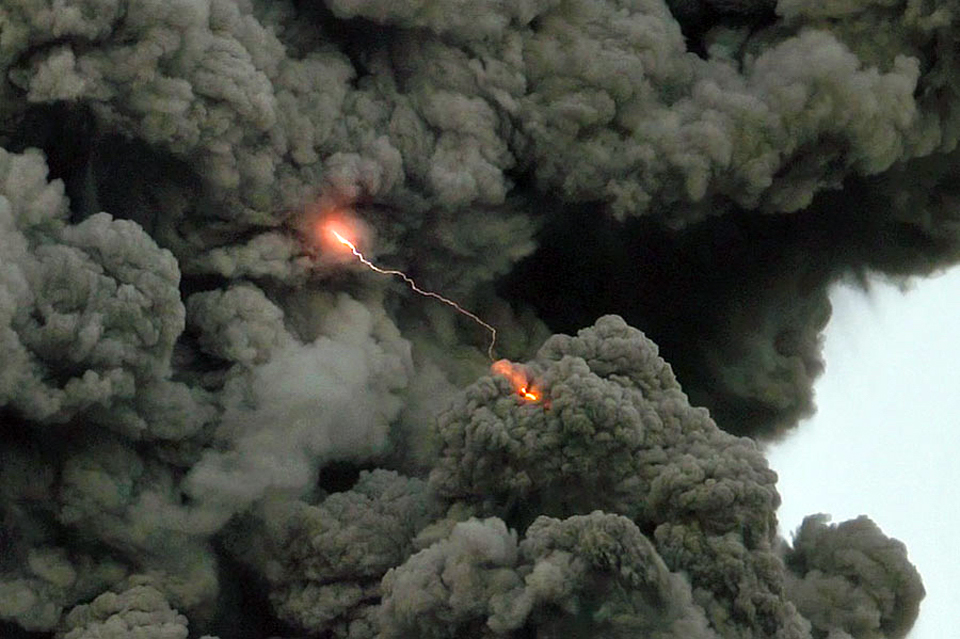 |
Figure 84. Lightning strikes were photographed within the dense ash plumes that rose from the summit of Reventador during the first week of December 2017. Photograph copyright by Martin Rietze and used with permission. |
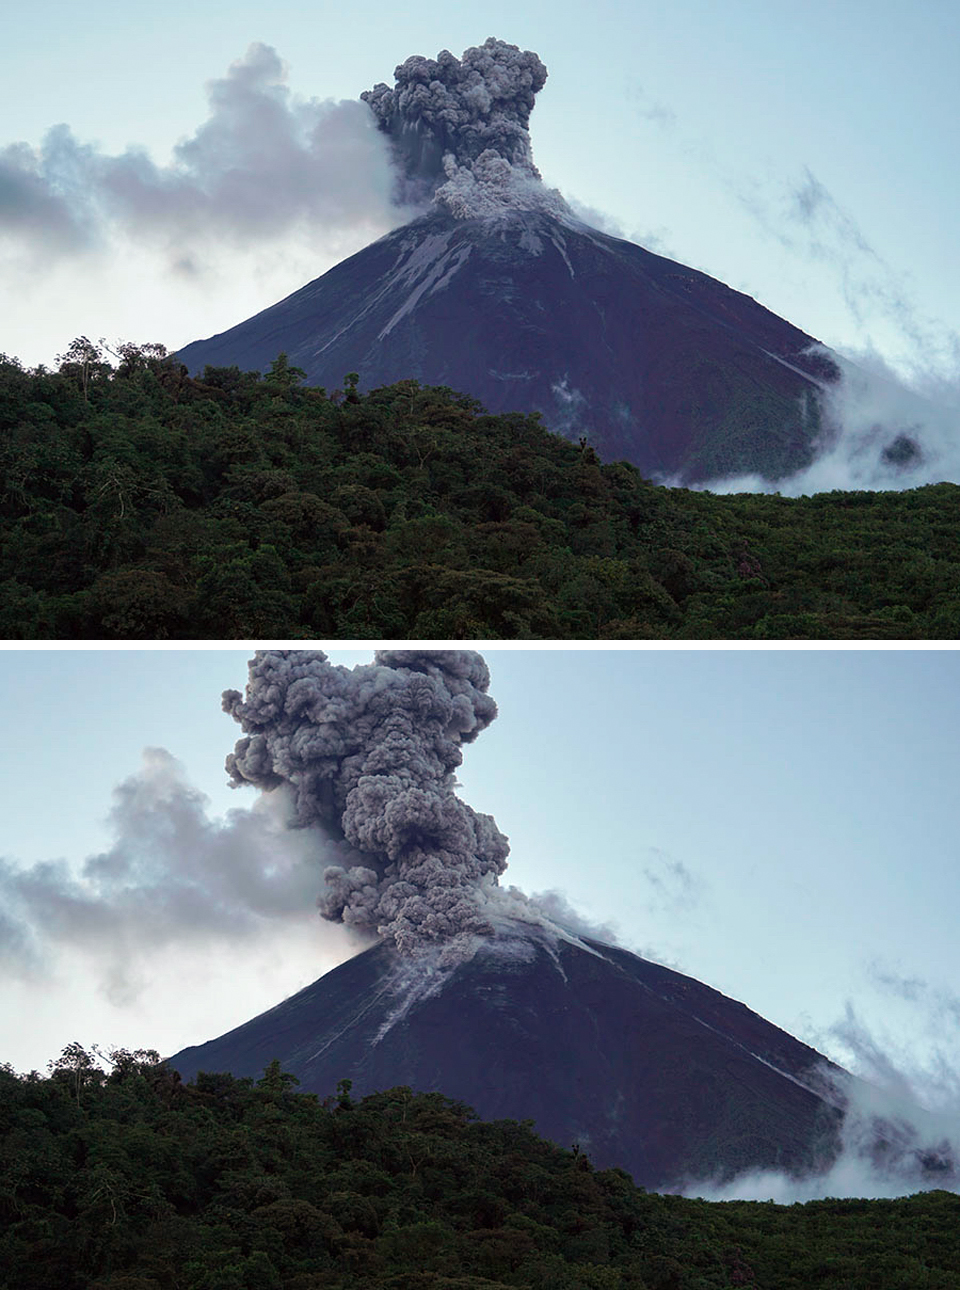 |
Figure 85. Explosions at Reventador during the first week of December 2017 produced dense ash plumes and small pyroclastic flows down multiple flanks. The flanks were bare at the beginning of the ash emission event (upper photo) but small pyroclastic flows can be seen descending the flanks a few moments later (lower photo). Photograph taken during 1-7 December 2017, copyright by Martin Rietze and used with permission. |
Activity during January-March 2018. Except for several cloudy days during the third week of January 2018 when no observations were possible, IGEPN reported recurring emissions of steam, gas, and ash rising over 600 m and drifting mostly W or NW throughout the month. During 11-12 January ash plumes briefly drifted E. Incandescent block avalanches were reported most often traveling 200-400 m down the S and SE flanks; a few times they travelled up to 800 m down all the flanks. Other than the cloudy days of 20-24 January, the Washington VAAC issued multiple daily aviation alerts. When ash plumes were visible in satellite imagery, plume altitudes ranged from 4.3-4.9 km, except for 30-31 January when they were reported at 5.2 km (figure 86).
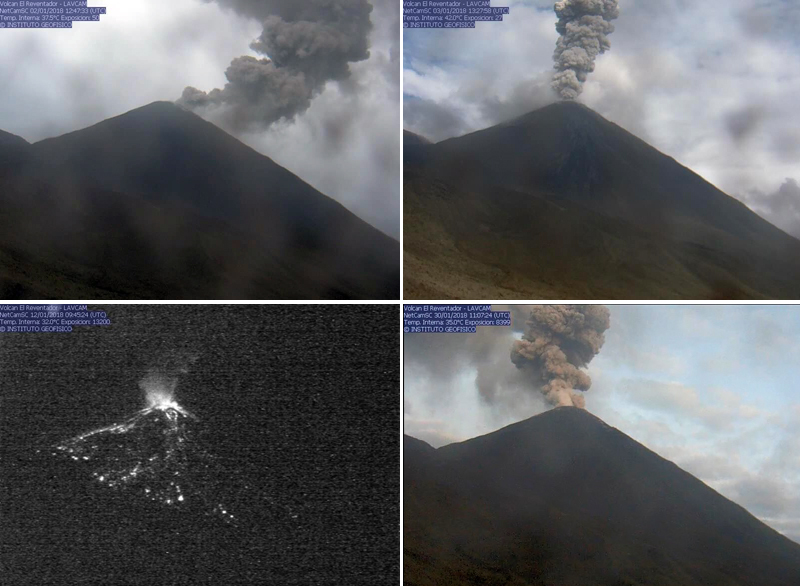 |
Figure 86. Ash plumes and incandescent blocks were reported numerous times at Reventador during January 2018. Top left: Steam, gas, and ash were reported rising over 600 m and drifting NW and E on 2 January. Top right: on 3 January, the drift directions of the steam, gas, and ash plumes were W and NE. Lower left: Incandescent blocks were reported travelling 800 m down all the flanks on 12 January. Lower right: Ash plumes on 30 January were reported by the Washington VAAC at 5.2 km altitude, the highest during the month; they drifted N and W. Courtesy of IGEPN (Informe Diario del Estado del Volcán Reventador, Nos. 2018-2, 2018-3, 2018-12, and 2018-30). |
Multiple daily aviation alerts continued from the Washington VAAC throughout February 2018. While daily plume heights mostly averaged 4.3-4.9 km altitude, there were a greater number of higher-altitude ash plumes than during recent months. A plume on 5 February was reported at 6.1 km drifting 15 km N and a plume the following day drifted 30 km ENE at 7.6 km altitude. A plume on 16 February rose to 5.5 km and drifted 55 km NW; one on 22 February rose to 7.0 km and drifted almost 100 km SE before dissipating. The next day, a plume rose to 5.5 km and drifted 35 km SE. Two separate plumes were observed in satellite imagery drifting NE on 25 February, the first rose to 5.5 km and drifted 110 km and the second rose to 6.4 km and drifted 45 km before dissipating. IGEPN reported a plume of steam, gas, and ash on 27 February that rose over 1,000 m above the summit and drifted NE. Although IGEPN only reported incandescent avalanche blocks on 11 days in February, more likely occurred because the view was obscured by weather clouds for 14 days of the month.
Minor ashfall in the vicinity of the volcano was reported by IGEPN on 1 March 2018. They also noted steam and gas plumes containing moderate amounts of ash that rose over 2,000 m above the summit and drifted SW and S that day (figure 87). IGEPN reported ash emissions around 600 m or higher above the summit on 21 days during the month. In addition to persistent incandescent activity at the summit, avalanche blocks rolled down all the flanks 800 m numerous times. A pyroclastic flow was reported 400 m down the S flank on 13 March (figure 88). Incandescent blocks rolled 1,000 m down all the flanks on 22 March. Other than a plume reported in satellite imagery at 5.8 km moving E on 26 March, all of the ash plumes reported by the Washington VAAC during March ranged from 3.9-4.9 km altitude and generally drifted NW or W.
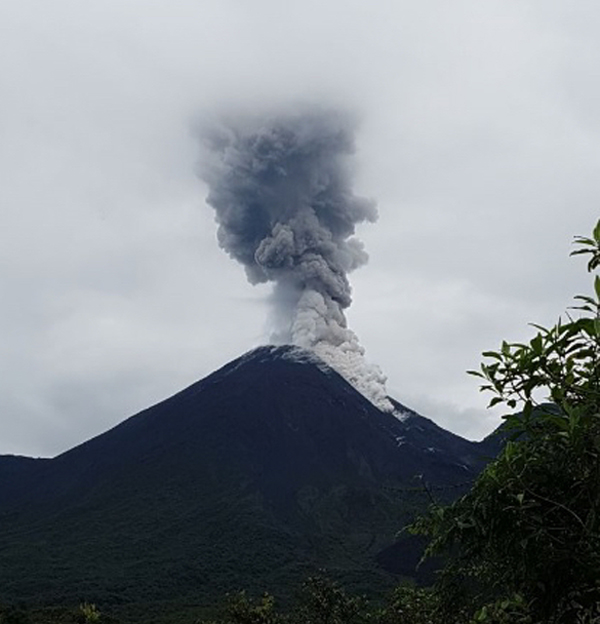 |
Figure 87. A plume of steam, gas, and ash rose from Reventador on 1 March 2018; IGEPN reported it as rising over 2,000 m above the summit and drifting SW and S. A small pyroclastic flow also appeared to descend the flank. Courtesy of IGEPN (Informe Diario del Estado del Volcán Reventador, No. 2018-60). |
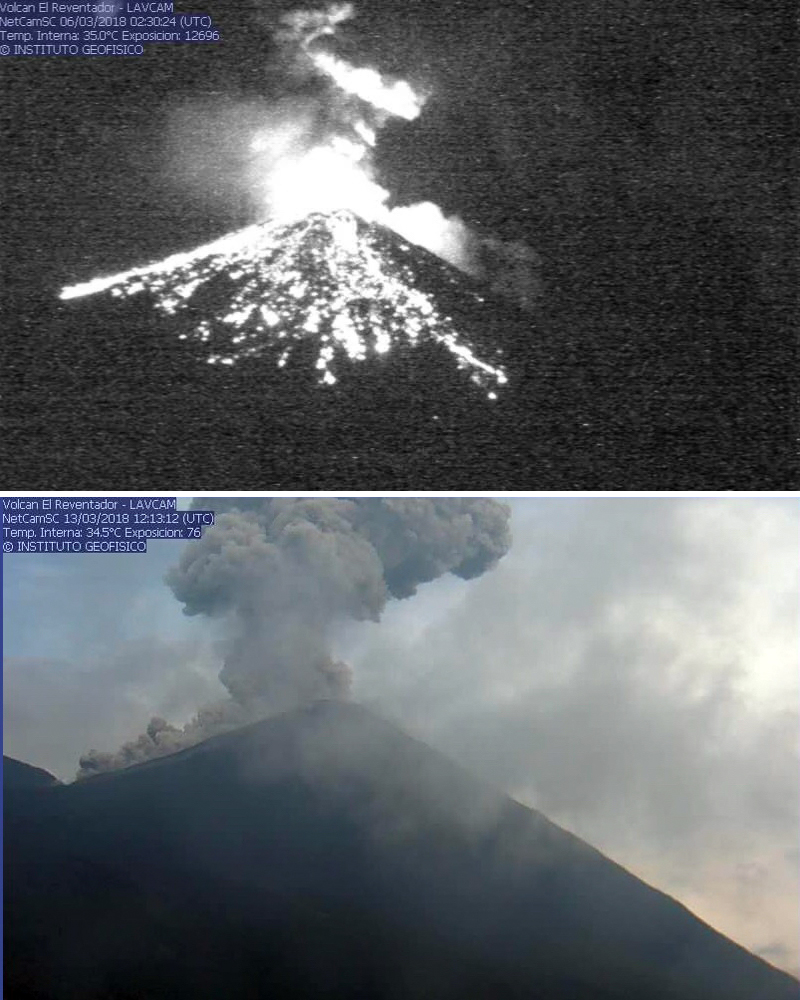 |
Figure 88. Continued explosions at Reventador during March 2018 produced abundant incandescent avalanche blocks, ash plumes, and a few pyroclastic flows. Top: Abundant incandescent blocks rolled 800 m down all the flanks on 6 March 2018. Bottom: An ash plume rose over 600 m above the summit and drifted NW while a pyroclastic flow traveled 400 m down the S flank on 13 March 2018. Courtesy of IGEPN (Informe Diario del Estado del Volcán Reventador, Nos. 2018-65 and 2018-72). |
Information Contacts: Instituto Geofísico, Escuela Politécnica Nacional (IGEPN), Casilla 17-01-2759, Quito, Ecuador (URL: http://www.igepn.edu.ec/); Washington Volcanic Ash Advisory Center (VAAC), Satellite Analysis Branch (SAB), NOAA/NESDIS OSPO, NOAA Science Center Room 401, 5200 Auth Rd, Camp Springs, MD 20746, USA (URL: www.ospo.noaa.gov/Products/atmosphere/vaac, archive at: http://www.ssd.noaa.gov/VAAC/archive.html); Hawai'i Institute of Geophysics and Planetology (HIGP) - MODVOLC Thermal Alerts System, School of Ocean and Earth Science and Technology (SOEST), Univ. of Hawai'i, 2525 Correa Road, Honolulu, HI 96822, USA (URL: http://modis.higp.hawaii.edu/); MIROVA (Middle InfraRed Observation of Volcanic Activity), a collaborative project between the Universities of Turin and Florence (Italy) supported by the Centre for Volcanic Risk of the Italian Civil Protection Department (URL: http://www.mirovaweb.it/); Martin Rietze (URL: http://mrietze.com/web16/Ecuador17.htm).
Ash plumes and explosions with ballistic ejecta continue during April-September 2018 with several lava flows and pyroclastic flows; five new vents after partial flank collapse
Reventador is one of the most active volcanoes in Ecuador. The active cone is situated in a horseshoe-shaped collapse crater that opens to the E. Typical activity consists of explosions that eject blocks onto the slopes and ash plumes, as well as occasional lava flows and pyroclastic flows. Activity has been elevated since 2002, with several breaks between eruptions during this time. Since 2002 there have been 637 volcanic ash activity reports indicating ash plumes, and 36 ash plumes have exceeded 3.1 km above the crater. This report summarizes eruptive activity for April through September 2018 and is based on Instituto Geofisico (IG-EPN) reports, Washington Volcano Ash Advisory Center (VAAC) reports, and various satellite data.
The activity at Reventador has had several broad levels of activity during this time: 'very explosive' during January to 21 April with up to 45 explosions per day; a period of reduced explosive activity from 22 April to 16 August with fewer than five explosive events per day; and 'very explosive' activity continued after 17 August. The activity produced frequent plumes, several lava flows out to 3 km from the vent, and pyroclastic flows. Incandescence was frequently observed at the crater throughout this period. A partial flank collapse occurred in April, resulting in five new vents within the new scarp on the W side. Incandescent blocks were frequently observed on the flanks, reaching down to 1 km from the crater and ash plumes were frequently observed with maximum heights of 1-3 km (table 10). The area was often concealed by cloud cover but incandescence was frequently noted when the summit was visible. Near-continuous activity was reported when the volcano was visible (figure 89).
Table 10. High levels of activity at Reventador during April-September 2018 were evident from the numbers of MODVOLC thermal alerts, days with reported ash emissions, and block avalanches. Clouds covering the volcano impacted observations of activity during most months. Compiled from IG-EPN daily reports, VAAC reports, and MODVOLC data.
| Date | MODVOLC alerts | Cloudy days | Days with ash emissions | Plume heights above summit (m) | Days with block avalanches | Block avalanche runout distances (m) |
| Apr 2018 | 0 | 14 | 18 | Less than 200 - over 1,000 | 10 | 200 - 800 |
| May 2018 | 4 | 21 | 22 | 300 - 3,100 | 1 | 800 |
| Jun 2018 | 0 | 21 | 22 | 300 - over 1,000 | 5 | 300 - 800 |
| Jul 2018 | 0 | 30 | 20 | 200 - 2,500 | 7 | 100 - 1,000 |
| Aug 2018 | 2 | 28 | 14 | 100 - over 1,000 | 4 | 600 - 1,000 |
| Sep 2018 | 1 | 26 | 27 | 400 - over 1,000 | 4 | 300 - 600 |
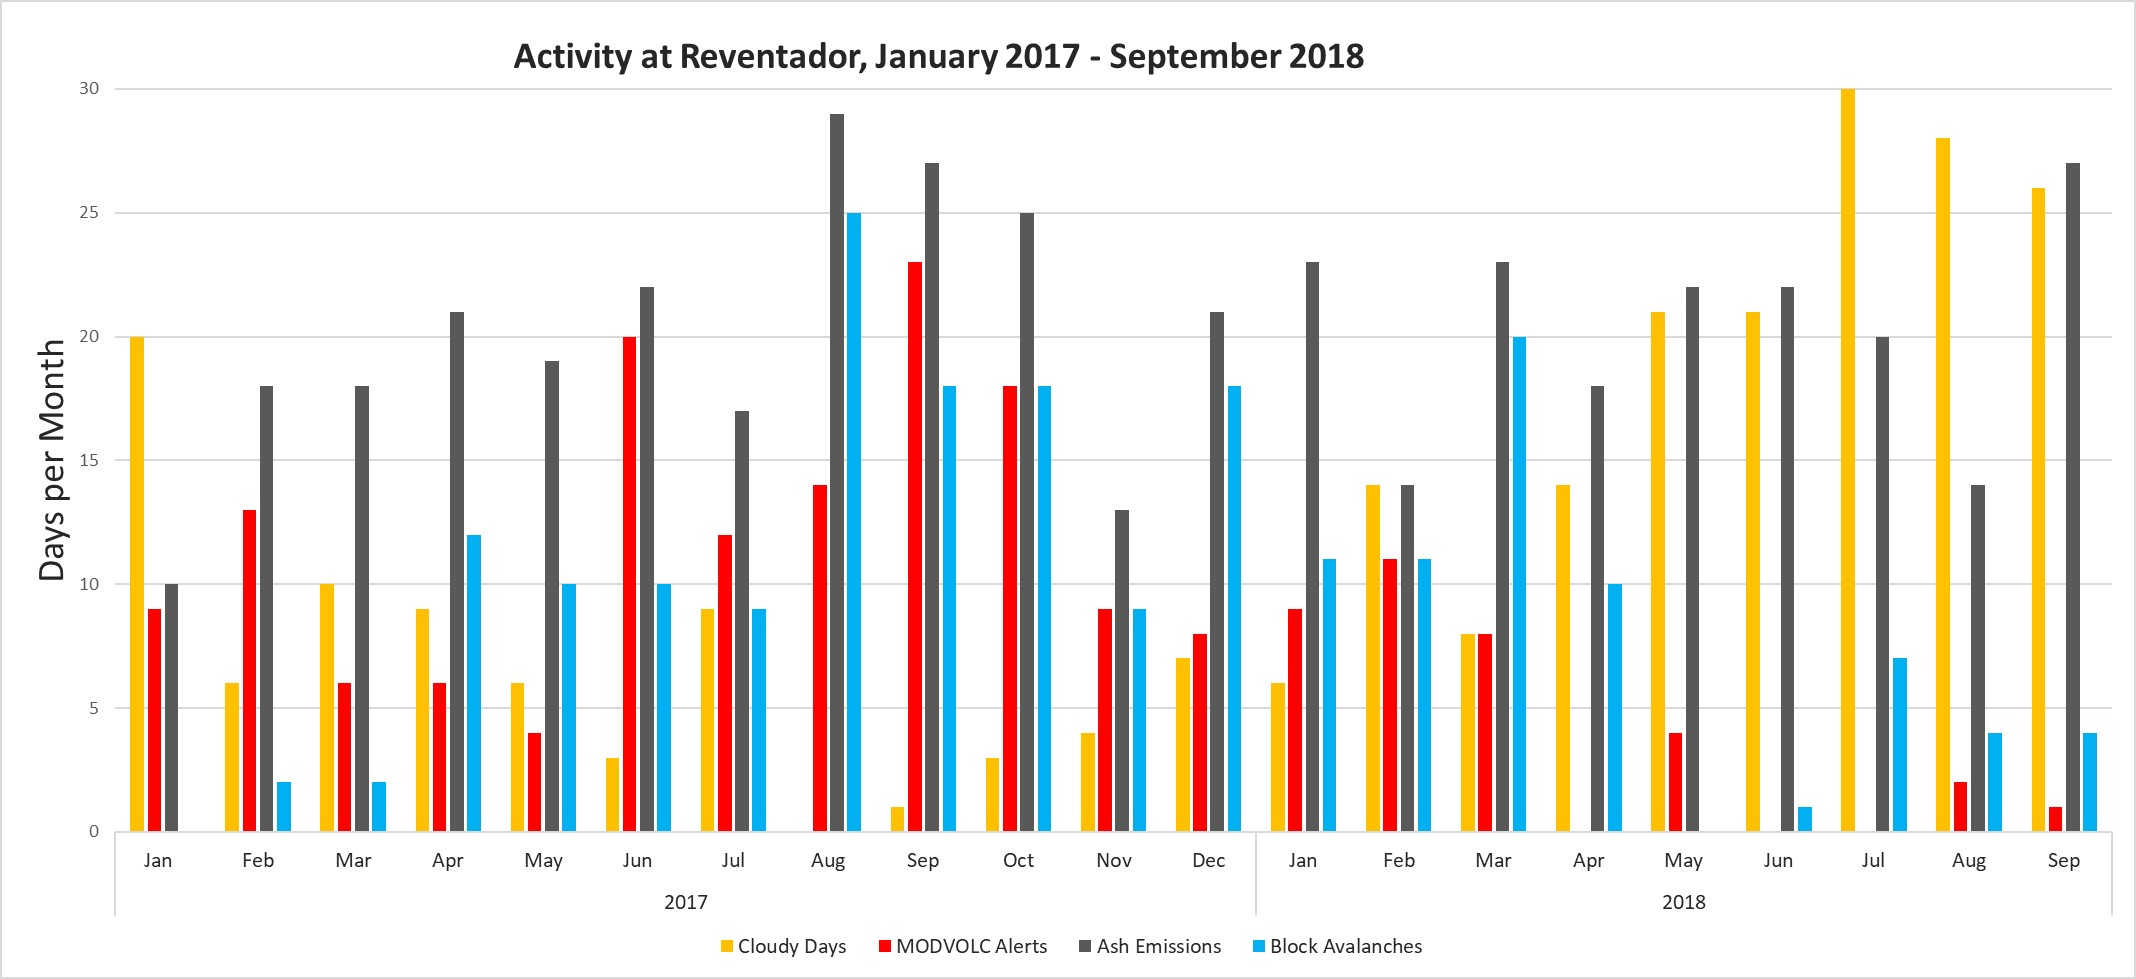 |
Figure 89. Chart summarizing monthly activity at Reventador during January 2017-September 2018 showing MODVOLC alerts (red), ash emissions (gray), and block avalanches (blue). The number of cloudy days (yellow) reduced the number of observed events during most months. Data courtesy of IG-EPN, compiled from daily reports and MODVOLC. |
Near-continuous activity continued through April, with ash or gas-and-steam plumes observed on most days when weather permitted (figure 90). On 6 April a 600-m-high ash plume was accompanied by pyroclastic flows that traveled down multiple flanks (figure 91). Light ashfall was reported to the NE of Reventador on the night of 9 April after a 600-m-high ash plume and incandescent blocks were ejected. An overflight on 12 April observed short ash plumes up to 1.5 km above the crater accompanied by "cannon-shot" booms (figure 92), a pyroclastic flow, and hot avalanche deposits radiating from the crater out to 1.6 km (figures 93 and 94). Temperatures in the vent reached 355°C and the maximum detected pyroclastic flow deposit temperature was 150°C.
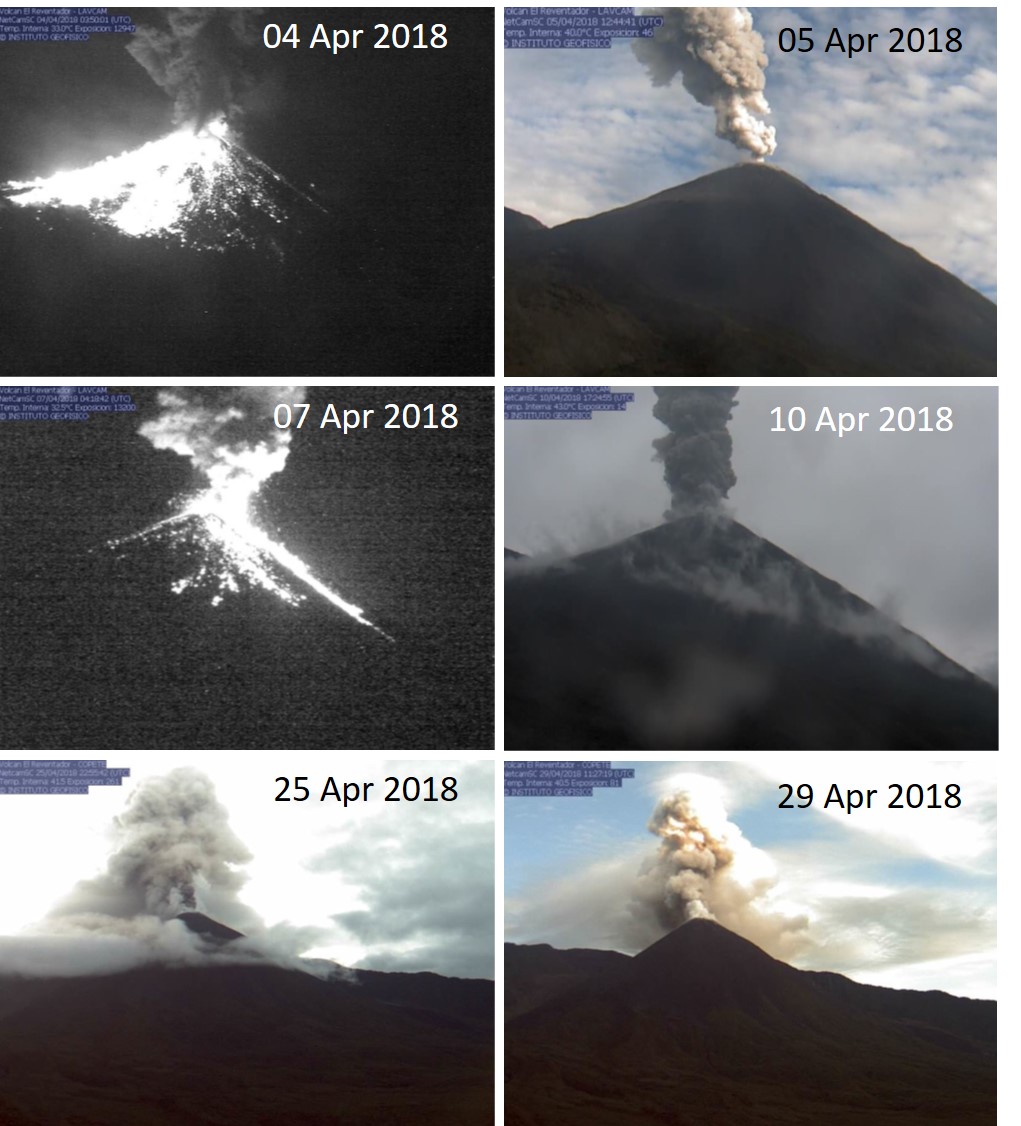 |
Figure 90. Examples of plumes at Reventador with various concentrations of ash, and explosions ejecting incandescent blocks onto the flanks during April 2018. Webcam images courtesy of IG-EPN (April 2018 daily reports). |
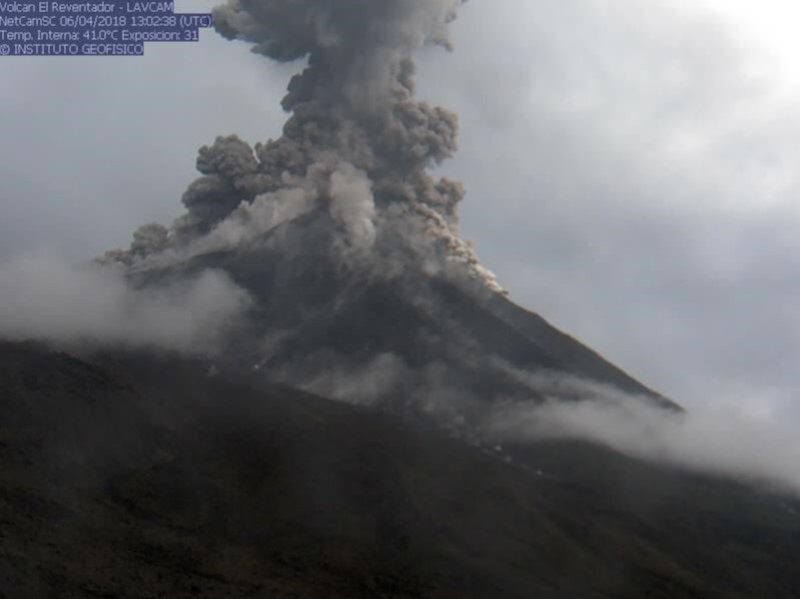 |
Figure 91. Pyroclastic flows traveling down multiple flanks during an explosive event at Reventador on 6 April 2018. Courtesy of IG-EPN (6 April 2018 daily report). |
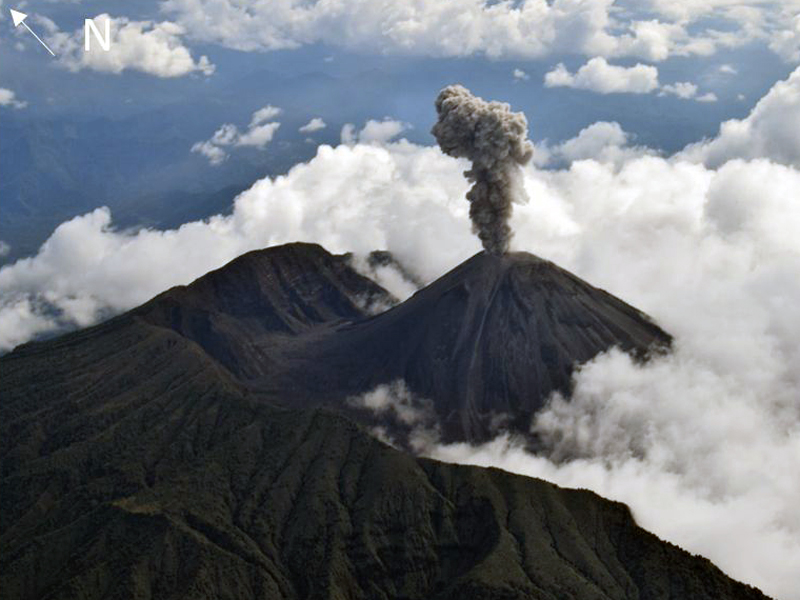 |
Figure 92. An ash plume at Reventador on 12 April 2018. Multiple Vulcanian ash plumes were observed during the monitoring overflight on this day. Courtesy of F. Naranjo, IG-EPN (10 May 2018 report). |
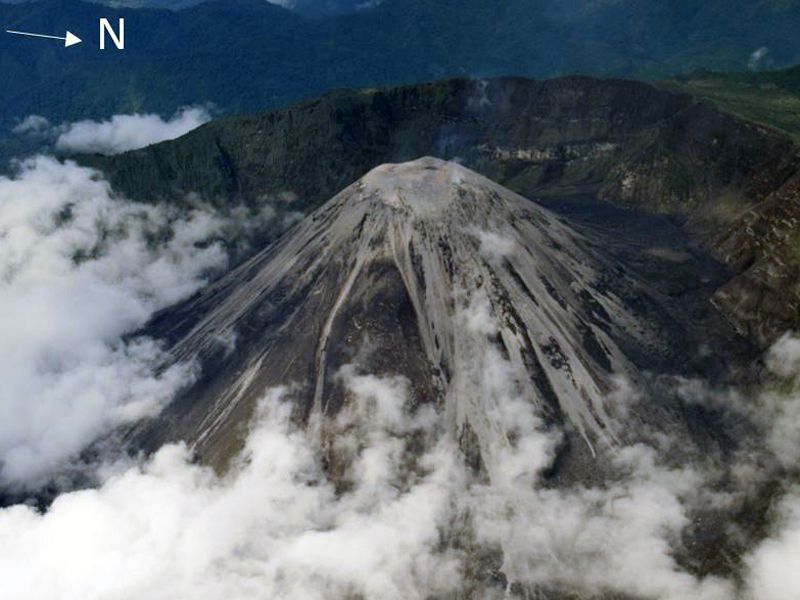 |
Figure 93. An aerial photograph of Reventador on 12 April 2018 showing fresh lighter-gray pyroclastic flow and ballistic-projectile deposits on most sides of the volcano. The deposits extended down to 800 m from the crater. Courtesy of F. Naranjo, IG-EPN (10 May 2018 report). |
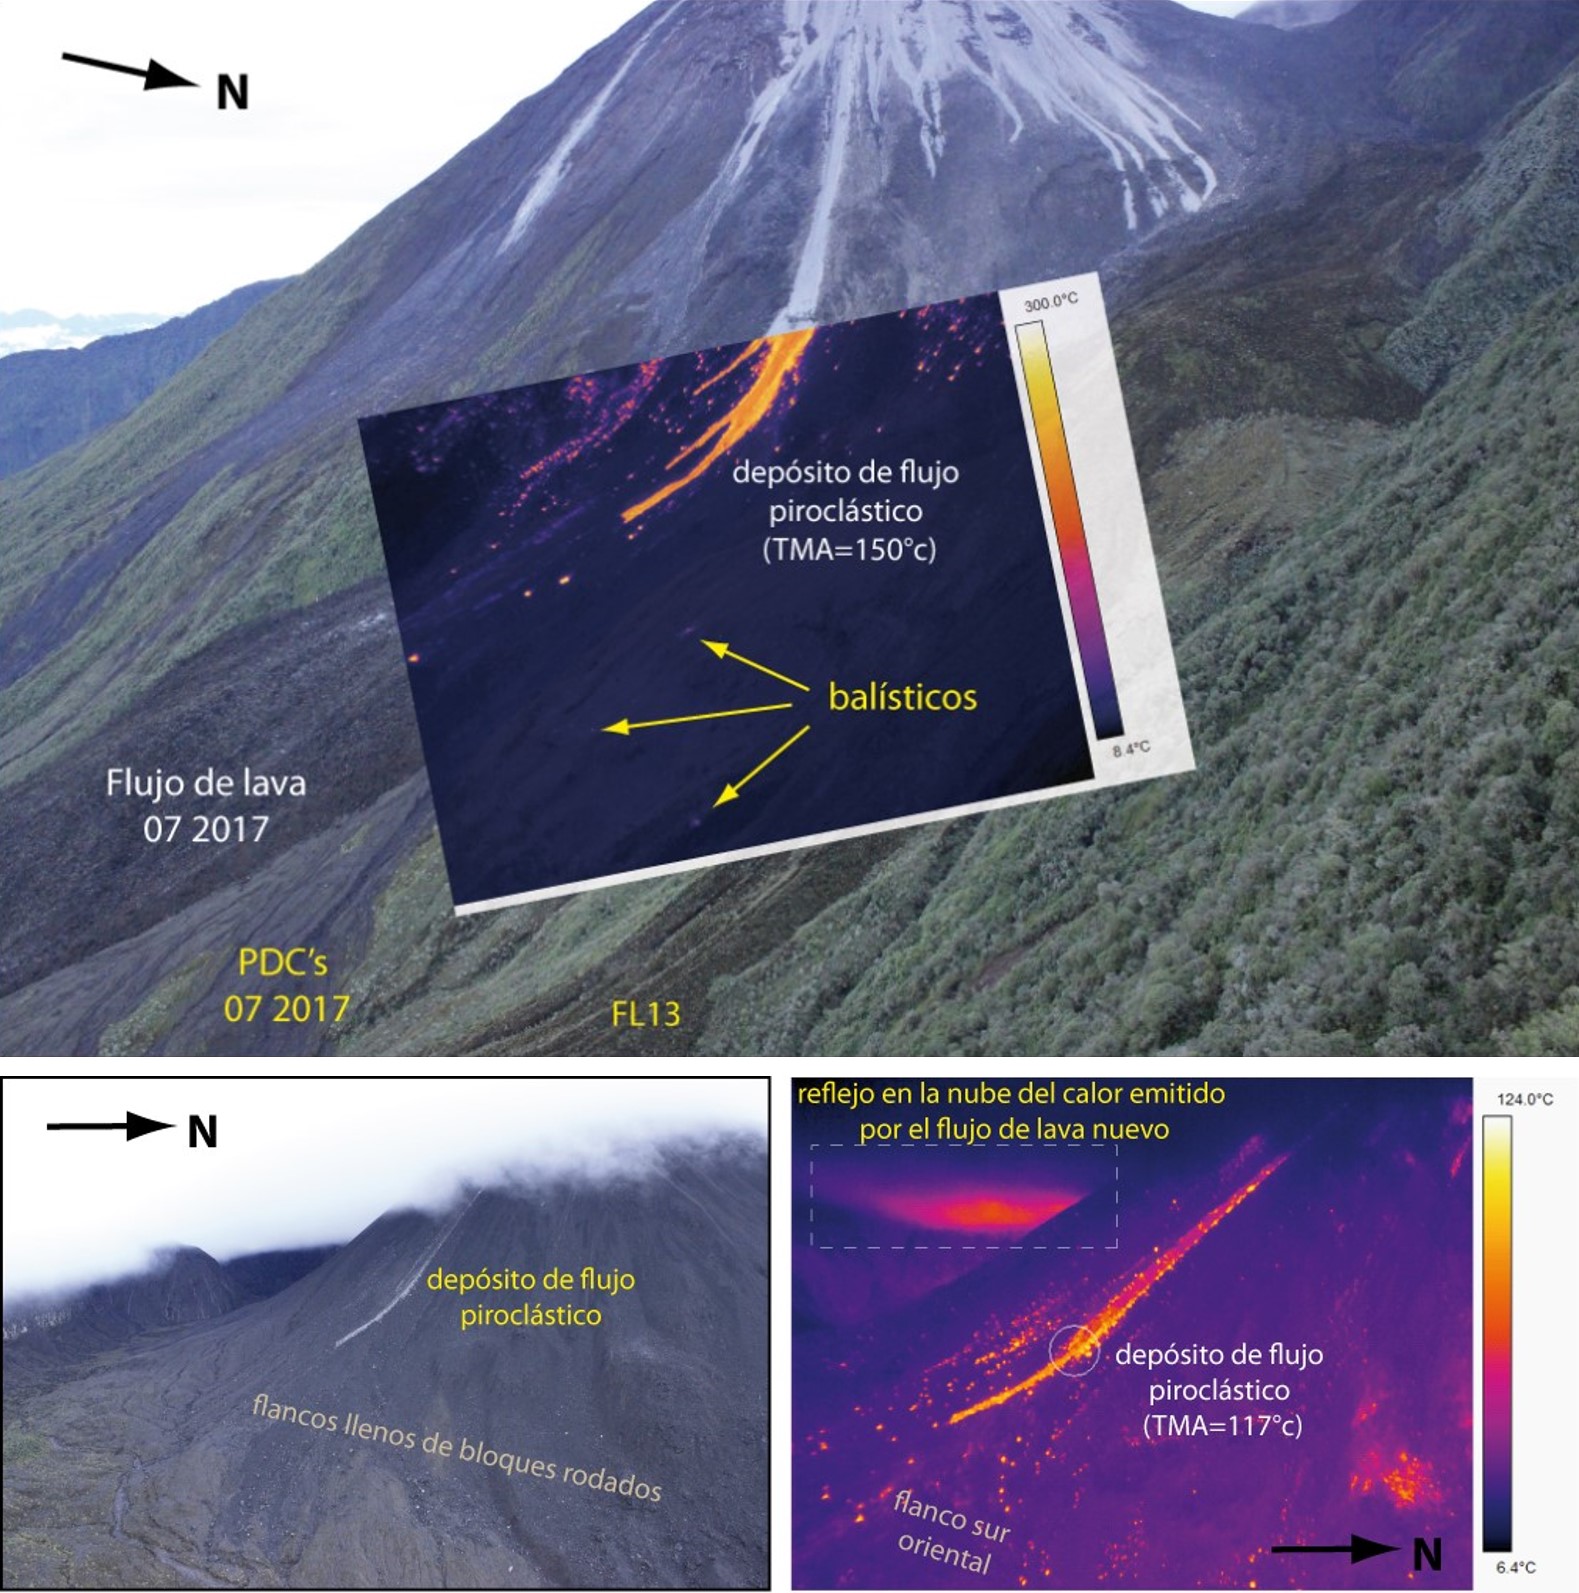 |
Figure 94. Photographs and thermal images of hot pyroclastic flow deposits on Reventador. When these images were taken on 26 April 2018, temperatures of the deposits were up to 150°C. Beyond the pyroclastic flow deposits hot ballistic blocks are visible in the thermal images, and the 2017 lava flow is visible in the top photograph. Courtesy of S Vallejo, P Ramón, IR Image: M Almeida, IG-EPN (10 May 2018 report). |
Continuous explosive activity in the second and third weeks of April caused a partial collapse of the western flank, including part of the summit (figure 95). The length and width of the resulting scarp was 400 x 200 m, and the maximum depth was 200 m. Within this collapse scarp, five vents had formed that were producing both effusive and explosive activity. A lava flow and pyroclastic flow deposits were observed below the collapse area. On 26 April an active lava flow was observed descending the W flank that was redirected towards the E once it reached the older collapse scarp wall (figure 96). The lava flow was active for around one month and had ceased by the time the flow was observed again during an overflight on 20 June. A thermal survey on 20 June detected temperatures within the vents ranging from 60-155°C. At the time of the survey, three out of five vents were active with either effusive or explosive activity.
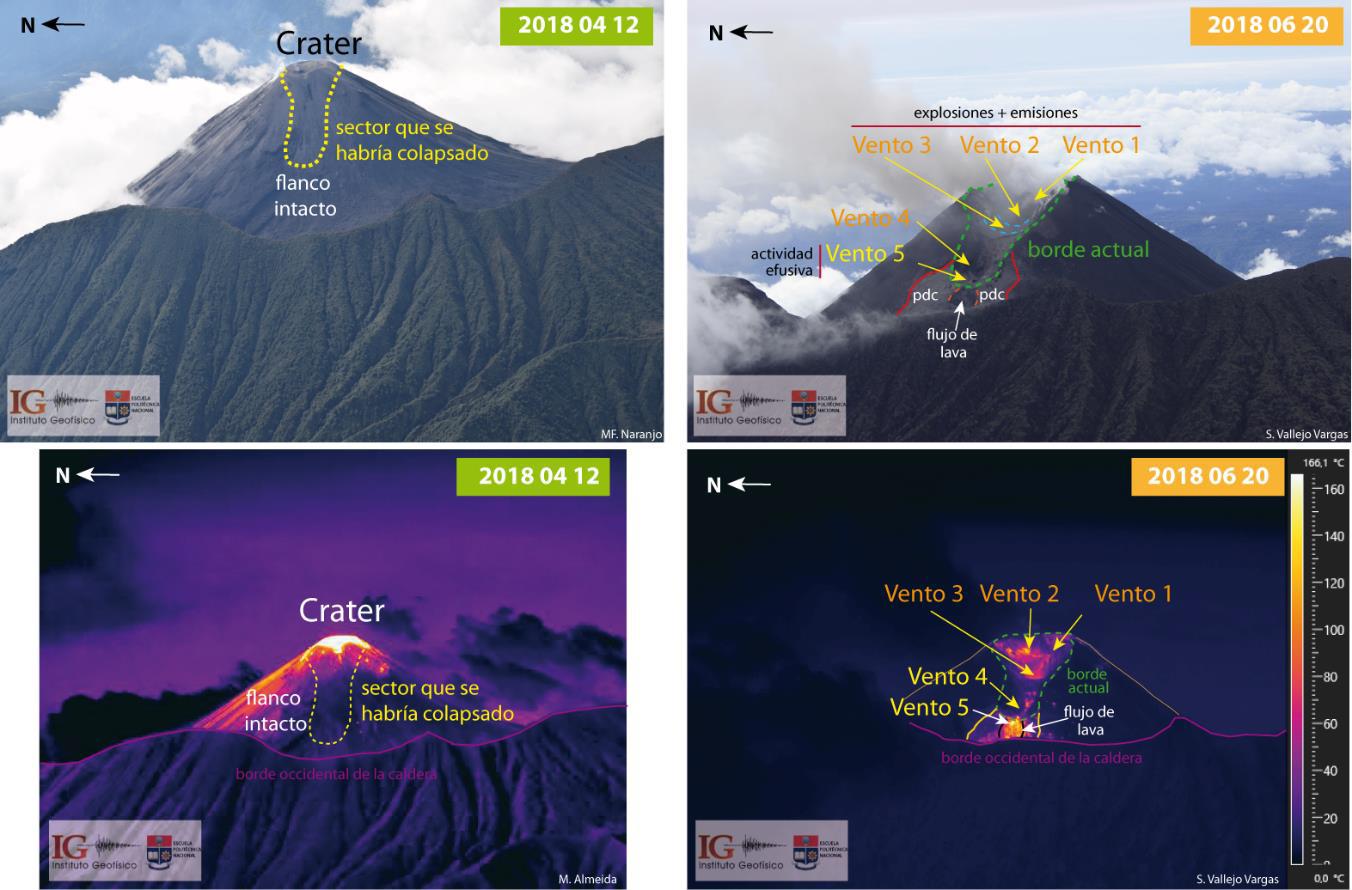 |
Figure 95. Photograph and thermal images of the western flank of the Reventador cone on 12 April 2018 (left images) and 20 June 2018 (right images). These images show the cone before and after the sector collapse that occurred mid-April as a result of continuous explosive activity. Five vents formed within this scarp, indicated in the 20 June images, which went on to produce explosive and effusive activity. Pyroclastic flow deposits and a lava flow are visible below the scarp in the 20 June images. Courtesy of M.F. Naranjo, S. Vallejo; thermal images: M. Almeida, S. Vallejo, IG-EPN (2018 Reventador annual report). |
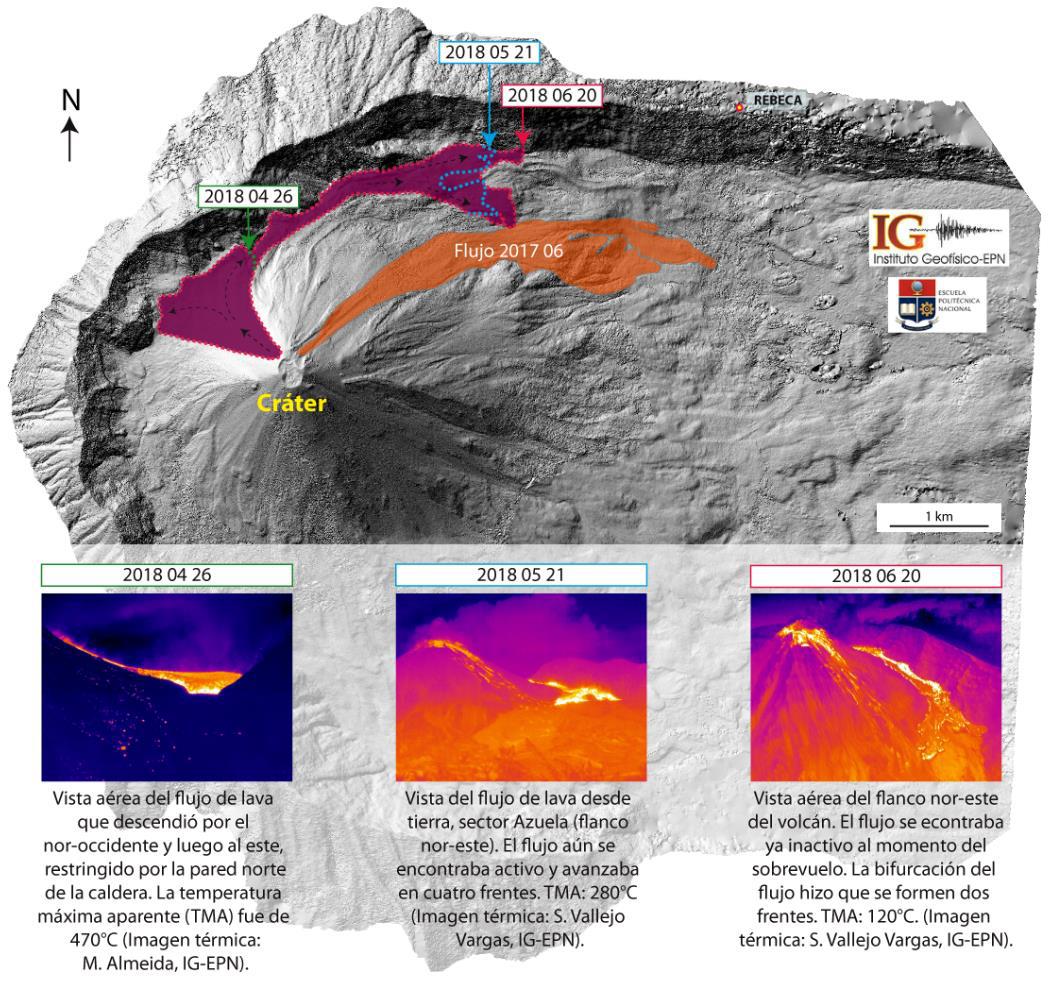 |
Figure 96. Digital Elevation Model (DEM) of Reventador showing the distribution of the lava flows generated during April and May 2018. The northern flow (purple) has three dates showing the progress of the flow that correspond to the colored thermal images below. The NE-directed flow (orange) was generated in June 2017. Translated captions for the thermal images are as follows. 2018 04 26: The lava flow descended to the NW then it was directed towards the E by the crater wall. The maximum recorded temperature was 470°; thermal image by M. Almedia, IG-EPN. 2018 05 21: The lava flow front was advancing with four lobes; thermal image by S. Vallejo, IG-EPN. 2018 06 20: An aerial view of the NE flank with the flow inactive at the time of observation. The flow had bifurcated into two flow fronts; image by S. Vallejo Vargas, IG-EPN. Image courtesy of IG-EPN (2018 Reventador annual report). |
Ash and gas-and-steam plumes continued through May with plumes reaching 3.1 km above the crater, accompanied by ballistic projectiles and hot avalanches that reached 800 m away from the crater on the flanks of the volcano. There were 12 reports of ashfall on 27 May in the provinces of Imbabura, Napo and Pichincha. On 27 May there were 12 reports of ashfall in the provinces of Imbabura (Antonio Ante, Otavalo), Napo (Quijos), and Pichincha (Cayambe, Pedro Moncayo, Quito), originating from a 3.1-km-high ash plume (figure 97).
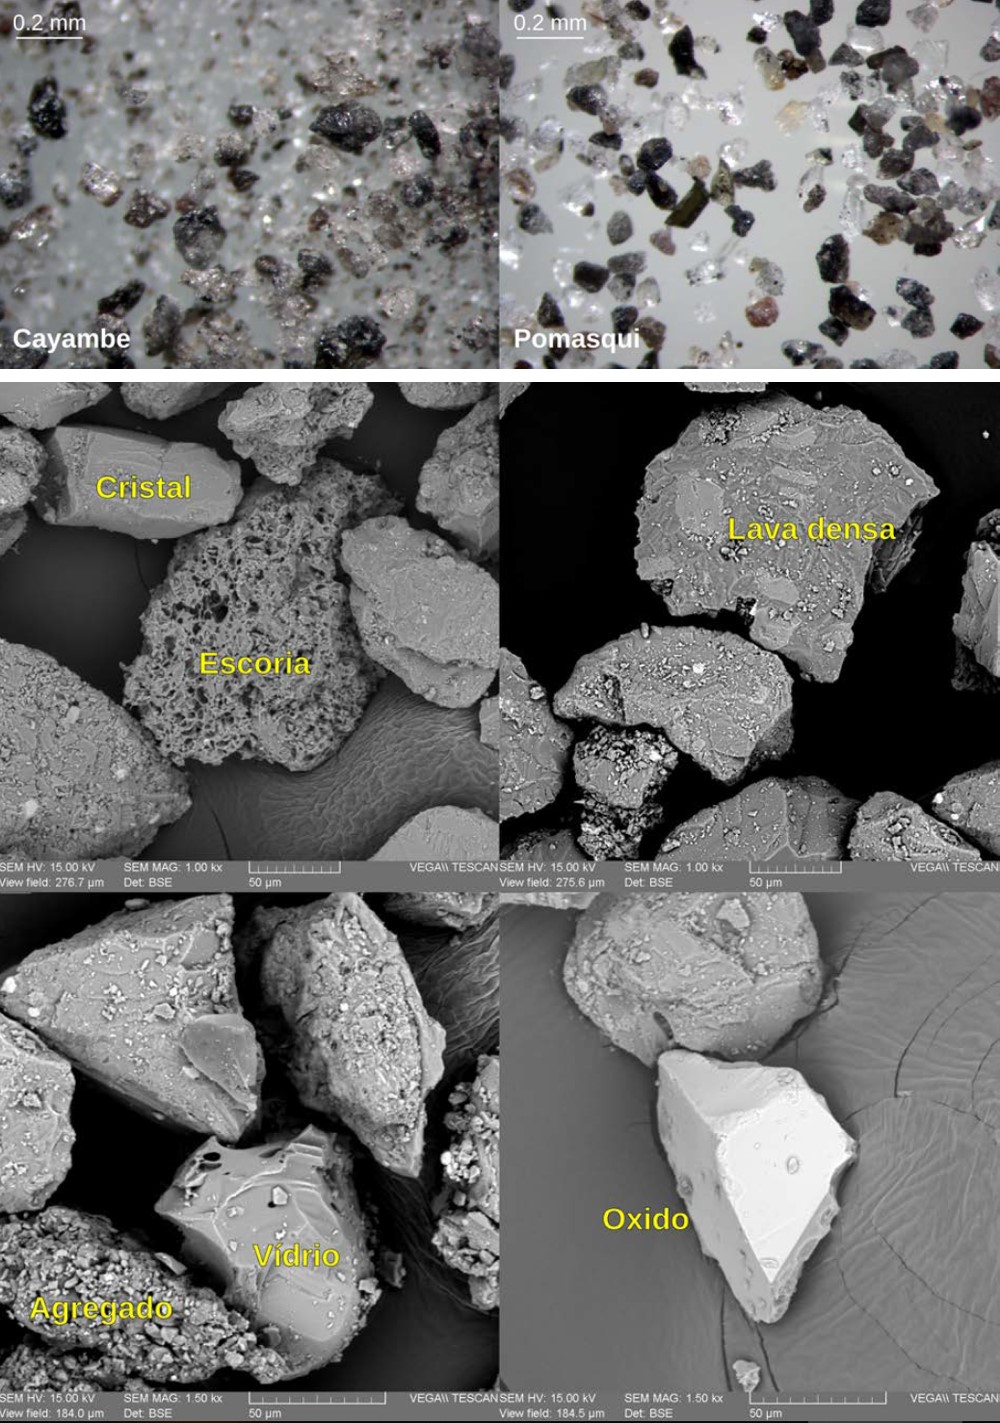 |
Figure 97. Volcanic ash samples from the 27 May 2018 Reventador ashfall event in Cayambe and Pomasqui. Top: Binocular microscope images of the ash samples showing finer ash in the Cayambe sample. The scales for these two images are 0.2 mm. Bottom: Scanning Electron Microscope (SEM) images of ash particles from the Pomasqui sample above. The images show crystals (cristal), vesicular scoria clasts (escoria), dense lava clasts (lava densa), glass (vidrio), and aggregates of fine ash that clumped together because of the humidity in the atmosphere (agregado). The scales for these four images are 50 microns. Courtesy of E. Gaunt, IG-EPN. |
Detected thermal anomalies were less frequent from June through September (figure 98). Ash and gas-and-steam plumes continued through June, reaching over 1 km above the crater (figure 99). Light ashfall was reported in Azcásubi on 28 June. Five avalanches of incandescent blocks were recorded, extending 800 m from the crater. Through July, ash and gas-and-steam plumes reached a maximum height above the crater of 2.5 km. Four incandescent block avalanches were observed down to 1 km below the crater. Ashfall was reported on 2 July in the Cayambe sector and in the town of Juan Montalvo (figure 100). Light ashfall was also reported in Tababela and Puembo on 19 July.
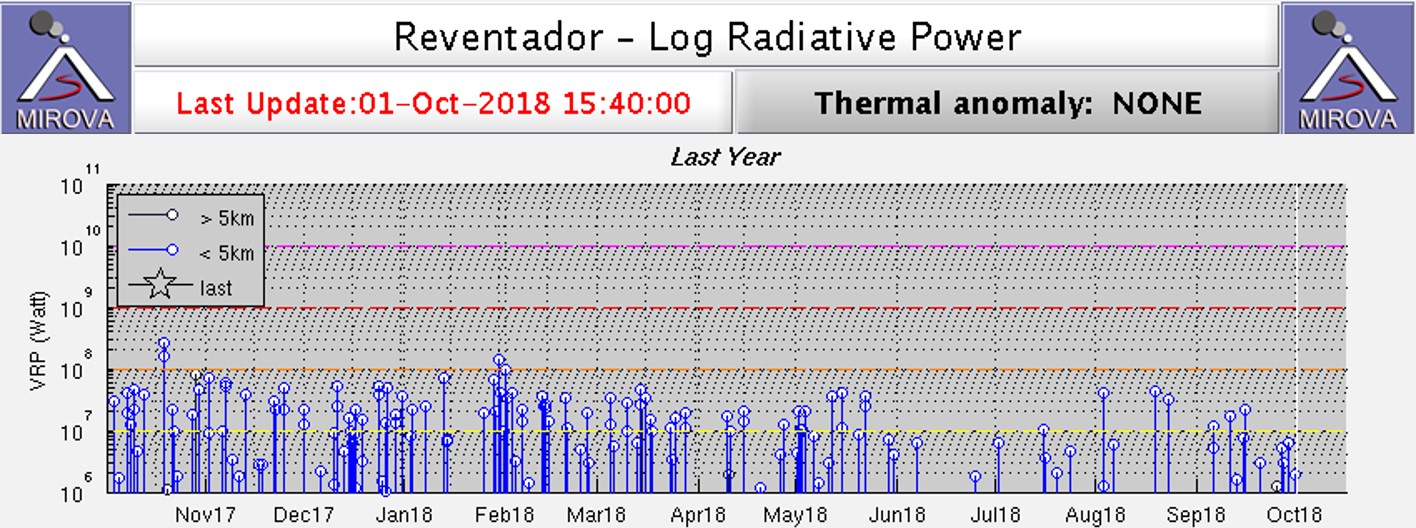 |
Figure 98. Log radiative power MIROVA plot of MODIS infrared data for the year ending 1 October 2018 showing a decrease in energy and frequency of anomalies detected at Reventador after June 2018. Courtesy of MIROVA. |
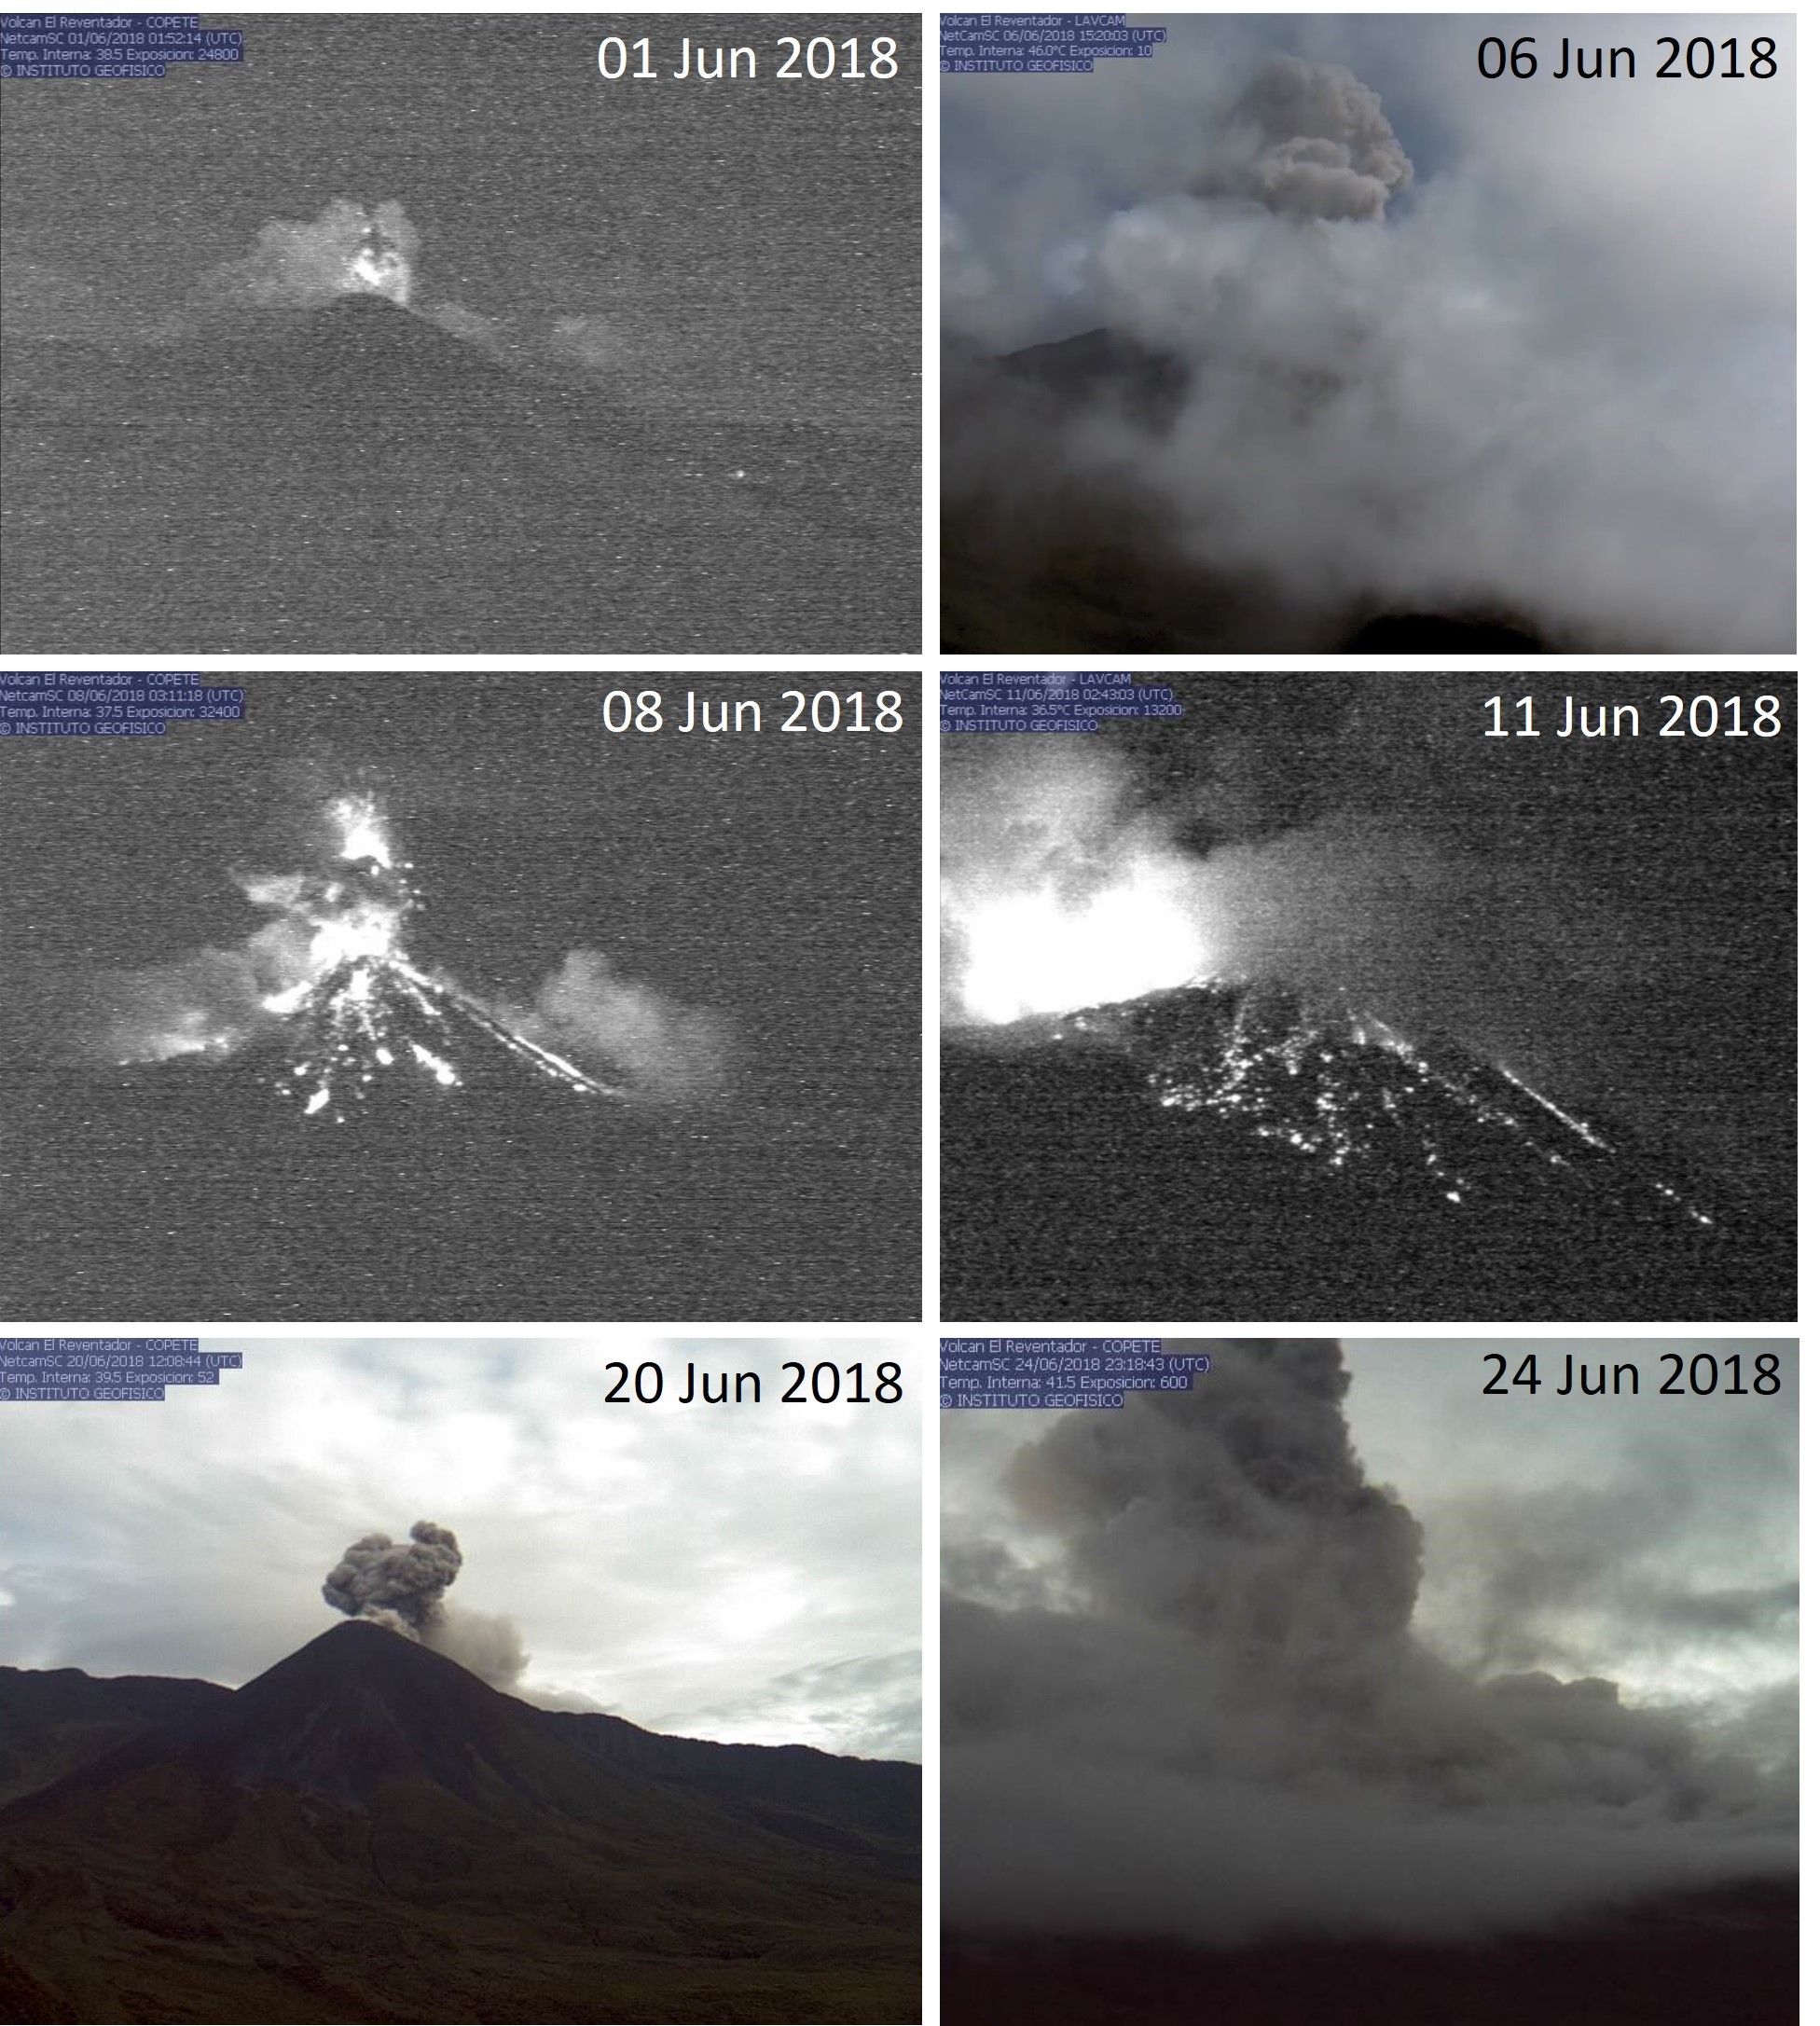 |
Figure 99. Examples of ash plumes and explosions ejecting incandescent blocks on to the flanks of Reventador during June 2018. Courtesy of IG-EPN (June 2018 daily activity reports). |
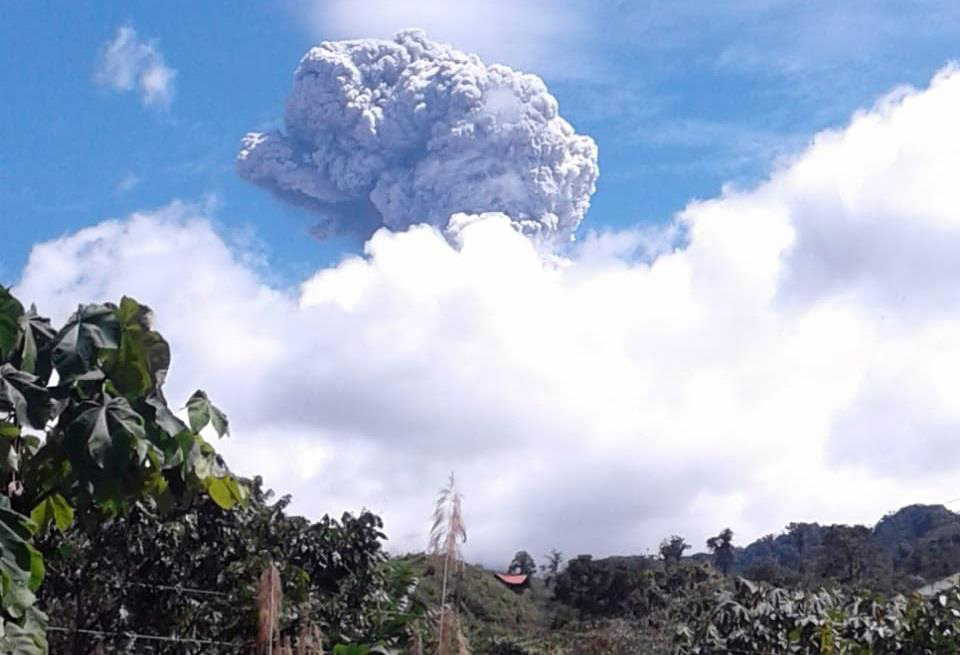 |
Figure 100. An ash plume at Reventador reached 3 km above the crater at 1130 local time on 2 July 2018. Ashfall from this plume was reported in the Cayambe sector and in the town of Juan Montalvo. Courtesy of ECU 911 Nueva Loja via IG-EPN (2 July 2018 report). |
Similar activity continued through August and September, with ash and gas-and-steam plumes reaching over 1 km from the crater (figures 101 and 102). Four avalanches were noted in both August and September, with material reaching 1 km and 600 m, respectively. A Sentinel-2 thermal satellite image acquired on 25 August showed the new morphology of the crater after the April collapse, with two active vents at that time (figure 103).
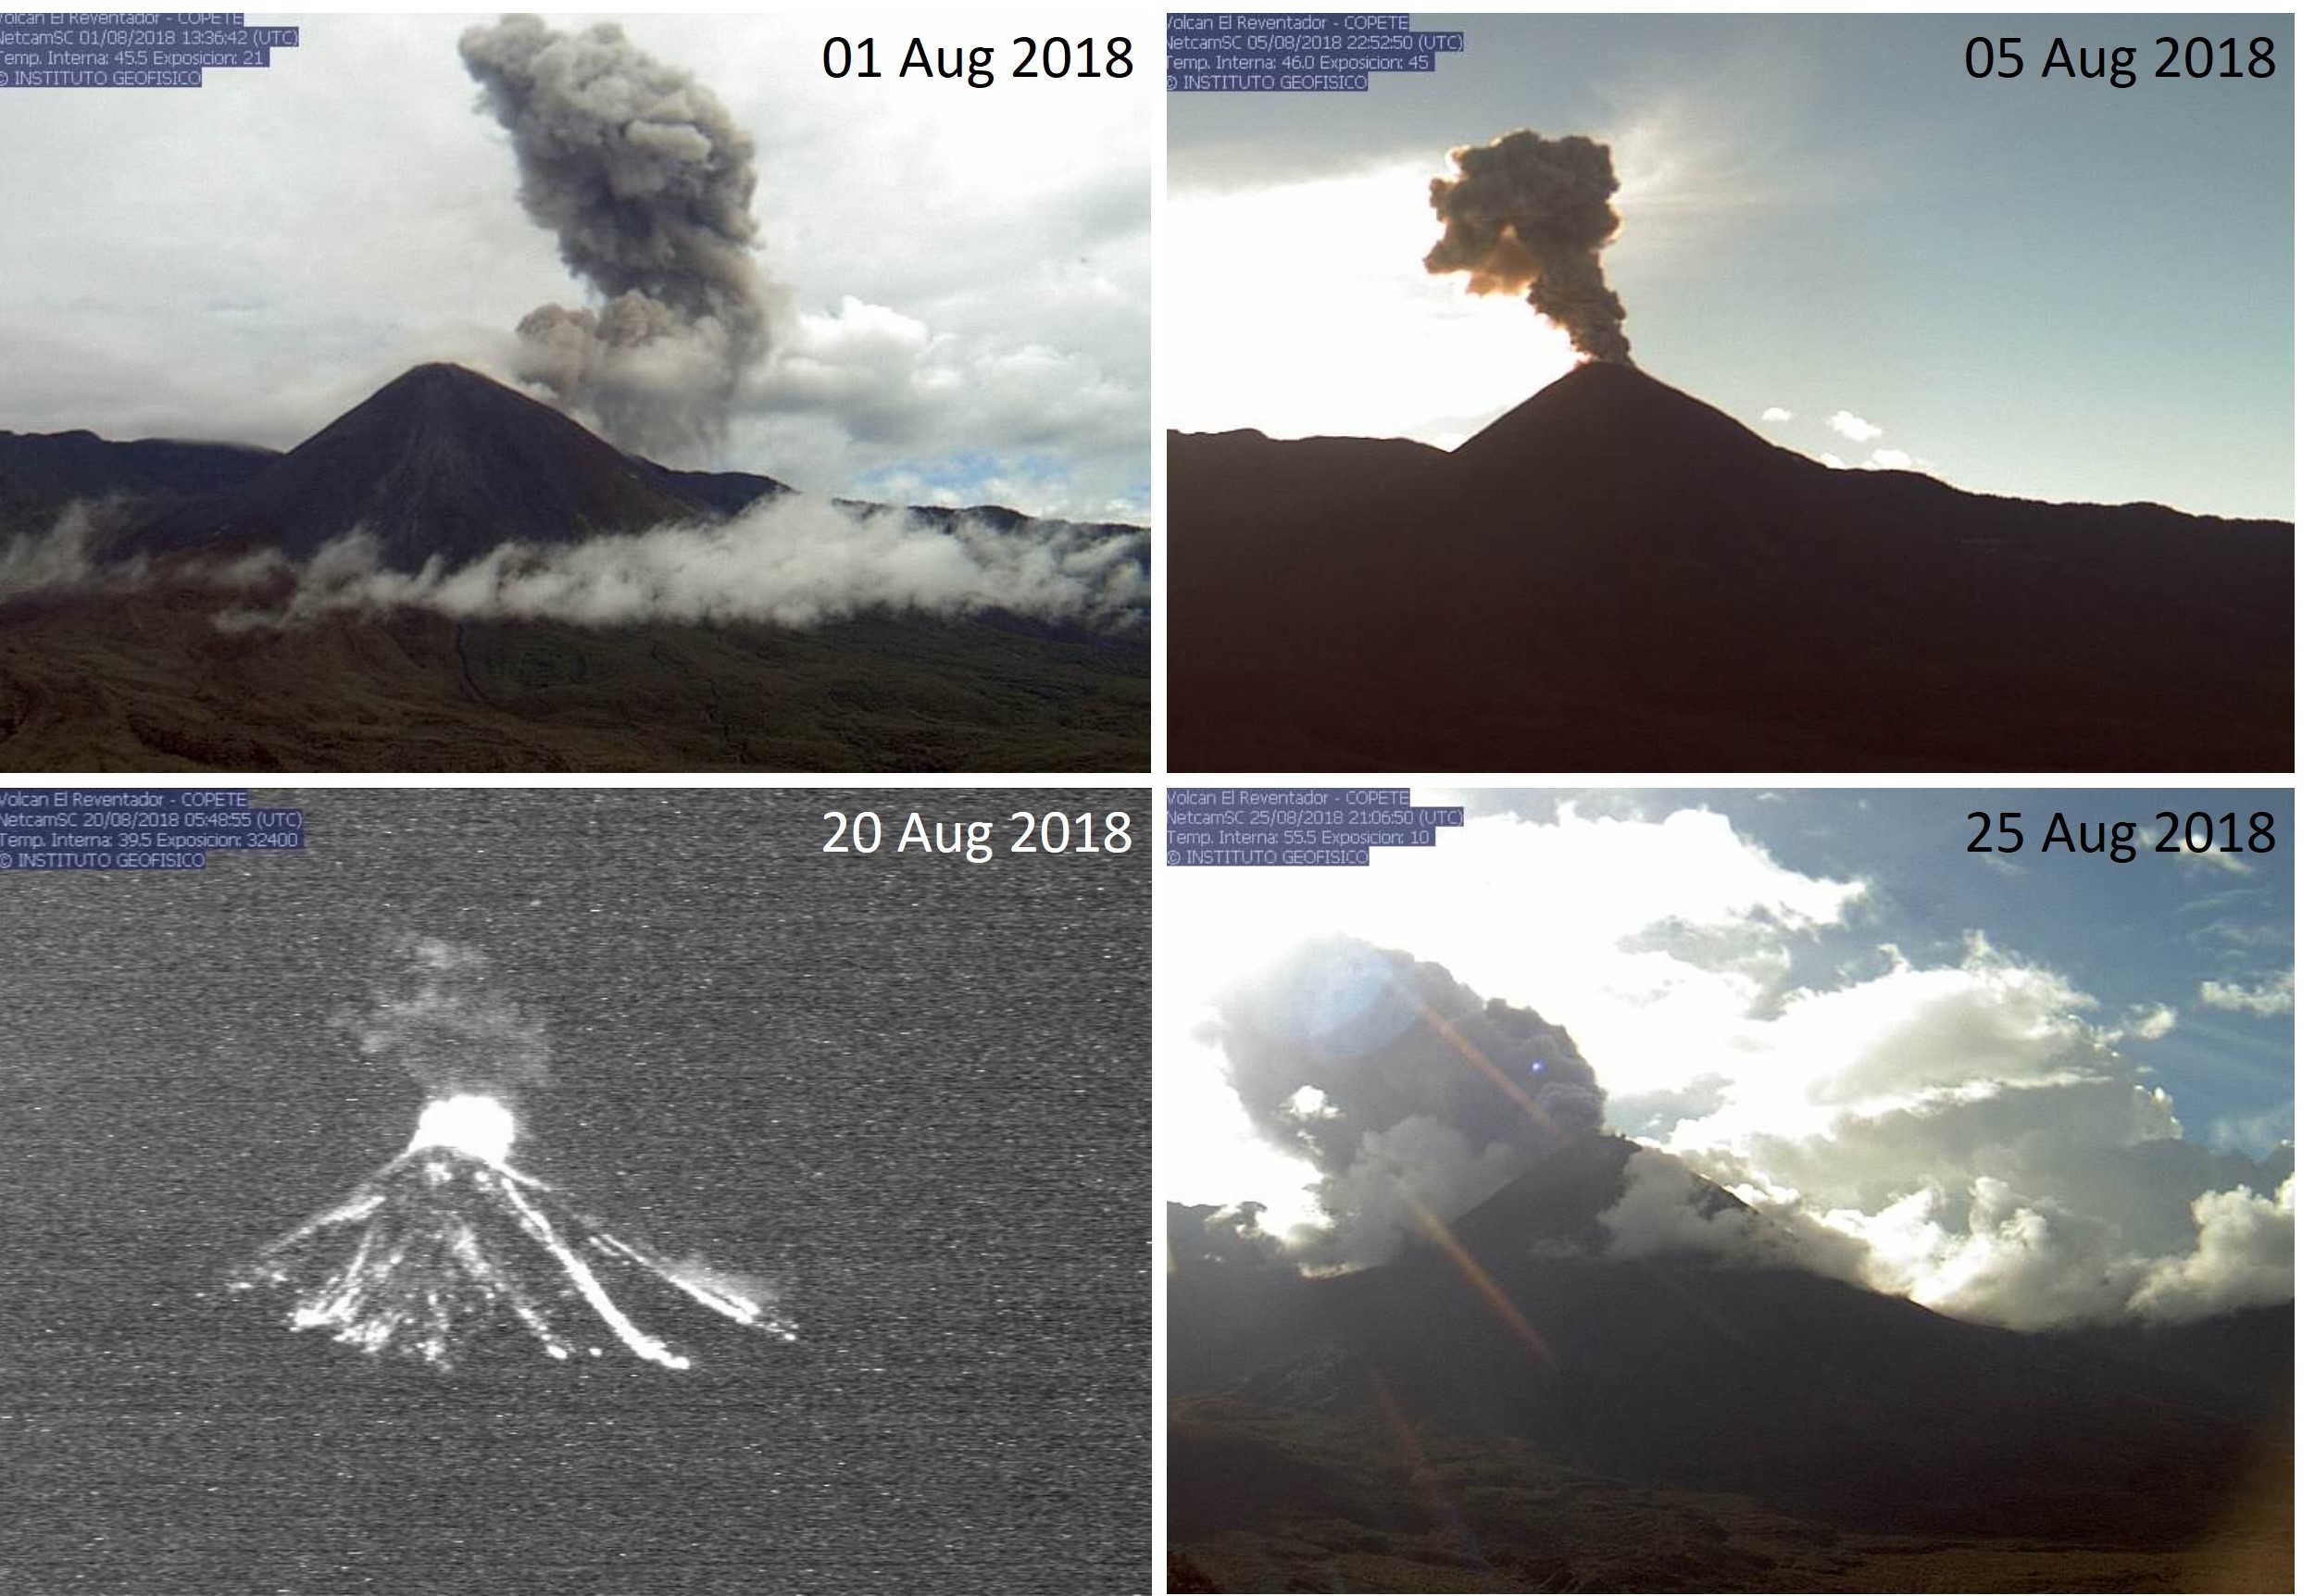 |
Figure 101. Examples of ash plumes and incandescent ballistic blocks on the flanks at Reventador during August 2018. Courtesy of IG-EPN (August 2018 daily activity reports). |
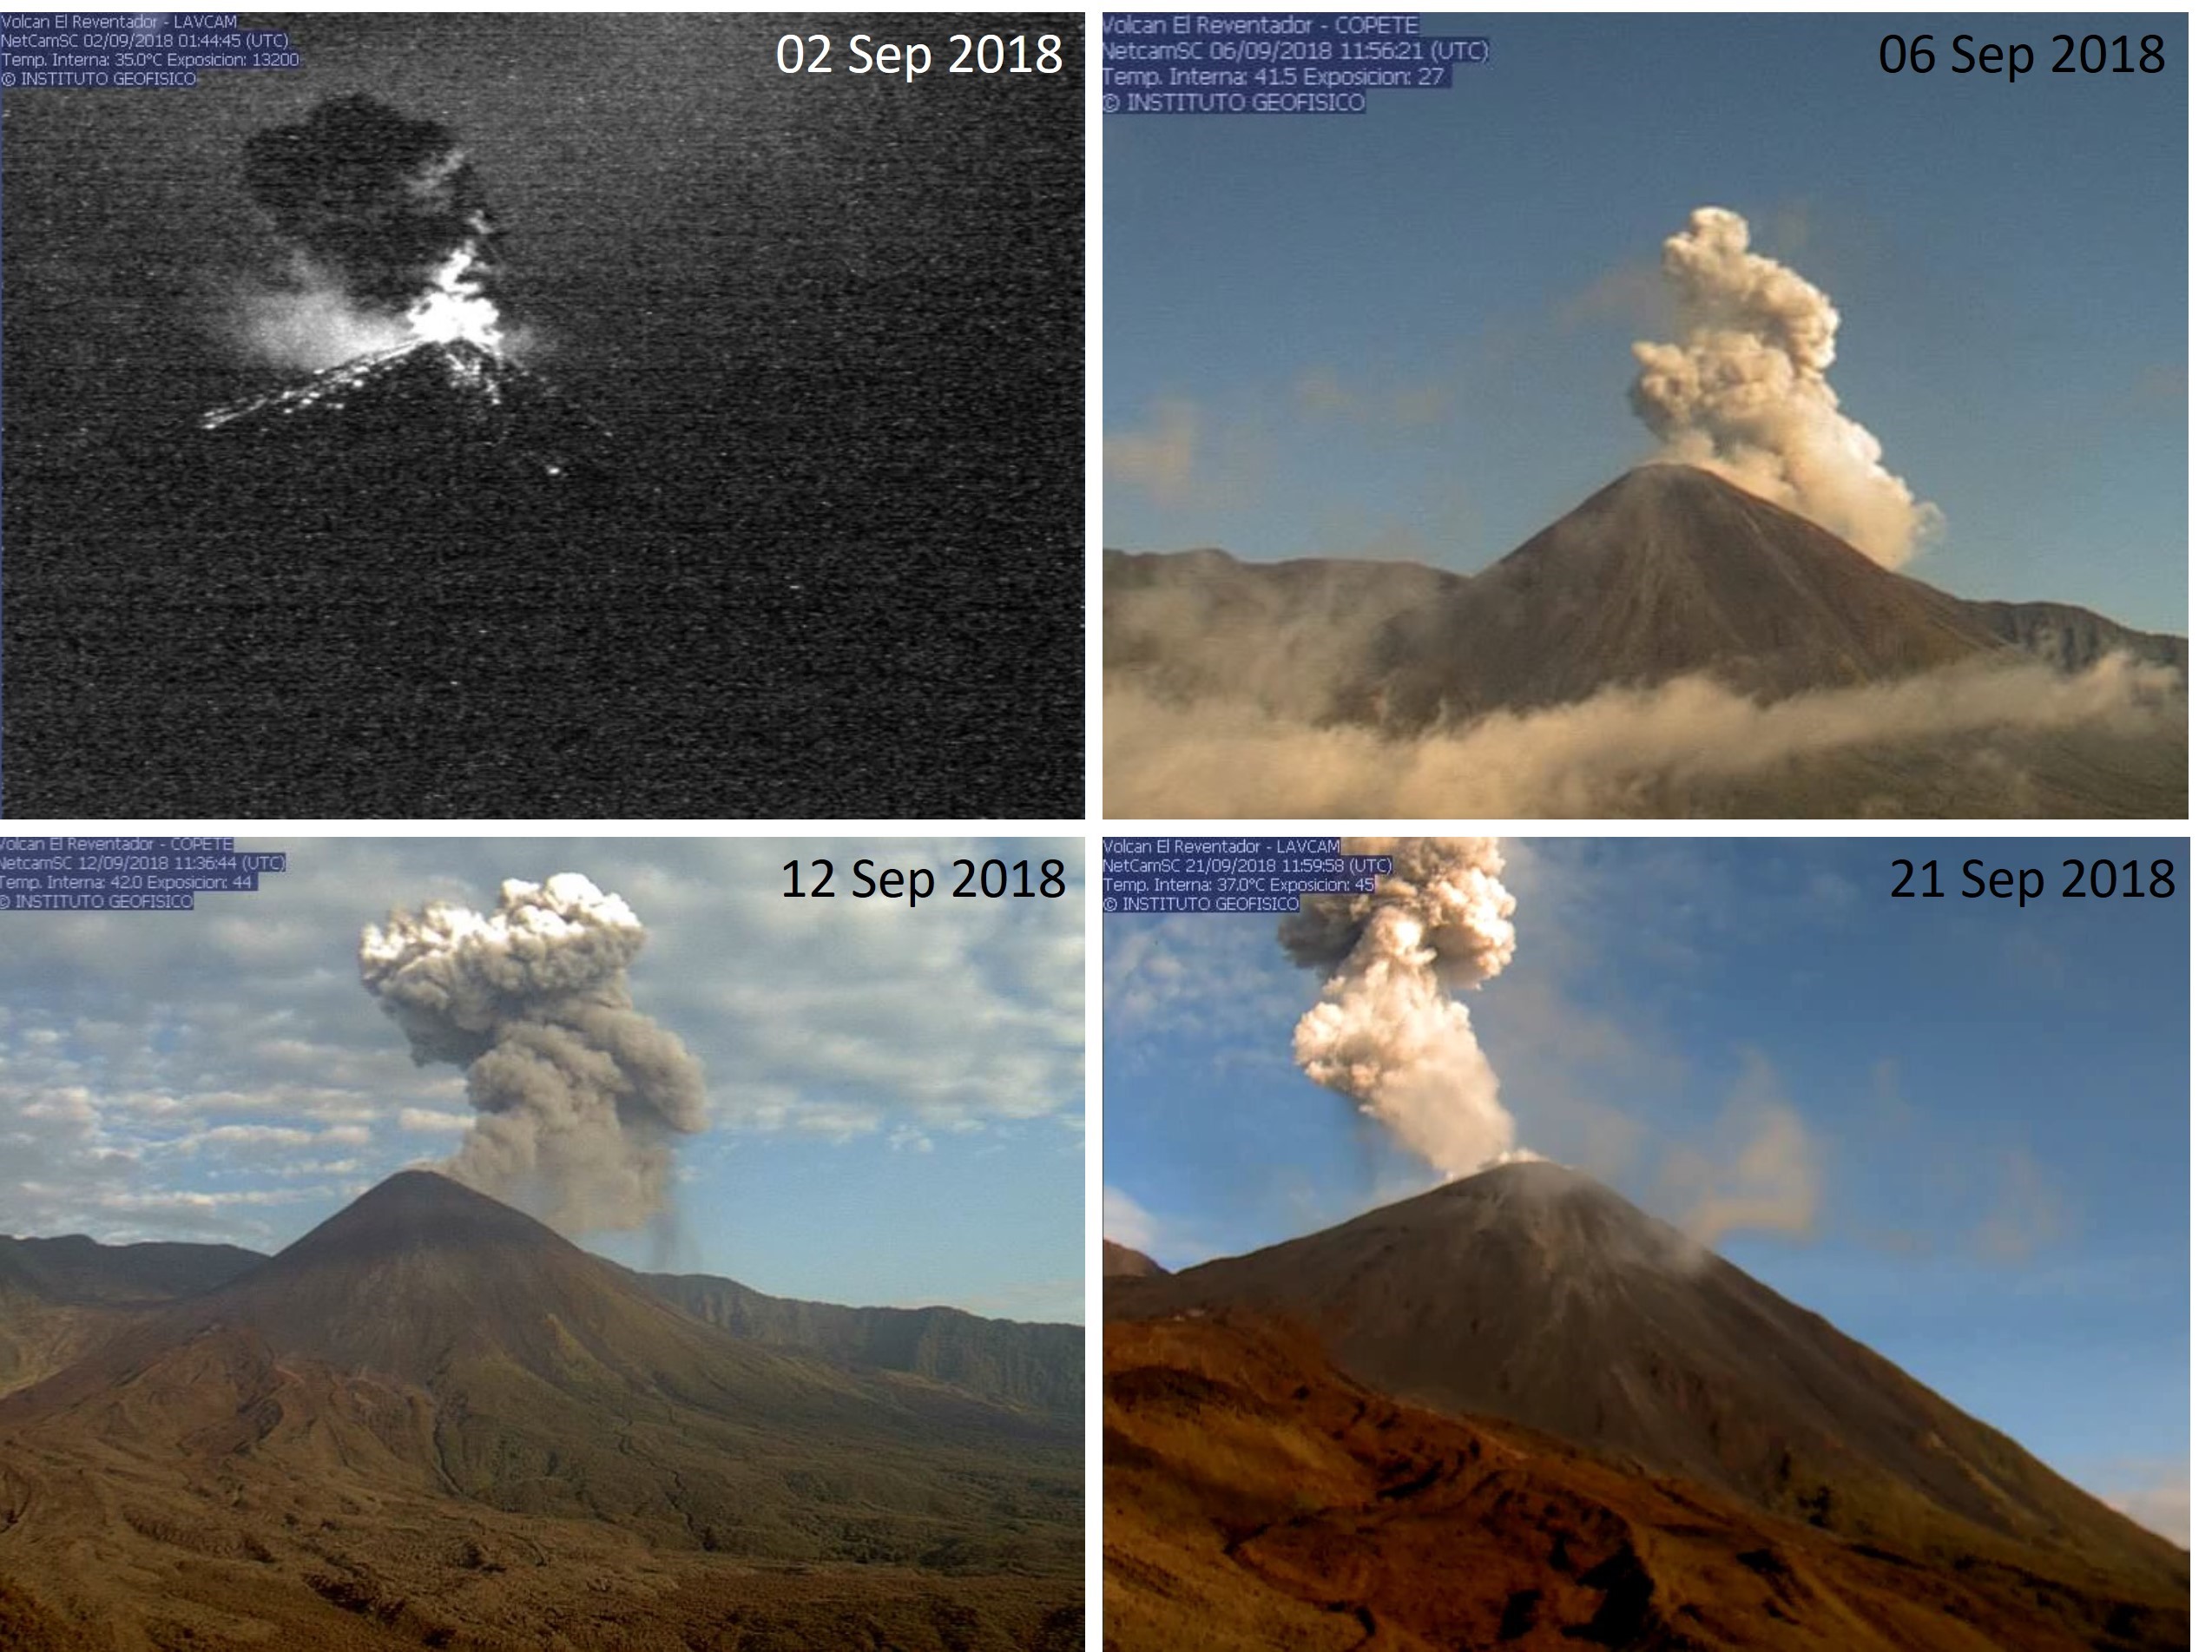 |
Figure 102. Examples of ash plumes with varying ash content and incandescent ballistic blocks on the flanks at Reventador during September 2018. Courtesy of IG-EPN (September 2018 daily activity reports). |
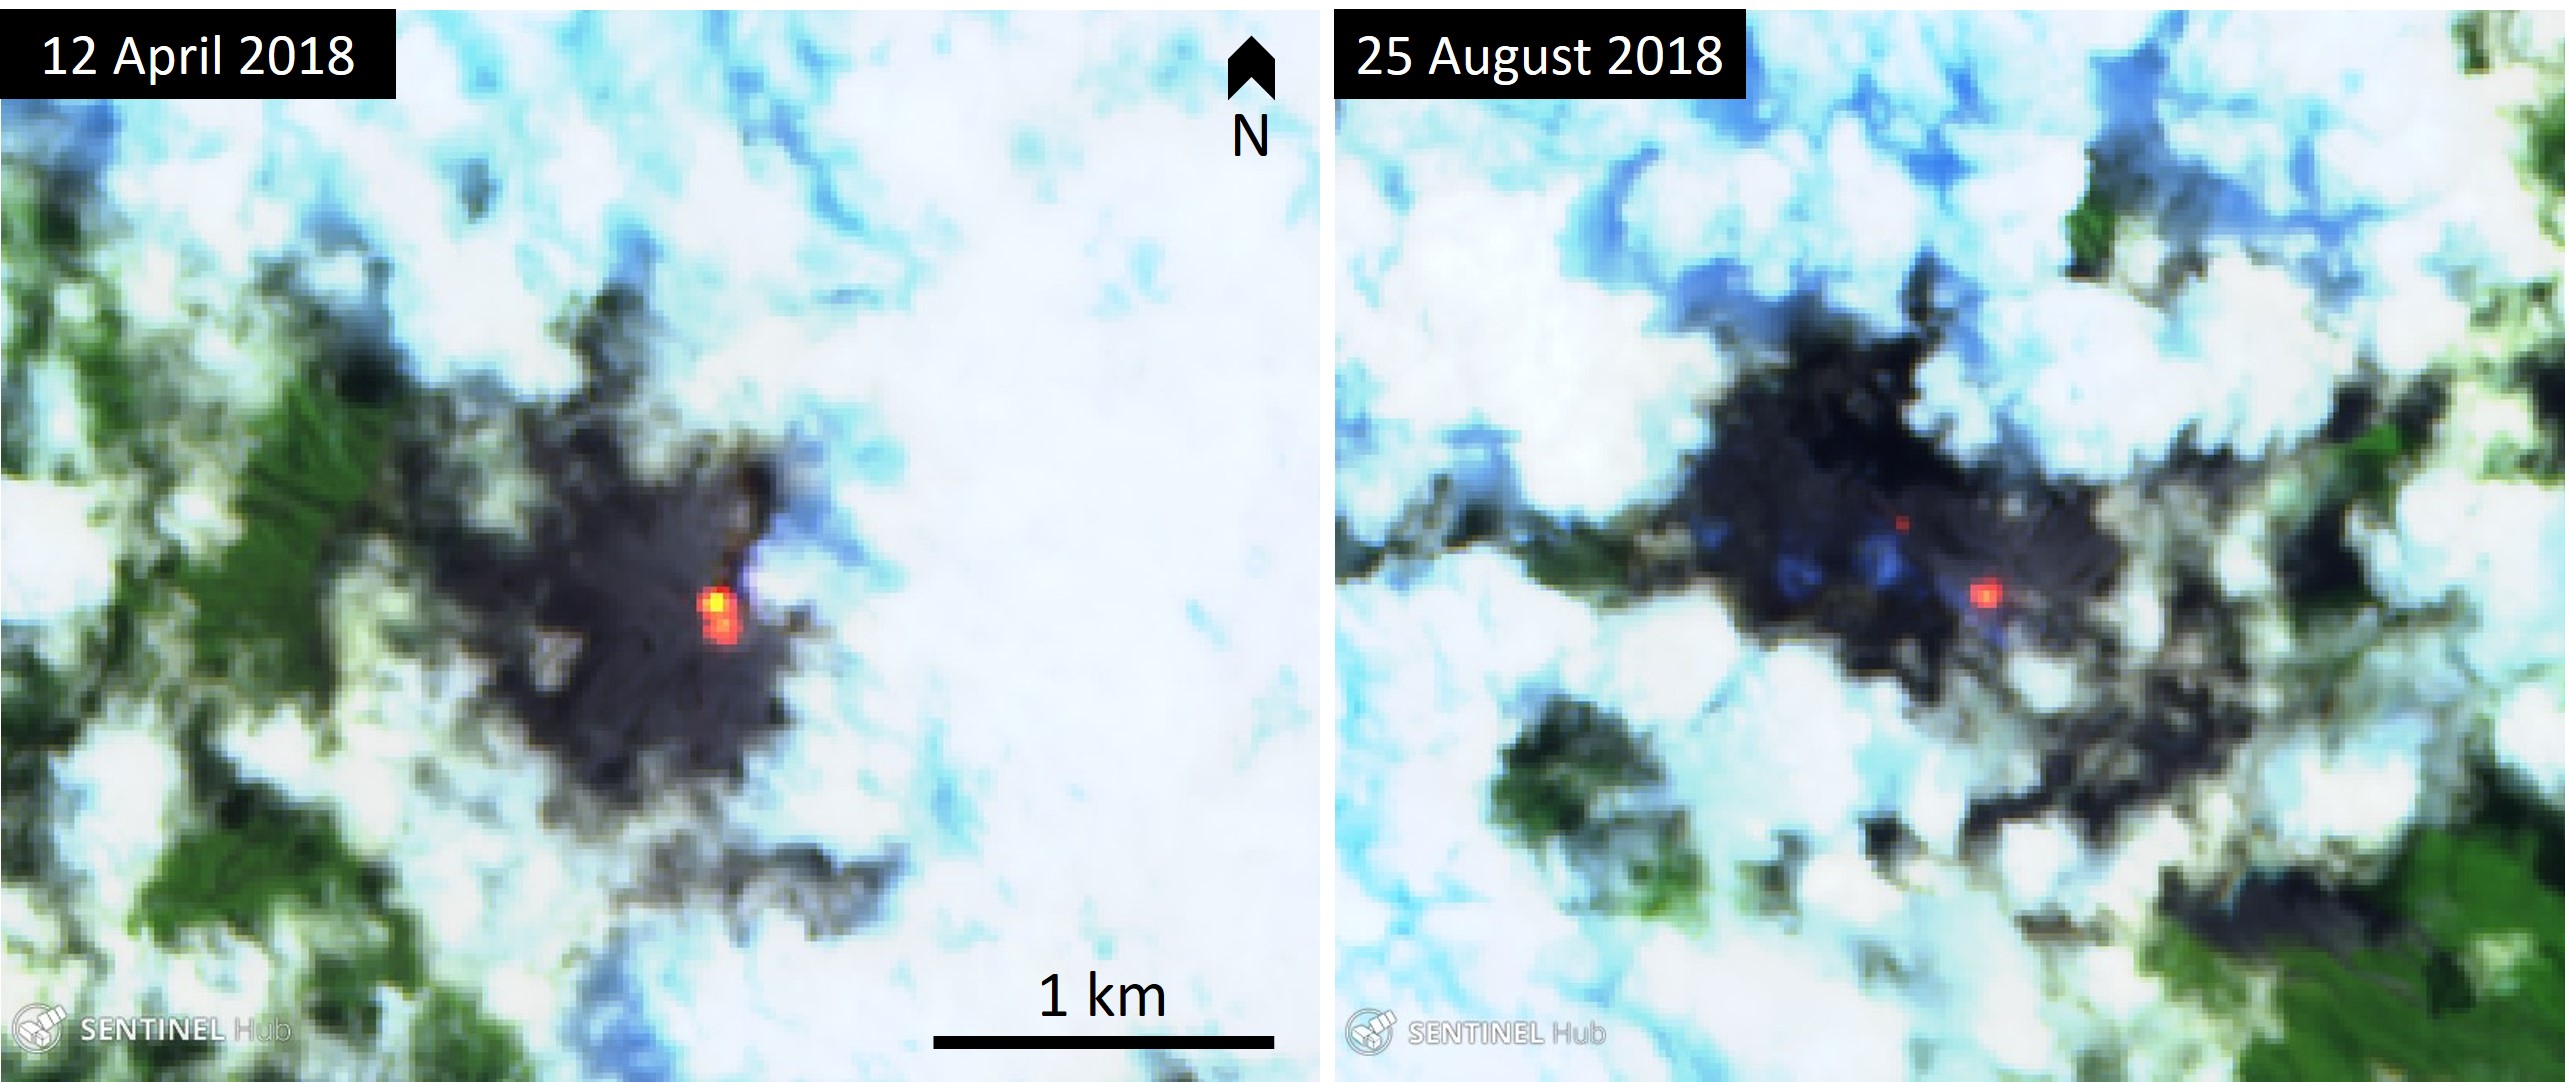 |
Figure 103. Sentinel-2 thermal satellite images of Reventador comparing the thermal signatures before and after the formation of the collapse scarp in April. These images show the central summit crater in April and August 2018 with two of the recently-formed vents. Courtesy of Sentinel-Hub Playground. |
Information Contacts: Instituto Geofísico (IG-EPN), Escuela Politécnica Nacional, Casilla 17-01-2759, Quito, Ecuador (URL: http://www.igepn.edu.ec ); Washington Volcanic Ash Advisory Center (VAAC), Satellite Analysis Branch (SAB), NOAA/NESDIS OSPO, NOAA Science Center Room 401, 5200 Auth Rd, Camp Springs, MD 20746, USA (URL: www.ospo.noaa.gov/Products/atmosphere/vaac, archive at: http://www.ssd.noaa.gov/VAAC/archive.html); MIROVA (Middle InfraRed Observation of Volcanic Activity), a collaborative project between the Universities of Turin and Florence (Italy) supported by the Centre for Volcanic Risk of the Italian Civil Protection Department (URL: http://www.mirovaweb.it/); Hawai'i Institute of Geophysics and Planetology (HIGP) - MODVOLC Thermal Alerts System, School of Ocean and Earth Science and Technology (SOEST), Univ. of Hawai'i, 2525 Correa Road, Honolulu, HI 96822, USA (URL: http://modis.higp.hawaii.edu/); Sentinel Hub Playground (URL: https://www.sentinel-hub.com/explore/sentinel-playground).
Multiple daily explosions with ash plumes and incandescent blocks rolling down the flanks, October 2018-January 2019
The andesitic Volcán El Reventador lies well east of the main volcanic axis of the Cordillera Real in Ecuador and has historical eruptions with numerous lava flows and explosive events going back to the 16th century. The eruption in November 2002 generated a 17-km-high eruption cloud, pyroclastic flows that traveled 8 km, and several lava flows. Eruptive activity has been continuous since 2008. Daily explosions with ash emissions and ejecta of incandescent blocks rolling hundreds of meters down the flanks have been typical for many years. Activity continued during October 2018-January 2019, the period covered in this report, with information provided by Ecuador's Instituto Geofisico (IG-EPN), the Washington Volcano Ash Advisory Center (VAAC), and infrared satellite data.
Multiple daily reports were issued from the Washington VAAC throughout the entire October 2018-January 2019 period. Plumes of ash and gas usually rose to altitudes of 4.3-6.1 km and drifted about 20 km in prevailing wind directions before either dissipating or being obscured by meteoric clouds. The average number of daily explosions reported by IG-EPN for the second half of 2018 was more than 20 per day (figure 104). The many explosions during the period originated from multiple vents within a large scarp that formed on the W flank in mid-April (BGVN 43:11, figure 95) (figure 105). Incandescent blocks were observed often in the IG webcams; they traveled 400-1,000 m down the flanks.
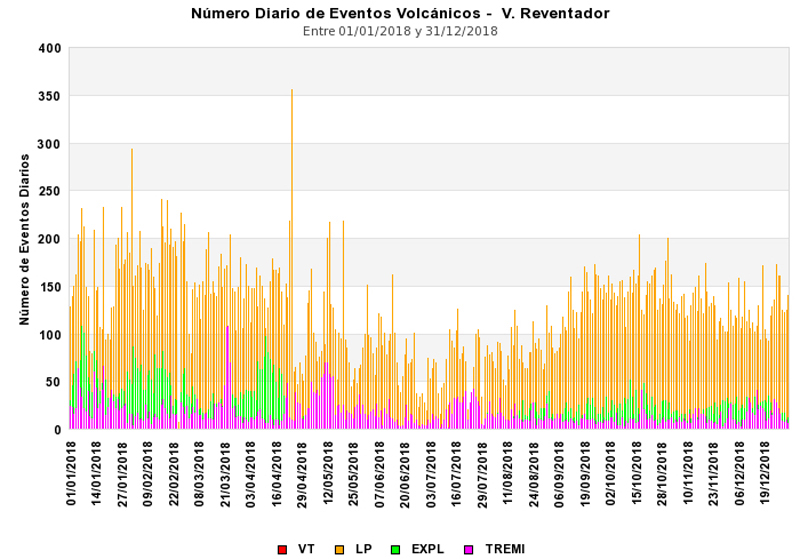 |
Figure 104. The number of daily seismic events at El Reventador for 2018 indicated high activity during the first and last thirds of the year; more than 20 explosions per day were recorded many times during October-December 2018, the period covered in this report. LP seismic events are shown in orange, seismic tremor in pink, and seismic explosions with ash are shown in green. Courtesy of IG-EPN (Informe Anual del Volcán El Reventador – 2018, Quito, 29 de marzo del 2019). |
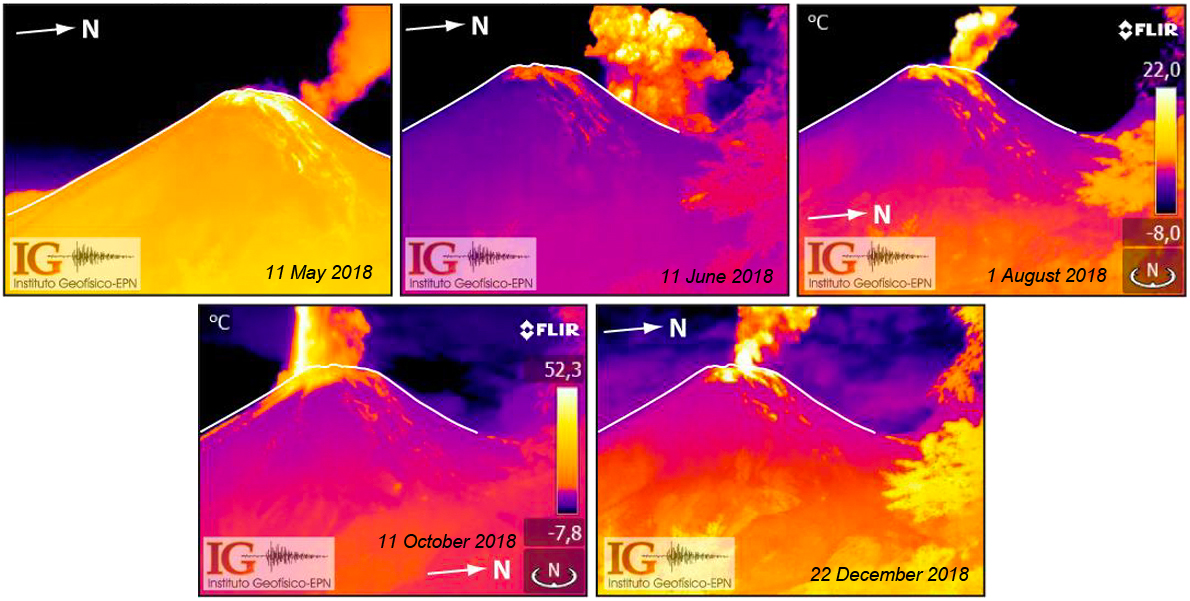 |
Figure 105. Images from IG's REBECA thermal camera showed the thermal activity from multiple different vents at different times during the year (see BGVN 43:11, figure 95 for vent locations). Courtesy of IG (Informe Anual del Volcán El Reventador – 2018, Quito, 29 de marzo del 2019). |
Activity during October 2018-January 2019. During most days of October 2018 plumes of gas, steam, and ash rose over 1,000 m above the summit of Reventador, and most commonly drifted W or NW. Incandescence was observed on all nights that were not cloudy; incandescent blocks rolled 400-800 m down the flanks during half of the nights. During episodes of increased activity, ash plumes rose over 1,200 m (8, 10-11, 18-19 October) and incandescent blocks rolled down multiple flanks (figure 106).
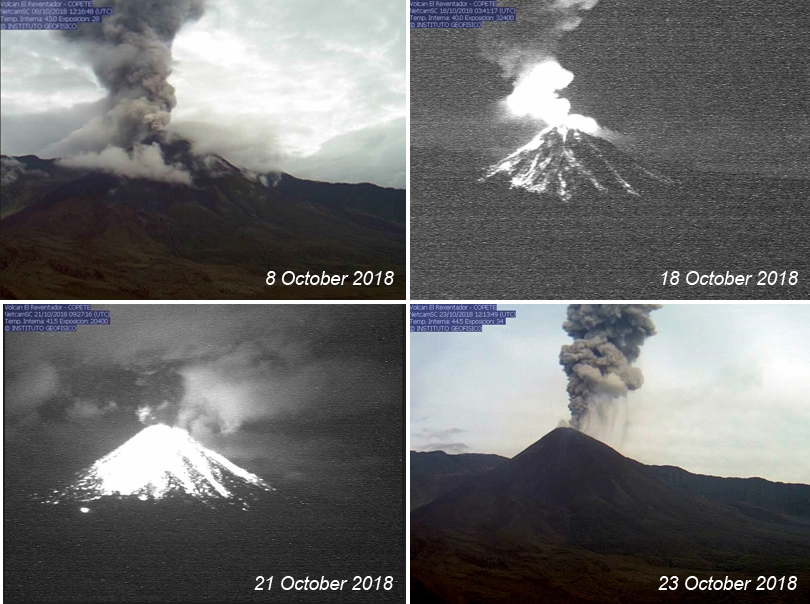 |
Figure 106. Ash emissions rose over 1,000 m above the summit of Reventador numerous times during October 2018, and large incandescent blocks traveled hundreds of meters down multiple flanks. The IG-EPN COPETE webcam that captured these images is located on the S caldera rim. Courtesy of IG Daily Reports (Informe diario del estado del Volcan Reventador, numbers 2018-282, 292, 295, 297). |
Similar activity continued during November. IG reported 17 days of the month with steam, gas, and ash emissions rising more than 1,000 m above the summit. The other days were either cloudy or had emissions rising between 500 and 1,000 m. Incandescent blocks were usually observed on the S or SE flanks, generally travelling 400-600 m down the flanks. The Washington VAAC reported a discrete ash plume at 6.1 km altitude drifting WNW about 35 km from the summit on 15 November. The next day, intermittent puffs were noted moving W, and a bright hotspot at the summit was visible in satellite imagery. During the most intense activity of the month, incandescent blocks traveled 800 m down all the flanks (17-19 November) and ash plumes rose over 1,200 m (23 November) (figure 107).
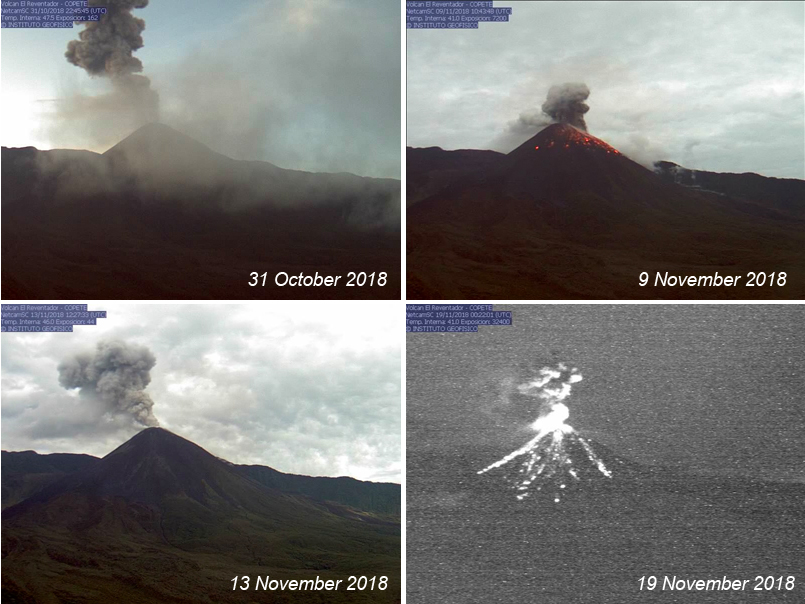 |
Figure 107. Ash plumes rose over 1,000 m above the summit on 17 days during November 2018 at Reventador, and incandescent blocks traveled 400-800 m down the flanks on many nights. Courtesy of IG Daily Reports (Informe diario del estado del Volcan Reventador, numbers 2018-306, 314, 318, 324). |
Steam, gas, and ash plumes rose over 1,200 m above the summit on 1 December. The next day, there were reports of ashfall in San Rafael and Hosteria El Hotelito, where they reported an ash layer about 1 mm thick was deposited on vehicles during the night. Ash emissions exceeded 1,200 m above the summit on 5 and 6 December as well. Incandescent blocks traveled 800 m down all the flanks on 11, 22, 24, and 26 December, and reached 900 m on 21 December. Ash emissions rising 500 to over 1,000 m above the summit were a daily occurrence, and incandescent blocks descended 500 m or more down the flanks most days during the second half of the month (figure 108).
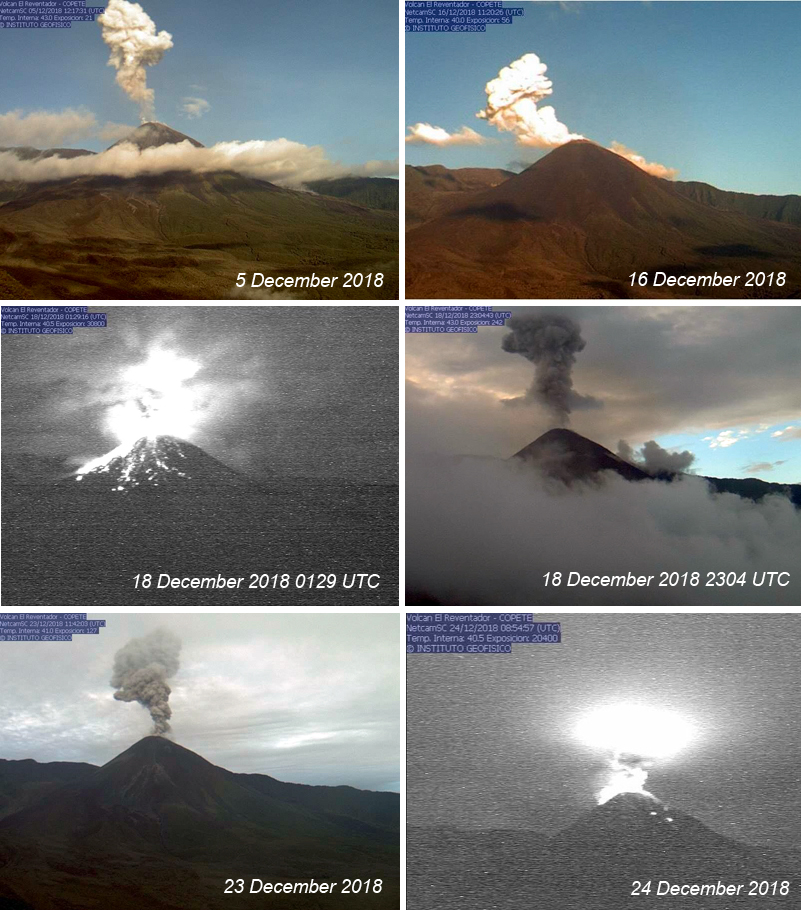 |
Figure 108. Ash plumes that rose 500 to over 1,000 m were a daily occurrence at Reventador during December 2018. Incandescent blocks traveled as far as 900 m down the flanks as well. Courtesy of IG Daily Reports (Informe diario del estado del Volcan Reventador, numbers 2018-340, 351, 353, 354, 358, 359). |
During the first few days of January 2019 the ash and steam plumes did not rise over 800 m, and incandescent blocks were noted 300-500 m down the S flank. An increase in activity on 6 January sent ash-and-gas plumes over 1,000 m, drifting W, and incandescent blocks 1,000 m down many flanks. For multiple days in the middle of the month the volcano was completely obscured by clouds; only occasional observations of plumes of ash and steam were made, incandescence seen at night through the clouds confirmed ongoing activity. The Washington VAAC reported continuous ash emissions moving SE extending more than 100 km on 12 January. A significant explosion late on 20 January sent incandescent blocks 800 m down the S flank; although it was mostly cloudy for much of the second half of January, brief glimpses of ash plumes rising over 1,000 m and incandescent blocks traveling up to 800 m down numerous flanks were made almost daily (figure 109).
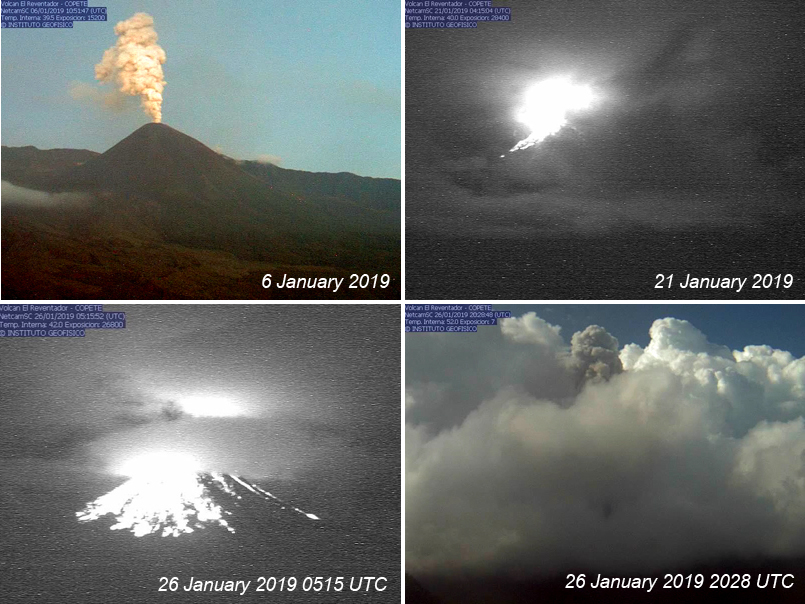 |
Figure 109. Even during the numerous cloudy days of January 2019, evidence of ash emissions and significant explosions at Reventador was captured in the Copete webcam located on the S rim of the caldera. Courtesy of IG Daily Reports (Informe diario del estado del Volcan Reventador, number 2019-6, 21, 26, 27). |
Visual evidence from the webcams supports significant thermal activity at Reventador. Atmospheric conditions are often cloudy and thus the thermal signature recorded by satellite instruments is frequently diminished. In spite of this, the MODVOLC thermal alert system recorded seven thermal alerts on three days in October, four alerts on two days in November, six alerts on two days in December and three alerts on three days in January 2019. In addition, the MIROVA system measured moderate levels of radiative power intermittently throughout the period; the most intense anomalies of 2018 were recorded on 15 October and 6 December (figure 110).
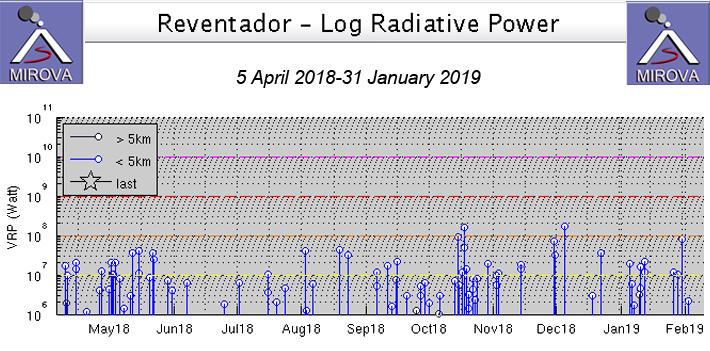 |
Figure 110. Persistent thermal activity at Reventador was recorded by satellite instruments for the MIROVA system from 5 April 2018 through January 2019 in spite of frequent cloud cover over the volcano. The most intense anomalies of 2018 were recorded on 15 October and 6 December. Courtesy of MIROVA. |
Information Contacts: Instituto Geofísico (IG-EPN), Escuela Politécnica Nacional, Casilla 17-01-2759, Quito, Ecuador (URL: http://www.igepn.edu.ec); Washington Volcanic Ash Advisory Center (VAAC), Satellite Analysis Branch (SAB), NOAA/NESDIS OSPO, NOAA Science Center Room 401, 5200 Auth Rd, Camp Springs, MD 20746, USA (URL: www.ospo.noaa.gov/Products/atmosphere/vaac, archive at: http://www.ssd.noaa.gov/VAAC/archive.html); MIROVA (Middle InfraRed Observation of Volcanic Activity), a collaborative project between the Universities of Turin and Florence (Italy) supported by the Centre for Volcanic Risk of the Italian Civil Protection Department (URL: http://www.mirovaweb.it/); Hawai'i Institute of Geophysics and Planetology (HIGP) - MODVOLC Thermal Alerts System, School of Ocean and Earth Science and Technology (SOEST), Univ. of Hawai'i, 2525 Correa Road, Honolulu, HI 96822, USA (URL: http://modis.higp.hawaii.edu/).
Daily ash emissions and incandescent block avalanches continue, February-July 2019
The andesitic Volcán El Reventador lies east of the main volcanic axis of the Cordillera Real in Ecuador and has historical eruptions with numerous lava flows and explosive events going back to the 16th century. An eruption in November 2002 generated a 17-km-high eruption cloud, pyroclastic flows that traveled 8 km, and several lava flows. Eruptive activity has been continuous since 2008. Daily explosions with ash emissions and ejecta of incandescent blocks rolling hundreds of meters down the flanks have been typical for many years. Alameida et al. (2019) provide an excellent summary of recent activity (2016-2018) and monitoring. Activity continued during February-July 2019, the period covered in this report, with information provided by Ecuador's Instituto Geofisico (IG-EPN), the Washington Volcano Ash Advisory Center (VAAC), and infrared satellite data.
Persistent thermal activity accompanied daily ash emissions and incandescent block avalanches during February-July 2019 (figure 111). Ash plumes generally rose 600-1,200 m above the summit crater and drifted W or NW; incandescent blocks descended up to 800 m down all the flanks. On 25 February an ash plume reached 9.1 km altitude and drifted SE, causing ashfall in nearby communities. Pyroclastic flows were reported on 18 April and 19 May traveling 500 m down the flanks. Small but distinct SO2 emissions were detectible by satellite instruments a few times during the period (figure 112).
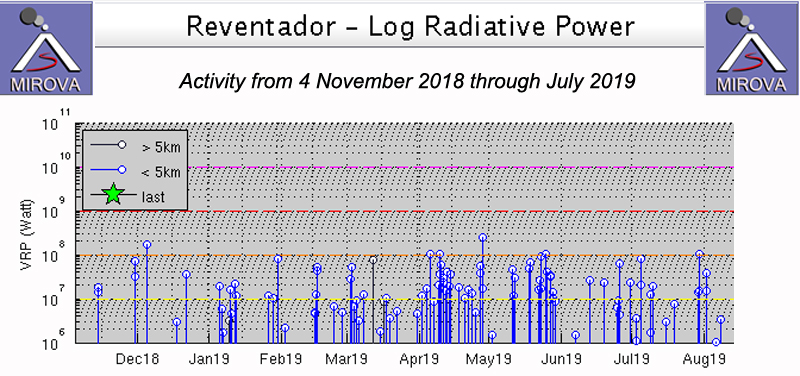 |
Figure 111. The thermal energy at Reventador persisted throughout 4 November 2018 through July 2019, but was highest in April and May. Courtesy of MIROVA. |
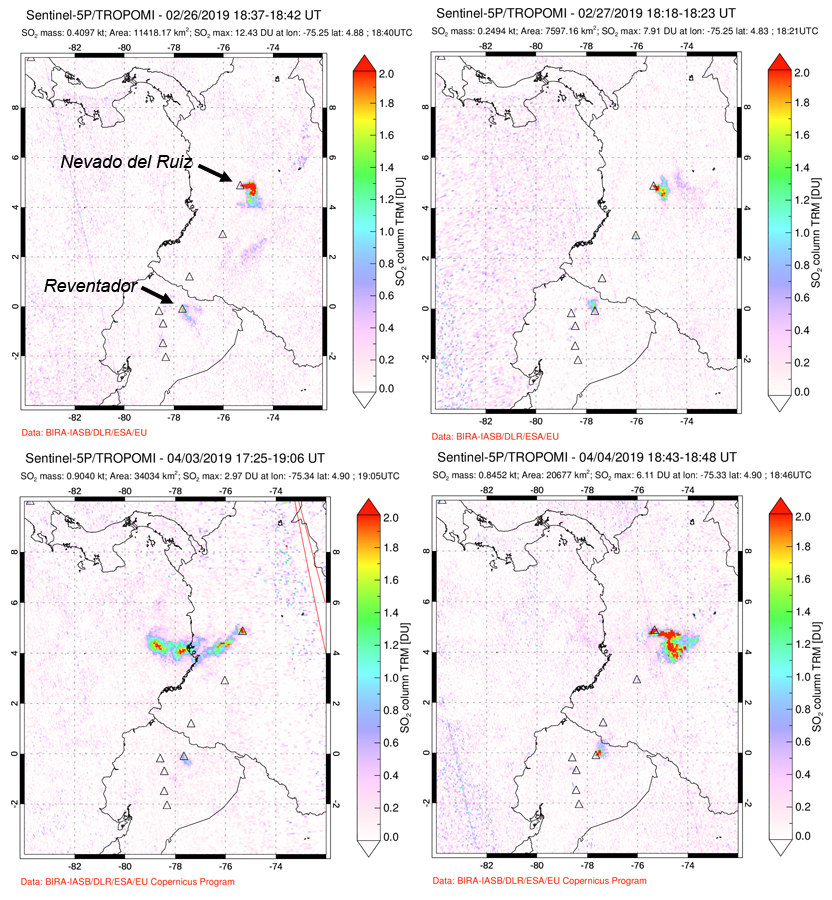 |
Figure 112. Small SO2 plumes were released from Reventador and detected by satellite instruments only a few times during February-July 2019. Columbia's Nevado del Ruiz produced a much larger SO2 signal during each of the days shown here as well. Top left: 26 February; top right: 27 February; bottom left: 3 April; bottom right: 4 April. Courtesy of NASA Goddard Space Flight Center. |
The Washington VAAC issued multiple daily ash advisories on all but two days during February 2019. IGEPN reported daily ash emissions rising from 400 to over 1,000 m above the summit crater. Incandescent block avalanches rolled 400-800 m down the flanks on most nights (figure 113). Late on 8 February the Washington VAAC reported an ash plume moving W at 5.8 km altitude extending 10 km from the summit. Plumes rising more than 1,000 m above the summit were reported on 9, 13, 16, 18, 19, and 25 February. On 25 February the Washington VAAC reported an ash plume visible in satellite imagery drifting SE from the summit at 9.1 km altitude that dissipated quickly, and drifted SSE. It was followed by new ash clouds at 7.6 km altitude that drifted S. Ashfall was reported in San Luis in the Parish of Gonzalo Díaz de Pineda by UMEVA Orellana and the Chaco Fire Department.
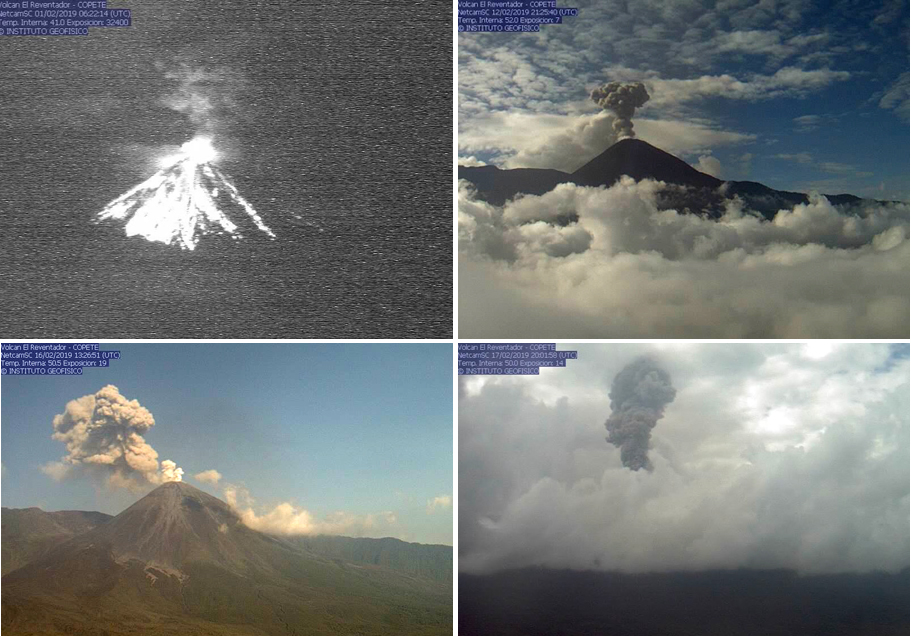 |
Figure 113. Emission of ash from Reventador and incandescent blocks rolling down the cone occurred daily during February 2019, and were captured by the COPETE webcam located on the S rim of the caldera. On 1 February (top left) incandescent blocks rolled 600 m down the flanks. On 13 February (top right) ash plumes rose 800 m and drifted W. On 16 February (bottom left) ash rose to 1,000 m and drifted W. On 18 February (bottom right) the highest emission exceeded 1,000 m above the crater and was clearly visible in spite of meteoric clouds obscuring the volcano. Courtesy of IGEPN (Daily reports 2019-32, 44, 47, and 49). |
Ash plumes exceeded 1,000 m in height above the summit almost every day during March 2019 and generally drifted W or NW. The Washington VAAC reported an ash plume visible above the cloud deck at 6.7 km altitude extending 25 km NW early on 3 March; there were no reports of ashfall nearby. Incandescent block avalanches rolled 800 m down all the flanks the previous night; they were visible moving 300-800 m down the flanks most nights throughout the month (figure 114).
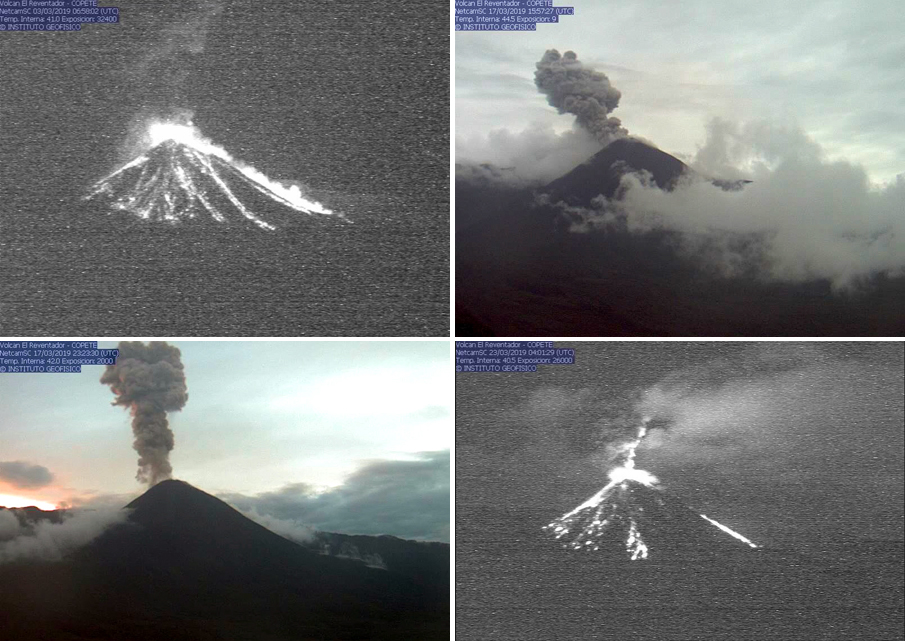 |
Figure 114. Ash plumes and incandescent block avalanches occurred daily at Reventador during March 2019 and were captured by the COPETE webcam on the S rim of the caldera. On 3 March (top left) a possible pyroclastic flow traveled down the E flank in the early morning. Ash plumes on 17 and 18 March (top right, bottom left) rose 900-1,000 m above the summit and drifted W. On 23 March (bottom right) ash plumes rose to 1,000 m and drifted N while incandescent blocks rolled 600 m down the flanks. Courtesy of IGEPN (Daily reports 2019 62, 76, 77, and 82). |
During April 2019 ash plume heights ranged from 600 to over 1,000 m above the summit each day, drifting either W or NW. Incandescent avalanche blocks rolled down all the flanks for hundreds of meters daily; the largest explosions sent blocks 800 m from the summit (figure 115). On 18 April IGEPN reported that a pyroclastic flow the previous afternoon had traveled 500 m down the NE flank.
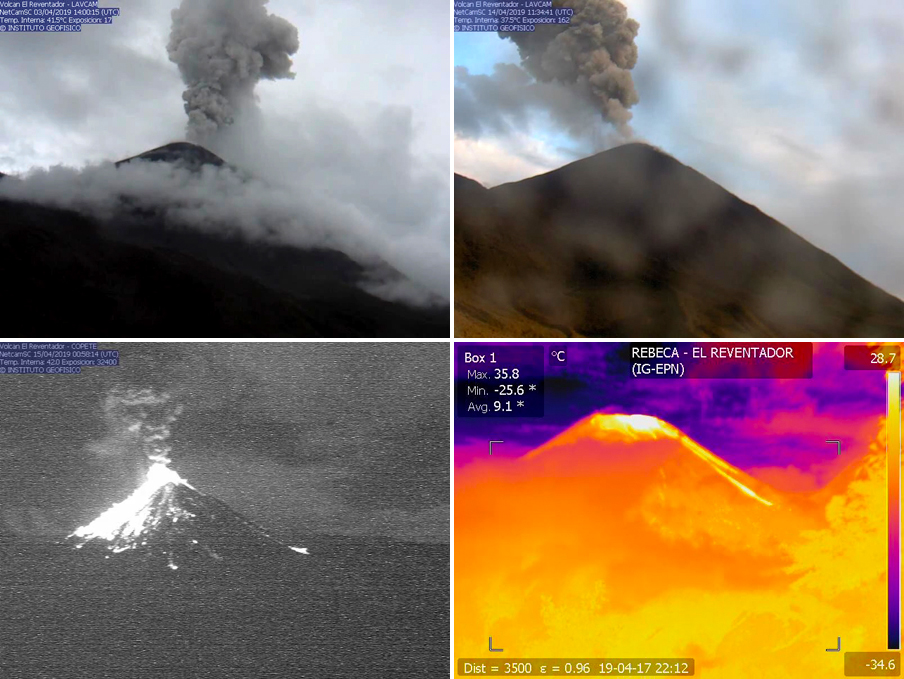 |
Figure 115. Ash plumes and incandescent block avalanches occurred daily at Reventador during April 2019. On 3 April, ash emissions were reported drifting W and NW at 1,000 m above the summit (top left). On 14 April ash plumes rose over 600 m above the summit crater (top right). The 3 and 14 April images were taken from the LAVCAM webcam on the SE flank. Incandescent block avalanches descended 800 m down all the flanks on 15 April along with ash plumes rising over 1,000 m above the summit (bottom left), both visible in this image from the COPETE webcam on the S rim of the caldera. A pyroclastic flow descended 500 m down the NE flank on 17 April and was captured in the thermal REBECA webcam (bottom right) located on the N rim of the caldera. Courtesy of IGEPN (Daily reports 2019-93, 104, 105, and 108). |
On most days during May 2019, incandescent block avalanches were observed traveling 700-800 m down all the flanks. Ash plume heights ranged from 600 to 1,200 m above the crater each day of the month (figure 116) they were visible. A pyroclastic flow was reported during the afternoon of 19 May that moved 500 m down the N flank.
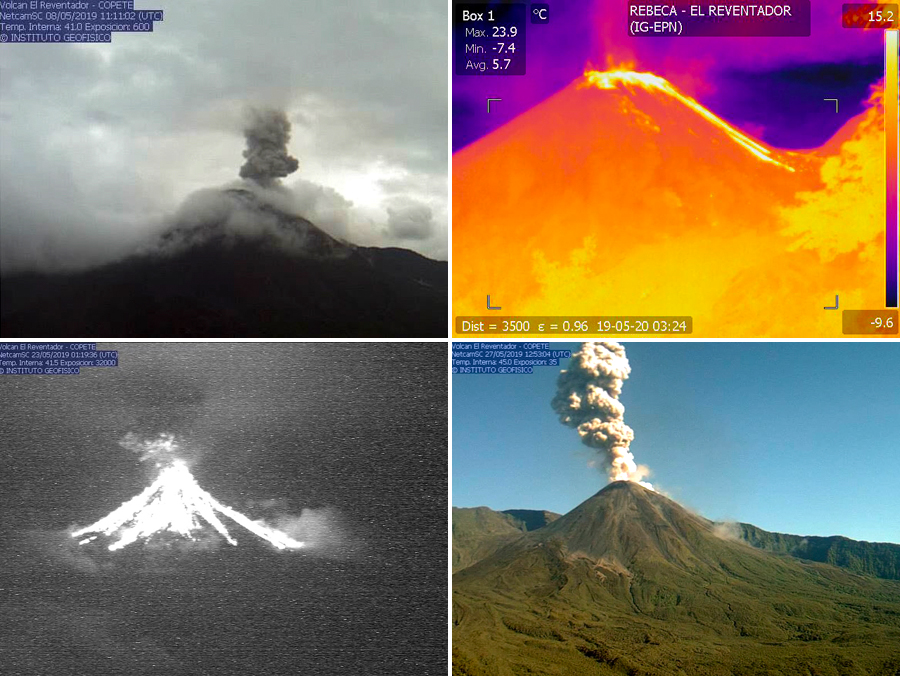 |
Figure 116. Even on days with thick meteoric clouds, ash plumes can be observed at Reventador. The ash plumes reached 1,000 m above the crater on 8 May 2019 (top left). The infrared webcam REBECA on the N rim of the caldera captured a pyroclastic flow on the N flank on the afternoon of 19 May (top right). Strong explosions on 23 May sent incandescent blocks and possible pyroclastic flows at least 800 m down all the flanks (bottom left). Ash plumes reached 1,000 m above the summit on 27 May and drifted W (bottom right). Images on 8, 23, and 27 May taken from the COPETE webcam on the S rim of the caldera. Courtesy of IGEPN (Daily Reports 2019-128, 140, 143, and 147). |
Activity diminished somewhat during June 2019. Ash plumes reached 1,200 m above the summit early in June but decreased to 600 m or less for the second half of the month. Meteoric clouds prevented observation for most of the third week of June; VAAC reports indicated ash emissions rose to 5.2 km altitude on 19 June and again on 26 June (about 2 km above the crater). Incandescent blocks were reported traveling down all of the flanks, generally 500-800 m, during about half of the days the mountain was visible (figure 117). Multiple VAAC reports were also issued daily during July 2019. Ash plumes were reported by IGEPN rising over 600 m above the crater every day it was visible and incandescent blocks traveled 400-800 m down the flanks (figure 118). The Darwin VAAC reported an ash emission on 9 July that rose to 4.9 km altitude as multiple puffs that drifted W, extending about 35 km from the summit.
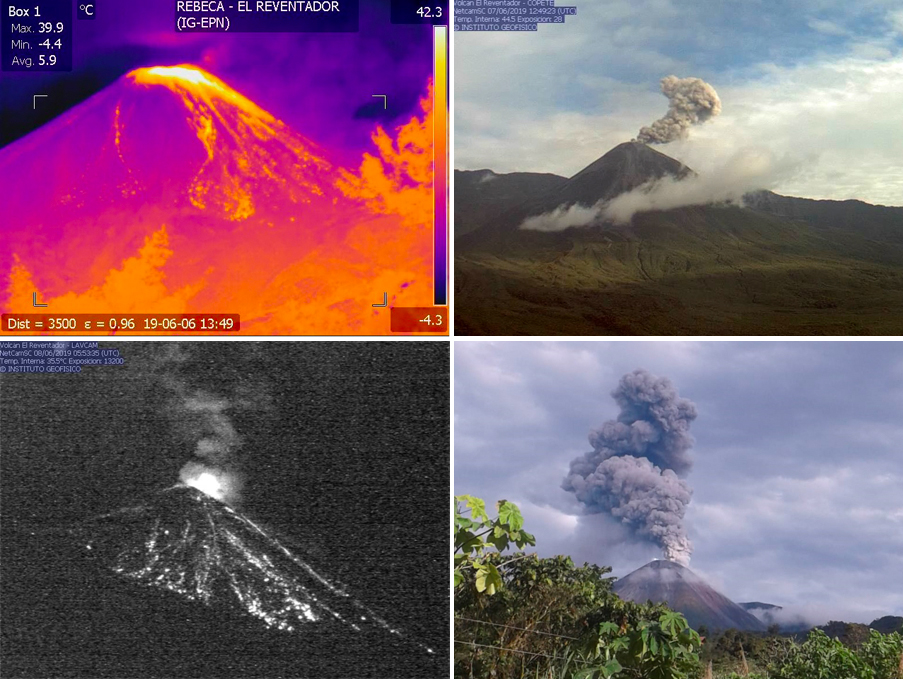 |
Figure 117. Activity diminished slightly at Reventador during June 2019. Incandescent material was visible on the N flank from infrared webcam REBECA on the N rim of the caldera on 6 June (top left). On 7 June ash rose over 1,000 m above the summit and drifted N and W (top right) as seen from the COPETE webcam on the S rim of the caldera. Incandescent block avalanches rolled 600 m down all the flanks on 8 June (bottom left) and were photographed by the LAVCAM webcam located on the SE flank. An ash plume rose to 1,000 m on 25 June and was photographed from the San Rafael waterfall (bottom right). Courtesy of IGEPN (Daily Reports 2019-157, 158, 159, and 176). |
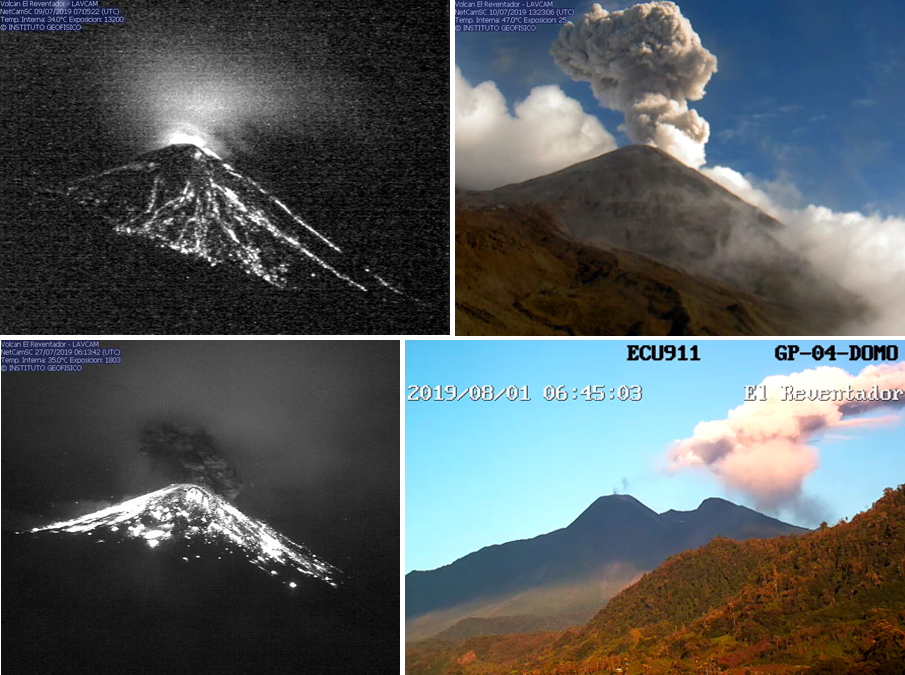 |
Figure 118. Daily explosive activity was reported at Reventador during July 2019. On 9 and 10 July ash plumes rose over 600 m and drifted W and incandescent blocks descended 800 m down all the flanks (top row), as seen from the LAVCAM webcam on the SE flank. On 27 July many of the large incandescent blocks appeared to be several m in diameter as they descended the flanks (bottom left, LAVCAM). On 1 August, a small steam plume was visible on a clear morning from the CORTESIA webcam located N of the volcano. Courtesy of IGEPN Daily reports (2019-190, 191, 208, and 213). |
References: Almeida M, Gaunt H E, and Ramón P, 2019, Ecuador's El Reventador volcano continually remakes itself, Eos, 100, https://doi.org/10.1029/2019EO117105. Published on 18 March 2019.
Information Contacts: Instituto Geofísico (IG-EPN), Escuela Politécnica Nacional, Casilla 17-01-2759, Quito, Ecuador (URL: http://www.igepn.edu.ec ); MIROVA (Middle InfraRed Observation of Volcanic Activity), a collaborative project between the Universities of Turin and Florence (Italy) supported by the Centre for Volcanic Risk of the Italian Civil Protection Department (URL: http://www.mirovaweb.it/); Global Sulfur Dioxide Monitoring Page, Atmospheric Chemistry and Dynamics Laboratory, NASA Goddard Space Flight Center (NASA/GSFC), 8800 Greenbelt Road, Goddard, Maryland, USA (URL: https://so2.gsfc.nasa.gov/).
Nearly daily ash emissions and frequent incandescent block avalanches August 2019-January 2020
Reventador is an andesitic stratovolcano located in the Cordillera Real, Ecuador. Historical eruptions date back to the 16th century, consisting of lava flows and explosive events. The current eruptive activity has been ongoing since 2008 with previous activity including daily explosions with ash emissions, and incandescent block avalanches (BGVN 44:08). This report covers volcanism from August 2019 through January 2020 using information primarily from the Instituto Geofísico (IG-EPN), the Washington Volcano Ash Advisory Center (VAAC), and various infrared satellite data.
During August 2019 to January 2020, IG-EPN reported almost daily explosive eruptions and ash plumes. September had the highest average of explosive eruptions while January 2020 had the lowest (table 11). Ash plumes rose between a maximum of 1.2 to 2.5 km above the crater during this reporting period with the highest plume height recorded in December. The largest amount of SO2 gases produced was during the month of October with 502 tons/day. Frequently at night during this reporting period, crater incandescence was observed and was occasionally accompanied by incandescent block avalanches traveling as far as 900 m downslope from the summit of the volcano.
Table 11. Monthly summary of eruptive events recorded at Reventador from August 2019 through January 2020. Data courtesy of IG-EPN (August to January 2020 daily reports).
| Month | Average Number of Explosions | Max plume height above the crater | Max SO2 |
| Aug 2019 | 26 | 1.6 km | -- |
| Sep 2019 | 32 | 1.7 km | 428 tons/day |
| Oct 2019 | 29 | 1.3 km | 502 tons/day |
| Nov 2019 | 25 | 1.2 km | 432 tons/day |
| Dec 2019 | 25 | 2.5 km | 331 tons/day |
| Jan 2020 | 12 | 1.7 km | -- |
During the month of August 2019, between 11 and 45 explosions were recorded every day, frequently accompanied by gas-and-steam and ash emissions (figure 119); plumes rose more than 1 km above the crater on nine days. On 20 August the ash plume rose to a maximum 1.6 km above the crater. Summit incandescence was seen at night beginning on 10 August, continuing frequently throughout the rest of the reporting period. Incandescent block avalanches were reported intermittently beginning that same night through 26 January 2020, ejecting material between 300 to 900 m below the summit and moving on all sides of the volcano.
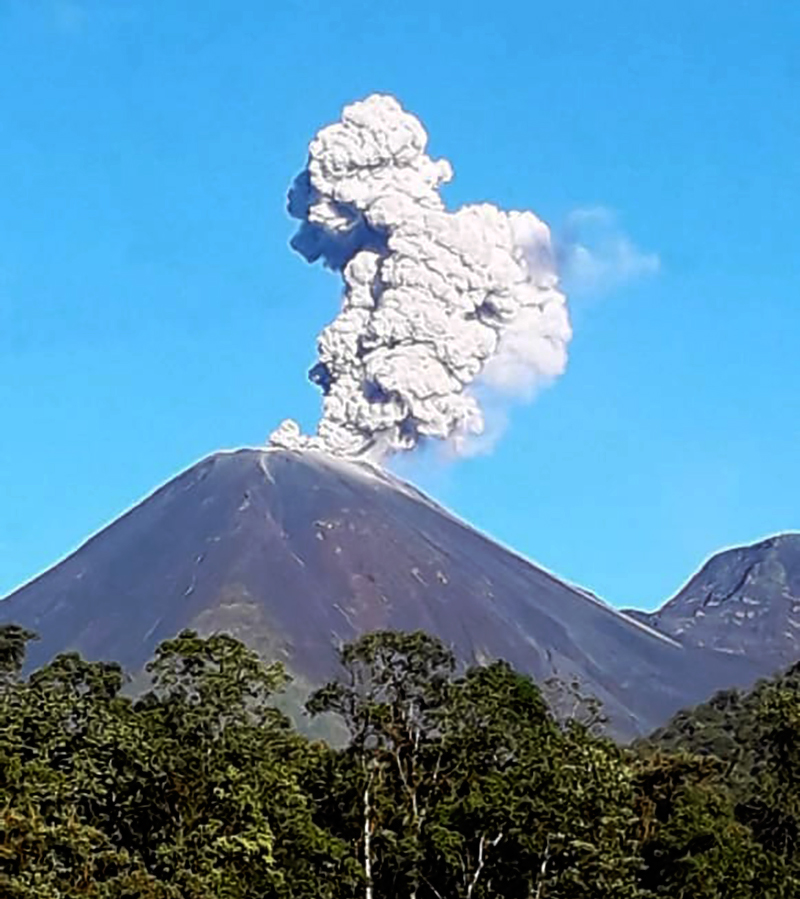 |
Figure 119. An ash plume rising from the summit of Reventador on 1 August 2019. Courtesy of Radio La Voz del Santuario. |
Throughout most of September 2019 gas-and-steam and ash emissions were observed almost daily, with plumes rising more than 1 km above the crater on 15 days, according to IG-EPN. On 30 September, the ash plume rose to a high of 1.7 km above the crater. Each day, between 18 and 72 explosions were reported, with the latter occurring on 19 September. At night, crater incandescence was commonly observed, sometimes accompanied by incandescent material rolling down every flank.
Elevated seismicity was reported during 8-15 October 2019 and almost daily gas-and-steam and ash emissions were present, ranging up to 1.3 km above the summit. Every day during this month, between 13 and 54 explosions were documented and crater incandescence was commonly observed at night. During November 2019, gas-and-steam and ash emissions rose greater than 1 km above the crater except for 10 days; no emissions were reported on 29 November. Daily explosions ranged up to 42, occasionally accompanied by crater incandescence and incandescent ejecta.
Washington VAAC notices were issued almost daily during December 2019, reporting ash plumes between 4.6 and 6 km altitude throughout the month and drifting in multiple directions. Each day produced 5-52 explosions, many of which were accompanied by incandescent blocks rolling down all sides of the volcano up to 900 m below the summit. IG-EPN reported on 11 December that a gas-and-steam and ash emission column rose to a maximum height of 2.5 km above the crater, drifting SW as was observed by satellite images and reported by the Washington VAAC.
Volcanism in January 2020 was relatively low compared to the other months of this reporting period. Explosions continued on a nearly daily basis early in the month, ranging from 20 to 51. During 5-7 January incandescent material ejected from the summit vent moved as block avalanches downslope and multiple gas-and-steam and ash plumes were produced (figures 120, 121, and 122). After 9 January the number of explosions decreased to 0-16 per day. Ash plumes rose between 4.6 and 5.8 km altitude, according to the Washington VAAC.
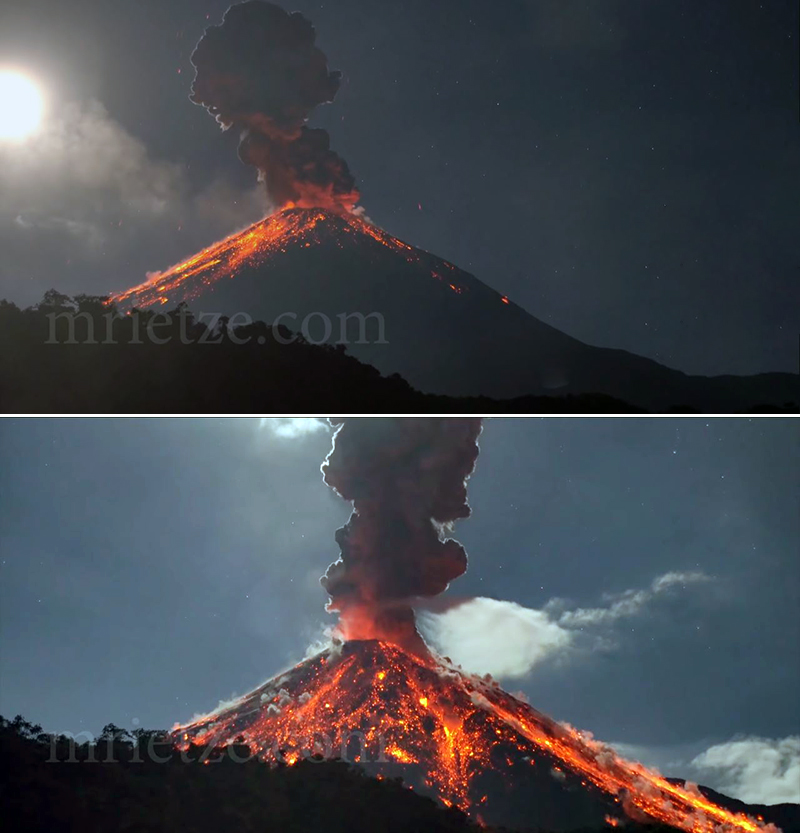 |
Figure 120. Night footage of activity on 5 (top) and 6 (bottom) January 2020 at the summit of Reventador, producing a dense, dark gray ash plume and ejecting incandescent material down multiple sides of the volcano. This activity is not uncommon during this reporting period. Courtesy of Martin Rietze, used with permission. |
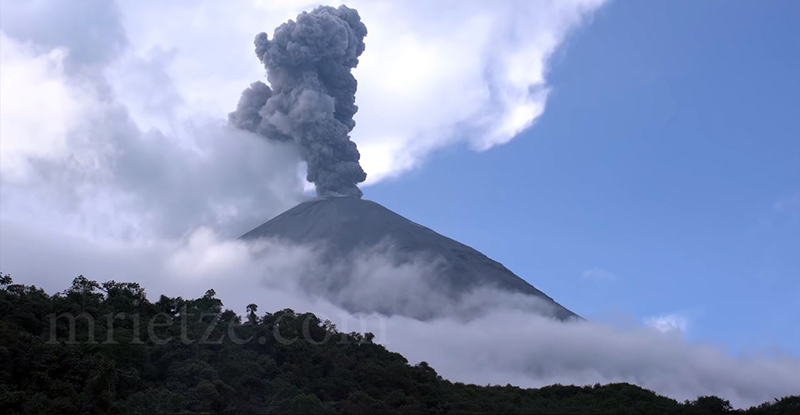 |
Figure 121. An explosion at Reventador on 7 January 2020, which produced a dense gray ash plume. Courtesy of Martin Rietze, used with permission. |
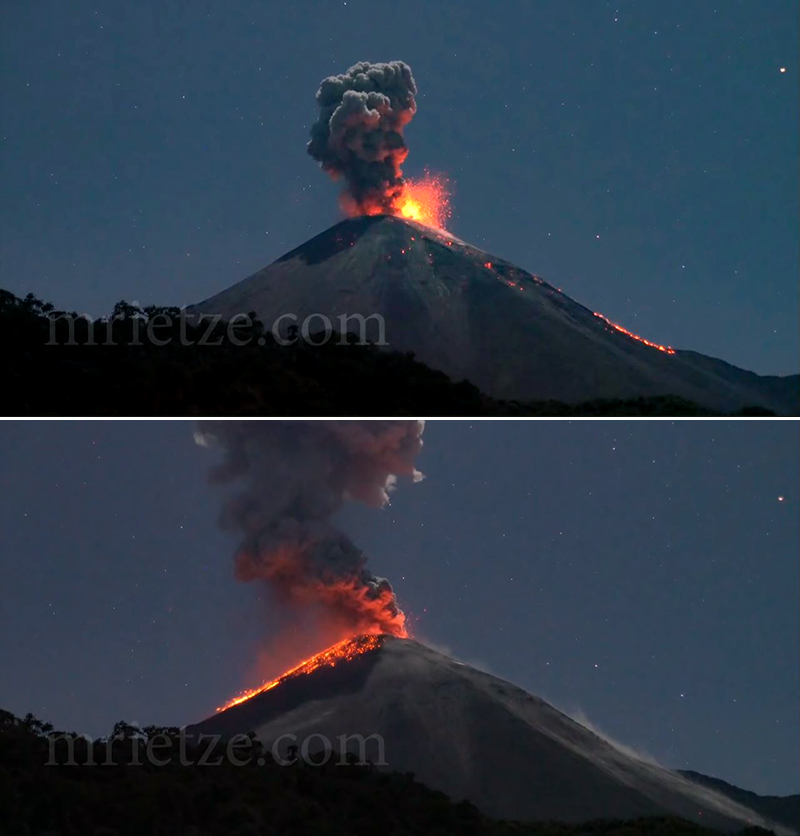 |
Figure 122. Night footage of the evolution of an eruption on 7 January 2020 at the summit of Reventador, which produced an ash plume and ejected incandescent material down multiple sides of the volcano. Courtesy of Martin Rietze, used with permission. |
MIROVA (Middle InfraRed Observation of Volcanic Activity) analysis of MODIS satellite data showed frequent and strong thermal anomalies within 5 km of the summit during 21 February 2019 through January 2020 (figure 123). In comparison, the MODVOLC algorithm reported 24 thermal alerts between August 2019 and January 2020 near the summit. Some thermal anomalies can be seen in Sentinel-2 thermal satellite imagery throughout this reporting period, even with the presence of meteorological clouds (figure 124). These thermal anomalies were accompanied by persistent gas-and-steam and ash plumes.
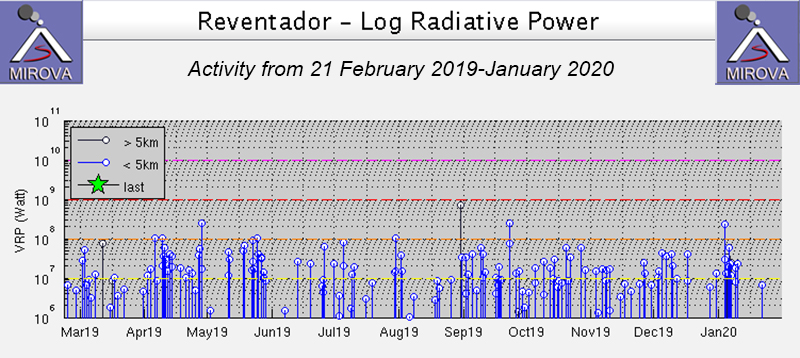 |
Figure 123. Thermal anomalies at Reventador persisted during 21 February 2019 through January 2020 as recorded by the MIROVA system (Log Radiative Power). Courtesy of MIROVA. |
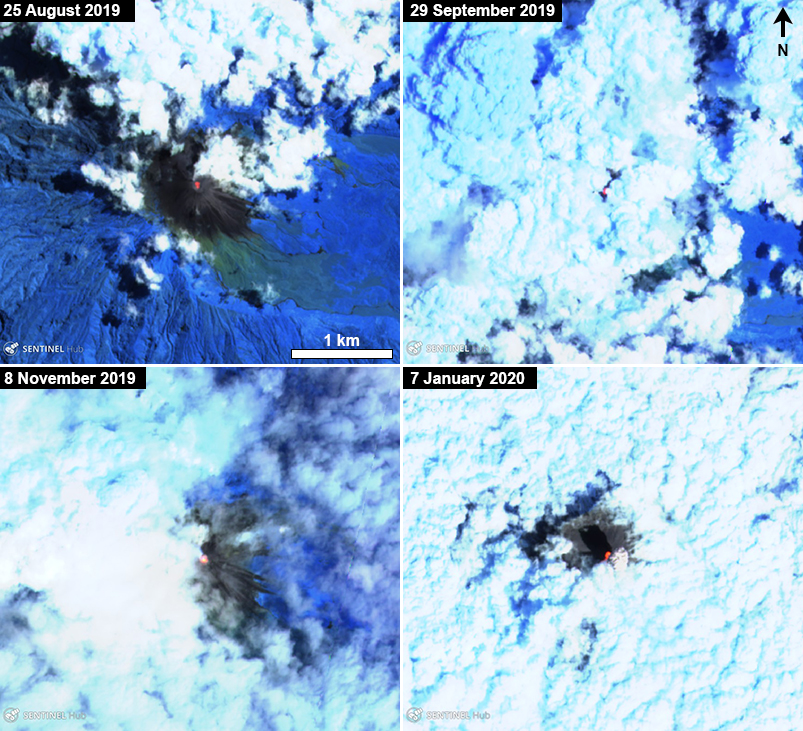 |
Figure 124. Sentinel-2 thermal satellite images of Reventador from August 2019 to January 2020 showing a thermal hotspot in the central summit crater summit. In the image on 7 January 2020, the thermal anomaly is accompanied by an ash plume. Courtesy of Sentinel Hub Playground. |
Information Contacts: Instituto Geofísico, Escuela Politécnica Nacional (IG-EPN), Casilla 17-01-2759, Quito, Ecuador (URL: http://www.igepn.edu.ec/); Washington Volcanic Ash Advisory Center (VAAC), Satellite Analysis Branch (SAB), NOAA/NESDIS OSPO, NOAA Science Center Room 401, 5200 Auth Rd, Camp Springs, MD 20746, USA (URL: www.ospo.noaa.gov/Products/atmosphere/vaac, archive at: http://www.ssd.noaa.gov/VAAC/archive.html); MIROVA (Middle InfraRed Observation of Volcanic Activity), a collaborative project between the Universities of Turin and Florence (Italy) supported by the Centre for Volcanic Risk of the Italian Civil Protection Department (URL: http://www.mirovaweb.it/); Hawai'i Institute of Geophysics and Planetology (HIGP) - MODVOLC Thermal Alerts System, School of Ocean and Earth Science and Technology (SOEST), Univ. of Hawai'i, 2525 Correa Road, Honolulu, HI 96822, USA (URL: http://modis.higp.hawaii.edu/); Sentinel Hub Playground (URL: https://www.sentinel-hub.com/explore/sentinel-playground); Radio La Voz del Santuario (URL: https://www.facebook.com/Radio-La-Voz-del-Santuario-126394484061111/, posted at: https://www.facebook.com/permalink.php?story_fbid=2630739100293291&id=126394484061111); Martin Rietze, Taubenstr. 1, D-82223 Eichenau, Germany (URL: https://mrietze.com/, https://www.youtube.com/channel/UC5LzAA_nyNWEUfpcUFOCpJw/videos).
Frequent explosions, ash emissions, and incandescent block avalanches during February-July 2020
Reventador is a stratovolcano located in the Cordillera Real, Ecuador with historical eruptions dating back to the 16th century. The most recent eruptive period began in 2008 and has continued through July 2020 with activity characterized by frequent explosions, ash emissions, and incandescent block avalanches (BGVN 45:02). This report covers volcanism from February through July 2020 using information primarily from the Instituto Geofísico (IG-EPN), the Washington Volcano Ash Advisory Center (VAAC), and various infrared satellite data.
During February to July 2020, IG-EPN reported almost daily explosions, gas-and-steam and ash emissions, and frequent crater incandescence. The highest average number of explosions per day was 26 in March, followed by an average of 25 explosions per day in June (table 12). Ash plumes rose to a maximum height of 2.5 km above the crater during this reporting period with the highest plume height recorded on 5 May 2020. Frequently at night, crater incandescence was observed, occasionally accompanied by incandescent block avalanches traveling as far as 900 m downslope from the summit of the volcano.
Table 12. Monthly summary of eruptive events recorded at Reventador from February through July 2020. Data courtesy of IG-EPN (February to July 2020 daily reports).
| Month | Average Number of Explosions per day | Max plume height above the crater |
| Feb 2020 | 17 | 1.3 km |
| Mar 2020 | 26 | 2.2 km |
| Apr 2020 | 21 | 1.4 km |
| May 2020 | 22 | 2.5 km |
| Jun 2020 | 25 | 1.3 km |
| Jul 2020 | 15 | 1.4 km |
During February 2020 there were between 2 and 32 explosions recorded each day, accompanied by gas-and-steam and ash emissions that rose about 700-1,300 m above the crater. At night and early morning crater incandescence was observed frequently throughout the reporting period from 1 February and onward. Incandescent block avalanches were also detected intermittently beginning on 5 February when incandescent blocks rolled 300-800 m downslope from the summit on all sides of the volcano. On 6 and 21 February, gas-and-steam and ash emissions rose to a high of 1.3 km above the crater, according to Washington VAAC notices (figure 125).
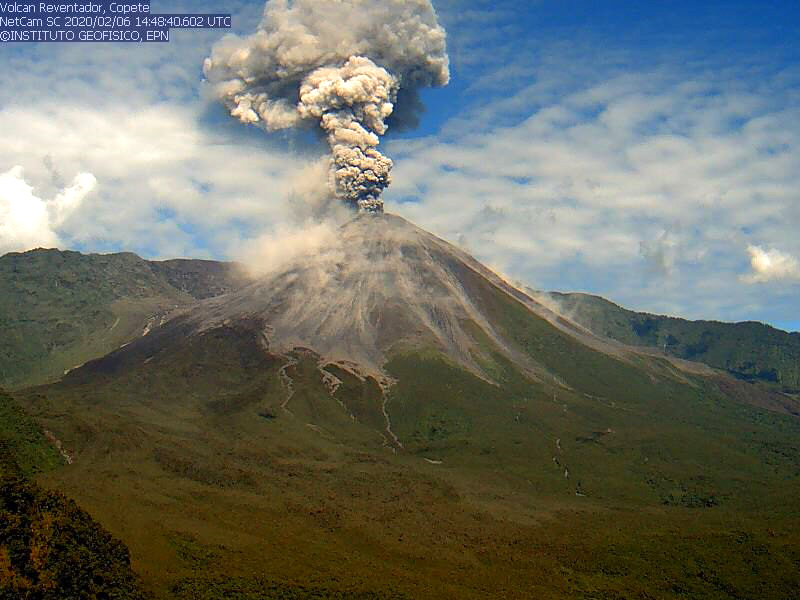 |
Figure 125. Webcam images of ash plumes rising from Reventador on 6 February 2020. Courtesy of IG-EPN (Informe diario del estado del Volcán Reventador No. 2020-37). |
Between 7 and 47 daily explosions were detected during March. On 17 March, rainfall generated two small lahars, accompanied by ash emissions that rose 1 km above the crater drifting NW. That same day, ashfall was reported in San Rafael (8 km ESE) SE of the volcano (figure 126). On 19 March ashfall was also reported in El Chaco (30 km SW), according to SNGR-Umeva-Orellana. At night, crater incandescence was observed and was occasionally accompanied by block avalanches traveling as far as 900 m downslope of the summit. Gas-and-steam and ash emissions continued, rising to 2.2 km above the crater on 28 March, according to the Washington VAAC notices.
 |
Figure 126. Photo of ashfall SE of Reventador on 17 March 2020. Courtesy of IG-EPN (IG al Instante Informativo Volcán Reventador No. 001). |
Activity persisted in April, characterized by almost daily gas-and-steam and ash emissions that rose to 1.4 km above the crater (figure 127) and intermittent crater incandescence observed at night and in the morning. The number of daily explosions detected per day ranged between 2 and 40, many of which were accompanied by block avalanches that traveled as far as 800 m downslope from the summit.
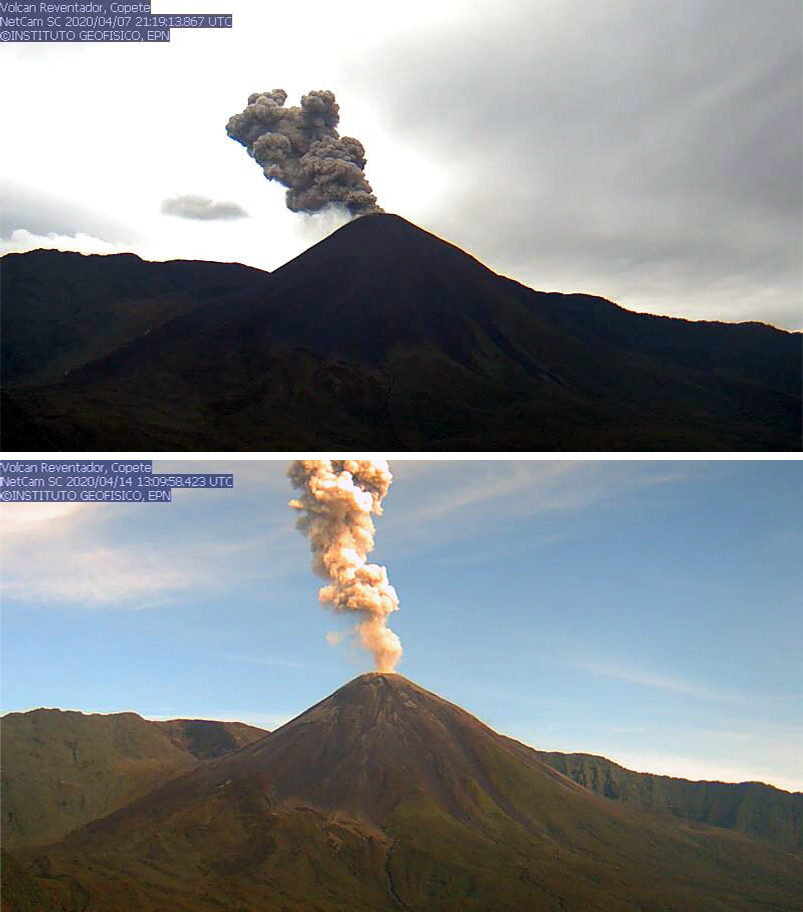 |
Figure 127. Webcam images showing gas-and-steam and ash plumes rising from Reventador on 7 (top) and 14 (bottom) April 2020. Courtesy of IG-EPN (Informe diario del estado del Volcán Reventador No. 2020-99 and 2020-105). |
During May, volcanism remained consistent, characterized by intermittent crater incandescence, gas-and-steam and ash emissions that rose 2.5 km above the crater, and daily explosions that ranged between 6 and 56 per day. On 14 May a Washington VAAC advisory stated there were three ash emissions that rose to a maximum of about 2.5 km above the crater and drifted W. At night, crater incandescence was observed accompanied by incandescent blocks that traveled 300 m below the summit on the SE flank; the furthest blocks traveled during this month was 800 m downslope.
The average number of daily explosions increased from 22 in May to 25 in June, and ranged between 0 and 51 per day, accompanied by gas-and-steam and ash emissions that rose 1.3 km above the crater (figure 128). At night, crater incandescence continued to be observed with occasional blocks rolling down the flanks up to 800 m downslope from the summit.
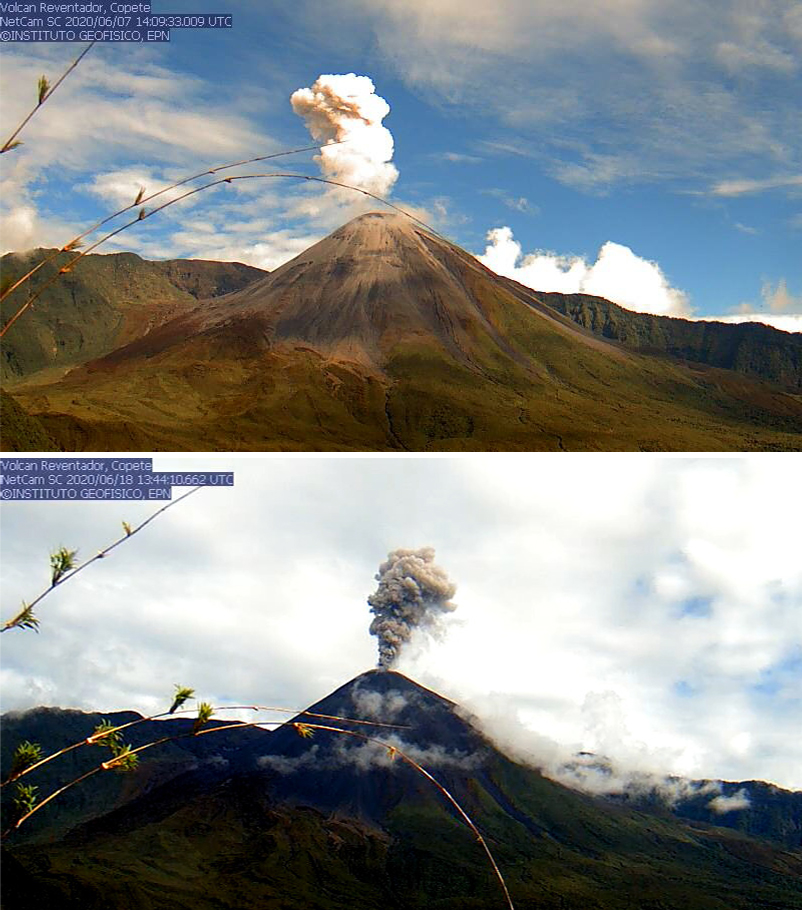 |
Figure 128. Webcam images showing gas-and-steam and ash plumes rising from Reventador on 7 (top) and 18 (bottom) June 2020. Courtesy of IG-EPN (Informe diario del estado del Volcán Reventador No. 2020-160 and 2020-171). |
By July, the average number of daily explosions decreased to 15 and gas-and-steam and ash emissions continued (figure 129). The maximum ash plume height during this month reached 1.4 km above the crater, according to a Washington VAAC advisory. Explosions still continued, ranging between 2 and 38 per day; explosions were not recorded in every daily report during this month. At night, crater incandescence was commonly observed and was sometimes accompanied by incandescent block avalanches that traveled as far as 800 m downslope from the summit. On 1 July a webcam image showed an explosion that produced an ash plume that rose 1 km above the crater drifting W and small pyroclastic flows near the cone. Another explosion on 5 July resulted in an ash plume that rose up to 1 km above the crater drifting W and NW accompanied by crater incandescence, a block avalanche that moved up to 800 m downslope, and a pyroclastic flow. On 22 and 24 July explosions ejected blocks that traveled downslope from the summit and were accompanied by pyroclastic flows that traveled down the N flank for 600 m.
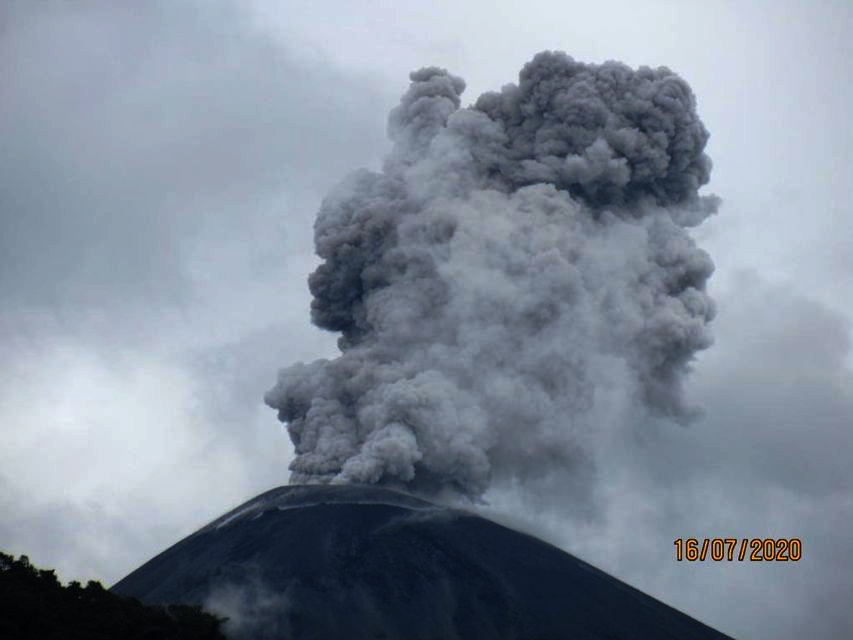 |
Figure 129. Image of an explosion at Reventador on 16 July 2020 that produced an ash column rising 500 m above the crater drifting N. Photo by Darwin Yánez (SNGRE, Servicio Nacional de Gestión de Riesgos y Emergencias del Ecuador), courtesy of IG-EPN (Informe Especial Reve N1 2020). |
MIROVA (Middle InfraRed Observation of Volcanic Activity) analysis of MODIS satellite data showed intermittent thermal anomalies within 5 km of the summit during 5 October 2019 and July 2020 (figure 130). There was a small decline in power from late April to late May, followed by a brief break in thermal anomalies from late May to mid-June 2020. In comparison, the MODVOLC algorithm identified nine thermal alerts between February and July 2020 near the crater summit on 5 February (2), 7 February (2), 12 February (1), 22 March (1), 27 April (1), 10 June (1), and 7 July (1). Some thermal anomalies can be seen in Sentinel-2 thermal satellite imagery on days with little cloud cover (figure 131).
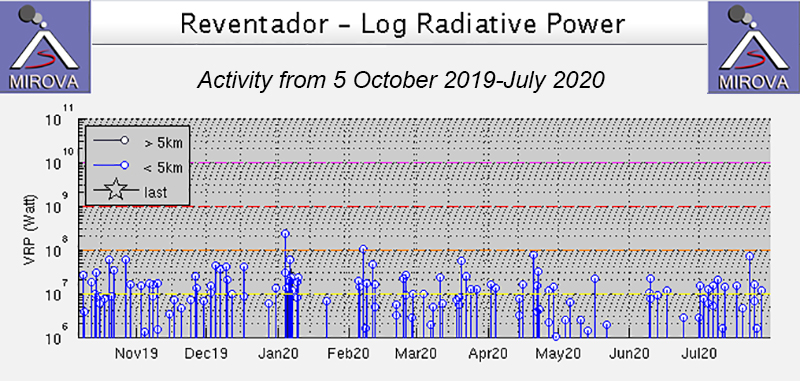 |
Figure 130. Thermal anomalies at Reventador persisted intermittently during 5 October 2019 through July 2020 as recorded by the MIROVA system (Log Radiative Power). Courtesy of MIROVA. |
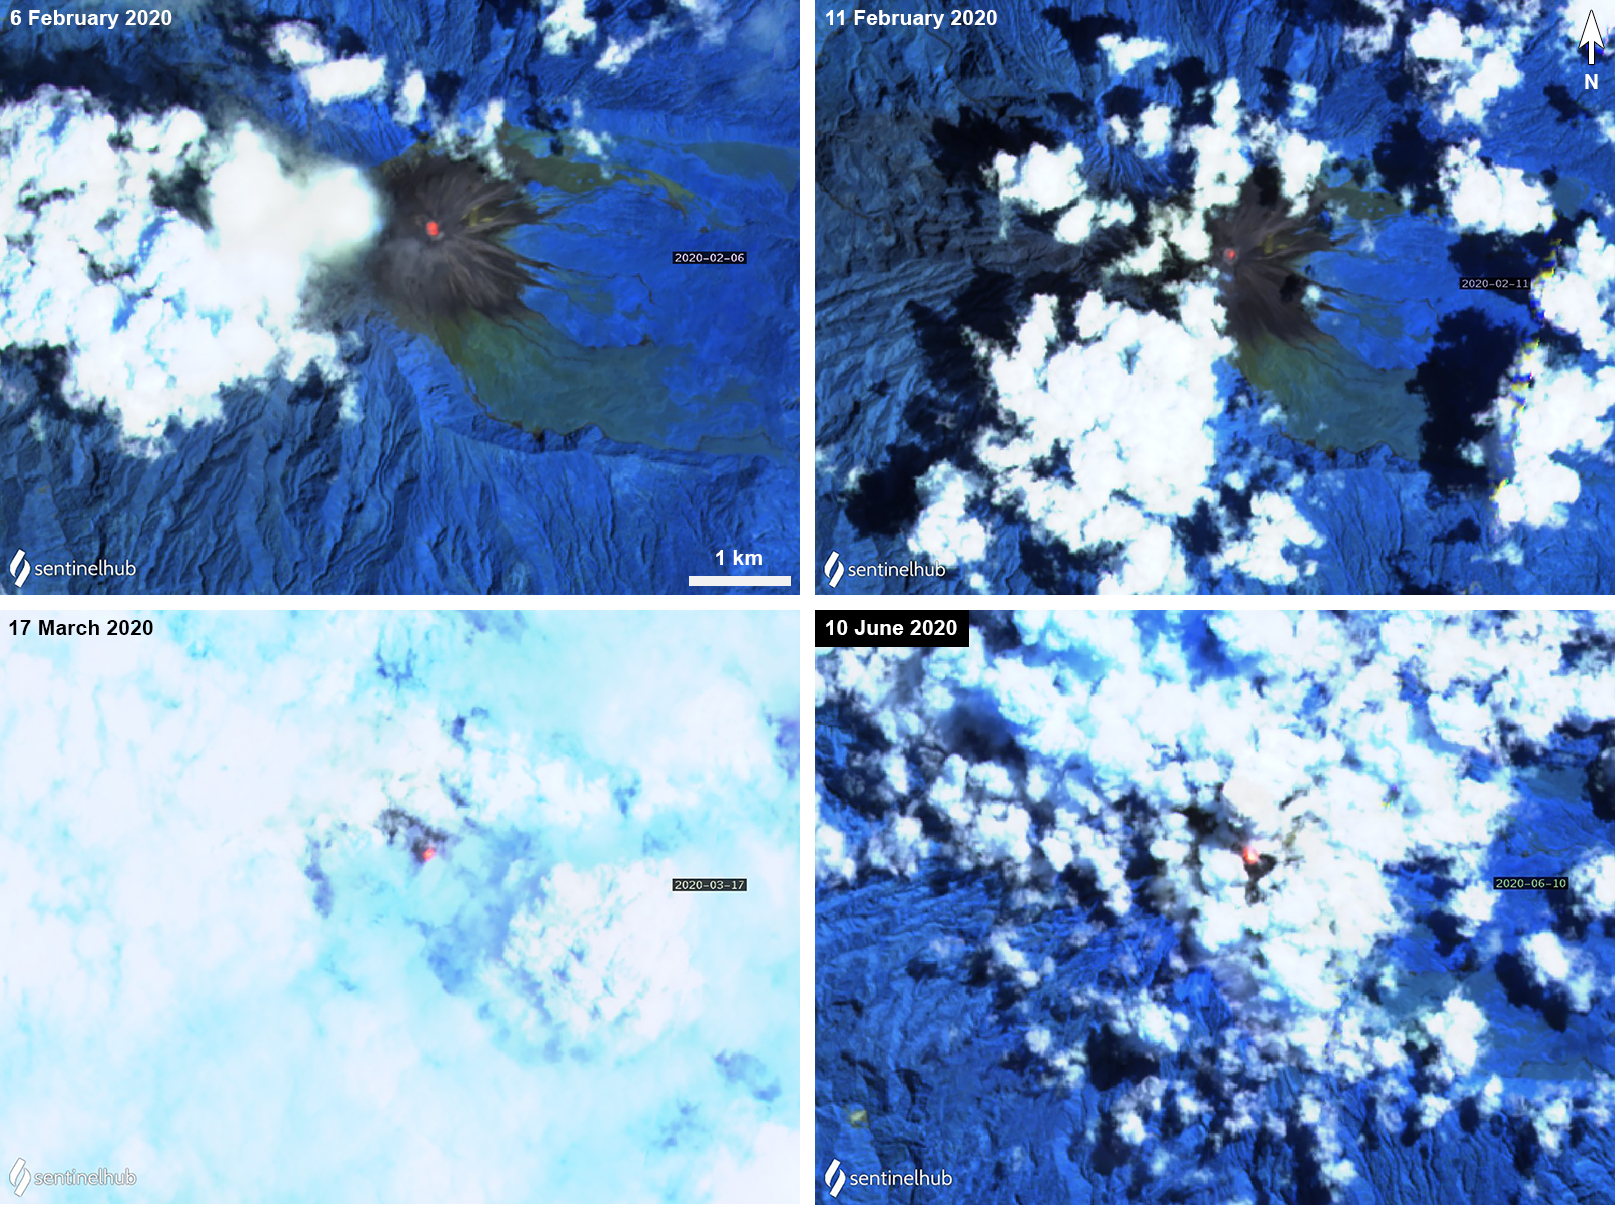 |
Figure 131. Sentinel-2 thermal satellite images of Reventador on 6 (top left) and 11 (top right) February, 17 March (bottom left), and 10 June (bottom right) showing a thermal hotspot in the central summit crater. Images with “Atmospheric penetration” (bands 12, 11, 8A) rendering; courtesy of Sentinel Hub Playground. |
Information Contacts: Instituto Geofísico, Escuela Politécnica Nacional (IG-EPN), Casilla 17-01-2759, Quito, Ecuador (URL: http://www.igepn.edu.ec/); Washington Volcanic Ash Advisory Center (VAAC), Satellite Analysis Branch (SAB), NOAA/NESDIS OSPO, NOAA Science Center Room 401, 5200 Auth Rd, Camp Springs, MD 20746, USA (URL: www.ospo.noaa.gov/Products/atmosphere/vaac, archive at: http://www.ssd.noaa.gov/VAAC/archive.html); Hawai'i Institute of Geophysics and Planetology (HIGP) - MODVOLC Thermal Alerts System, School of Ocean and Earth Science and Technology (SOEST), Univ. of Hawai'i, 2525 Correa Road, Honolulu, HI 96822, USA (URL: http://modis.higp.hawaii.edu/); MIROVA (Middle InfraRed Observation of Volcanic Activity), a collaborative project between the Universities of Turin and Florence (Italy) supported by the Centre for Volcanic Risk of the Italian Civil Protection Department (URL: http://www.mirovaweb.it/); Sentinel Hub Playground (URL: https://www.sentinel-hub.com/explore/sentinel-playground).
Continued ash emissions and incandescent blocks avalanches; new dome and lava flow emerge in August 2020
The andesitic Volcán El Reventador lies almost 100 km E of the main axis of active volcanoes in Ecuador and has historical eruptions with numerous lava flows and explosive events going back to the 16th century. An eruption in November 2002 generated a 17-km-high eruption cloud, pyroclastic flows that traveled 8 km, and multiple lava flows. Eruptive activity has been continuous since 2008. Daily explosions with ash emissions and ejecta of incandescent blocks rolling hundreds of meters down the flanks have been typical for many years. Similar activity continued during August 2020-January 2021, the period covered in this report, with information provided by Ecuador's Instituto Geofisico (IG-EPN), the Washington Volcano Ash Advisory Center (VAAC), and infrared satellite data.
Near-daily emissions of gas and ash often rose 500-1,000 m above the summit and drifted mostly in a westerly direction throughout August 2020-January 2021. Incandescence at night was produced by explosions of ejecta that sent blocks rolling hundreds of meters down the flanks of the pyroclastic cone inside the summit caldera. IG-EPN reported the presence of a new dome inside the crater in early August. A small lava flow about 400 m long persisted on the NE flank through at least the end of 2020; another flow was observed on the N flank in January. Small pyroclastic flows were reported a few times, and ashfall occurred in the San Rafael region (10 km SSE) at the end of October. After a relatively quiet June 2020, thermal activity increased to moderate levels and remained there throughout the period (figure 132).
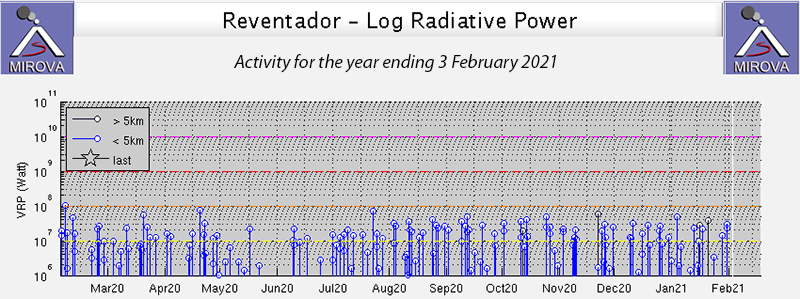 |
Figure 132. Thermal activity at Reventador was consistent at moderate to high levels from late June 2020 through January 2021, according to this MIROVA project graph of log radiative power at the volcano. Courtesy of MIROVA. |
Gas and ash emissions rose 500-1,000 m above the summit almost every day during August 2020 (figure 133). Incandescence and explosions at the summit crater, visible at night, were accompanied many nights by incandescent blocks that rolled 500-700 m down various flanks. The Washington VAAC issued 1-4 alerts most days, reporting ash observed in satellite data that rose 700-1,400 m above the summit. Drift directions were generally NW, W, or SW. IG reported a pyroclastic flow on the NE flank on 4 August, and a new 200-m-long lava flow near the summit on the NE flank was seen on 10 August (figure 134). By 19 August the lava flow had reached 350 m long; it remained active for the rest of the month but didn’t increase in length. Based on the analysis of webcam photographs and infrared images, they confirmed the growth of a new dome on 17 August (figure 135). MODVOLC thermal alerts were recorded on 3 and 11 August.
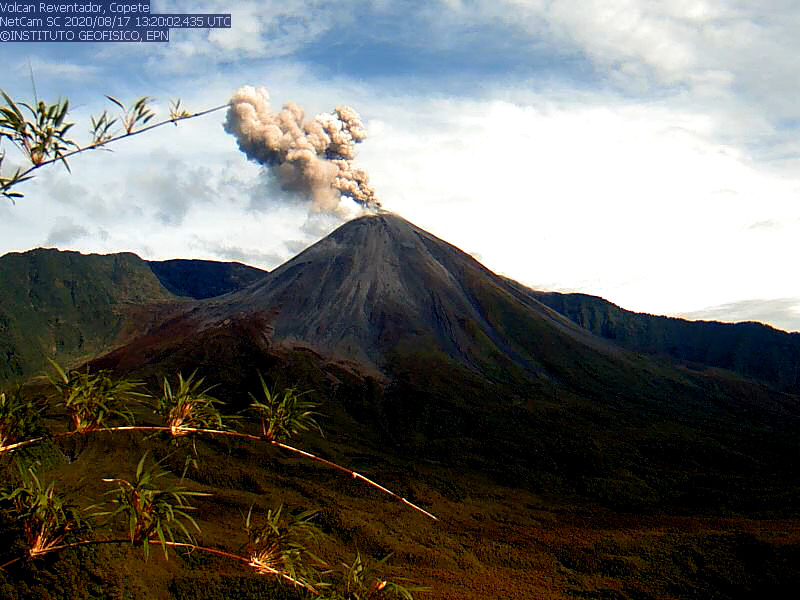 |
Figure 133. Gas and ash rose 500-1,000 m above the summit of Reventador most days during August 2020, as seen here on 17 August. Courtesy of IG-EPN (INFORME DIARIO DEL ESTADO DEL VOLCÁN REVENTADOR No. 2020-231, LUNES, 17 AGOSTO 2020). |
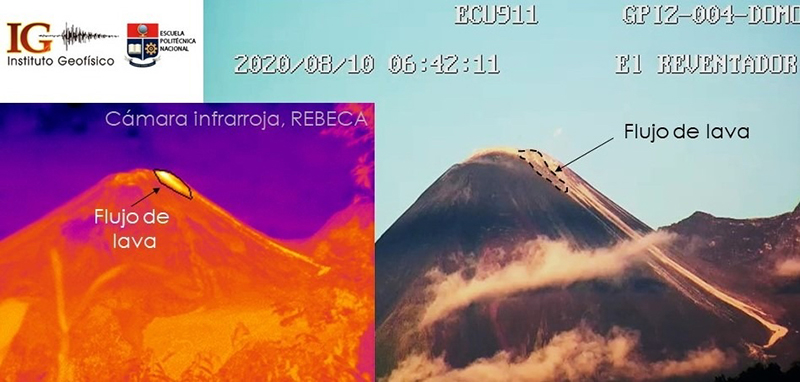 |
Figure 134. IG-EPN reported a new lava flow on the NE flank of Reventador on 10 August 2020. It was about 400 m long and persisted through the end of 2020. Courtesy of IG-EPN (INFORME DIARIO DEL ESTADO DEL VOLCÁN REVENTADOR No. 2020-224, LUNES, 10 AGOSTO 2020). |
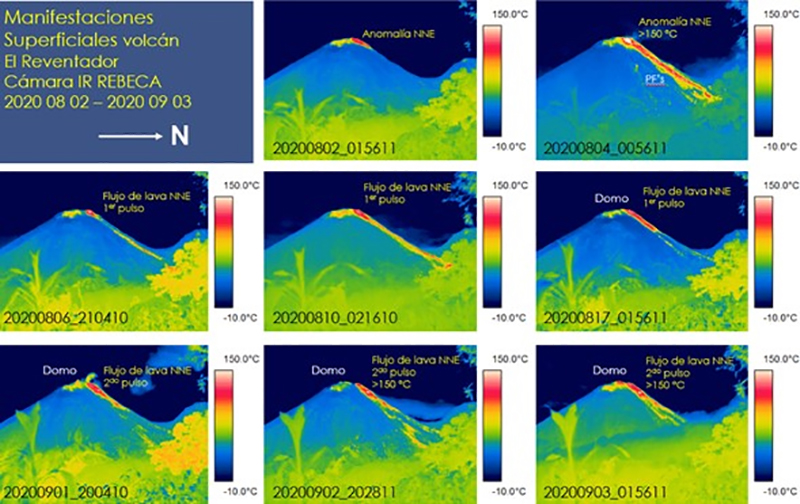 |
Figure 135. Infrared images show volcanic activity at Reventador during August 2020, including a pyroclastic flow on 4 August (top right), a lava flow on 6 August (middle left), and a lava dome on 17 August (middle right and bottom row). Courtesy of IG-EPN (Prepared by Cámar IR, S Vallejo; Informe Especial del Volcán El Reventador No. 2-2020). |
Incandescence from summit explosions was visible most nights in September 2020; explosions sent glowing blocks 500-800 m down multiple flanks on many nights. The lava flow on the NE flank remained active, growing slightly from 350 to 400 m in length. Three or four VAAC alerts were issued each day for ash plumes that rose usually 700-1,400 m above the summit and drifted NW. IG webcams captured images of ash emissions rising 600-900 m above the summit on most days; a few exceeded 1,000 m in height. IG reported pyroclastic flows on the N flank on 3 and 4 September, and on the W flank on 6 September. Pyroclastic deposits were observed on the E flank of the cone on 26 September, and the webcams captured a pyroclastic flow in the early morning of 29 September along the WSW flank that reached 600 m from the summit (figure 136). All of the pyroclastic flows remained inside the summit caldera. MODVOLC thermal alerts were recorded on 11, 12, and 20 September.
 |
Figure 136. A pyroclastic flow was visible on the WSW flank of Reventador on 29 September 2020 along with an ash plume that rose hundreds of meters above the summit. Courtesy of IG-EPN (IGAlInstante Informativo VOLCÁN REVENTADOR No. 005, MARTES, 29 SEPTIEMBRE 2020). |
The 400- to 450-m-long lava flow that first emerged on the NE flank in early August remained active, as seen in thermal imagery, throughout October 2020 (figure 137). Emissions of gas and ash continued rising daily 500-1,000 m above the summit and drifting in multiple different directions. Multiple VAAC reports were issued on most days; the plumes increased in height and frequency during the second half of the month, reaching 1,400 m above the summit. Incandescent blocks rolled 500-800 m down the flanks on most nights. MODVOLC thermal alerts were issued on five days during the month, on 2, 11, 14, 25, and 27 October; five alerts were issued on 25 October. Occasional pyroclastic flows were recorded on the N flank on 21 October. Fine-grained ashfall was reported in the San Rafael region (on the border between the Napo and Sucumbios provinces, 10 km ESE) on 28 and 30 October (figure 138).
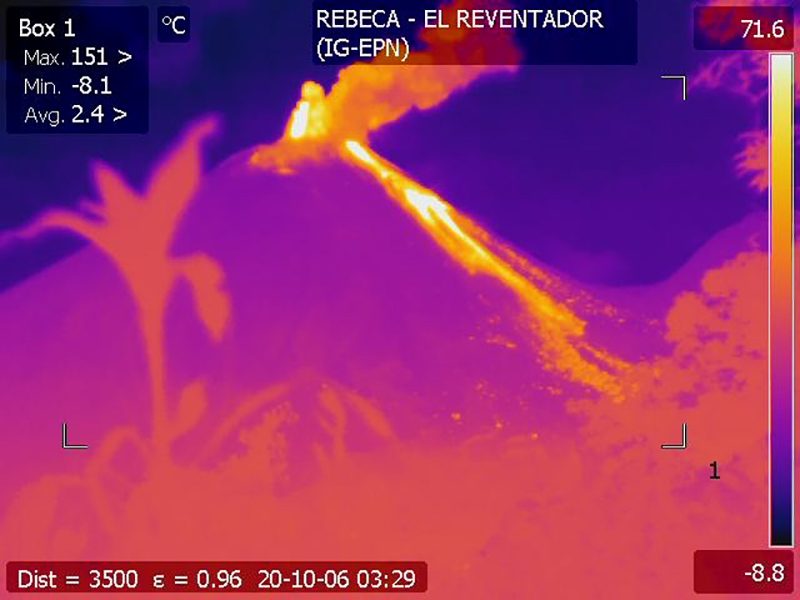 |
Figure 137. The lava flow on the NE flank of Reventador was about 450 m long and active throughout October 2020. In this 6 October 2020 infrared image incandescent ejecta rose from the summit and the lava flow was visible on the NE flank. Courtesy of IG-EPN (INFORME DIARIO DEL ESTADO DEL VOLCÁN REVENTADOR No. 2020-281, MARTES, 6 OCTUBRE 2020). |
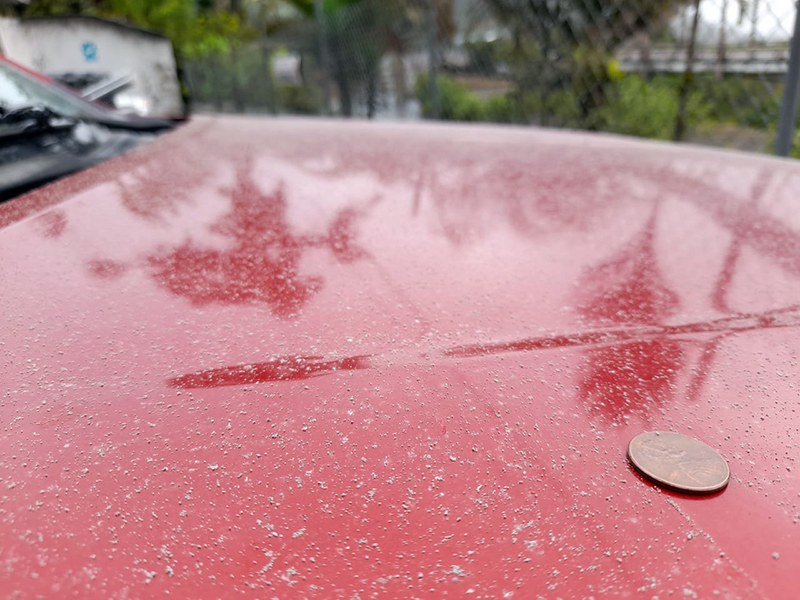 |
Figure 138. IGEPN official S. Vallejo reported ashfall on a vehicle in the San Rafael region on the border between the Napo and Sucumbios provinces, 10 km ESE of Reventador on 28 and 30 October. US penny for scale. Photo by S. Vallejo, courtesy of IG-EPN (IGAlInstante Informativo VOLCÁN REVENTADOR No. 007, VIERNES, 30 OCTUBRE 2020). |
Steam, gas, and ash emissions continued throughout November 2020, with many plumes rising 800-1,000 m above the summit and drifting NW (figure 139). Multiple daily VAAC reports indicated plumes visible in satellite imagery 1,000-1,400 m above the summit on most days. The lava flow remained active on the NE flank with thermal imagery indicating a strong heat signal 400-450 m from the summit. The explosions that produced the incandescent blocks were strongest during 5-7 November when the blocks rolled as far as 1,000 m from the summit. Cloudy weather and rain obscured views of activity at the end of the month, and a lahar was measured by seismic instruments on 27 November, but no damage was reported. MODVOLC alerts were issued on 3, 10, 26, and 30 November. Cloudy weather during the first week of December prevented many observations, but clearer skies later in the month indicated ongoing activity that included gas and ash emissions rising about 1,000 m and drifting NW; incandescent blocks rolled 500 m down the flanks following explosions inside the crater. Only a single MODVOLC alert was issued on 25 December. The 450-m-long lava flow on the NE flank remained active.
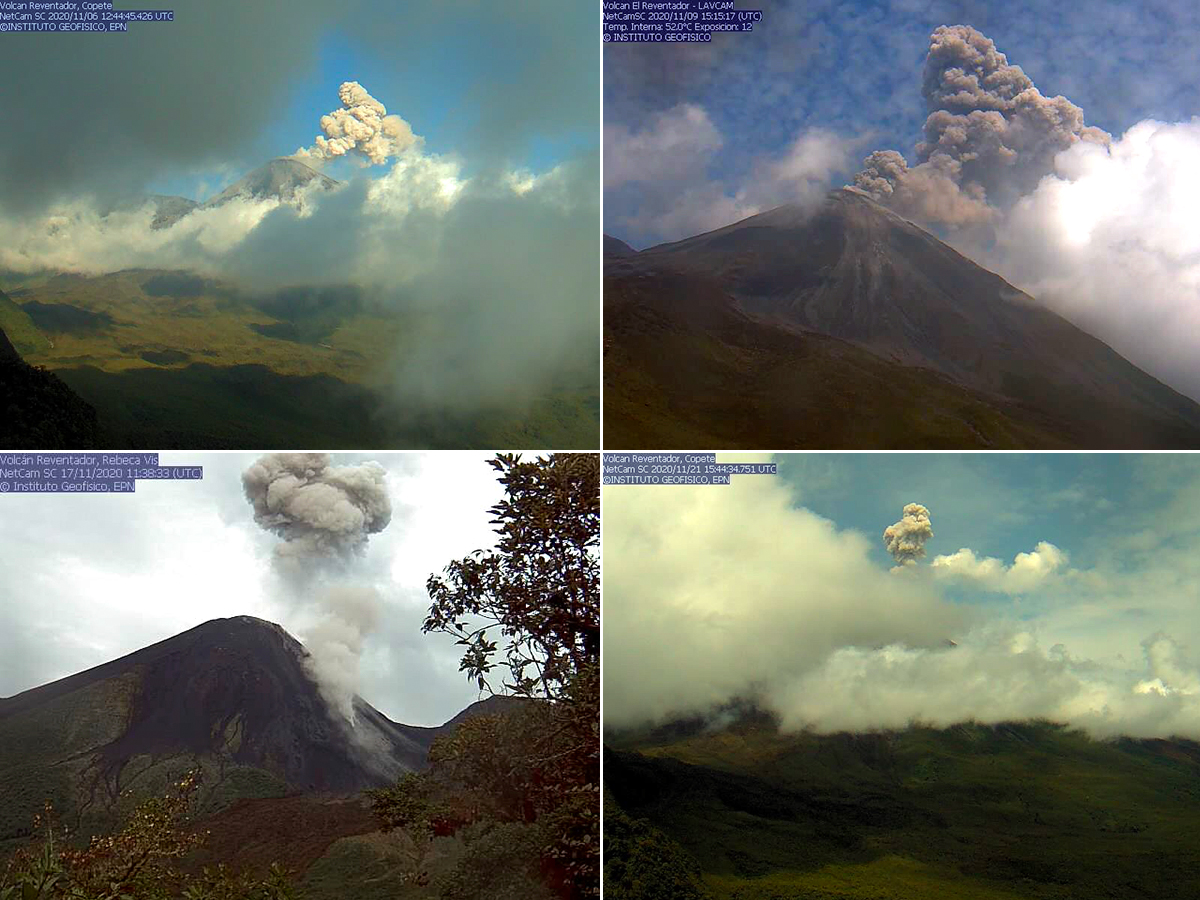 |
Figure 139. Many ash plumes at Reventador rose 800-1,000 m above the summit during November 2020. They were visible on some days when the mountain was not; clear days revealed blocks rolling down the NE flank and raising ash clouds as they rolled (bottom left). Courtesy of IG-EPN (INFORME DIARIO DEL ESTADO DEL VOLCÁN REVENTADOR Nos. 2020-312, 2020-315, 2020-323, and 2020-327). |
A new pulse of lava was first reported from a vent on the N flank on 10 January 2021 and remained active for the rest of the month. That same day incandescent blocks traveled 700 m down the NE flank. Pyroclastic flows were observed on the night of 14 January on the N flank. Satellite imagery on 16 January showed multiple areas of thermal activity at the summit and on the NNE flank (figure 140). On 21 January the ejecta from the explosions rose a hundred meters or more into the air over the pyroclastic cone in addition to traveling several hundred meters down the NE flank (figure 141). MODVOLC thermal alerts were issued on 4, 13, and 31 January.
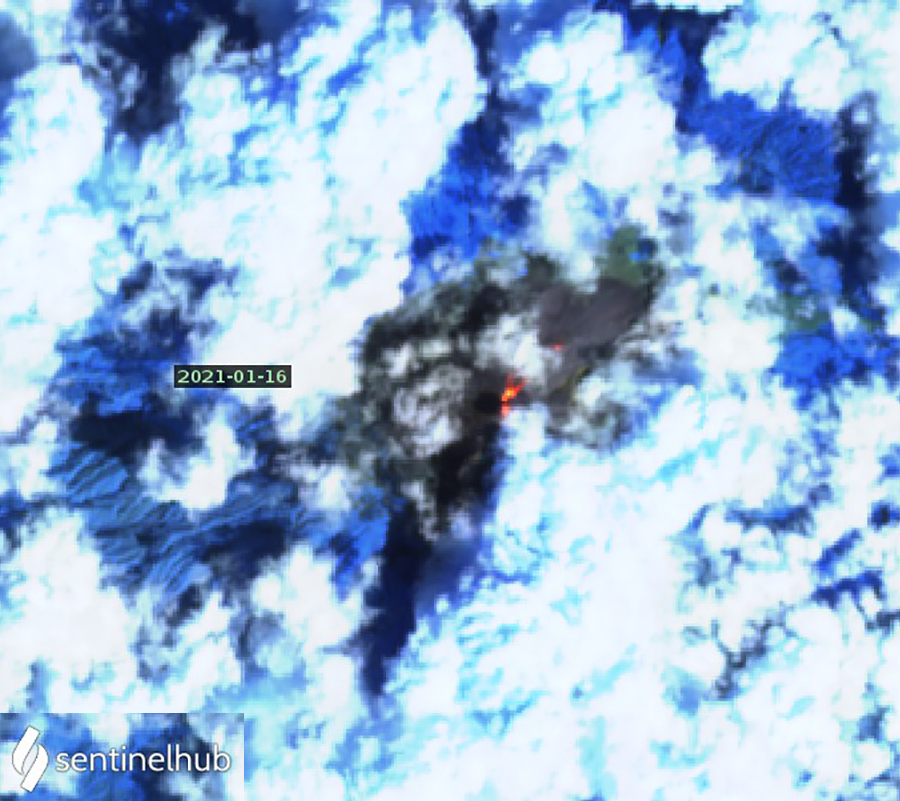 |
Figure 140. Sentinel-2 satellite imagery of Reventador on 16 January 2021 indicated strong thermal anomalies at the summit and on the NE flank, even through the frequently dense cloud cover. Courtesy of Sentinel Hub Playground. |
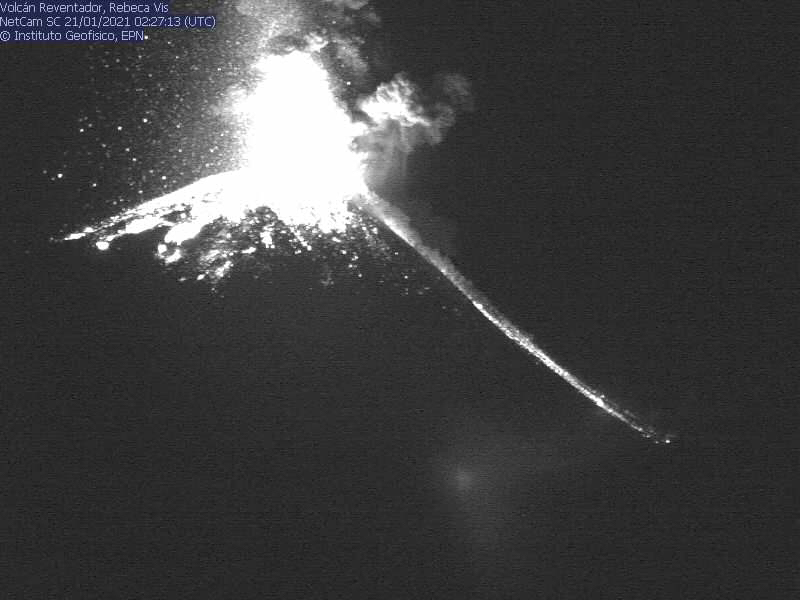 |
Figure 141. On 21 January 2021 the ejecta from explosions at Reventador could be seen rising a hundred meters or more over the pyroclastic cone in addition to traveling several hundred meters down the NE flank. Courtesy of IG-EPN (INFORME DIARIO DEL VOLCAN REVENTADOR No. 2021-021, Quito, jueves 21 de enero de 2021). |
Information Contacts: Instituto Geofísico, Escuela Politécnica Nacional (IG-EPN), Casilla 17-01-2759, Quito, Ecuador (URL: http://www.igepn.edu.ec/); MIROVA (Middle InfraRed Observation of Volcanic Activity), a collaborative project between the Universities of Turin and Florence (Italy) supported by the Centre for Volcanic Risk of the Italian Civil Protection Department (URL: http://www.mirovaweb.it/); Hawai'i Institute of Geophysics and Planetology (HIGP) - MODVOLC Thermal Alerts System, School of Ocean and Earth Science and Technology (SOEST), Univ. of Hawai'i, 2525 Correa Road, Honolulu, HI 96822, USA (URL: http://modis.higp.hawaii.edu/); Sentinel Hub Playground (URL: https://www.sentinel-hub.com/explore/sentinel-playground).
Ash explosions, lava flows, and block avalanches continue during February-July 2021
Volcán El Reventador is located 100 km E of the main axis of active volcanoes in Ecuador and has had historical eruptions dating back to the 16th century, characterized by explosive events and lava flows. The most recent eruption began in 2008 and has recently consisted of ash emissions, incandescent block avalanches, a new lava dome, and lava flows (BGVN 46:02). This report updates information from February through July 2021 and is characterized by daily explosions, ash plumes, incandescent block avalanches, lava flows, and occasional pyroclastic flows and lahars, based on daily reports from Ecuador's Instituto Geofisico (IG-EPN), the Washington Volcano Ash Advisory Center (VAAC), and infrared satellite data.
During February to July 2021, IG-EPN reported daily explosions, gas-and-steam and ash plumes, and frequent crater incandescence, often accompanied by incandescent block avalanches and lava flows. The highest average number of explosions per day was 73 in March, followed by 65 in February (table 13). During May-June the average number of daily explosions had declined to 34 and 33, respectively. Ash plumes rose to a maximum height of 2.3 km above the crater on 11 June. At night and early morning, frequent crater incandescence was visible, occasionally accompanied by lava flows generally on the eastern flanks and incandescent block avalanches traveling as far as 900 m from the summit. Seismicity, which was noted throughout the reporting period, was characterized by harmonic tremor events, signals indicating emissions, few volcano-tectonic earthquakes, and dominantly long-period (LP) earthquakes.
Table 13. Monthly summary of explosions and plume heights recorded at Reventador from February through July 2021. Data courtesy of IG-EPN (February to July 2021 daily reports).
| Month | Average Number of Explosions per day | Max plume height above the crater (km) |
| Feb 2021 | 65 | 1.4 |
| Mar 2021 | 73 | 1.5 |
| Apr 2021 | 57 | 1.3 |
| May 2021 | 34 | 1.4 |
| Jun 2021 | 33 | 2.3 |
| Jul 2021 | 52 | 1.6 |
Activity at the summit was consistent during February and March 2021. There were 25-121 daily explosive events during these two months, generating gas-and-steam and ash plumes to 400-1,500 m above the crater that drifted in multiple directions (figure 142). At night, crater incandescence and incandescent block avalanches were visible on all flanks, though primarily on the NE and S flanks traveling 500-800 m below the crater (figure 143), though it was not uncommon for weather to prevent clear views of the summit. Two lava flows were reported moving down the N and NE flanks.
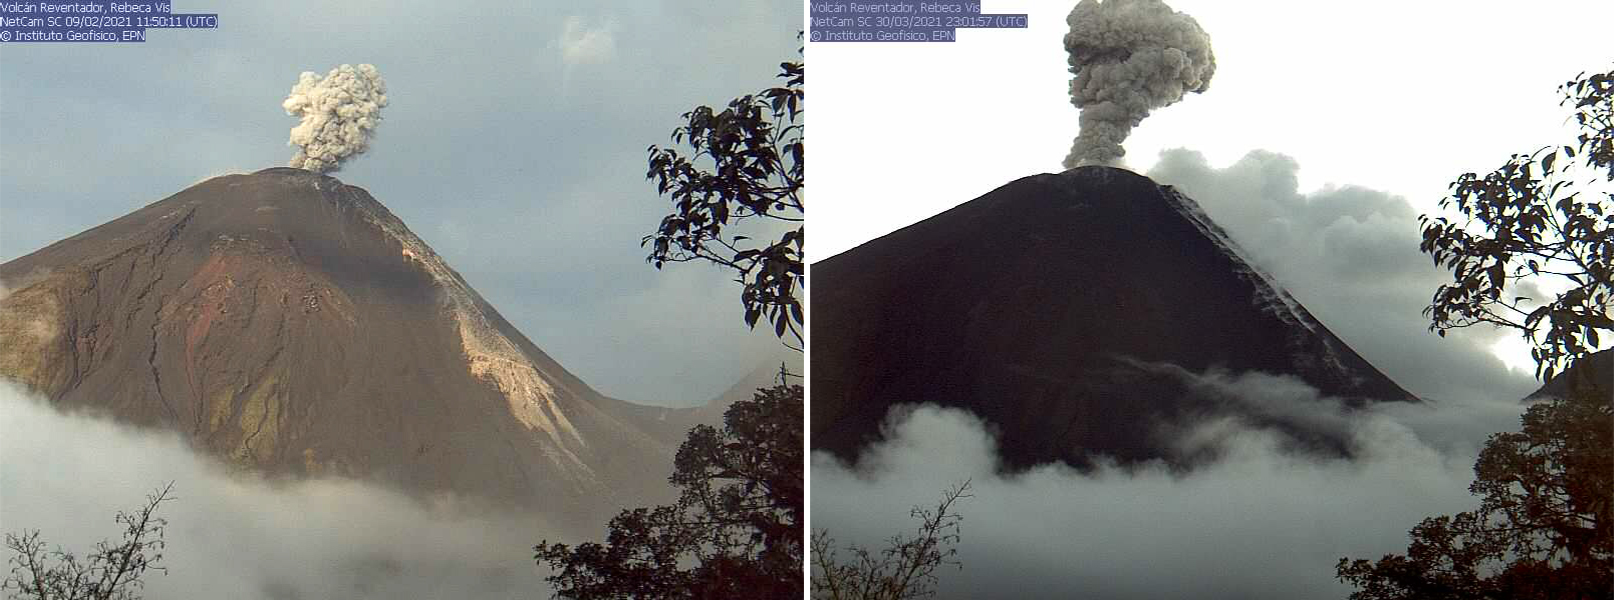 |
Figure 142. Webcam (Rebeca) images of two gray ash plumes rising from Reventador on 9 February (left) and 30 March (right) 2021. The NE flank is visible on the right side of the volcano, highlighted by recent block avalanches and active lava flows (light brown) in the February image. On 30 March white gas-and-steam emissions can be seen on the NE flank. Courtesy of IG-EPN (INFORME DIARIO DEL VOLCAN REVENTADOR No. 2021-040, 09 de febrero de 2021 and No. 2021-090, 31 de marzo de 2021). |
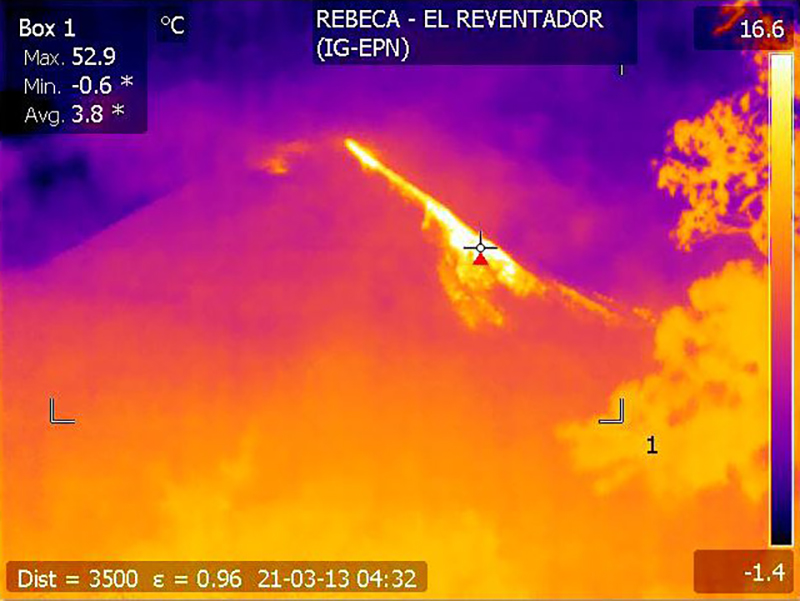 |
Figure 143. Webcam (Rebeca) infrared image of Reventador’s NE flank showing the active incandescent block avalanches (bright yellow-orange) on 13 March 2021. Courtesy of IG-EPN (INFORME DIARIO DEL VOLCAN REVENTADOR No. 2021-072, 13 de marzo de 2021). |
During April and May, explosions remained frequent, with 4-105 per day; ash plumes rose 400-1,400 m above the crater (figure 144) and drifted in different directions, though cloudy weather often prevented clear observations. Nighttime crater incandescence was reported during clear weather, accompanied by gas-and-steam emissions and incandescent blocks of material rolling down all flanks as far as 800 m, though the NE and S flanks were dominantly affected. On 21 April an infrared webcam recorded low temperatures of the lava flow on the NE flank, which IG-EPN indicated was no longer active. Small pyroclastic flows descending the SW flank for 600-700 m were noted on 23 and 26-27 April, but none reached the base of the cone. During 4-6 May a pyroclastic flow was reported 400 m down the SW flank, (figure 145). According to an infrared webcam, a lava flow on the NE flank became active again on 10 May; by 22 May, two flows were reported descending the NE and SE flanks (figure 144). Some blocks of material from the front of the lava flow traveled 800 m below the summit. IG-EPN reported that some inflation was noted on the N summit on 13 May, which continued into the following month. On 17 May around 1600 lahars were detected in the upper part of the Reventador River on the N drainages due to heavy rain. By 25 May the number of lahars had decreased and as a result, the seismic stations recorded consistent seismic signals starting around 0741 and continuing throughout the day.
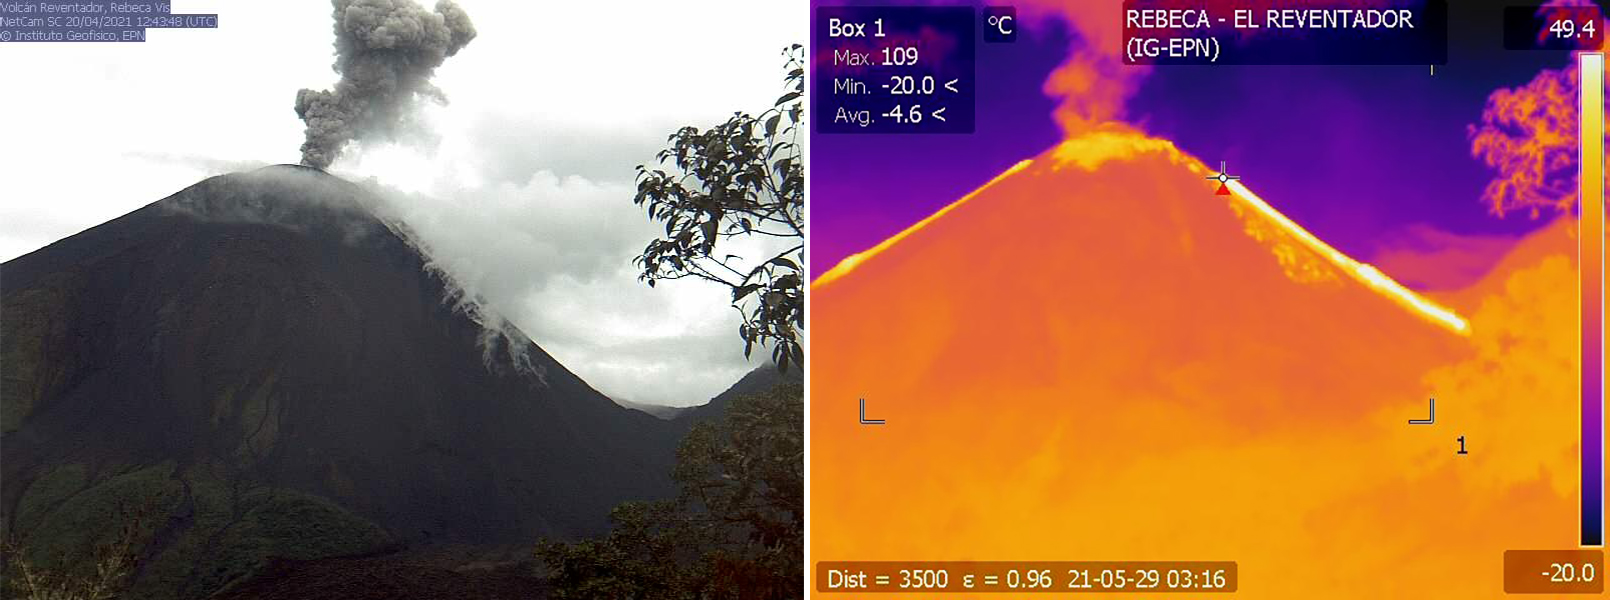 |
Figure 144. Webcam (Rebeca) images showing an ash plume rising above Reventador on 20 April 2021 (left) accompanied by white gas-and-steam emissions and block avalanches rolling down the NE flank. An infrared image (right) shows the two active lava flows (bright yellow) descending the NE and SE flanks on 29 May 2021. Courtesy of IG-EPN (INFORME DIARIO DEL VOLCAN REVENTADOR No. 2021-110, 20 de abril de 2021 and No. 2021-150, 29 de mayo de 2021). |
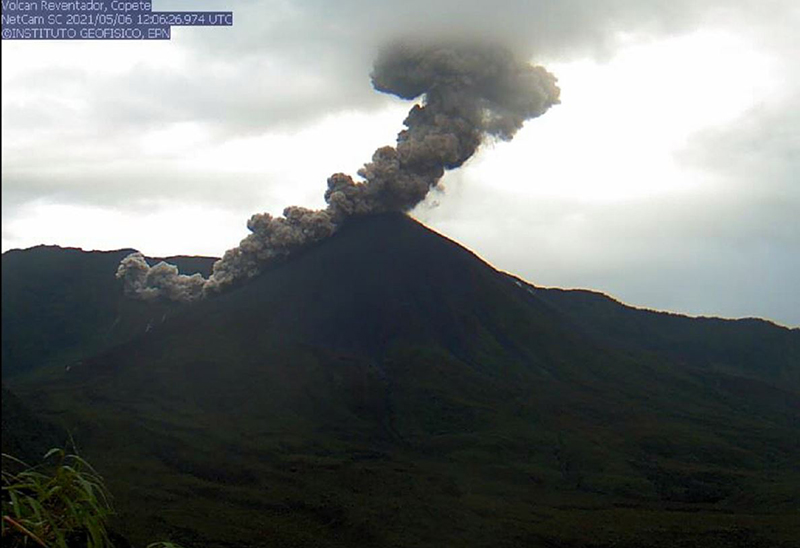 |
Figure 145. Webcam (Copete) image of a dense gray ash plume rising from Reventador, accompanied by a pyroclastic flow descending the SW flank at 0706 on 6 May 2021. Courtesy of IG-EPN (INFORME DIARIO DEL VOLCAN REVENTADOR No. 2021-126, 06 de mayo de 2021). |
Persistent explosions and ash plumes were reported during June and July, with 3-87 daily events that rose 300-2,300 m above the crater (figure 146). The plumes drifted primarily W, N, NW, NE, and SW. At night and during the early morning, incandescence was observed on the upper part of the flanks while the two lava flows continued to descend the NE and S flanks (figure 146). Incandescent blocks of material rolled down the NE, S, and SE flanks as far as 800 m below the summit. On 7 June during 1200 and 1300 a lahar was reported on the SE flank.
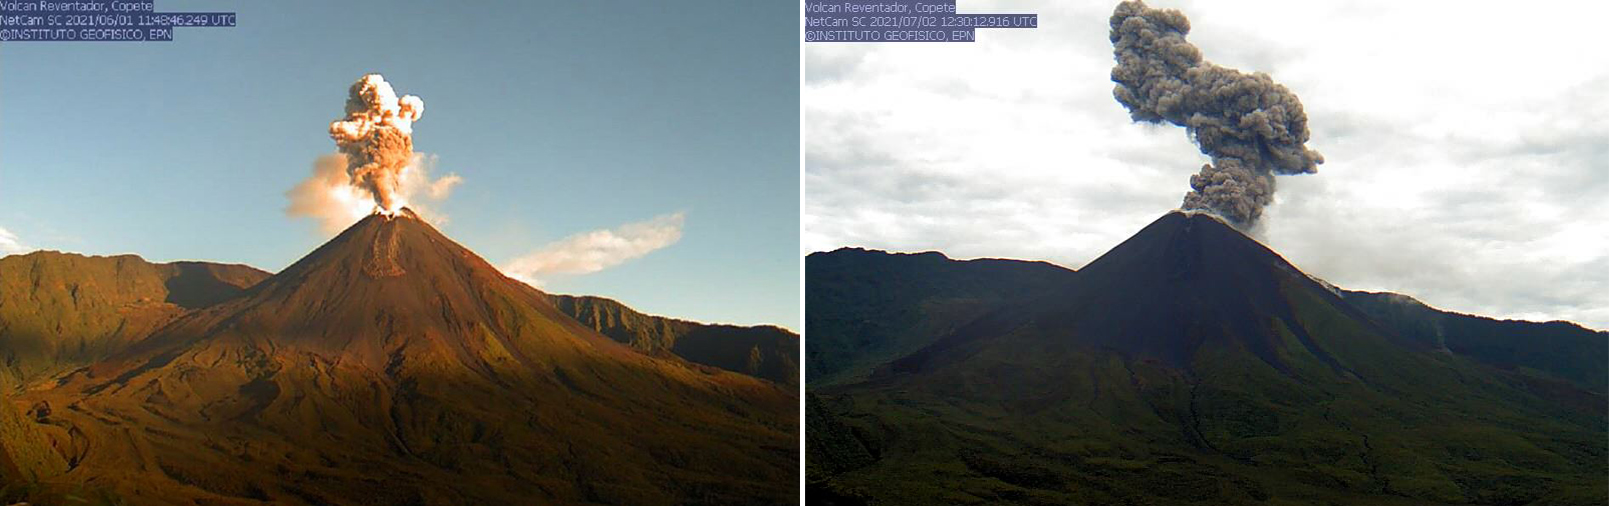 |
Figure 146. Webcam (Copete) images showing dense ash plumes rising from Reventador on 1 June (left) and 2 July (right) 2021. The ash plume from 1 June is accompanied by a lava flow on the SE flank. Courtesy of IG-EPN (INFORME DIARIO DEL VOLCAN REVENTADOR No. 2021-153, 01 de junio de 2021 and No. 2021-184, 02 de julio de 2021). |
MIROVA (Middle InfraRed Observation of Volcanic Activity) analysis of MODIS satellite data showed intermittent thermal anomalies of moderate-to-high intensity during February through July 2021 (figure 147), which reflected the active lava flows and incandescent block avalanches occurring throughout that time. In comparison, the MODVOLC thermal algorithm identified nine thermal alerts between February and July on 9 and 14 February, 20 March, 12 May, 10 and 22 June, and 28 July. Some incandescent avalanches were visible in Sentinel-2 infrared satellite imagery, though clouds often obscured the view of the summit (figure 148). These avalanches were observed descending the NE flanks.
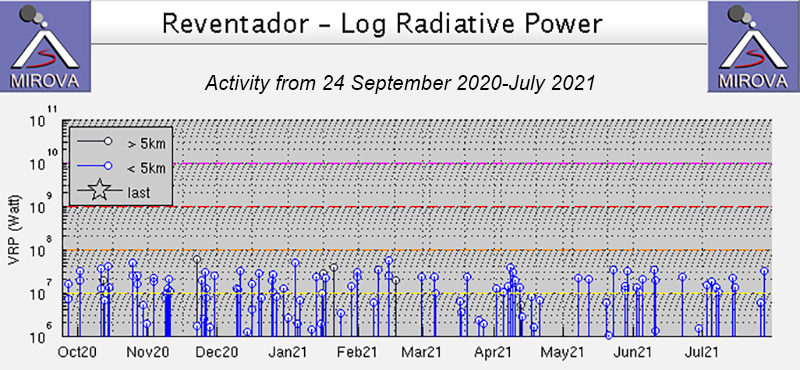 |
Figure 147. Intermittent thermal activity was detected at Reventador at moderate to high levels during February through July 2021, based on the MIROVA graph (Log Radiative Power). Courtesy of MIROVA. |
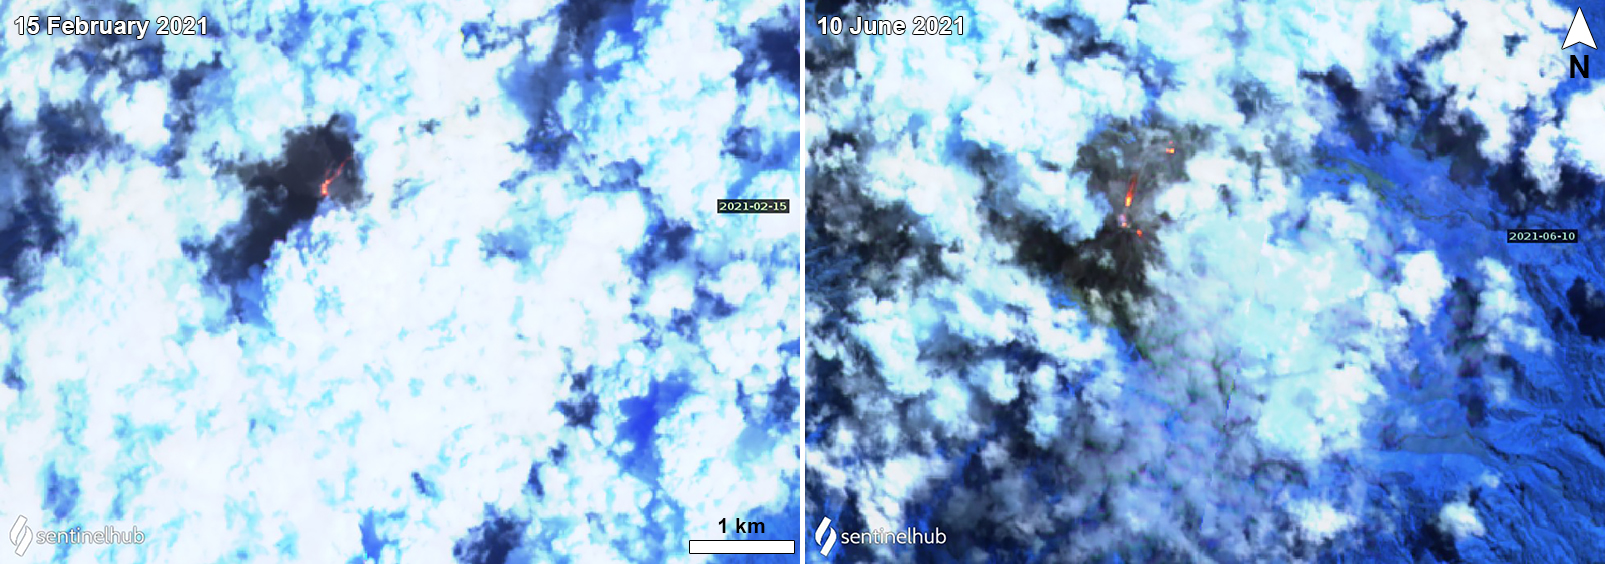 |
Figure 148. Sentinel-2 infrared satellite images of Reventador on 15 February 2021 (left) and 10 June (right) showed strong incandescent block avalanches descending the NE flanks, even through frequently dense cloud cover. Images with “Atmospheric penetration” (bands 12, 11, 8A) rendering. Courtesy of Sentinel Hub Playground. |
Information Contacts: Instituto Geofísico, Escuela Politécnica Nacional (IG-EPN), Casilla 17-01-2759, Quito, Ecuador (URL: http://www.igepn.edu.ec/); Washington Volcanic Ash Advisory Center (VAAC), Satellite Analysis Branch (SAB), NOAA/NESDIS OSPO, NOAA Science Center Room 401, 5200 Auth Rd, Camp Springs, MD 20746, USA (URL: www.ospo.noaa.gov/Products/atmosphere/vaac, archive at: http://www.ssd.noaa.gov/VAAC/archive.html); MIROVA (Middle InfraRed Observation of Volcanic Activity), a collaborative project between the Universities of Turin and Florence (Italy) supported by the Centre for Volcanic Risk of the Italian Civil Protection Department (URL: http://www.mirovaweb.it/); Hawai'i Institute of Geophysics and Planetology (HIGP) - MODVOLC Thermal Alerts System, School of Ocean and Earth Science and Technology (SOEST), Univ. of Hawai'i, 2525 Correa Road, Honolulu, HI 96822, USA (URL: http://modis.higp.hawaii.edu/); Sentinel Hub Playground (URL: https://www.sentinel-hub.com/explore/sentinel-playground).
Daily explosions and ash plumes with incandescent block avalanches during August 2021-January 2022
Volcán El Reventador is located 100 km E of the main axis of active volcanoes in Ecuador and has had eruptions recorded since the 16th century, characterized by explosive events and lava flows. The most recent eruption began in 2008 and has recently consisted of ash explosions, lava flows, and block avalanches (BGVN 46:08). This report describes daily explosions, ash plumes, incandescent block avalanches, lava flows, and occasional pyroclastic flows and lahars during August 2021 through January 2022, based on daily reports from Ecuador's Instituto Geofisico (IG-EPN), the Washington Volcano Ash Advisory Center (VAAC), and infrared satellite data.
During August 2021 to January 2022, IG-EPN reported daily explosions, gas-and-steam and ash plumes, and frequent crater incandescence, often accompanied by incandescent block avalanches and lava flows. The highest average number of explosions per day was 74 in August, followed by 68 in October (table 14). During January 2022, the average number of daily explosions had declined to 32. Ash plumes rose to a maximum height of 1.7 km above the crater during 2-3 September and 10 October. At night and early morning, frequent crater incandescence was visible, occasionally accompanied by lava flows generally on the S and NE flanks and incandescent block avalanches traveling as far as 800 m from the summit.
Table 14. Monthly summary of explosions and plume heights recorded at Reventador from August 2021 through January 2022. Data courtesy of IG-EPN (August 2021 to January 2022 daily reports).
| Month | Average number of explosions per day | Max plume height above the crater (km) |
| Aug 2021 | 74 | 1.6 |
| Sep 2021 | 64 | 1.7 |
| Oct 2021 | 68 | 1.7 |
| Nov 2021 | 57 | 1.4 |
| Dec 2021 | 49 | 1.3 |
| Jan 2022 | 32 | 1.4 |
Summit crater activity was relatively similar during August and September 2021. There were 34-100 daily explosive events during these two months, which generated gas-and-steam and ash plumes that rose 300-1,700 m above the crater that drifted in multiple directions. At night, crater incandescence was frequently visible and incandescent block avalanches intermittently traveled 300-800 m down all the flanks, but primarily the NE and SE flanks. A lava flow was observed descending the S and NE flank during 2-3 August. On 12 August an ash plume rose as high as 1.6 km above the crater (figure 149). An active lava flow was detected on the NE flank during the afternoon of 12 August through the late morning of 13 August. During 2-3 September ash plumes varied from 1.4-1.7 km above the crater and drifted SW and W (figure 149). Incandescent blocks during 29-30 November were observed rolling down the E flank for about 800 m and accompanied crater incandescence.
 |
Figure 149. Webcam images of gas-and-ash plumes rising as high as 1.6 km above the crater on 12 August 2021 (left) and 1.7 km above the crater and drifting W and SW on 3 September 2021 (right). Courtesy of IG-EPN (INFORME DIARIO DEL VOLCAN REVENTADOR No. 2021-225, 12 de agosto de 2021 and INFORME DIARIO DEL VOLCAN REVENTADOR No. 2021-247, 03 de septiembre de 2021). |
During October and November, daily explosions continued, with 8-105 per day and resulting gas-and-ash plumes that rose 100-1,700 m above the crater and drifted in different directions. Nighttime crater incandescence was frequently visible, accompanied by occasional block avalanches that descended 300-800 m down all the flanks, especially the S and SE flanks. According to Washington VAAC reports, ash emissions rose as high as 1.7 km above the summit and drifted NW and W on 2 and 8-10 October 2021 (figure 150). A pyroclastic flow was captured descending the S flank at 0617 on 25 October 2021 (figure 151). Ashfall was reported in Gonzalo Pizarro on 27 October. On 7 November an ash plume rose 1.2 km above the summit and drifted W and SW (figure 150). During 8-9 November ash emissions rose as high as 1.4 km above the summit and drifted SW and N, according to a Washington VAAC notice. Some light ashfall was reported during the morning of 12 and 14 November in San Luis del El Chaco. A lava flow was detected on the NE flank advancing slowly during 14-16 November.
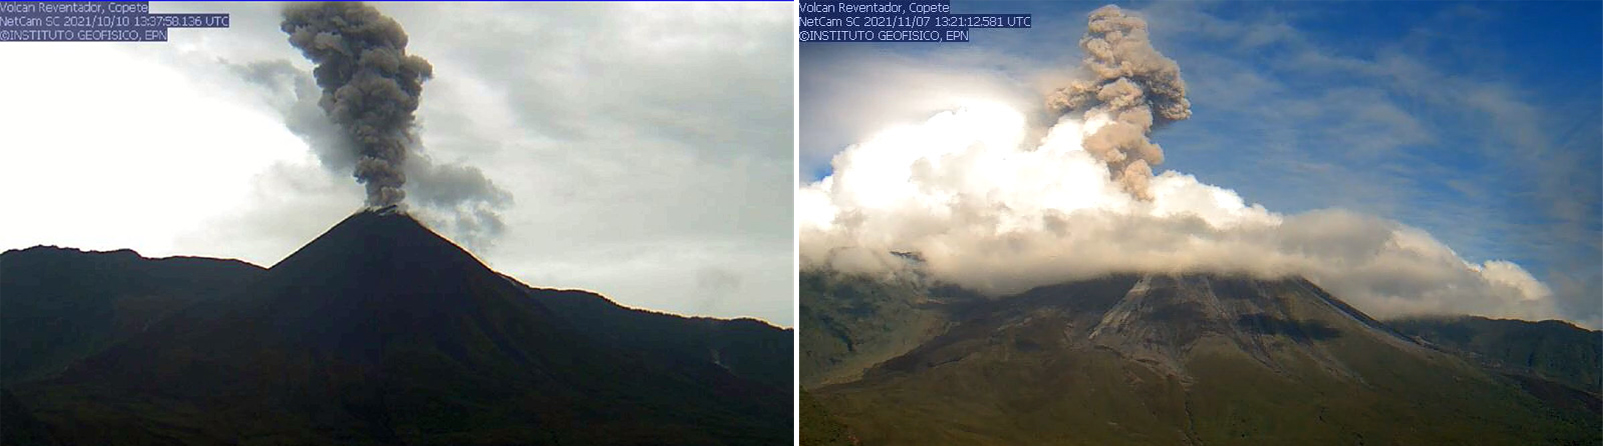 |
Figure 150. Webcam image of a gas-and-ash plume that rose 1.7 km above the summit on 10 October 2021 (left) and 1.2 km above the summit on 7 November 2021 (right). Courtesy of IG-EPN (INFORME DIARIO DEL VOLCAN REVENTADOR No. 2021-277, 10 de octubre de 2021 and INFORME DIARIO DEL VOLCAN REVENTADOR No. 2021-312, 07 de noviembre de 2021). |
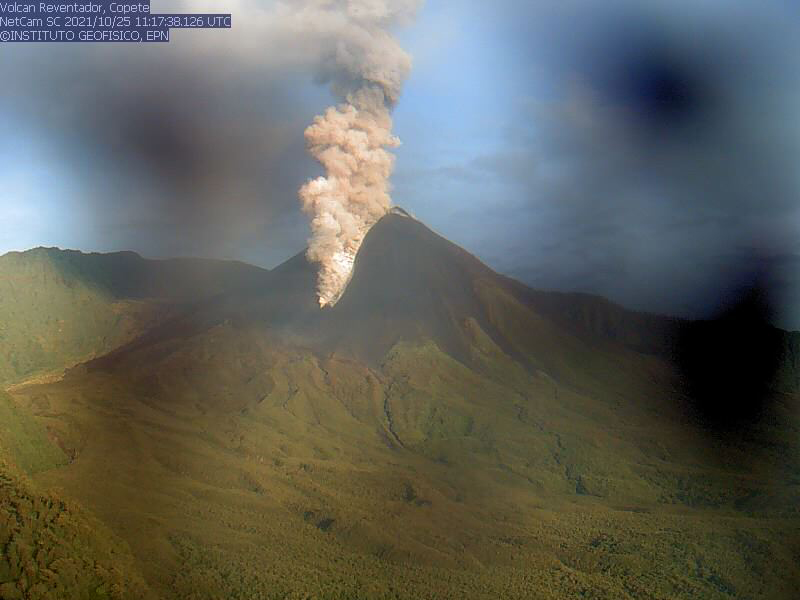 |
Figure 151. Webcam image of a pyroclastic flow descending the S flank of Reventador at 0617 on 25 October 2021. Courtesy of IG-EPN (INFORME DIARIO DEL VOLCAN REVENTADOR No. 2021-299, 25 de octubre de 2021). |
Activity persisted during December and January 2022, characterized by 7-103 daily explosions, frequent ash plumes, and crater incandescence; however, weather and clouds in January often prevented clear views of the summit. Ash plumes rose 500-1,400 m above the summit and drifted in different directions, especially W, SW, and NW. Nighttime crater incandescence was occasionally accompanied by incandescent blocks that descended 300-800 m on all sides of the volcano, including the S, SE, and NE flanks. On 1, 2, and 15 December ash plumes rose 1.3 km above the summit and drifted W and SW, respectively. An active lava flow was reported traveling down the N flank during 1-2 and 25-26 December. During the night of 13 December and during 16-19 and 22-27 December, a lava flow descended the NE flank, based on data from surveillance cameras (figure 152). A lava flow on the E flank was reported during 14-15 and 23-24 January. On 4, 29, and 30 January ash plumes rose 1.4 km above the summit and drifted S and SE.
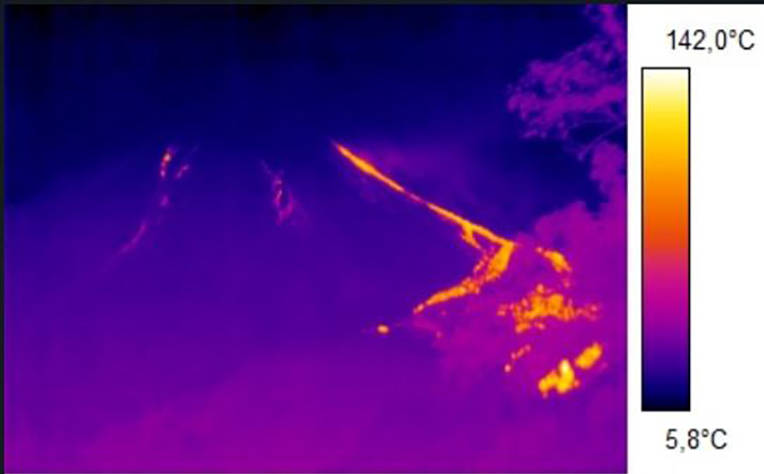 |
Figure 152. Thermal image of an active lava flow descending the NE flank of Reventador at 0720 on 25 January. Courtesy of IG-EPN (INFORME DIARIO DEL VOLCAN REVENTADOR No. 2021-025, 25 de enero de 2022). |
MIROVA (Middle InfraRed Observation of Volcanic Activity) analysis of MODIS satellite data showed intermittent thermal anomalies of varying intensity during April 2021 through January 2021, which reflected the active lava flows and incandescent block avalanches occurring throughout that time (figure 153). In comparison, the MODVOLC thermal algorithm 37 thermal anomalies were detected by the MODVOLC thermal algorithm on 4 and 20 August, 5, 14, and 28 September, 1, 2, and 3 October, 4, 17, 22, 24, and 29 November, 31 December 2021, and 2, 7, and 9 January 2022. Some thermal anomalies and incandescent avalanches on the NE flank were visible in Sentinel-2 infrared satellite imagery, though clouds often obscured the view of the summit (figure 154).
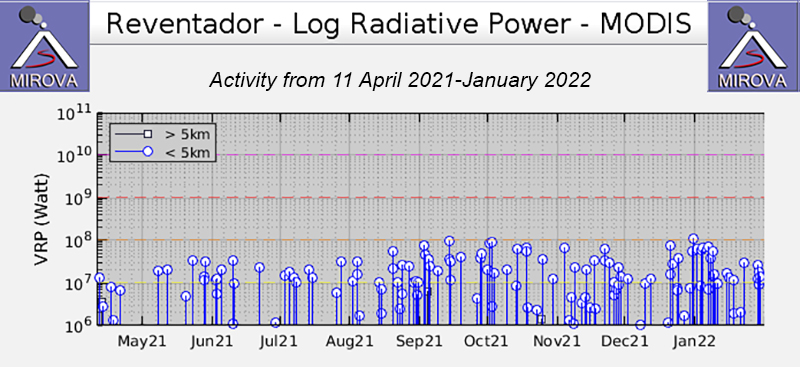 |
Figure 153. Frequent thermal activity was detected at Reventador at varying levels during August 2021 through January 2022, based on this MIROVA graph (Log Radiative Power). Courtesy of MIROVA. |
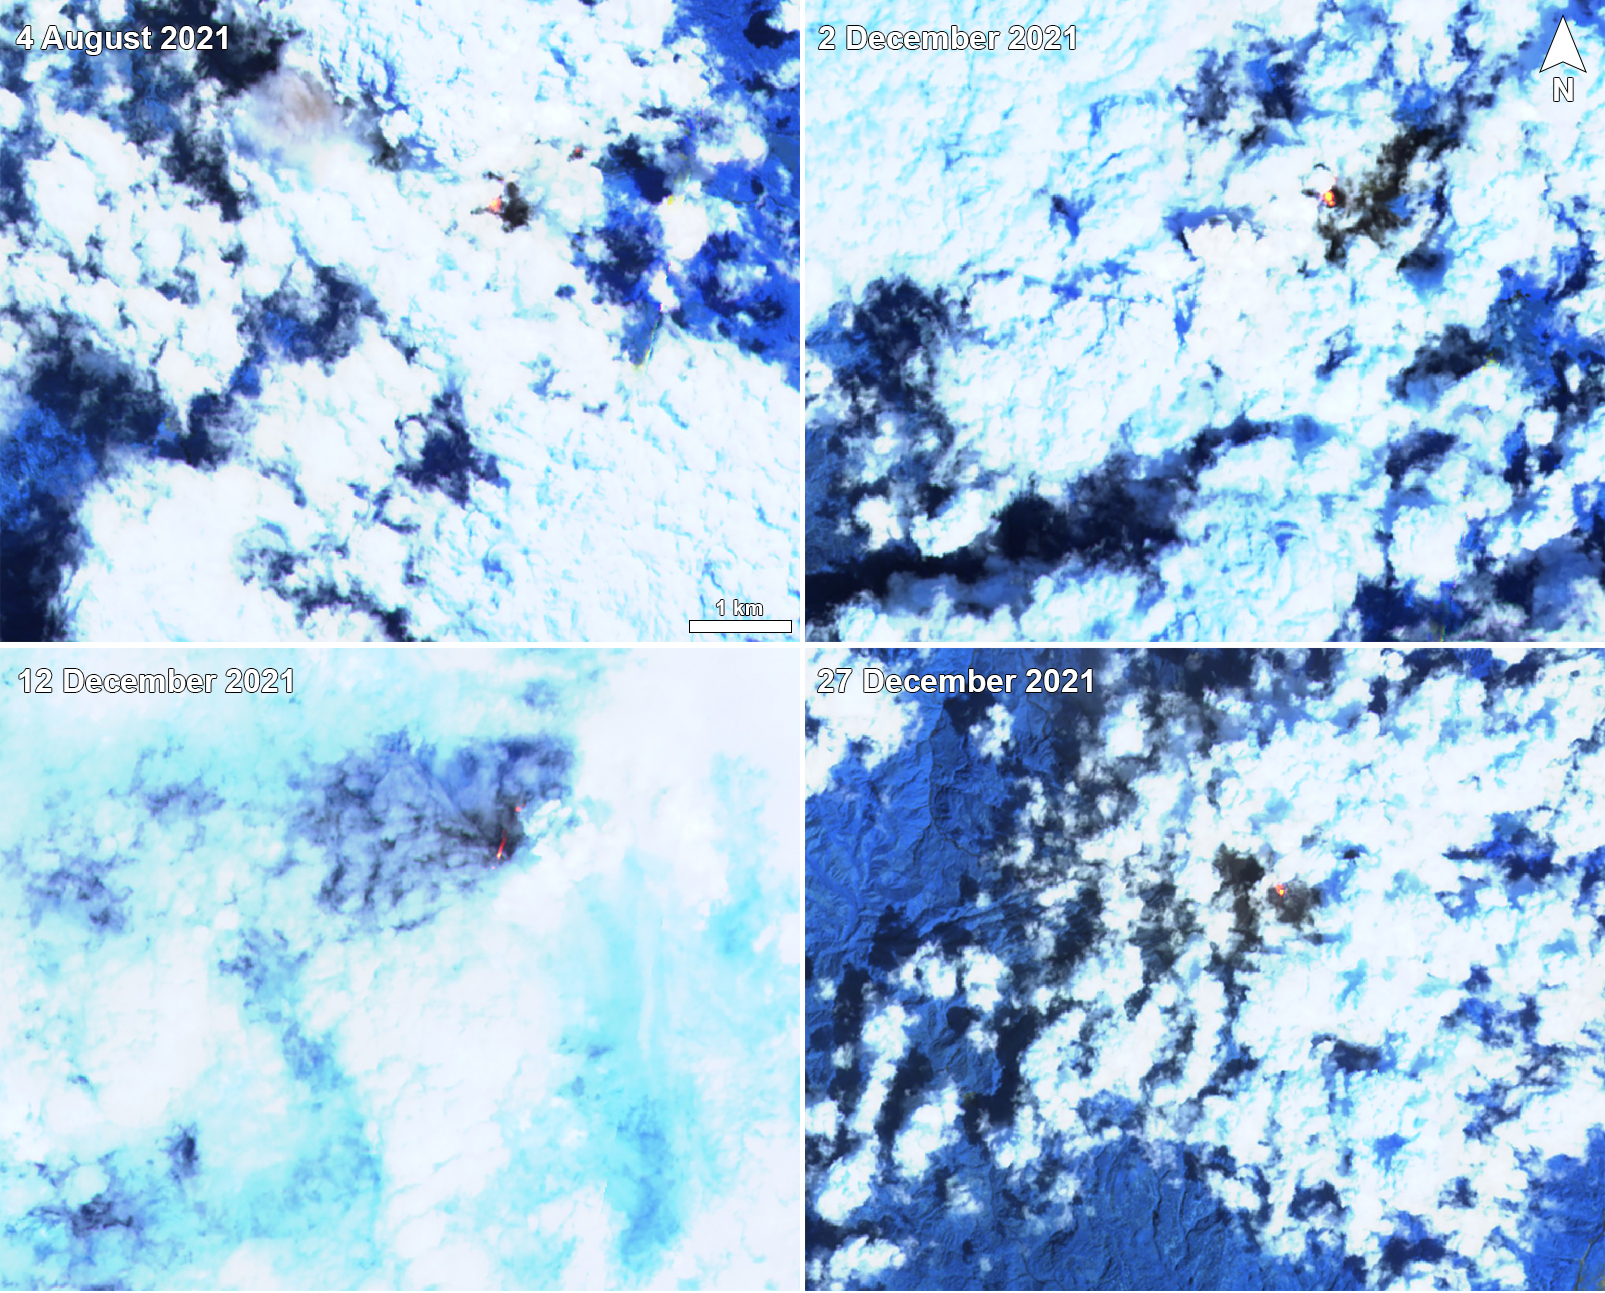 |
Figure 154. Sentinel-2 infrared satellite images of Reventador on 4 August (top left), 2 December (top right), 12 December (bottom left), and 27 December (bottom right) 2021 showing a strong thermal anomaly at the summit crater. On 12 December an incandescent block avalanche could be seen through the clouds descending the NE flank. Images with “Atmospheric penetration” (bands 12, 11, 8A) rendering. Courtesy of Sentinel Hub Playground. |
Information Contacts: Instituto Geofísico, Escuela Politécnica Nacional (IG-EPN), Casilla 17-01-2759, Quito, Ecuador (URL: http://www.igepn.edu.ec/); Washington Volcanic Ash Advisory Center (VAAC), Satellite Analysis Branch (SAB), NOAA/NESDIS OSPO, NOAA Science Center Room 401, 5200 Auth Rd, Camp Springs, MD 20746, USA (URL: www.ospo.noaa.gov/Products/atmosphere/vaac, archive at: http://www.ssd.noaa.gov/VAAC/archive.html); MIROVA (Middle InfraRed Observation of Volcanic Activity), a collaborative project between the Universities of Turin and Florence (Italy) supported by the Centre for Volcanic Risk of the Italian Civil Protection Department (URL: http://www.mirovaweb.it/); Hawai'i Institute of Geophysics and Planetology (HIGP) - MODVOLC Thermal Alerts System, School of Ocean and Earth Science and Technology (SOEST), Univ. of Hawai'i, 2525 Correa Road, Honolulu, HI 96822, USA (URL: http://modis.higp.hawaii.edu/); Sentinel Hub Playground (URL: https://www.sentinel-hub.com/explore/sentinel-playground).
Daily explosions, ash plumes, lava flows, and incandescent block avalanches during February-July 2022
Volcán El Reventador is located 100 km E of the main axis of active volcanoes in Ecuador, and has dated eruptions extending into the 16th century, characterized by explosive events and lava flows. The current eruption began in late July 2008 and has more recently consisted of daily explosions, ash plumes, incandescent block avalanches, and lava flows (BGVN 47:03). This report covers similar activity during February through July 2022, based on daily reports from Ecuador's Instituto Geofisico (IG-EPN), the Washington Volcano Ash Advisory Center (VAAC), and infrared satellite data.
During February through July 2022, IG-EPN reported daily explosions, gas-and-steam and ash plumes 400-1,900 m above the crater, and frequent crater incandescence, often accompanied by incandescent block avalanches and lava flows. The average number of explosions gradually increased since February, with the highest average numbers of explosions per day in June (57) and July (52) (table 15). At night and early morning, frequent crater incandescence was visible and block avalanches descended all flanks, occasionally accompanied by gas-and-steam and ash emissions. Occasional lava flows were reported traveling down the N, NE, and NW flanks.
Table 15. Monthly summary of explosions and plume heights recorded at Reventador from February through July 2022. Data courtesy of IG-EPN (February-July 2022 daily reports).
| Month | Average number of explosions per day | Max plume height above the crater rim (m) |
| Feb 2022 | 26 | 400-1,300 m |
| Mar 2022 | 29 | 500-1,300 |
| Apr 2022 | 36 | 500-1,600 |
| May 2022 | 36 | 600-1,900 |
| Jun 2022 | 57 | 400-1,900 |
| Jul 2022 | 52 | 500-1,600 |
The summit crater activity was often obscured by clouds during February. There were 4-160 daily explosive events, which generated gas-and-ash plumes that rose 400-1,300 m above the crater and drifted NW, W, SW, S, NE, and SE. Intermittent nighttime crater incandescence was observed in the upper part of the volcano. There were also 14-97 long period (LP) earthquakes and 3-30 emission tremors (signals indicating steam) detected. On 4 February an infrared image showed a lava flow descending the NE flank, which may have started earlier, but was not visible due to cloud coverage (figure 155). During 8-10 February incandescent block avalanches traveled down all flanks as far as 700 m below the crater, in addition to the active lava flow on the NW flank. During 17-18 February an incandescent avalanche of material descended 300 m on the S flank. During 21-22 February the number of daily explosions increased to 160 and 97 LP events were detected. Crater incandescence and the active flow on the NE flank persisted during 28 February-1 March.
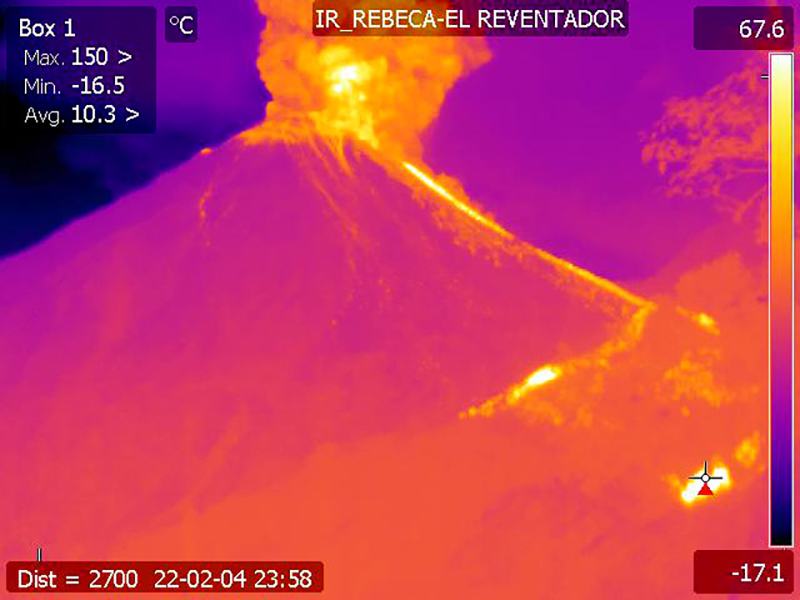 |
Figure 155. Webcam infrared image of Reventador showed crater incandescence, an ash plume, and a lava flow descending the NE flank on 4 February 2022. Courtesy of IG-EPN (INFORME DIARIO DEL VOLCAN REVENTADOR No. 2022-036, 05 de febrero de 2022). |
Similar activity was reported during March, with 3-68 daily explosions producing gas-and-ash plumes 500-1,300 m high that drifted in various directions. Intermittent nighttime incandescence was observed in the upper part of the volcano, though clouds would often cover clear views of the summit. LP-type events ranged from 23 to 80 and emission tremor events occurred 1-54 times. An incandescent block avalanche was reported during 2-3 March that traveled as far as 500 m down the W flank. A pyroclastic flow on 2 March descended the S and SE flanks (figure 156). On 5 March an incandescent lava flow moved 800 m down the SE flank. During 6-7 March a lava flow was reported on the NE flank and incandescent block avalanches descended the E flank 800 m below the crater. On 8 March the lava flow continued to be active down the NE flank, while at night in thermal images traces of pyroclastic material was visible in the E flank. During the morning of 9 March ashfall was reported by IG personnel. The emitted mass of sulfur dioxide was measured as 18.4 tons by the MOUNTS system on 10 March; during the next day 1,373 tons were detected by the MOUNTS system. At night during 10-11 March, incandescent block avalanches descended all flanks 400 m below the crater. On 24 March a lava flow was identified in a thermal image as it descended the NNE flank.
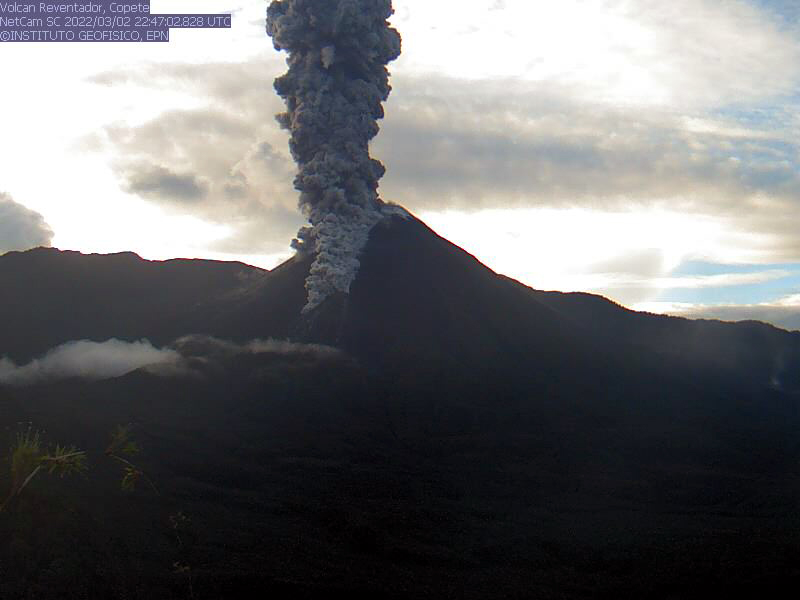 |
Figure 156. Webcam image showed an ash plume rising about 1 km above the crater from Reventador. A pyroclastic flow also accompanied this activity, which descended the S and SE flanks. Courtesy of IG-EPN (INFORME DIARIO DEL VOLCAN REVENTADOR No. 2022-062, 03 de marzo de 2022). |
During April, there were 9-72 daily explosions detected, which generated ash plumes 500-1,600 m above the crater that drifted in multiple directions. LP-type events continued and ranged from 25-87 each day. Emission tremor events occurred 5-59 times each day. Intermittent nighttime and early morning incandescence was also observed in the crater, although occasionally cloud cover prevented clear views of the summit. During 4-5 April incandescent block avalanches were observed descending up to 400 m on all flanks. On 9 April an infrared image showed an active lava flow descending the NE flank. Incandescent block avalanches continued to occur throughout the month, descending multiple flanks (figure 157). During 20-21 April incandescent block avalanches moved 500 m below the summit crater. On 23 April a strong ash plume rose higher than 600 m and drifted NE, NW, and W, according to IG-EPN (figure 158). There was no seismic data recorded during 25-31 April. During the night of 27-28 April incandescent block avalanches descended 400 m down all flanks of the volcano, and the next night descended to 600 m below the summit.
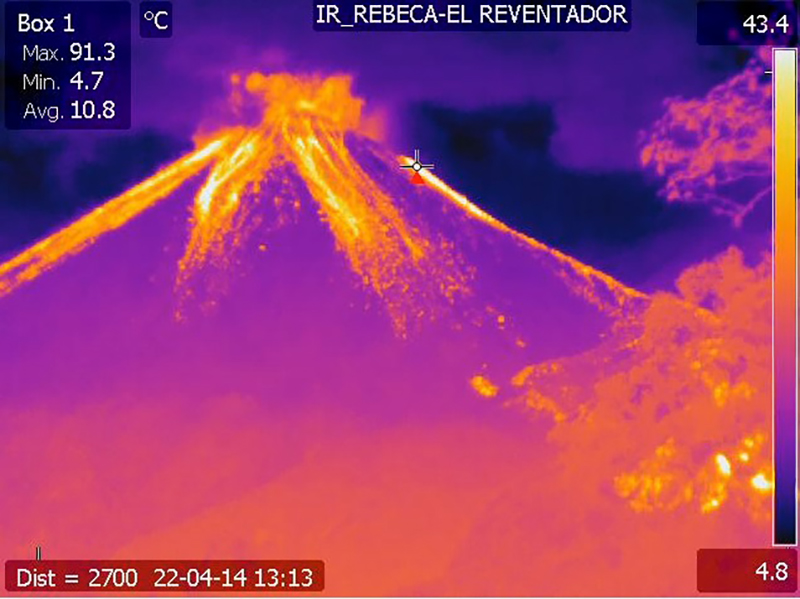 |
Figure 157. Webcam infrared image showed incandescent block avalanches descending all the flanks of Reventador on 14 April 2022. Courtesy of IG-EPN (INFORME DIARIO DEL VOLCAN REVENTADOR No. 2022-104, 14 de abril de 2022). |
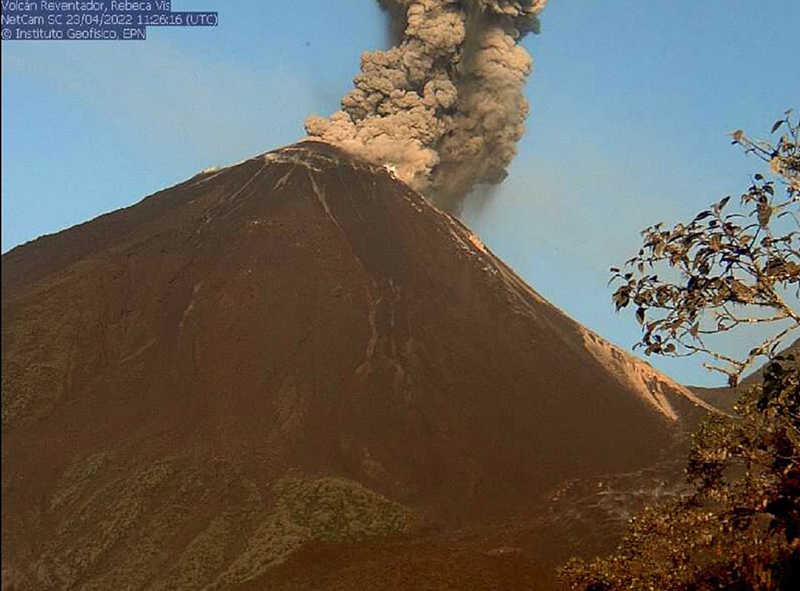 |
Figure 158. Webcam image of a strong ash plume drifting NE from Reventador on 23 April 2022. Courtesy of IG-EPN (INFORME DIARIO DEL VOLCAN REVENTADOR No. 2022-113, 23 de abril de 2022). |
Activity during May consisted of occasional nighttime crater incandescence. There were 10-79 daily explosions detected throughout the month, which produced gas-and-ash plumes that rose 600-1,900 m above the crater and drifted NW, W, NE, N, SW, and S. Intermittent nighttime crater incandescent persisted, though was not always visible due to cloud cover. There were 12-95 LP-type events and 3-25 tremor emission events detected daily. A lahar was detected during 3-4 May due to rainfall. During the night and early morning of 3-7 May incandescent block avalanches descended 400-600 m below the crater on all flanks. On 3 May the MOUNTS system recorded 50 tons of sulfur dioxide emissions. According to the Washington VAAC a gas-and-ash plume rose 1.9 km above the crater and drifted W during 5-6 May. On 9 May a new lava flow was observed in a thermal image that descended 600 m below the crater on the NE flank, which persisted at least through 19 May. IG-EPN reported lahars occurred due to rainfall during 15-16 May. On 29 May a strong ash plume rose 700-1,000 m above the crater and drifted NW (figure 159).
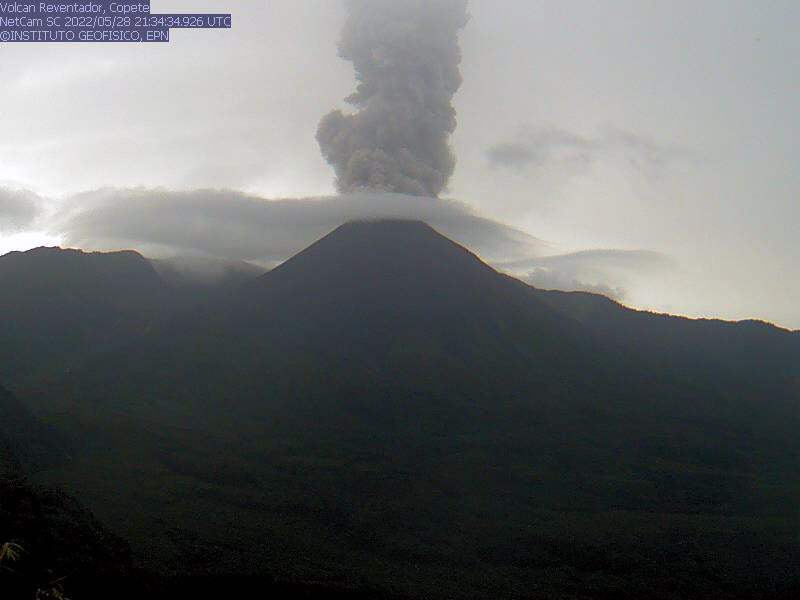 |
Figure 159. Webcam image of a strong ash plume drifting NW from Reventador on 28 May 2022. Courtesy of IG-EPN (INFORME DIARIO DEL VOLCAN REVENTADOR No. 2022-149, 29 de mayo de 2022). |
During June, 11-98 daily explosions produced gas-and-ash plumes that rose 388-1,900 m high and drifted W, SW, NW, NE, N, and SE. LP-type events continued at a rate of 37-102 per day and emission tremor events of 2-35 throughout the month. Nighttime and early morning incandescence was occasionally visible throughout the month, though sometimes clouds covered the summit. On 7 June incandescent material was observed descending all the flanks.
Similar activity persisted during July with 14-105 daily explosions. There were 22-104 LP-type events, and 2-31 emission tremor events detected each day throughout the month. Gas-and-ash plumes rose 500-1,600 m high and drifted W, NW, SW, S, NE (figure 160). Intermittent crater incandescence was reported during the night and early morning. On 1 July, crater incandescence was visible, accompanied by ash emissions up to 700 m high that drifted N on 1 July. Intermittent crater incandescence continued to be visible throughout the month. On 5 July an infrared image showed a new lava flow descending the N flank, which continued the next day down the NE flank. During 7-15 and 28-31 July IGP-EN reported an incandescent block avalanche descending all flanks for 300-600 m below the crater. During 13-14 July an incandescent avalanche descended the S flank and was accompanied by continuous gas-and-steam and ash emissions that rose 900 m high that drifted W. During 21-31 July a lava flow was reported descending the NE flank, though it remained confined to the upper part of the volcano.
 |
Figure 160. Webcam image of a strong ash plume rising from Reventador on 19 July 2022. Courtesy of IG-EPN (INFORME DIARIO DEL VOLCAN REVENTADOR No. 2022-200, 19 de julio de 2022). |
MIROVA (Middle InfraRed Observation of Volcanic Activity) analysis of MODIS satellite data showed intermittent thermal anomalies of varying intensity during February through July 2022, which was most likely represented by incandescent block avalanches and lava flows throughout that time (figure 161). In comparison, 13 thermal anomalies were detected by the MODVOLC thermal algorithm on 18 and 25 March, 10, 21, and 30 May, 6, 9, and 15 June, and 8 and 31 July. Although the summit was often obscured by clouds, Sentinel-2 infrared satellite images showed some of this incandescence at the summit and NE flanks (figure 162).
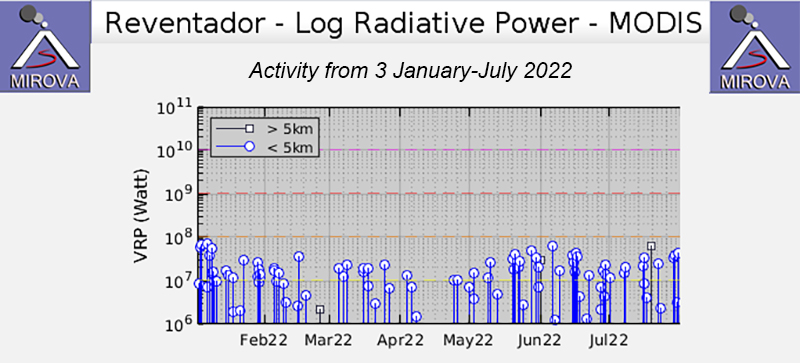 |
Figure 161. Intermittent thermal activity was detected at Reventador at varying levels during January through July 2022, based on this MIROVA graph (Log Radiative Power). A small cluster of anomalies were recorded during late May and mid-June. Courtesy of MIROVA. |
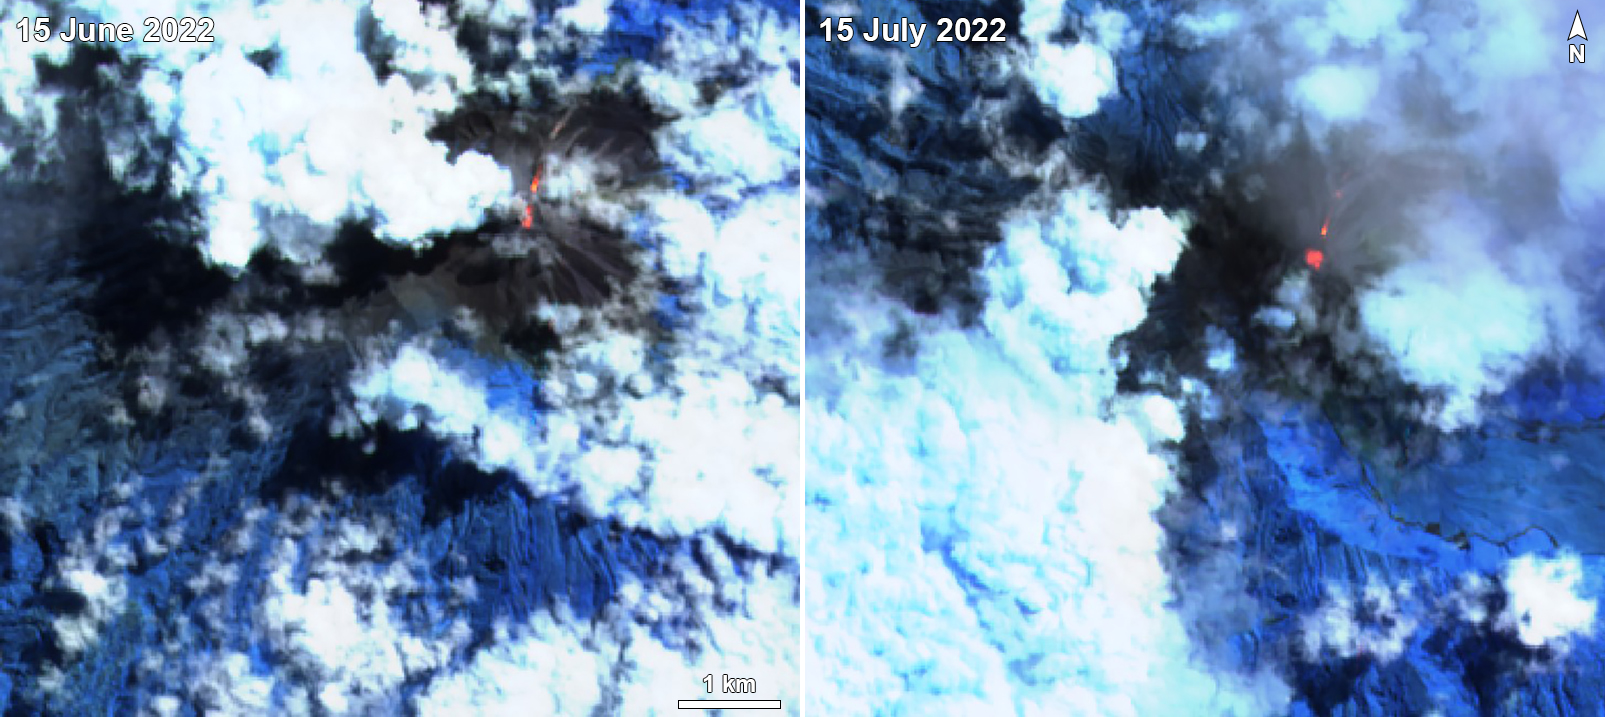 |
Figure 162. Sentinel-2 infrared satellite images of Reventador on 15 June and July (left and right, respectively) showing a small thermal anomaly at the summit crater and on the NE flank. Images with “Atmospheric penetration” (bands 12, 11, 8A) rendering. Courtesy of Sentinel Hub Playground. |
Information Contacts: Instituto Geofísico, Escuela Politécnica Nacional (IG-EPN), Casilla 17-01-2759, Quito, Ecuador (URL: http://www.igepn.edu.ec/); Washington Volcanic Ash Advisory Center (VAAC), Satellite Analysis Branch (SAB), NOAA/NESDIS OSPO, NOAA Science Center Room 401, 5200 Auth Rd, Camp Springs, MD 20746, USA (URL: www.ospo.noaa.gov/Products/atmosphere/vaac, archive at: http://www.ssd.noaa.gov/VAAC/archive.html); MIROVA (Middle InfraRed Observation of Volcanic Activity), a collaborative project between the Universities of Turin and Florence (Italy) supported by the Centre for Volcanic Risk of the Italian Civil Protection Department (URL: http://www.mirovaweb.it/); Hawai'i Institute of Geophysics and Planetology (HIGP) - MODVOLC Thermal Alerts System, School of Ocean and Earth Science and Technology (SOEST), Univ. of Hawai'i, 2525 Correa Road, Honolulu, HI 96822, USA (URL: http://modis.higp.hawaii.edu/); Sentinel Hub Playground (URL: https://www.sentinel-hub.com/explore/sentinel-playground).
Daily explosions, ash plumes, lava flows, and block avalanches during August-November 2022
Volcán El Reventador, located in Ecuador, includes a 4-km-wide avalanche scarp open to the E. Recorded eruptions date back to the 16th century and have been characterized by explosive events, lava flows, ash plumes, and lahars. Frequent lahars in this region of heavy rainfall have built deposits on the scarp slope. The largest recorded eruption took place in 2002, producing a 17-km-high eruption column, pyroclastic flows that traveled up to 8 km, and lava flows from summit and flank vents. The current eruption began in July 2008 and more recently has consisted of frequent explosions, ash plumes, lava flows, and incandescent block avalanches (BGVN 47:09). This report covers similar activity of daily explosions, ash plumes, and incandescent block avalanches during August through November 2022 using daily reports from Ecuador's Instituto Geofisico (IG-EPN), the Washington Volcano Ash Advisory Center (VAAC), and satellite data.
During August through November 2022, IG-EPN reported daily explosions, gas-and-steam and ash plumes rising 300-1,500 m above the crater, and frequent crater incandescence, often accompanied by incandescent block avalanches and lava flows that traveled down the NE, E, and SE flanks. On average, there were more explosions detected during August through September compared to October through November.
Table 16. Monthly summary of explosions and plume heights recorded at Reventador from February through November 2022. Data courtesy of IG-EPN (August-November 2022 daily reports).
| Month | Average number of explosions per day | Max plume height above the crater rim (m) |
| Aug 2022 | 41 | 400-1,200 |
| Sep 2022 | 40 | 600-1,500 |
| Oct 2022 | 27 | 300-1,200 |
| Nov 2022 | 30 | 500-1,500 |
Activity during August consisted of explosions, ash plumes, crater incandescence, and avalanches of material, though cloudy weather sometimes obscured views of the summit. There were 16-65 daily explosive events, which generated ash emissions that rose 400-1,200 m above the summit and drifted NW, W, WSW, SW, and N (figure 163). The Washington VAAC reported that ash plumes rose 688-2,800 m above the summit and drifted W, NW, and SW. Frequent nighttime crater incandescence was observed at the summit. There were 20-87 long period (LP) earthquakes and 1-30 emission tremors (signals indicating steam) detected. A continuing active lava flow moving NE was reported during 2-4 August. During 3-4 and 6-8 August incandescent block avalanches descended 500-700 m from the crater. During the nights of 11-13 August incandescent block avalanches rolled as far as 400 m from the crater on all flanks. Incandescent avalanches traveled 600 m on the NW flank during 15-16 August. Incandescent material was observed on all flanks during the morning of 22 August as far as 500 m from the crater. During the night and early morning of 24-25 August crater incandescence was accompanied by a block avalanche along the NE flank extending 500 m from the crater. On 25 August an ash plume rose 300 m above the crater and drifted NW. During 28-29 August crater incandescence and an incandescent avalanche was observed moving 600 m from the crater on all flanks.
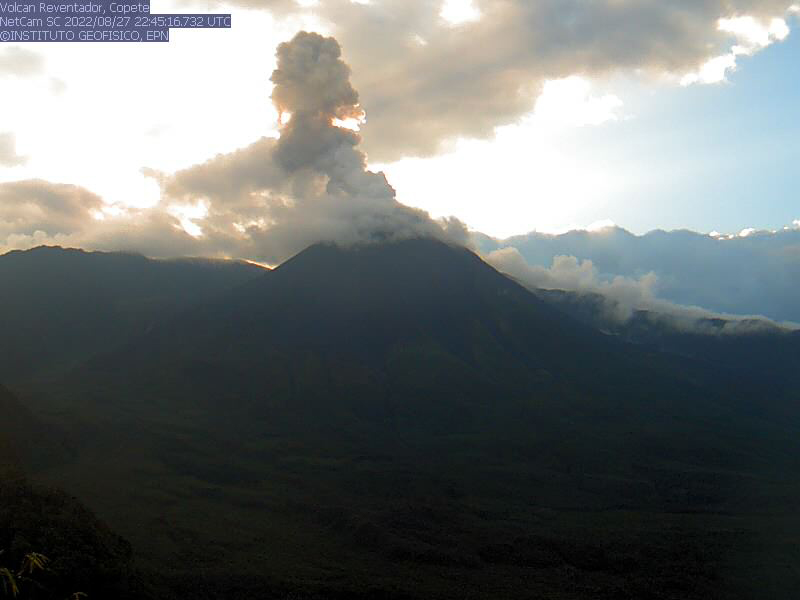 |
Figure 163. Webcam image of a strong ash plume rising 1 km above the crater of Reventador on 27 August 2022 at 1745. Courtesy of IG-EPN (INFORME DIARIO DEL VOLCAN REVENTADOR No. 2022-240, 28 de agosto de 2022). |
Similar activity was reported during September, with 18-79 daily explosions producing gas-and-ash plumes 600-1,500 m above the crater that drifted W, NW, N, SW, and NE. Nighttime crater incandescence was often observed. There were 17-92 LP earthquakes and 1-22 emission tremors detected during the month. During 31 August-2 September incandescent blocks rolled 500-600 m from the crater; during 2-3 September the blocks moved down the NE flank. According to the Washington VAAC, ash plumes rose 688-1,700 m above the crater and drifted W, NW, N, NE, and SW. Incandescent block avalanches were reported on all flanks during 4-5, 14-15, 17-19, 21-23, and 25-28 September moving 400-800 m from the crater. During 7-8 September incandescent block avalanches on the S flank rolled as far as 500 m from the crater. On 19 September an incandescent block avalanche descended 600 m on the NE flank and on 20 September an incandescent block avalanche descended 800 m on the E and ESE flank. During 22-25 September IG-EPN reported that the active lava flow on the NE flank persisted (figure 164). An incandescent block avalanche on the SE flank reached 600 m from the crater during 29-30 September.
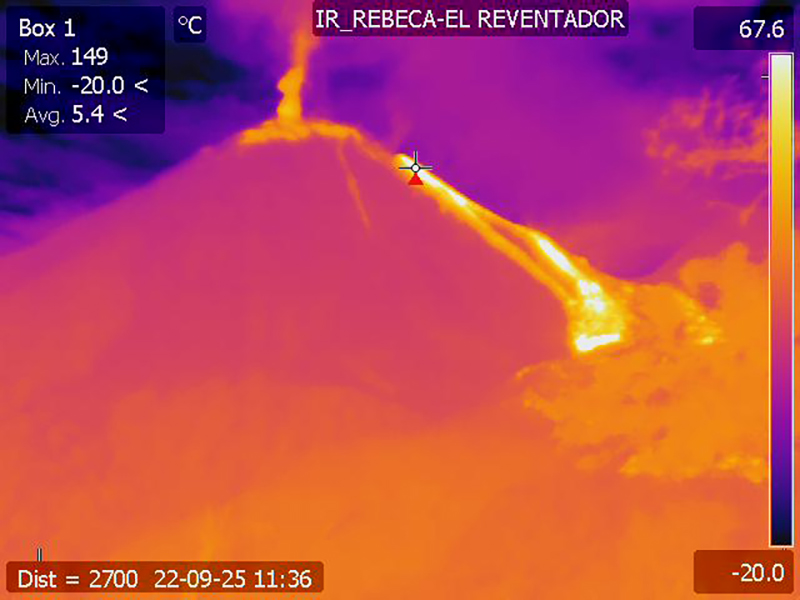 |
Figure 164. Thermal camera image showing the active lava flow (bright yellow) at Reventador descending the NE flank at 0636 on 25 September 2022. Courtesy of IG-EPN (INFORME DIARIO DEL VOLCAN REVENTADOR No. 2022-268, 25 de septiembre de 2022). |
During October, there were 7-66 daily explosions detected, generating gas-and-ash plumes that rose 300-1,200 m above the crater and drifted N, W, NW, SW, NE (figure 165). There were 2-157 LP earthquakes and 3-25 emission tremors detected throughout the month. Nighttime crater incandescence was often visible throughout the month. The Washington VAAC reported that ash plumes rose 988-2,500 m above the crater and drifted in multiple different directions. Based on data from a thermal camera, IG-EPN reported on 1-6, 10-11, 13-18, 22-27 October that the lava flow on the NE flank remained active. During 8-9 October a lava flow was observed along the E flank. Incandescent block avalanches were observed during 15-17 October that rolled 400-700 m below the crater on all flanks.
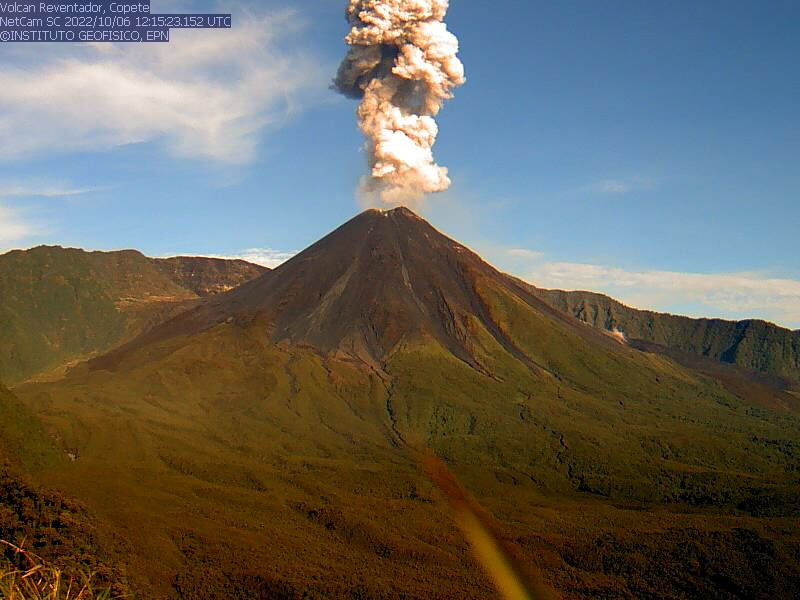 |
Figure 165. Webcam image showing an ash plume rising 1 km above the crater at Reventador on 6 October 2022 at 0715. Some incandescent material was also visible on the right flank of the volcano. Courtesy of IG-EPN (INFORME DIARIO DEL VOLCAN REVENTADOR No. 2022-279, 06 de octubre de 2022). |
Activity continued during November, with 18-60 daily explosions producing gas-and-ash plumes that rose 500-1,500 m above the crater (figure 166) and drifted in several directions, though cloudy weather often obscured clear views. Overall, there were 22-87 LP earthquakes and 2-19 emission tremors detected during the month. Crater incandescence was often visible during nights and early mornings. According to notices from the Washington VAAC, ash plumes rose 688-2,200 m above the crater and drifted in different directions. The lava flow on the NE flank remained active during 1-2, 8-10, 15, 18-20 November. During 6-7 November crater incandescence was accompanied by incandescent block avalanches descending all the flanks and an active lava flow on the SE flank. On 9 November an incandescence avalanche was reported on the N flank. On 10 and 17 November incandescent material was reported on all flanks moving as far as 500-800 m from the crater.
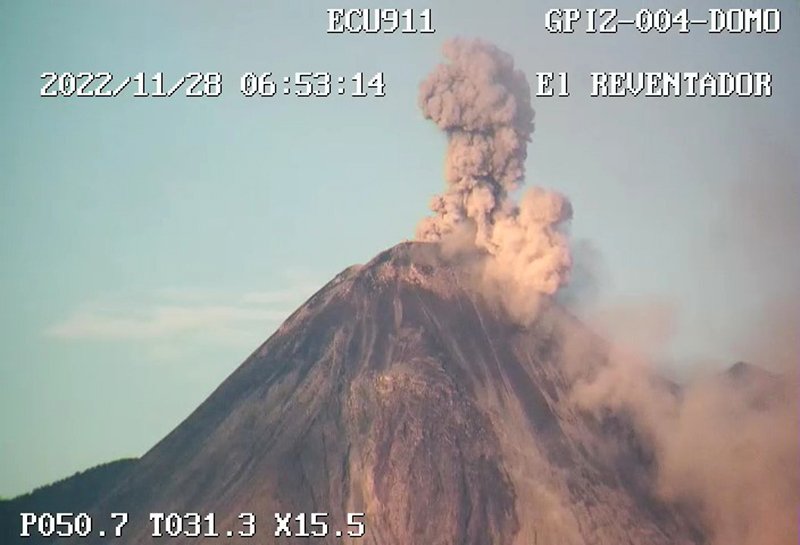 |
Figure 166. Webcam image of an ash plume rising 1 km above the summit crater of Reventador on 28 November 2022 at 0653. Courtesy of IG-EPN (INFORME DIARIO DEL VOLCAN REVENTADOR No. 2022-332, 28 de noviembre de 2022). |
Additional satellite data. MIROVA (Middle InfraRed Observation of Volcanic Activity) analysis of MODIS satellite data showed intermittent moderate thermal anomalies throughout the reporting period (figure 167), which was most likely caused by the frequent incandescent block avalanches and lava flows that were visible on multiple flanks. Additionally, the MODVOLC system identified a total of 20 thermal hotspots on 14, 16, 24, and 28 August, 23, 24, and 28 September, 2, 9, and 10 October, and 5, 6, and 22 November. Although the summit was often obscured by clouds, Sentinel-2 infrared satellite images also showed some thermal activity in the crater (figure 168). Using Sentinel-5P TROPOMI data processed by the MOUNTS (Monitoring Unrest From Space) system, and the DOAS (Differential Optical Absorption Spectroscopy) network, IG-EPN noted that the greatest volume of sulfur dioxide emissions was measured on 19 November, with 2,033 tons. Other sulfur dioxide measurements ranged from 0.1 to 824 tons.
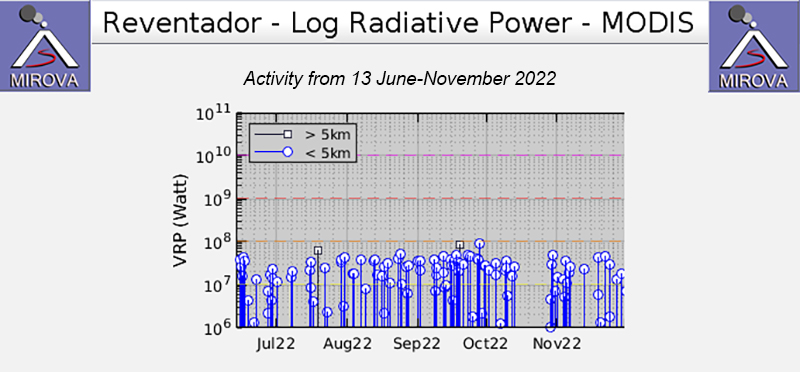 |
Figure 167. Intermittent moderate thermal activity was detected at Reventador during July through November 2022, based on this MIROVA graph (Log Radiative Power). There was a short pause in activity during mid-to-late October. Courtesy of MIROVA. |
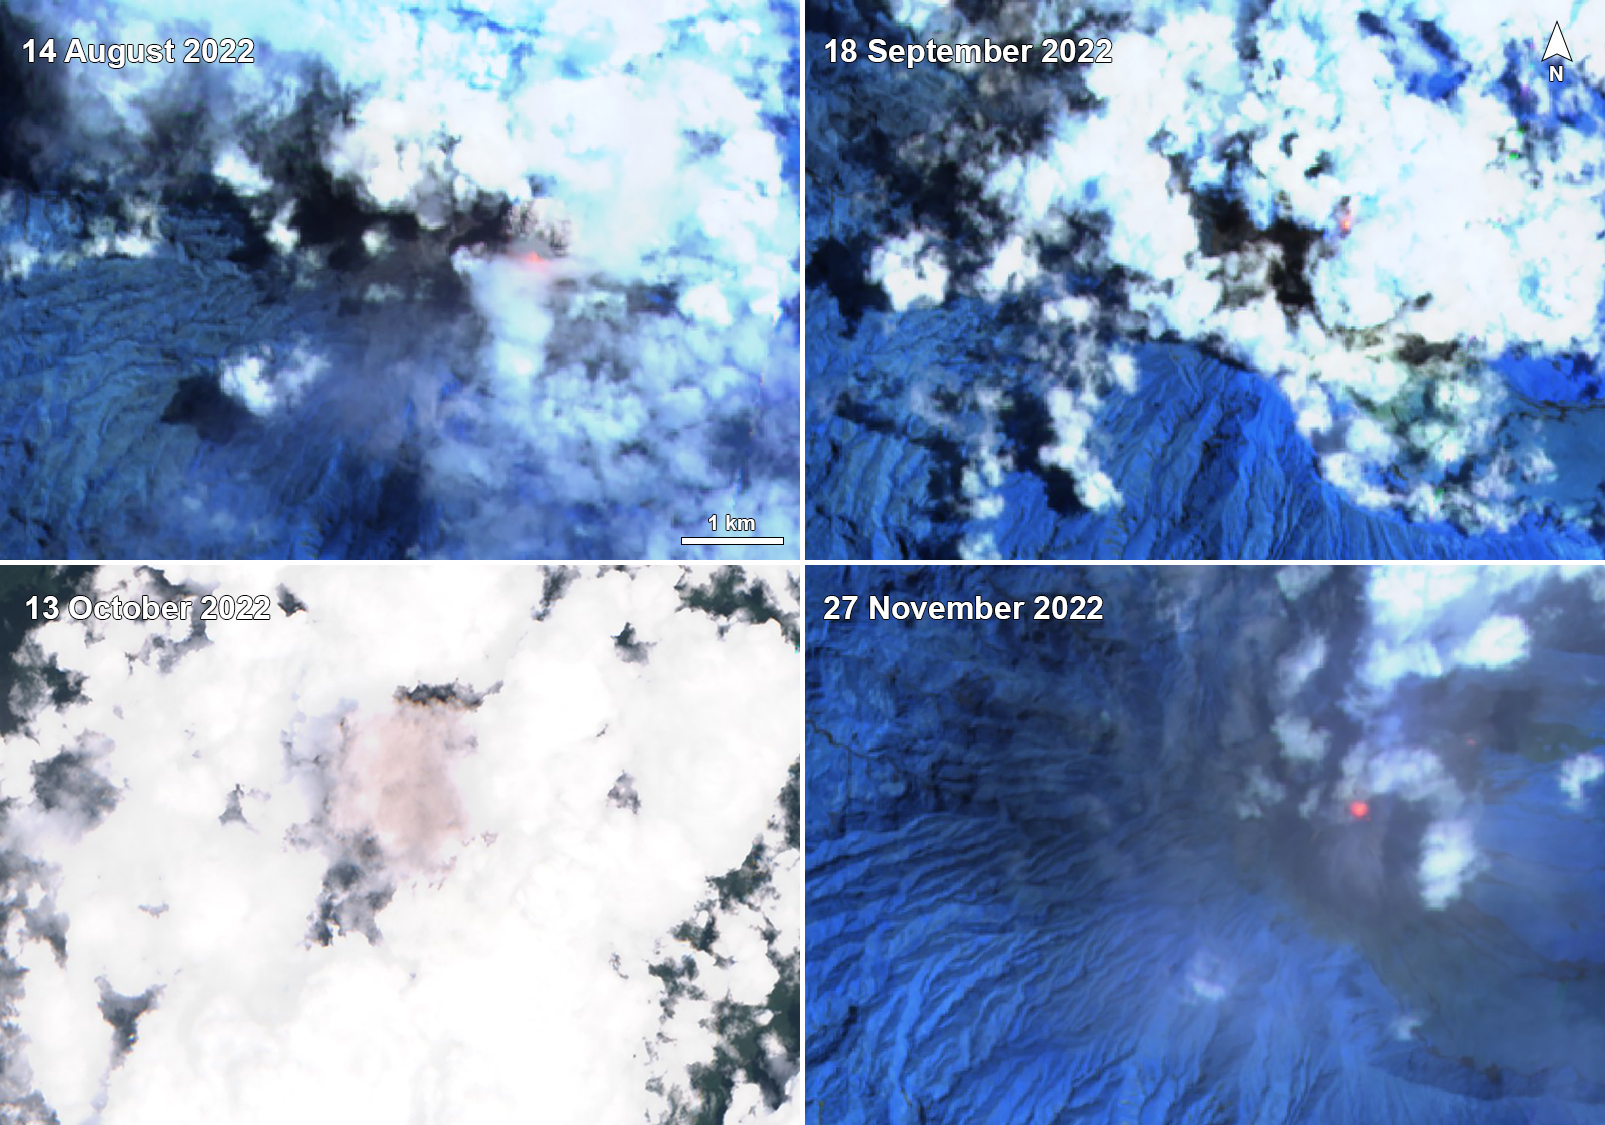 |
Figure 168. Sentinel-2 infrared satellite images of Reventador showing a small thermal anomaly at the summit crater on 14 August 2022 (top left), 18 September 2022 (top right), and 27 November 2022 (bottom right). Weather clouds often prevented clear views of the summit. On 13 October 2022 (bottom left), a faint gray plume was also visible in natural color satellite imagery. Images with “Atmospheric penetration” (bands 12, 11, 8A) rendering and “Natural Color” rendering (bands 4, 3, 2). Courtesy of Sentinel Hub Playground. |
Information Contacts: Instituto Geofísico, Escuela Politécnica Nacional (IG-EPN), Casilla 17-01-2759, Quito, Ecuador (URL: http://www.igepn.edu.ec/); MIROVA (Middle InfraRed Observation of Volcanic Activity), a collaborative project between the Universities of Turin and Florence (Italy) supported by the Centre for Volcanic Risk of the Italian Civil Protection Department (URL: http://www.mirovaweb.it/); Hawai'i Institute of Geophysics and Planetology (HIGP) - MODVOLC Thermal Alerts System, School of Ocean and Earth Science and Technology (SOEST), Univ. of Hawai'i, 2525 Correa Road, Honolulu, HI 96822, USA (URL: http://modis.higp.hawaii.edu/); Sentinel Hub Playground (URL: https://www.sentinel-hub.com/explore/sentinel-playground); MOUNTS Project (Monitoring Unrest From Space), an operational monitoring system for volcanoes using Sentinel satellite data from ESA's Copernicus, Open Access Hub, hosted at UNAM and CT TU-Berlin (URL: http://www.mounts-project.com/home).
Daily explosions, gas-and-ash emissions, crater incandescence, and block avalanches during December 2022-March 2023
Volcán El Reventador, located in Ecuador, includes a 4-km-wide avalanche scarp open to the E. Recorded eruptions date back to the 16th century and have been characterized by explosive events, lava flows, ash plumes, and lahars. Frequent lahars in this region of heavy rainfall have built deposits on the scarp slope. The largest recorded eruption took place in 2002, producing a 17-km-high eruption column, pyroclastic flows that traveled up to 8 km, and lava flows from summit and flank vents. The current eruption began in July 2008 and more recently has consisted of daily explosions, ash plumes, lava flows, and block avalanches (BGVN 48:02). This report covers similar activity during December 2022 through March 2023 using daily reports from Ecuador's Instituto Geofisico (IG-EPN), the Washington Volcano Ash Advisory Center (VAAC), and satellite data.
During December 2022 through March 2023, IG-EPN reported daily explosions, gas-and-steam and ash plumes rising as high as 1,100 m above the crater, and frequent crater incandescence, often accompanied by incandescent block avalanches and lava flows that traveled down each of the flanks and lava flows that generally affected the NE and E flanks. On average, there were more daily explosions detected during December 2022 compared to January through March 2023, with 57 per day (table 17).
Table 17. Monthly summary of explosions and plume heights recorded at Reventador from December 2022 through March 2023. Data courtesy of IG-EPN (December 2022-March 2023 daily reports).
| Month | Average number of explosions per day | Max plume height above the crater rim (m) |
| Dec 2022 | 57 | 1,000 |
| Jan 2023 | 43 | 1,000 |
| Feb 2023 | 30 | 1,000 |
| Mar 2023 | 33 | 1,100 |
Activity during December 2022 consisted of daily explosions, ash plumes, crater incandescence, a lava flow, and occasional block avalanches, though cloudy weather often obscured clear views of the summit. There were 0-114 explosions recorded each day, in addition to long-period (LP) events and tremor emissions (TREMI). The Washington VAAC reported ash emissions that rose as high as 1.9 km above the crater during 5-6 and 12-13 December and drifted in different directions. IG-EPN also noted that gas-and-ash emissions rose 400-1,000 m above the summit and drifted S, W, NW, W, N, SW (figure 169). A lava flow was observed on the NE flank during 2-6 December and on the E flank during 9-11 December. There were six volcano-tectonic (VT) events detected during 7-8 December. Block avalanches frequently affected one, or multiple flanks, traveling 400-700 m below the crater. During 11-12 December a lava flow was reported on the NE flank.
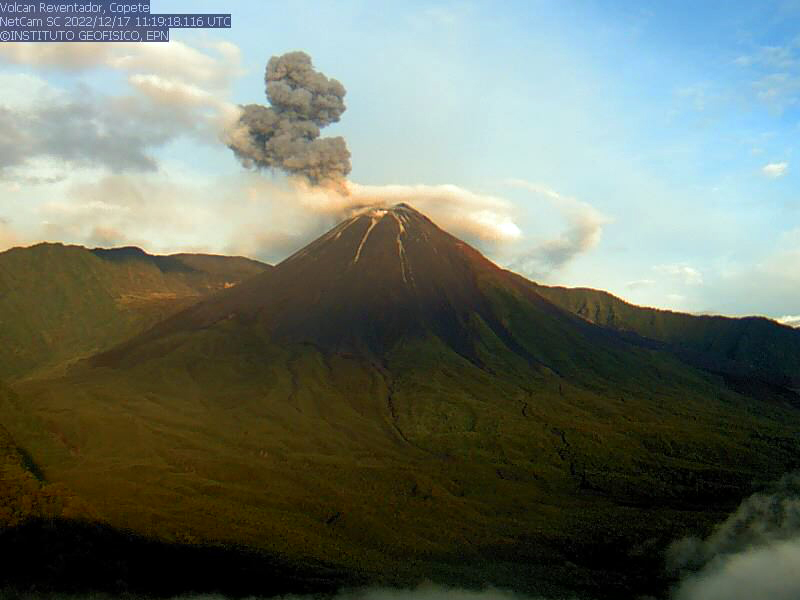 |
Figure 169. Webcam image of an ash plume rising 800 m above the crater of Reventador on 17 December 2022, accompanied by block avalanches on the flanks. Courtesy of IG-EPN (INFORME DIARIO DEL VOLCAN REVENTADOR No. 2022-351, 17 de diciembre de 2022). |
Daily explosions and ash plumes continued during January 2023, with 12-96 explosions recorded each day. LP and TREMI-type events and crater incandescence were also frequently recorded on clear weather days, cloudy weather often obscured views of the summit. Gas-and-ash emissions rose 500-1,000 m above the crater and drifted W, NW, SW, N, and S. According to the Washington VAAC, ash emissions rose 688-3,750 m above the crater and drifted in multiple directions. During 31 December 2022 through 1 January 2023 nighttime crater incandescence was accompanied by block avalanches 500 m below the crater on all flanks. The lava flow continued to be observed on the NE flank during 31 December 2022 as well as during 1, 5-6, 7-9, 10-11, 16-17, 18-20, and 23-26 January. Block avalanches traveled 500-700 m from the crater throughout the month, affecting one or multiple flanks (figure 170). An ash plume was reported on 15 January that drifted S. A pyroclastic flow occurred during the morning of 29 January on the N flank.
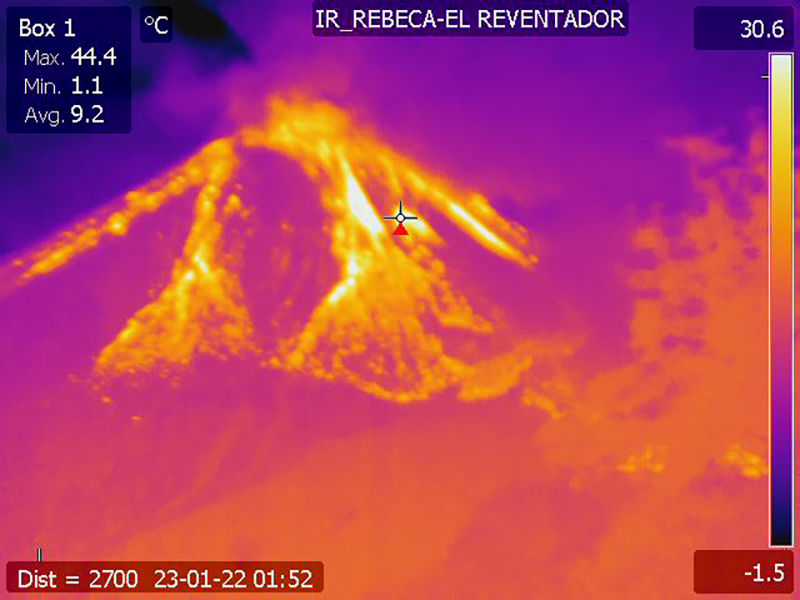 |
Figure 170. Thermal camera image showing the incandescent block avalanches (bright yellow) descending multiple flanks of Reventador on 22 January 2023. Courtesy of IG-EPN (INFORME DIARIO DEL VOLCAN REVENTADOR No. 2023-022, 22 de enero de 2023). |
During February there were 12-100 daily explosions detected, along with LP and TREMI-type events. Crater incandescence persisted, in addition to block avalanches. Gas-and-ash emissions rose 200-1,000 m above the crater and drifted W, NW, NE, and N (figure 171). The Washington VAAC reported that ash emissions rose 400-2,200 m above the crater and drifted NE, NW, W, SW, SE, and N. During 1-6, 13-17, and 21-26 February incandescent block avalanches descended all the flanks 600-900 m below the crater. An active lava flow continued down the NE flank during 8-10, 14-15, 18-19, and 20-21 February. Block avalanches descended the E flank 900 m below the crater during 10-11 February. There were three VT-type events that were detected on 24 February.
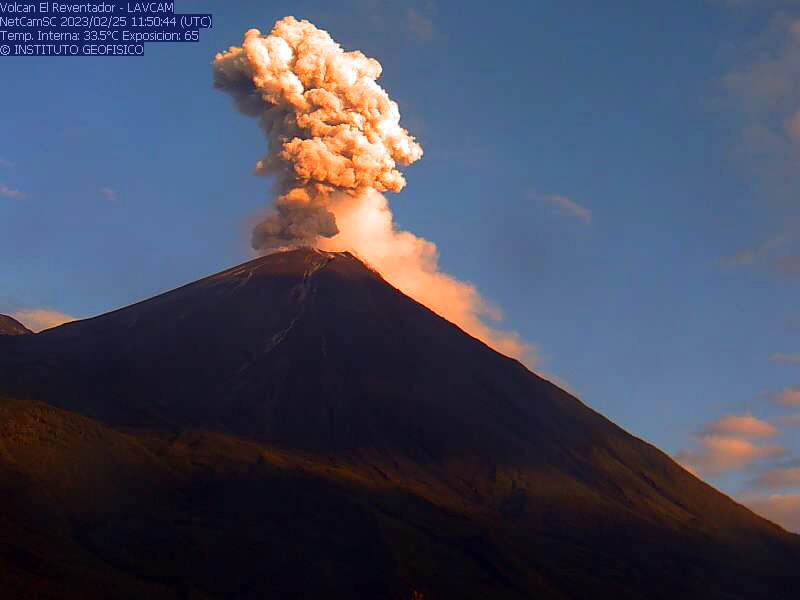 |
Figure 171. Webcam image of a gas-and-ash plume rising 1,000 m above the crater of Reventador on 25 February 2023. Photo has been color corrected. Courtesy of IG-EPN (INFORME DIARIO DEL VOLCAN REVENTADOR No. 2023-056, 25 de febrero de 2023). |
Daily explosions, LP and TREMI-type events, crater incandescence, and block avalanches continued during March. There were 20-52 daily explosions recorded during the month. Cloudy weather often prevented clear views of the summit. Gas-and-ash emissions rose 600-1,100 m above the crater and drifted NW, W, N, NE, E, S, and SE. According to the Washington VAAC, ash emissions rose 688-1,300 m above the crater and drifted NW, W, NE, E, and SE. Block avalanches traveled down all the flanks 400-700 m below the crater during 2-3, 5-6, 8-12, 14-17, 23-24, and 30-31 March. During 6-7 March block avalanches descended all the flanks as far as 900 m below the crater, accompanied by ash emissions that rose 1,000 m above the summit that drifted W. IG-EPN reported that a lahar was detected on 6 March. During the nights of 12 and 15 March incandescent blocks moved down the S flank 400-500 m below the crater. During 20-21 March ash emissions rose 1 km above the crater and drifted S and SE (figure 172); reports from the Secretaría de Gestión de Riesgos (SGR) reported that light ashfall was observed in San Carlos and San Luis.
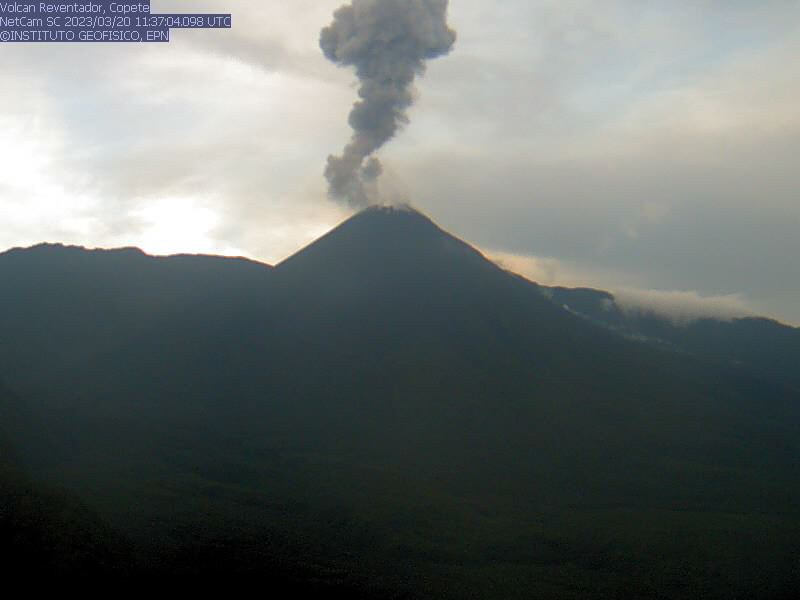 |
Figure 172. Webcam image of a gas-and-ash plume rising Reventador on 20 March 2023. Courtesy of IG-EPN (INFORME DIARIO DEL VOLCAN REVENTADOR No. 2023-079, 20 de marzo de 2023). |
Additional satellite data. MIROVA (Middle InfraRed Observation of Volcanic Activity) analysis of MODIS satellite data showed frequent thermal anomalies of moderate power during December 2022 through mid-January 2023, followed by a break in detected activity through late February (figure 173). During March, eight anomalies were detected intermittently throughout the month. The MODVOLC system identified a total of two thermal hotspots on 6 December 2022 and 20 March 2023. Although the summit was often obscured by weather clouds, Sentinel-2 infrared satellite images sometimes showed thermal activity at the summit crater (figure 174).
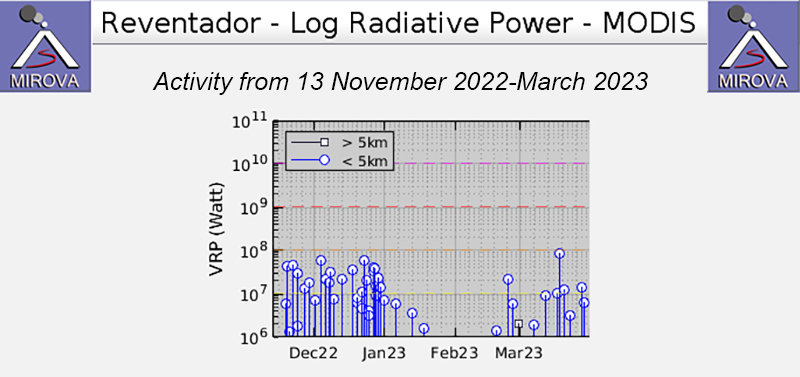 |
Figure 173. Thermal activity at Reventador was more frequent during December 2022 through mid-January 2023, based on this MIROVA graph (Log Radiative Power). There was a short pause in detected activity during mid-January through late February. There were three anomalies detected during late February and eight during March. Courtesy of MIROVA. |
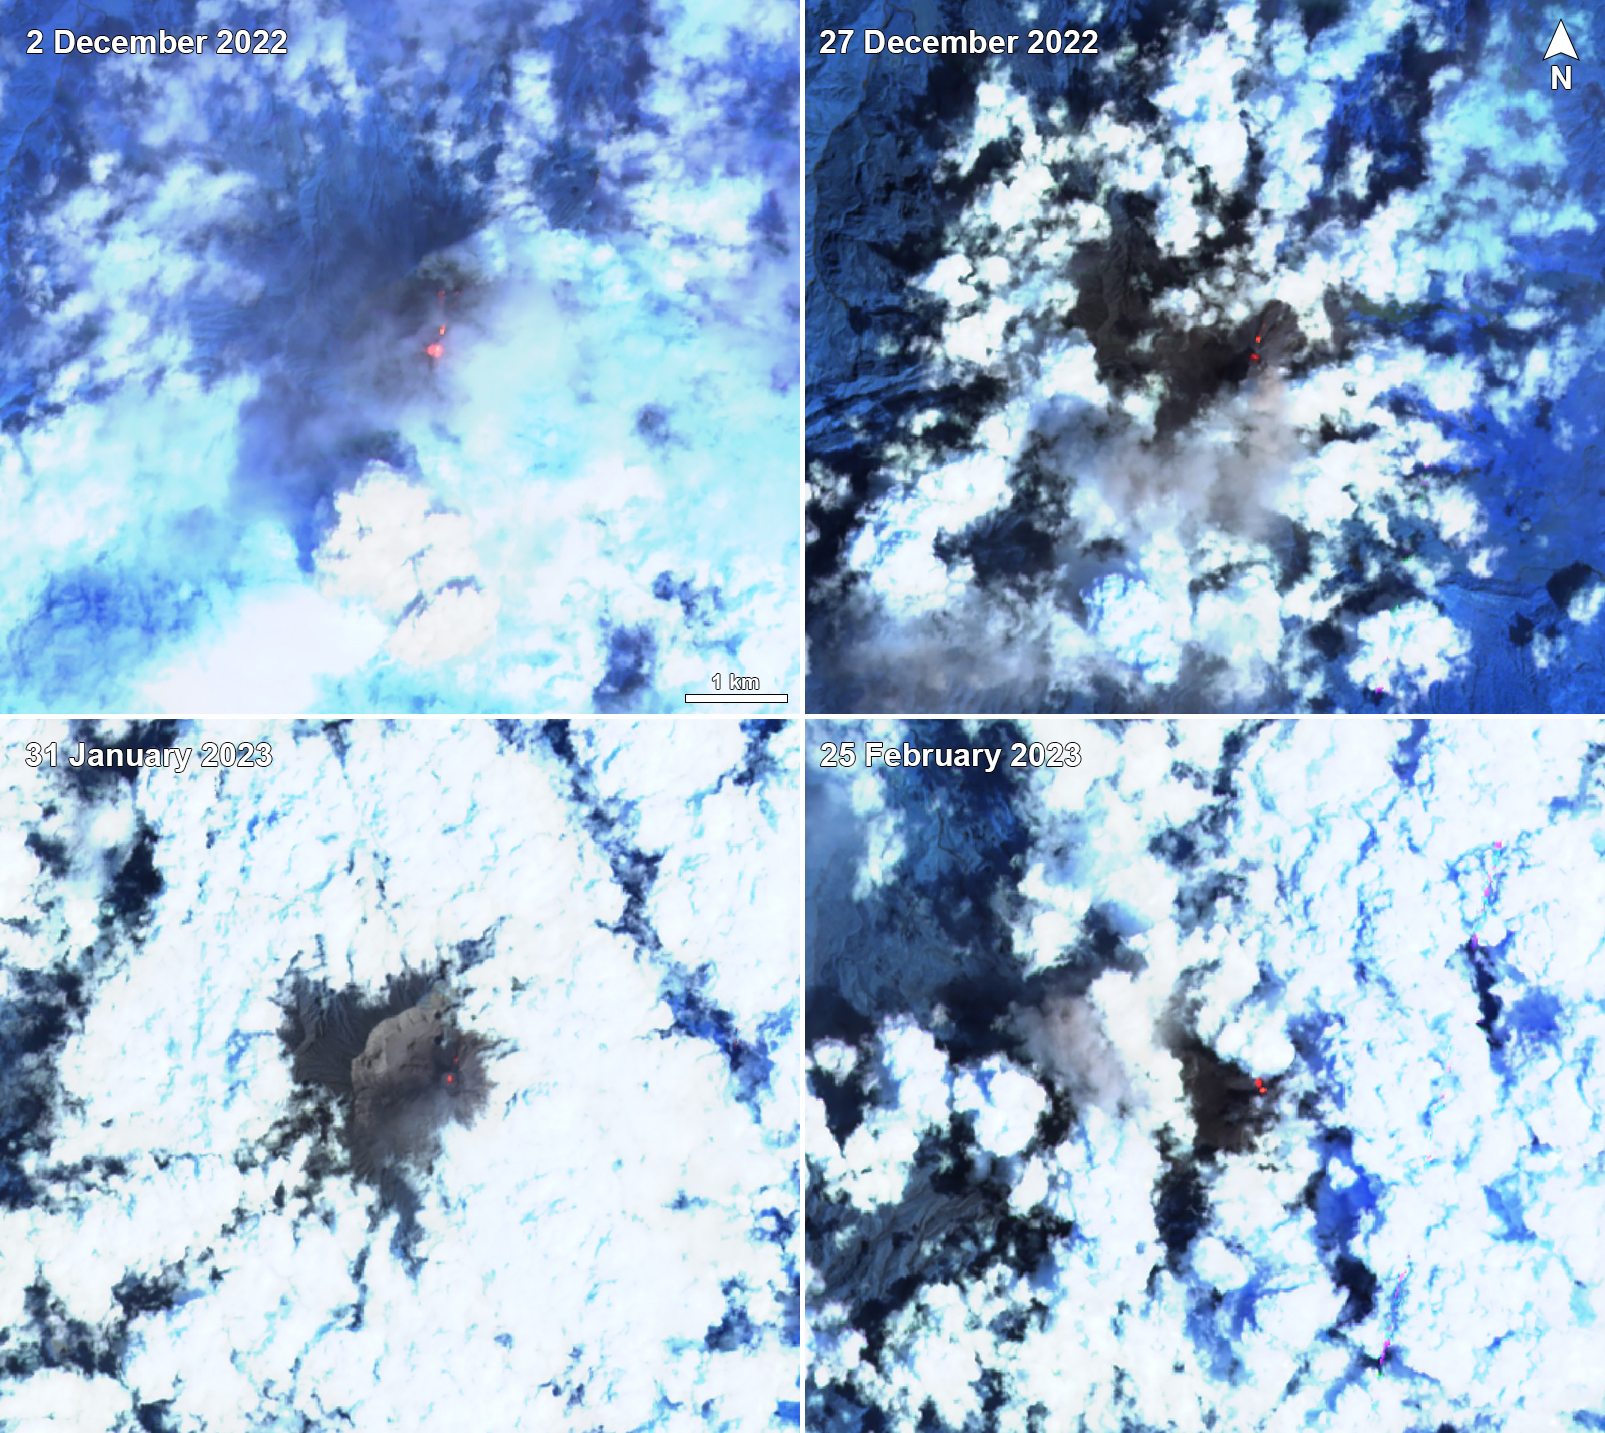 |
Figure 174. Sentinel-2 infrared satellite images of Reventador showed small thermal anomalies at the summit crater on 2 December 2022 (top left), 27 December 2022 (top right), 31 January 2023 (bottom left), and 25 February 2023 (bottom right). Though weather clouds often prevented clear views of the summit, gray ash emissions were sometimes visible above the clouds, as shown on 27 December and 25 February. Images with “Atmospheric penetration” (bands 12, 11, 8A) rendering. Courtesy of Sentinel Hub Playground. |
Information Contacts: Instituto Geofísico, Escuela Politécnica Nacional (IG-EPN), Casilla 17-01-2759, Quito, Ecuador (URL: http://www.igepn.edu.ec/); MIROVA (Middle InfraRed Observation of Volcanic Activity), a collaborative project between the Universities of Turin and Florence (Italy) supported by the Centre for Volcanic Risk of the Italian Civil Protection Department (URL: http://www.mirovaweb.it/); Hawai'i Institute of Geophysics and Planetology (HIGP) - MODVOLC Thermal Alerts System, School of Ocean and Earth Science and Technology (SOEST), Univ. of Hawai'i, 2525 Correa Road, Honolulu, HI 96822, USA (URL: http://modis.higp.hawaii.edu/); Sentinel Hub Playground (URL: https://www.sentinel-hub.com/explore/sentinel-playground).
Daily explosions, gas-and-ash emissions, and block avalanches persisted during April-July 2023
Volcán El Reventador, located in Ecuador, is a stratovolcano with a 4-km-wide avalanche scarp open to the E that was formed by edifice collapse. The largest recorded eruption took place in 2002, producing a 17-km-high eruption column, pyroclastic flows that traveled up to 8 km, and lava flows from summit and flank vents. Recorded eruptions date back to the 16th century and have been characterized by explosive events, lava flows, ash plumes, and lahars. Frequent lahars in this region of heavy rainfall have built deposits on the scarp slope. The current eruption period began in July 2008 and has recently been characterized by daily explosions, gas-and-ash emissions, crater incandescence, and block avalanches (BGVN 48:04). This report updates similar activity during April through July 2023 using daily reports from Ecuador's Instituto Geofisico (IG-EPN), the Washington Volcano Ash Advisory Center (VAAC), and satellite data.
During April through July 2023, IG-EPN reported daily explosions, gas-and-ash plumes rising as high as 3 km above the crater, and frequent nighttime crater incandescence, often accompanied by incandescent block avalanches that affected one or multiple flanks. On average, there were more daily explosions detected during May 2023, with an average total of 39 per day (table 18).
Table 18. Monthly summary of explosions and plume heights recorded at Reventador from April through July 2023. Data courtesy of IG-EPN (April-July 2023 daily reports) and the Washington VAAC.
| Month | Average number of explosions per day | Max plume height above the crater rim (km) |
| Apr 2023 | 29 | 1.6 |
| May 2023 | 39 | 3 |
| Jun 2023 | 20 | 2 |
| Jul 2023 | 31 | 1.2 |
Activity during April 2023 consisted of 18-42 daily explosions that ejected material and nighttime crater incandescence, though weather clouds often prevented clear views of the summit. Frequent seismicity was mainly characterized by long-period (LP) events and tremor associated with emissions (TREMI). Intermittent gas-and-ash emissions rose 500-1,500 m above the summit and drifted N, NW, W, SW, and NE, based on webcam images and satellite imagery (figure 175). The Washington VAAC also reported frequent ash emissions that rose 700-1,600 m above the crater and drifted E, NW, SE, NE, N, and W. During 31 March to 1 April nighttime crater incandescence was observed and ejected material landed 400 m below the crater on the E flank. Incandescent blocks were visible rolling on each of the flanks as far as 500 m below the crater during 4-5 April. During 9-16 April incandescent blocks were visible affecting one or multiple flanks, traveling as far as 500-700 m below the crater rim. A small pyroclastic flow deposit was reported on the SE flank during 10-11 April. During the night and early morning of 14-15 April several explosions were observed, accompanied by incandescent blocks descending all the flanks as far as 700 m below the crater. IG-EPN reported that the REVN station stopped working due to technical problems, so event data was not recorded during 18 April through 3 May. According to GOES-16 satellite images, ash emissions rose less than 1.5 km above the crater and drifted SE, which caused light ashfall in Gonzalo Díaz de Pinea (El Chaco, 35 km SE) on 18 April.
|
Figure 175. Webcam image of a gas-and-ash plume rising above Reventador on 20 April 2023. Courtesy of IG-EPN (INFORME DIARIO DEL VOLCAN REVENTADOR No. 2023-111, 21 de abril de 2023). |
Gas-and-ash emissions and seismicity characterized by frequent LP- and TREMI-type events continued during May. Near-daily explosions ranged from 21-68 per day, sometimes accompanied by incandescent block avalanches, which affected one or multiple flanks and traveled 500-1,000 m below the crater rim (figure 176). Frequent gas-and-ash emissions rose 250-3,000 m above the crater and drifted in multiple directions, according to webcam and satellite imagery; the highest gas-and-ash plume rose 3 km above the crater during the morning of 23 May and drifted W and NW. Several explosions were observed in webcam images; resulting ash plumes rose 500-1,000 m above the crater and drifted W during 5-6 May. Nighttime crater incandescence was visible almost every night on clear weather days. According to the Washington VAAC, frequent ash emissions rose 400-1,300 m above the crater and drifted W, NW, N, and NE. At 1957 on 12 May webcam images showed incandescent material traveling 200 m below the crater rim. The REVS seismic station recorded a high-frequency signal possibly associated with mudflows at 1000 on 18 May. During the morning of 28 May IG-EPN reported a lahar toward the E, though no damage was noted.
|
Figure 176. Webcam image of incandescent block avalanches descending the flanks of Reventador as far as 800 m below the crater rim on 22 May 2023. The dotted arrow is undefined. Courtesy of IG-EPN (INFORME DIARIO DEL VOLCAN REVENTADOR No. 2023-142, 22 de mayo de 2023). |
Daily explosions and ash plumes continued during June, with 7-45 explosions recorded each day. LP and TREMI-type events and crater incandescence were also frequently recorded on clear weather days, cloudy weather often obscured views of the summit. Gas-and-ash emissions rose 200-1,000 m above the summit and drifted W, NW, SW, and NE (figure 177). Nighttime crater incandescence persisted, accompanied by block avalanches that traveled 400-800 m below the summit affecting one or multiple flanks. The Washington VAAC reported that ash emissions rose 700-2,000 m above the crater and drifted NW and W. During the night of 21 June crater incandescence was reported, as well as a lava flow that descended the S flank. The flow continued into the morning of 22 June.
|
Figure 177. Webcam image of a gas-and-ash plume rising above Reventador on 12 June 2023. Courtesy of IG-EPN (INFORME DIARIO DEL VOLCAN REVENTADOR No. 2023-163, 12 de junio de 2023). |
Daily explosions, LP- and TREMI-type events, crater incandescence, and block avalanches continued during July. There were 16-59 daily explosions detected throughout the month. Gas-and-ash emissions rose 200-1,200 m above the crater and drifted in different directions (figure 178). Nighttime crater incandescence continued, with frequent block avalanches affecting all the flanks and descending 400-800 m below the crater rim. The Washington VAAC reported that intermittent ash emissions rose 700-1,000 m above the summit and drifted W and NW. On 7 July at approximately 1100 the REVS and REVN seismic stations recorded high-frequency signals that corresponded to lahars descending the drainage system.
|
Figure 178. Webcam image of a gray gas-and-ash plume rising above Reventador on 13 July 2023. Courtesy of IG-EPN (INFORME DIARIO DEL VOLCAN REVENTADOR No. 2023-194, 13 de julio de 2023). |
Additional satellite data. MIROVA (Middle InfraRed Observation of Volcanic Activity) analysis of MODIS satellite data showed intermittent thermal anomalies of low-to-moderate power (figure 179). The MODVOLC hotspot system identified a total of six hotspots on 5 April (3), 14 April (2), and 4 July (1). Though the summit was often obscured by weather clouds, an infrared satellite image taken on 11 April showed a strong thermal anomaly.
|
Figure 179. Intermittent low-to-moderate strength thermal activity was detected at Reventador during April through July 2023, based on this MIROVA graph (Log Radiative Power). Courtesy of MIROVA. |
Information Contacts: Instituto Geofísico, Escuela Politécnica Nacional (IG-EPN), Casilla 17-01-2759, Quito, Ecuador (URL: http://www.igepn.edu.ec/); MIROVA (Middle InfraRed Observation of Volcanic Activity), a collaborative project between the Universities of Turin and Florence (Italy) supported by the Centre for Volcanic Risk of the Italian Civil Protection Department (URL: http://www.mirovaweb.it/); Hawai'i Institute of Geophysics and Planetology (HIGP) - MODVOLC Thermal Alerts System, School of Ocean and Earth Science and Technology (SOEST), Univ. of Hawai'i, 2525 Correa Road, Honolulu, HI 96822, USA (URL: http://modis.higp.hawaii.edu/); Copernicus Data Space Ecosystem, European Space Agency (URL: https://dataspace.copernicus.eu/browser/).
|
|
||||||||||||||||||||||||||
There is data available for 26 confirmed eruptive periods.
2008 Jul 27 - 2025 Sep 19 (continuing) Confirmed Eruption (Explosive / Effusive) VEI: 2
| Episode 1 | Eruption (Explosive / Effusive) | |||||||||||||||||||||||||||||||||||||||||||||||||||||||||||||||||||||
|---|---|---|---|---|---|---|---|---|---|---|---|---|---|---|---|---|---|---|---|---|---|---|---|---|---|---|---|---|---|---|---|---|---|---|---|---|---|---|---|---|---|---|---|---|---|---|---|---|---|---|---|---|---|---|---|---|---|---|---|---|---|---|---|---|---|---|---|---|---|
| 2008 Jul 27 - 2025 Sep 19 (continuing) | Evidence from Observations: Reported | ||||||||||||||||||||||||||||||||||||||||||||||||||||||||||||||||||||
|
List of 12 Events for Episode 1
|
|||||||||||||||||||||||||||||||||||||||||||||||||||||||||||||||||||||
2007 Mar 15 ± 7 days - 2007 Oct 11 (?) Confirmed Eruption (Explosive / Effusive) VEI: 2
| Episode 1 | Eruption (Explosive / Effusive) | |||||||||||||||||||||||||||||||||||||||||||||||||
|---|---|---|---|---|---|---|---|---|---|---|---|---|---|---|---|---|---|---|---|---|---|---|---|---|---|---|---|---|---|---|---|---|---|---|---|---|---|---|---|---|---|---|---|---|---|---|---|---|---|
| 2007 Mar 15 ± 7 days - 2007 Oct 11 (?) | Evidence from Observations: Reported | ||||||||||||||||||||||||||||||||||||||||||||||||
|
List of 8 Events for Episode 1
|
|||||||||||||||||||||||||||||||||||||||||||||||||
2004 Nov 7 ± 3 days - 2006 Mar 16 ± 15 days Confirmed Eruption (Explosive / Effusive) VEI: 2
| Episode 1 | Eruption (Explosive / Effusive) | ||||||||||||||||||||||||||||||||||||||||||||||||||||||||||||||||||||||||||
|---|---|---|---|---|---|---|---|---|---|---|---|---|---|---|---|---|---|---|---|---|---|---|---|---|---|---|---|---|---|---|---|---|---|---|---|---|---|---|---|---|---|---|---|---|---|---|---|---|---|---|---|---|---|---|---|---|---|---|---|---|---|---|---|---|---|---|---|---|---|---|---|---|---|---|
| 2004 Nov 7 ± 3 days - 2006 Mar 16 ± 15 days | Evidence from Observations: Reported | |||||||||||||||||||||||||||||||||||||||||||||||||||||||||||||||||||||||||
|
List of 13 Events for Episode 1
|
||||||||||||||||||||||||||||||||||||||||||||||||||||||||||||||||||||||||||
2002 Nov 3 - 2003 Jan 10 (?) Confirmed Eruption (Explosive / Effusive) VEI: 4
| Episode 1 | Eruption (Explosive / Effusive) | Summit and SE flank (2600 m) | |||||||||||||||||||||||||||||||||||||||||||||||||||||||||||||||||||||||||||||||||||
|---|---|---|---|---|---|---|---|---|---|---|---|---|---|---|---|---|---|---|---|---|---|---|---|---|---|---|---|---|---|---|---|---|---|---|---|---|---|---|---|---|---|---|---|---|---|---|---|---|---|---|---|---|---|---|---|---|---|---|---|---|---|---|---|---|---|---|---|---|---|---|---|---|---|---|---|---|---|---|---|---|---|---|---|---|
| 2002 Nov 3 - 2003 Jan 10 (?) | Evidence from Observations: Reported | |||||||||||||||||||||||||||||||||||||||||||||||||||||||||||||||||||||||||||||||||||
|
List of 15 Events for Episode 1 at Summit and SE flank (2600 m)
|
||||||||||||||||||||||||||||||||||||||||||||||||||||||||||||||||||||||||||||||||||||
1976 Jan 4 - 1976 May 16 ± 15 days Confirmed Eruption (Explosive / Effusive) VEI: 2
| Episode 1 | Eruption (Explosive / Effusive) | ||||||||||||||||||||||||||||||||||||||||||||
|---|---|---|---|---|---|---|---|---|---|---|---|---|---|---|---|---|---|---|---|---|---|---|---|---|---|---|---|---|---|---|---|---|---|---|---|---|---|---|---|---|---|---|---|---|
| 1976 Jan 4 - 1976 May 16 ± 15 days | Evidence from Observations: Reported | |||||||||||||||||||||||||||||||||||||||||||
|
List of 7 Events for Episode 1
|
||||||||||||||||||||||||||||||||||||||||||||
1973 Nov 16 ± 15 days - 1974 Jul 16 ± 15 days Confirmed Eruption (Explosive / Effusive) VEI: 3
| Episode 1 | Eruption (Explosive / Effusive) | ||||||||||||||||||||||||||||||||||||||||||||
|---|---|---|---|---|---|---|---|---|---|---|---|---|---|---|---|---|---|---|---|---|---|---|---|---|---|---|---|---|---|---|---|---|---|---|---|---|---|---|---|---|---|---|---|---|
| 1973 Nov 16 ± 15 days - 1974 Jul 16 ± 15 days | Evidence from Observations: Reported | |||||||||||||||||||||||||||||||||||||||||||
|
List of 7 Events for Episode 1
|
||||||||||||||||||||||||||||||||||||||||||||
1972 Jul 16 ± 15 days - 1972 Sep 16 ± 15 days Confirmed Eruption (Explosive / Effusive) VEI: 2
| Episode 1 | Eruption (Explosive / Effusive) | |||||||||||||||||||||||||||||||||||||||||||||||||
|---|---|---|---|---|---|---|---|---|---|---|---|---|---|---|---|---|---|---|---|---|---|---|---|---|---|---|---|---|---|---|---|---|---|---|---|---|---|---|---|---|---|---|---|---|---|---|---|---|---|
| 1972 Jul 16 ± 15 days - 1972 Sep 16 ± 15 days | Evidence from Observations: Reported | ||||||||||||||||||||||||||||||||||||||||||||||||
|
List of 8 Events for Episode 1
|
|||||||||||||||||||||||||||||||||||||||||||||||||
1960 Jun 16 ± 15 days Confirmed Eruption (Explosive / Effusive) VEI: 3
| Episode 1 | Eruption (Explosive / Effusive) | ||||||||||||||||||||||||
|---|---|---|---|---|---|---|---|---|---|---|---|---|---|---|---|---|---|---|---|---|---|---|---|---|
| 1960 Jun 16 ± 15 days - Unknown | Evidence from Observations: Reported | |||||||||||||||||||||||
| Eruption with ashfall in Quito, about 90 km ESE. | ||||||||||||||||||||||||
|
List of 3 Events for Episode 1
|
||||||||||||||||||||||||
1958 Nov 16 ± 15 days Confirmed Eruption (Explosive / Effusive) VEI: 3
| Episode 1 | Eruption (Explosive / Effusive) | |||||||||||||||||||
|---|---|---|---|---|---|---|---|---|---|---|---|---|---|---|---|---|---|---|---|
| 1958 Nov 16 ± 15 days - Unknown | Evidence from Observations: Reported | ||||||||||||||||||
|
List of 2 Events for Episode 1
|
|||||||||||||||||||
1955 Jul 2 ± 182 days Confirmed Eruption (Explosive / Effusive) VEI: 2
| Episode 1 | Eruption (Explosive / Effusive) | |||||||||||||||||||
|---|---|---|---|---|---|---|---|---|---|---|---|---|---|---|---|---|---|---|---|
| 1955 Jul 2 ± 182 days - Unknown | Evidence from Observations: Reported | ||||||||||||||||||
|
List of 2 Events for Episode 1
|
|||||||||||||||||||
1944 Feb 24 - 1944 Mar 1 Confirmed Eruption (Explosive / Effusive) VEI: 3
| Episode 1 | Eruption (Explosive / Effusive) | ||||||||||||||||||||||||||||||||||
|---|---|---|---|---|---|---|---|---|---|---|---|---|---|---|---|---|---|---|---|---|---|---|---|---|---|---|---|---|---|---|---|---|---|---|
| 1944 Feb 24 - 1944 Mar 1 | Evidence from Observations: Reported | |||||||||||||||||||||||||||||||||
|
List of 5 Events for Episode 1
|
||||||||||||||||||||||||||||||||||
1936 Aug 27 Confirmed Eruption (Explosive / Effusive) VEI: 3
| Episode 1 | Eruption (Explosive / Effusive) | ||||||||||||||||||||||||
|---|---|---|---|---|---|---|---|---|---|---|---|---|---|---|---|---|---|---|---|---|---|---|---|---|
| 1936 Aug 27 - Unknown | Evidence from Observations: Reported | |||||||||||||||||||||||
|
List of 3 Events for Episode 1
|
||||||||||||||||||||||||
1929 Confirmed Eruption (Explosive / Effusive) VEI: 3
| Episode 1 | Eruption (Explosive / Effusive) | ||||||||||||||||||||||||
|---|---|---|---|---|---|---|---|---|---|---|---|---|---|---|---|---|---|---|---|---|---|---|---|---|
| 1929 - Unknown | Evidence from Observations: Reported | |||||||||||||||||||||||
|
List of 3 Events for Episode 1
|
||||||||||||||||||||||||
1926 Jan 5 ± 4 days - 1926 May Confirmed Eruption (Explosive / Effusive) VEI: 3
| Episode 1 | Eruption (Explosive / Effusive) | ||||||||||||||||||||||||
|---|---|---|---|---|---|---|---|---|---|---|---|---|---|---|---|---|---|---|---|---|---|---|---|---|
| 1926 Jan 5 ± 4 days - 1926 May | Evidence from Observations: Reported | |||||||||||||||||||||||
|
List of 3 Events for Episode 1
|
||||||||||||||||||||||||
1912 Feb - 1912 Mar Confirmed Eruption (Explosive / Effusive) VEI: 3
| Episode 1 | Eruption (Explosive / Effusive) | ||||||||||||||||||||||||
|---|---|---|---|---|---|---|---|---|---|---|---|---|---|---|---|---|---|---|---|---|---|---|---|---|
| 1912 Feb - 1912 Mar | Evidence from Observations: Reported | |||||||||||||||||||||||
|
List of 3 Events for Episode 1
|
||||||||||||||||||||||||
1898 Apr 8 - 1906 Confirmed Eruption (Explosive / Effusive) VEI: 3
| Episode 1 | Eruption (Explosive / Effusive) | ||||||||||||||||||||||||||||||||||
|---|---|---|---|---|---|---|---|---|---|---|---|---|---|---|---|---|---|---|---|---|---|---|---|---|---|---|---|---|---|---|---|---|---|---|
| 1898 Apr 8 - 1906 | Evidence from Observations: Reported | |||||||||||||||||||||||||||||||||
|
List of 5 Events for Episode 1
|
||||||||||||||||||||||||||||||||||
1894 Confirmed Eruption (Explosive / Effusive) VEI: 3
| Episode 1 | Eruption (Explosive / Effusive) | |||||||||||||||||||
|---|---|---|---|---|---|---|---|---|---|---|---|---|---|---|---|---|---|---|---|
| 1894 - Unknown | Evidence from Observations: Reported | ||||||||||||||||||
|
List of 2 Events for Episode 1
|
|||||||||||||||||||
1871 Jan 30 Confirmed Eruption (Explosive / Effusive) VEI: 2
| Episode 1 | Eruption (Explosive / Effusive) | ||||||||||||||||||||||||
|---|---|---|---|---|---|---|---|---|---|---|---|---|---|---|---|---|---|---|---|---|---|---|---|---|
| 1871 Jan 30 - Unknown | Evidence from Observations: Reported | |||||||||||||||||||||||
|
List of 3 Events for Episode 1
|
||||||||||||||||||||||||
1856 Dec 12 - 1856 Dec 13 Confirmed Eruption (Explosive / Effusive) VEI: 3
| Episode 1 | Eruption (Explosive / Effusive) | |||||||||||||||||||||||||||||
|---|---|---|---|---|---|---|---|---|---|---|---|---|---|---|---|---|---|---|---|---|---|---|---|---|---|---|---|---|---|
| 1856 Dec 12 - 1856 Dec 13 | Evidence from Observations: Reported | ||||||||||||||||||||||||||||
|
List of 4 Events for Episode 1
|
|||||||||||||||||||||||||||||
1844 Confirmed Eruption (Explosive / Effusive) VEI: 3
| Episode 1 | Eruption (Explosive / Effusive) | ||||||||||||||||||||||||
|---|---|---|---|---|---|---|---|---|---|---|---|---|---|---|---|---|---|---|---|---|---|---|---|---|
| 1844 - Unknown | Evidence from Observations: Reported | |||||||||||||||||||||||
|
List of 3 Events for Episode 1
|
||||||||||||||||||||||||
1843 Dec 7 Confirmed Eruption (Explosive / Effusive) VEI: 3
| Episode 1 | Eruption (Explosive / Effusive) | ||||||||||||||||||||||||
|---|---|---|---|---|---|---|---|---|---|---|---|---|---|---|---|---|---|---|---|---|---|---|---|---|
| 1843 Dec 7 - Unknown | Evidence from Observations: Reported | |||||||||||||||||||||||
|
List of 3 Events for Episode 1
|
||||||||||||||||||||||||
1843 (in or before) Confirmed Eruption (Explosive / Effusive) VEI: 2 (?)
| Episode 1 | Eruption (Explosive / Effusive) | |||||||||||||||||||
|---|---|---|---|---|---|---|---|---|---|---|---|---|---|---|---|---|---|---|---|
| 1843 (in or before) - Unknown | Evidence from Observations: Reported | ||||||||||||||||||
|
List of 2 Events for Episode 1
|
|||||||||||||||||||
1797 Jan Confirmed Eruption (Explosive / Effusive) VEI: 3
| Episode 1 | Eruption (Explosive / Effusive) | ||||||||||||||||||||||||
|---|---|---|---|---|---|---|---|---|---|---|---|---|---|---|---|---|---|---|---|---|---|---|---|---|
| 1797 Jan - Unknown | Evidence from Observations: Reported | |||||||||||||||||||||||
|
List of 3 Events for Episode 1
|
||||||||||||||||||||||||
1691 Confirmed Eruption (Explosive / Effusive) VEI: 3
| Episode 1 | Eruption (Explosive / Effusive) | ||||||||||||||||||||||||
|---|---|---|---|---|---|---|---|---|---|---|---|---|---|---|---|---|---|---|---|---|---|---|---|---|
| 1691 - Unknown | Evidence from Observations: Reported | |||||||||||||||||||||||
|
List of 3 Events for Episode 1
|
||||||||||||||||||||||||
1590 Confirmed Eruption (Explosive / Effusive) VEI: 3
| Episode 1 | Eruption (Explosive / Effusive) | Volcano Uncertain: possibly Antisana | ||||||||||||||||||||||||||||
|---|---|---|---|---|---|---|---|---|---|---|---|---|---|---|---|---|---|---|---|---|---|---|---|---|---|---|---|---|---|
| 1590 - Unknown | Evidence from Observations: Reported | ||||||||||||||||||||||||||||
|
List of 4 Events for Episode 1 at Volcano Uncertain: possibly Antisana
|
|||||||||||||||||||||||||||||
1541 Apr Confirmed Eruption (Explosive / Effusive) VEI: 3
| Episode 1 | Eruption (Explosive / Effusive) | ||||||||||||||||||||||||
|---|---|---|---|---|---|---|---|---|---|---|---|---|---|---|---|---|---|---|---|---|---|---|---|---|
| 1541 Apr - Unknown | Evidence from Observations: Reported | |||||||||||||||||||||||
|
List of 3 Events for Episode 1
|
||||||||||||||||||||||||
This compilation of synonyms and subsidiary features may not be comprehensive. Features are organized into four major categories: Cones, Craters, Domes, and Thermal Features. Synonyms of features appear indented below the primary name. In some cases additional feature type, elevation, or location details are provided.
Synonyms |
||||
| Reventador, El | Pisambilla | ||||
Domes |
||||
| Feature Name | Feature Type | Elevation | Latitude | Longitude |
| Copete, El | Dome | |||
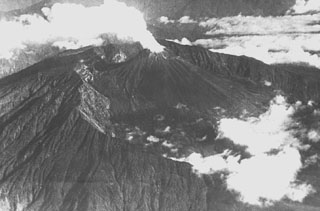 A steam plume, seen in a 1944 aerial view from the SE, rises above the summit crater of Reventador volcano. An eruption during February 24 to March 1, 1944 caused ashfall in the Andes and produced a lava flow down the Río Ouijos. The steaming El Reventador stratovolcano is nestled within the rim of an arcuate caldera that is breached widely to the east. It rises 1300 m above the caldera floor and is one of Ecuador's most active volcanoes.
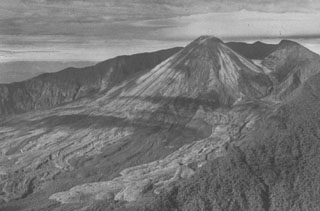 The remote and inaccessible Reventador volcano rises above the jungles of the western Amazon basin. El Reventador, a young stratovolcano constructed within the 3-km-wide breached caldera of Volcán Reventador, is the most frequently active of a N-S chain of Ecuadorian volcanoes that lies well east of the principal volcanic axis. Fresh-looking lava flows descending from El Reventador extend east across the caldera floor in this late-1960s photo. Explosive eruptions during historical time have been visible from Quito.
 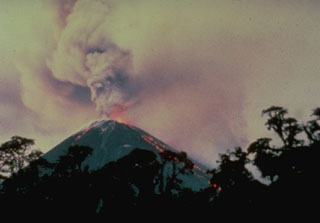 The 1976 eruption of Reventador volcano began on January 4 with explosions that sent ash west over the Amazonian jungle. At the same time lava flows from the summit crater descended the eastern flank of the cone. They split into several lobes and reached a length of 3 km before stopping at the end of the 3rd week of the eruption. Pyroclastic flows began between the 2nd and 3rd weeks and continued for several months, traveling at speeds up to 135 km/hr across the caldera floor. The eruption ended in May.
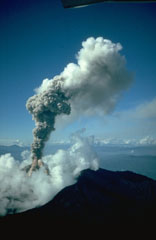 An ash column rises above the summit crater of Reventador volcano during the 1976 eruption. This view across the north caldera rim in the foreground shows a small pyroclastic flow descending the flank of the summit cone into the clouds. Pyroclastic flows began between the 2nd and 3rd weeks of the eruption, which started on January 1. They originated from collapse of the vertical eruption column and traveled down the flanks of the volcano onto the floor of the breached caldera. Pyroclastic-flow activity continued for several months.
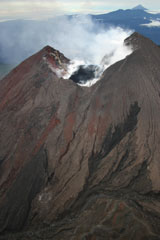 The steaming summit crater of Reventador volcano in northern Ecuador is seen in this aerial view from the north on April 21, 2005. The black area in the center of the crater is a new lava dome that began growing inside the crater during an eruption that had begun in November 2004. Lava flows from the crater periodically descended a notch in the far crater wall and flowed down the southern flank of the cone. Conical Sumaco volcano is seen in the background.
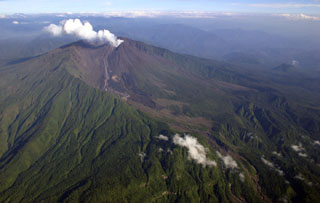 A steam-and-gas plume rises from the central cone of Reventador volcano in this March 11, 2005 aerial view from the SE. Several lava flows generated during eruptions in 2002 and 2004-2005 are visible on the south and SE flanks of the central cone. The 3562-m-high central cone was constructed within the large 4-km-wide horseshoe-shaped caldera breached to the east (lower right). The caldera was formed during a major collapse of the volcano, which produced a massive debris avalanche that swept into the Amazon basin.
There are no samples for Reventador in the Smithsonian's NMNH Department of Mineral Sciences Rock and Ore collection.
| Copernicus Browser | The Copernicus Browser replaced the Sentinel Hub Playground browser in 2023, to provide access to Earth observation archives from the Copernicus Data Space Ecosystem, the main distribution platform for data from the EU Copernicus missions. |
| MIROVA | Middle InfraRed Observation of Volcanic Activity (MIROVA) is a near real time volcanic hot-spot detection system based on the analysis of MODIS (Moderate Resolution Imaging Spectroradiometer) data. In particular, MIROVA uses the Middle InfraRed Radiation (MIR), measured over target volcanoes, in order to detect, locate and measure the heat radiation sourced from volcanic activity. |
| MODVOLC Thermal Alerts | Using infrared satellite Moderate Resolution Imaging Spectroradiometer (MODIS) data, scientists at the Hawai'i Institute of Geophysics and Planetology, University of Hawai'i, developed an automated system called MODVOLC to map thermal hot-spots in near real time. For each MODIS image, the algorithm automatically scans each 1 km pixel within it to check for high-temperature hot-spots. When one is found the date, time, location, and intensity are recorded. MODIS looks at every square km of the Earth every 48 hours, once during the day and once during the night, and the presence of two MODIS sensors in space allows at least four hot-spot observations every two days. Each day updated global maps are compiled to display the locations of all hot spots detected in the previous 24 hours. There is a drop-down list with volcano names which allow users to 'zoom-in' and examine the distribution of hot-spots at a variety of spatial scales. |
|
WOVOdat
Single Volcano View Temporal Evolution of Unrest Side by Side Volcanoes |
WOVOdat is a database of volcanic unrest; instrumentally and visually recorded changes in seismicity, ground deformation, gas emission, and other parameters from their normal baselines. It is sponsored by the World Organization of Volcano Observatories (WOVO) and presently hosted at the Earth Observatory of Singapore.
GVMID Data on Volcano Monitoring Infrastructure The Global Volcano Monitoring Infrastructure Database GVMID, is aimed at documenting and improving capabilities of volcano monitoring from the ground and space. GVMID should provide a snapshot and baseline view of the techniques and instrumentation that are in place at various volcanoes, which can be use by volcano observatories as reference to setup new monitoring system or improving networks at a specific volcano. These data will allow identification of what monitoring gaps exist, which can be then targeted by remote sensing infrastructure and future instrument deployments. |
| Volcanic Hazard Maps | The IAVCEI Commission on Volcanic Hazards and Risk has a Volcanic Hazard Maps database designed to serve as a resource for hazard mappers (or other interested parties) to explore how common issues in hazard map development have been addressed at different volcanoes, in different countries, for different hazards, and for different intended audiences. In addition to the comprehensive, searchable Volcanic Hazard Maps Database, this website contains information about diversity of volcanic hazard maps, illustrated using examples from the database. This site is for educational purposes related to volcanic hazard maps. Hazard maps found on this website should not be used for emergency purposes. For the most recent, official hazard map for a particular volcano, please seek out the proper institutional authorities on the matter. |
| IRIS seismic stations/networks | Incorporated Research Institutions for Seismology (IRIS) Data Services map showing the location of seismic stations from all available networks (permanent or temporary) within a radius of 0.18° (about 20 km at mid-latitudes) from the given location of Reventador. Users can customize a variety of filters and options in the left panel. Note that if there are no stations are known the map will default to show the entire world with a "No data matched request" error notice. |
| UNAVCO GPS/GNSS stations | Geodetic Data Services map from UNAVCO showing the location of GPS/GNSS stations from all available networks (permanent or temporary) within a radius of 20 km from the given location of Reventador. Users can customize the data search based on station or network names, location, and time window. Requires Adobe Flash Player. |
| DECADE Data | The DECADE portal, still in the developmental stage, serves as an example of the proposed interoperability between The Smithsonian Institution's Global Volcanism Program, the Mapping Gas Emissions (MaGa) Database, and the EarthChem Geochemical Portal. The Deep Earth Carbon Degassing (DECADE) initiative seeks to use new and established technologies to determine accurate global fluxes of volcanic CO2 to the atmosphere, but installing CO2 monitoring networks on 20 of the world's 150 most actively degassing volcanoes. The group uses related laboratory-based studies (direct gas sampling and analysis, melt inclusions) to provide new data for direct degassing of deep earth carbon to the atmosphere. |
| Large Eruptions of Reventador | Information about large Quaternary eruptions (VEI >= 4) is cataloged in the Large Magnitude Explosive Volcanic Eruptions (LaMEVE) database of the Volcano Global Risk Identification and Analysis Project (VOGRIPA). |
| EarthChem | EarthChem develops and maintains databases, software, and services that support the preservation, discovery, access and analysis of geochemical data, and facilitate their integration with the broad array of other available earth science parameters. EarthChem is operated by a joint team of disciplinary scientists, data scientists, data managers and information technology developers who are part of the NSF-funded data facility Integrated Earth Data Applications (IEDA). IEDA is a collaborative effort of EarthChem and the Marine Geoscience Data System (MGDS). |

