
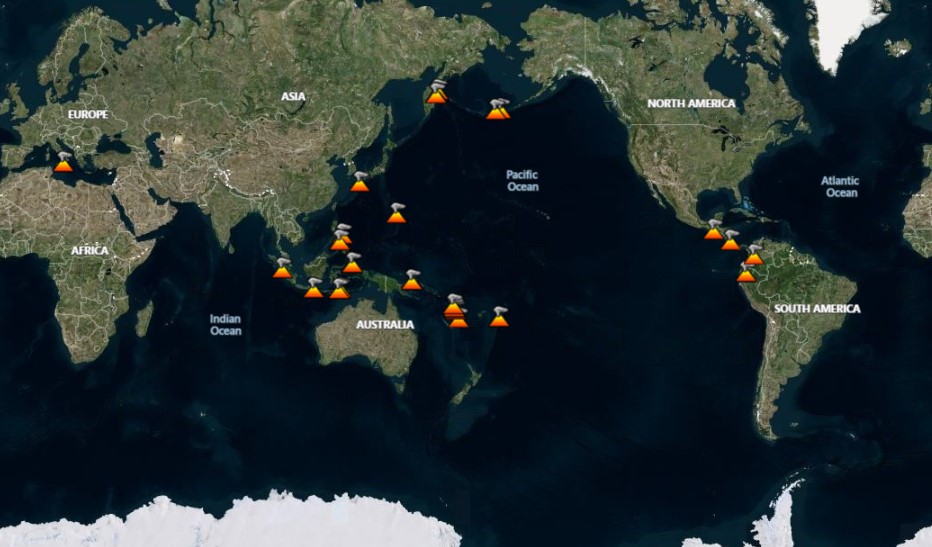
The Weekly Volcanic Activity Report is a cooperative project between the Smithsonian's Global Volcanism Program and the US Geological Survey's Volcano Hazards Program. Updated by 2300 UTC every Thursday (changed from Wednesdays starting in January 2026) and averaging 16 reported volcanoes, this is not a comprehensive list of all eruptions this week, but rather a summary of activity that meet criteria discussed in the "Criteria and Disclaimers" section below.
Volcanic activity reported here is preliminary and subject to change. Carefully reviewed, detailed narratives over longer time periods are published as reports of the Bulletin of the Global Volcanism Network available through volcano profile pages.
| Name | Country | Volcanic Region | Eruption Start Date | Report Type |
|---|---|---|---|---|
| Sheveluch | Russia | Eastern Kamchatka Volcanic Arc | 1999 Aug 15 | New Eruptive Activity |
| Talang | Indonesia | Sunda Volcanic Arc | — | New Eruptive Activity |
| Etna | Italy | Sicily Volcanic Province | — | Continuing Eruptive Activity |
| Karangetang | Indonesia | Sangihe Volcanic Arc | — | Continuing Eruptive Activity |
| Kavachi | Solomon Islands | Solomon Volcanic Province | — | Continuing Eruptive Activity |
| Kīlauea | United States | Hawaiian-Emperor Hotspot Volcano Group | 2024 Dec 23 | Continuing Eruptive Activity |
| Manam | Papua New Guinea | Bismarck Volcanic Arc | 2018 Jun 10 | Continuing Eruptive Activity |
| Merapi | Indonesia | Sunda Volcanic Arc | 2020 Dec 31 | Continuing Eruptive Activity |
| Popocatépetl | Mexico | Trans-Mexican Volcanic Arc | 2005 Jan 9 | Continuing Eruptive Activity |
| Rabaul | Papua New Guinea | Bismarck Volcanic Arc | — | Continuing Eruptive Activity |
| Semeru | Indonesia | Sunda Volcanic Arc | 2019 Feb 24 | Continuing Eruptive Activity |
| Soufrière Hills | United Kingdom | Lesser Antilles Volcanic Arc | — | Continuing Eruptive Activity |
| Tungurahua | Ecuador | Northern Andean Volcanic Arc | — | Continuing Eruptive Activity |
| Ulawun | Papua New Guinea | Bismarck Volcanic Arc | — | Continuing Eruptive Activity |
Sheveluch (Russia) | 26 September-2 October 2001 | New Eruptive Activity
|
|
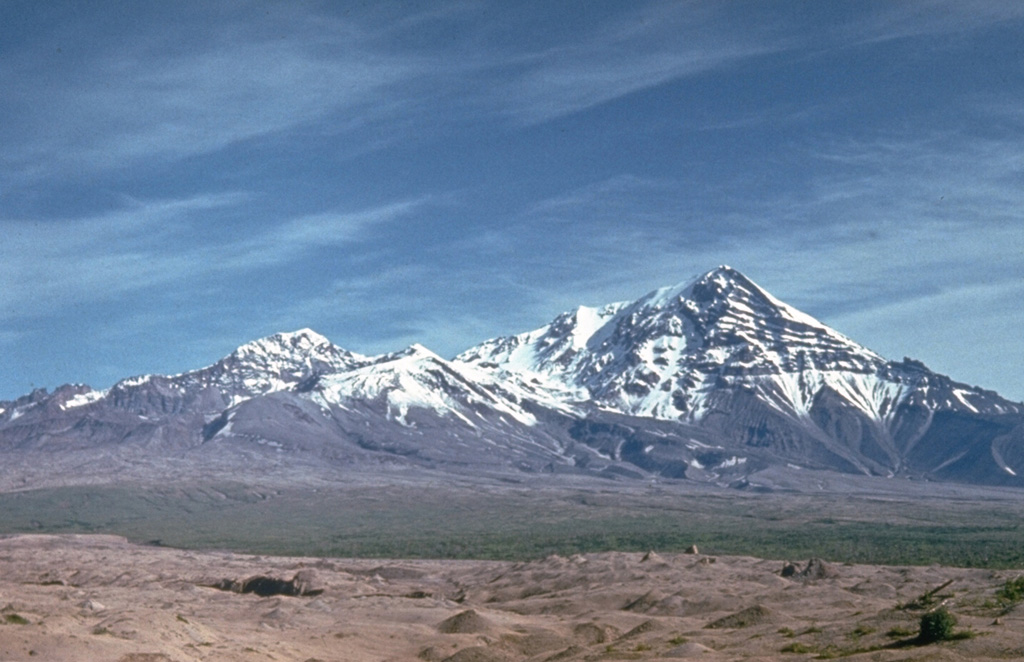 Sheveluch SheveluchEastern Kamchatka Volcanic Arc |
During 28-29 September seismic activity was above background levels and weak, shallow seismic signals (possible collapses and avalanches) were registered. Several small explosions occurred on 30 September, sending ash clouds to the following heights above the dome: 2.5 km at 1323, 3.5 km at 1719, 2.5 km at 1755, and 4.5 km at 1807. An explosion at 2010 produced an umbrella-shaped ash cloud that rose 9 km above the lava dome and extended ~9 km E to W. Large pyroclastic flows traveled ~5 km to the SE. The same day the Concern Color Code was raised from Orange to Red. During 28-30 September thermal anomalies in the active dome area were visible on satellite imagery. Following the eruption, during 30 September at 2100 to 1 October at 0900, seismic activity decreased and the view of the volcano was obscured by clouds. AVHRR satellite imagery at 0757 showed that the ~25-km-diameter ash cloud remained centered over the volcano. On 1 October the Concern Color Code was reduced back to Orange. Sources: Kamchatkan Volcanic Eruption Response Team (KVERT), Anchorage Volcanic Ash Advisory Center (VAAC), Tokyo Volcanic Ash Advisory Center (VAAC), China Daily.com |
Talang (Indonesia) | 26 September-2 October 2001 | New Eruptive Activity
|
|
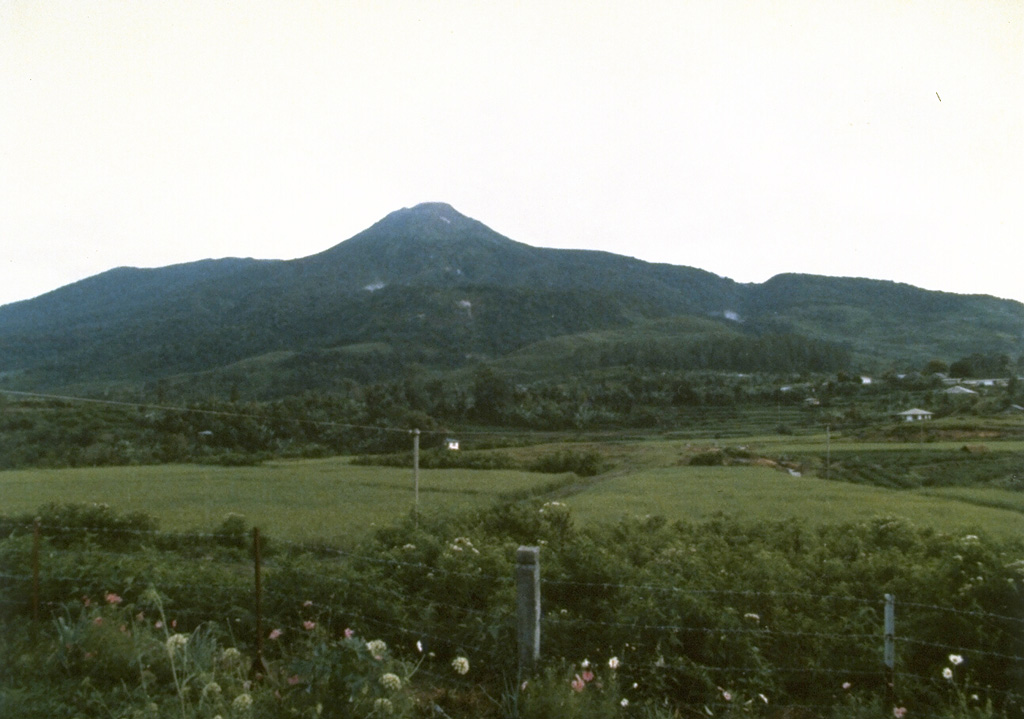 Talang TalangSunda Volcanic Arc |
During 24-30 September volcanic activity increased at Talang volcano. Observers noted that on 25 September during 1722-1838 a thick white-brownish plume with high gas pressure rose 200-350 m above the volcano. Personnel at the observatory could smell sulfur during the evening. In comparison to measurements in 2000, temperatures increased in 2001 at Batu Bajanjang hot spring (from 40-60°C to 45-66°C), Gabuo Atas fumarole field (from 98-99°C to 111-114°C), and Gabuo Bawah fumarole field (from 96-99°C to 100-101°C). In addition, the water level at Batu Bajanjang hot spring decreased drastically. Talang was at Alert Level 2 (on a scale of 1-4). Source: Pusat Vulkanologi dan Mitigasi Bencana Geologi (PVMBG, also known as CVGHM) |
Etna (Italy) | 26 September-2 October 2001 | Continuing Eruptive Activity
|
|
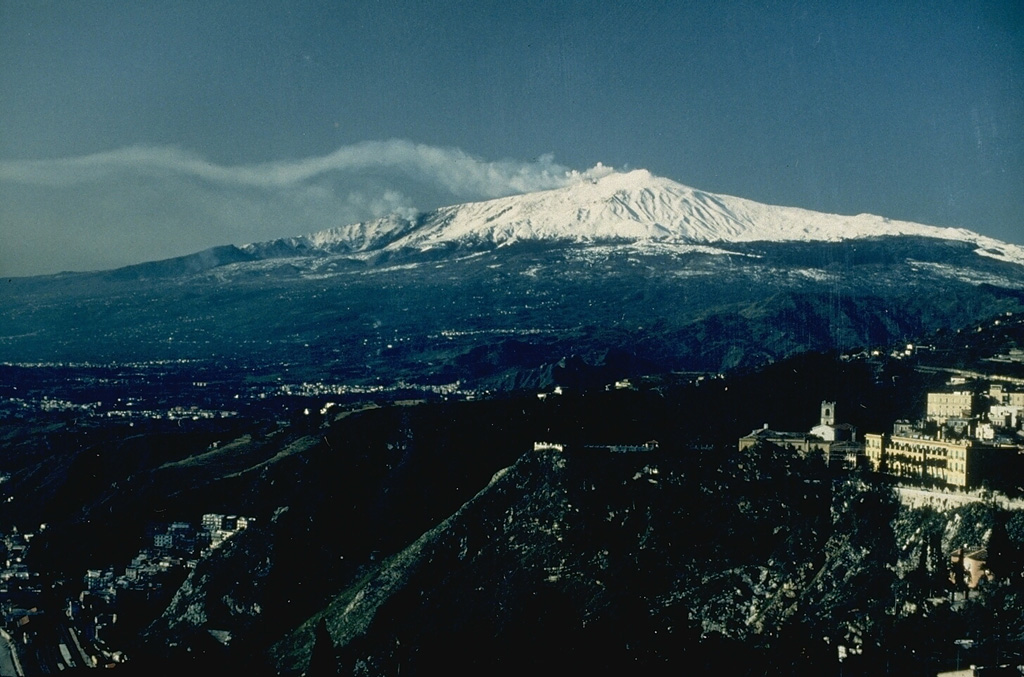 Etna EtnaSicily Volcanic Province |
According to reports on 28 September, gas emissions from Bocca Nuova crater had been vigorous at times during the previous few weeks. In addition, a dense gas plume was visible rising above Northeast Crater. The cones that formed during the July-August 2001 eruption on the S flank continued to emit heat and minor amounts of gas. Source: Italy's Volcanoes |
Karangetang (Indonesia) | 26 September-2 October 2001 | Continuing Eruptive Activity
|
|
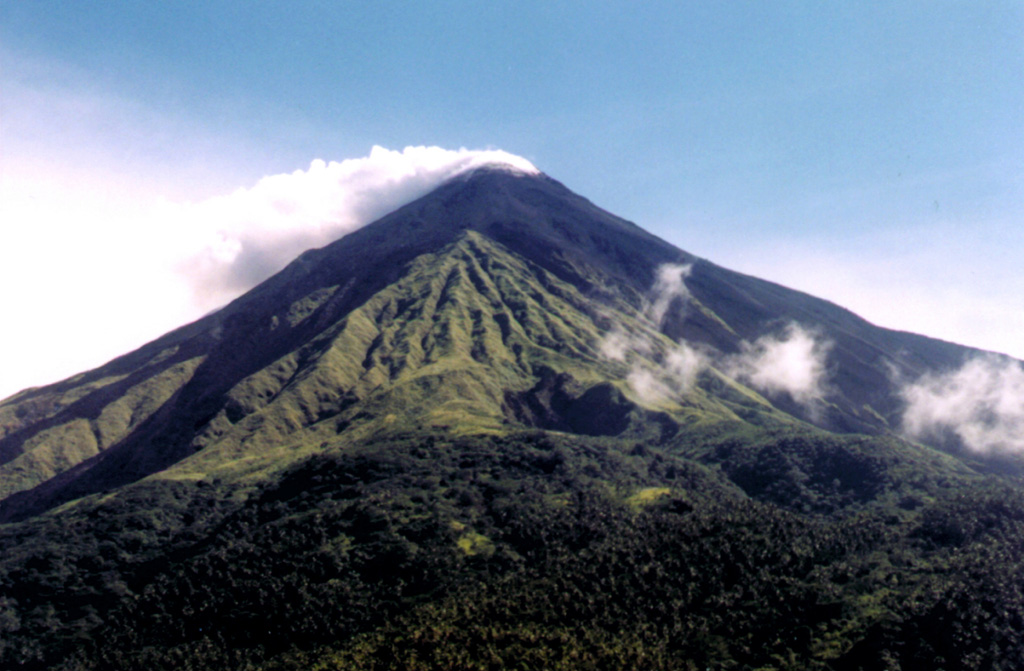 Karangetang KarangetangSangihe Volcanic Arc |
During 17-23 September lava flows and lava avalanches rarely occurred at Karangetang. Small white-colored emissions rose ~500 m above the main crater and 50-200 m above Crater II. A 10- to 100-m-high "red reflection" was visible above the volcano. Seismic activity decreased in comparison to the previous week and was dominated by multiphase and avalanche earthquakes. During 24-30 September seismic activity continued to decrease and few lava avalanches were observed emanating from main crater. Plumes rose 400 m above the summit of the main crater and 50-100 m above Crater II. A 25-m-high "red reflection" was observed. The Alert Level remained at 3 (on a scale of 1-4). Source: Pusat Vulkanologi dan Mitigasi Bencana Geologi (PVMBG, also known as CVGHM) |
Kavachi (Solomon Islands) | 26 September-2 October 2001 | Continuing Eruptive Activity
|
|
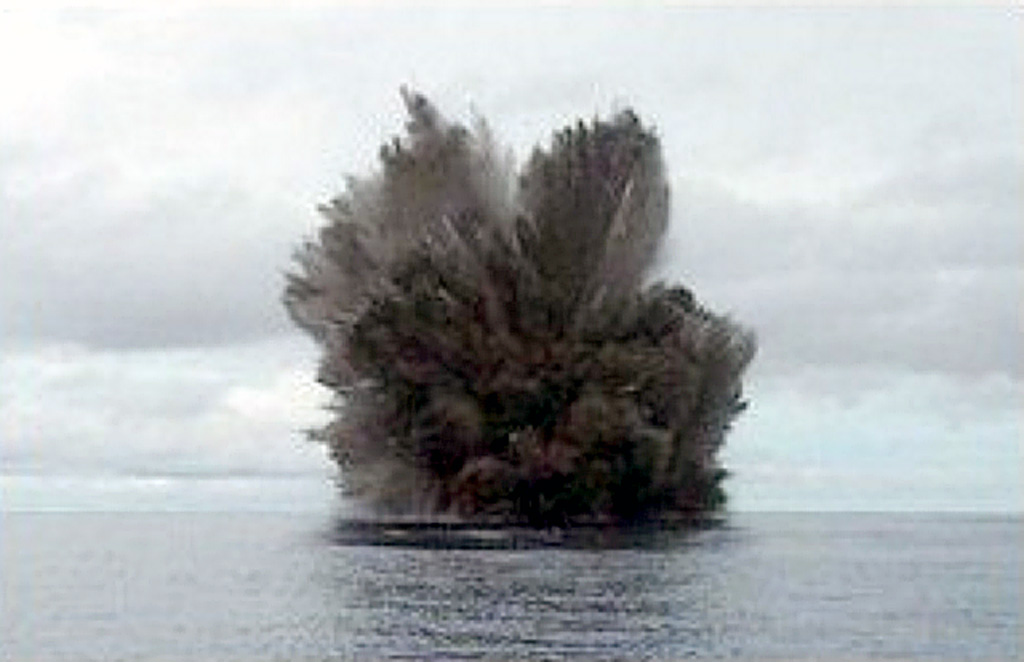 Kavachi KavachiSolomon Volcanic Province |
Kavachi erupted daily during August through mid-September. During August ash and volcanic projectiles were observed rising 400 m above sea level and the glow from the volcano was visible from the coast of Gatokae Island, 32 km away. Source: The Wilderness Lodge |
Kīlauea (United States) | 26 September-2 October 2001 | Continuing Eruptive Activity
|
|
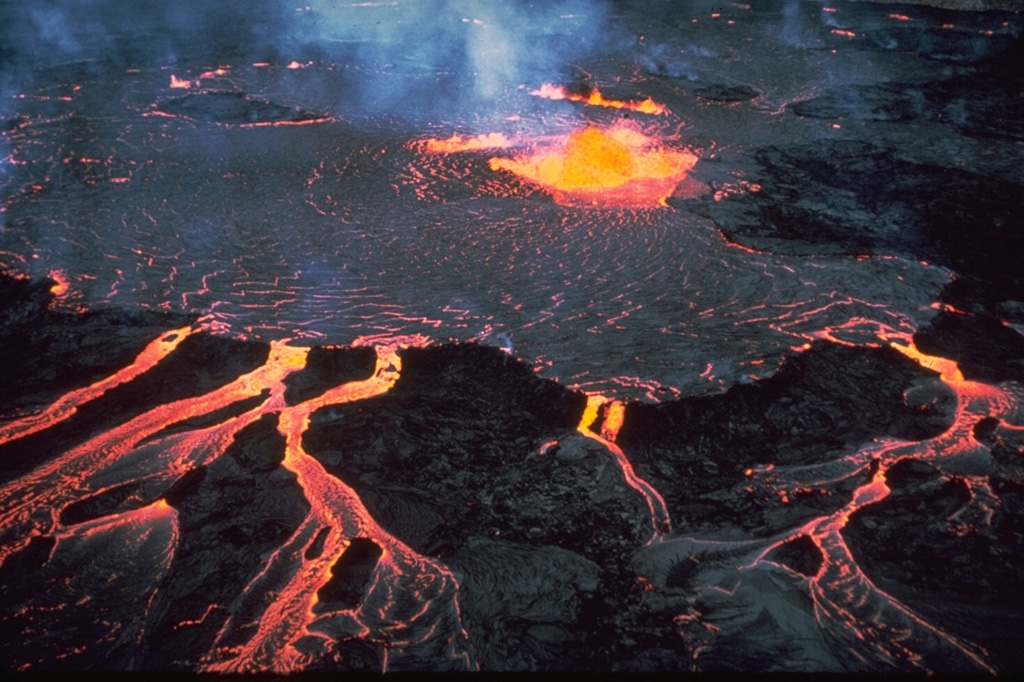 Kīlauea KīlaueaHawaiian-Emperor Hotspot Volcano Group |
Lava flows from the W of the active flow field began to enter the ocean at a new area during the evening of 28-29 September. The ocean entry was located S of the former site of Komoamoa camping area. By 30 September a new lava bench and an adjacent black sand beach had begun to form. Lava continued to flow into the ocean at the E Kupapaʻu entry, although the overall size of the entry had diminished. Surface lava flows were visible above and on the Pūlama pali scarp. The lava flows W and E of the flow field that had been active for the past couple of weeks had mostly crusted over. Generally, volcanic tremor remained at moderate-to-low levels at Kīlauea's summit and Puʻu ʻŌʻō. Background tremor at Puʻu ʻŌʻō was interrupted at intervals of ten's of minutes to an hour or two, by short-lived bursts of relatively vigorous tremor. Tiltmeters across the volcano showed no significant deformation. Source: US Geological Survey Hawaiian Volcano Observatory (HVO) |
Manam (Papua New Guinea) | 26 September-2 October 2001 | Continuing Eruptive Activity
|
|
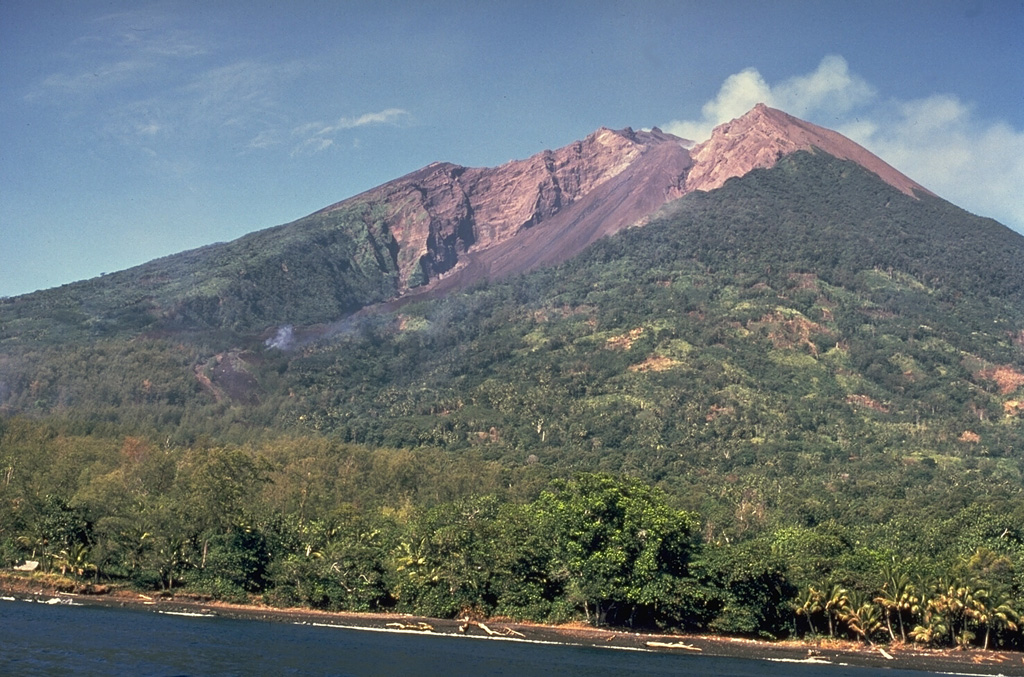 Manam ManamBismarck Volcanic Arc |
Volcanic activity at Manam during September was very low. Occasional emissions of weak-to-moderate volumes of thin white vapor were visible at Main Crater. Southern Crater emitted very small volumes of thin white vapor. Source: Rabaul Volcano Observatory (RVO) |
Merapi (Indonesia) | 26 September-2 October 2001 | Continuing Eruptive Activity
|
|
 Merapi MerapiSunda Volcanic Arc |
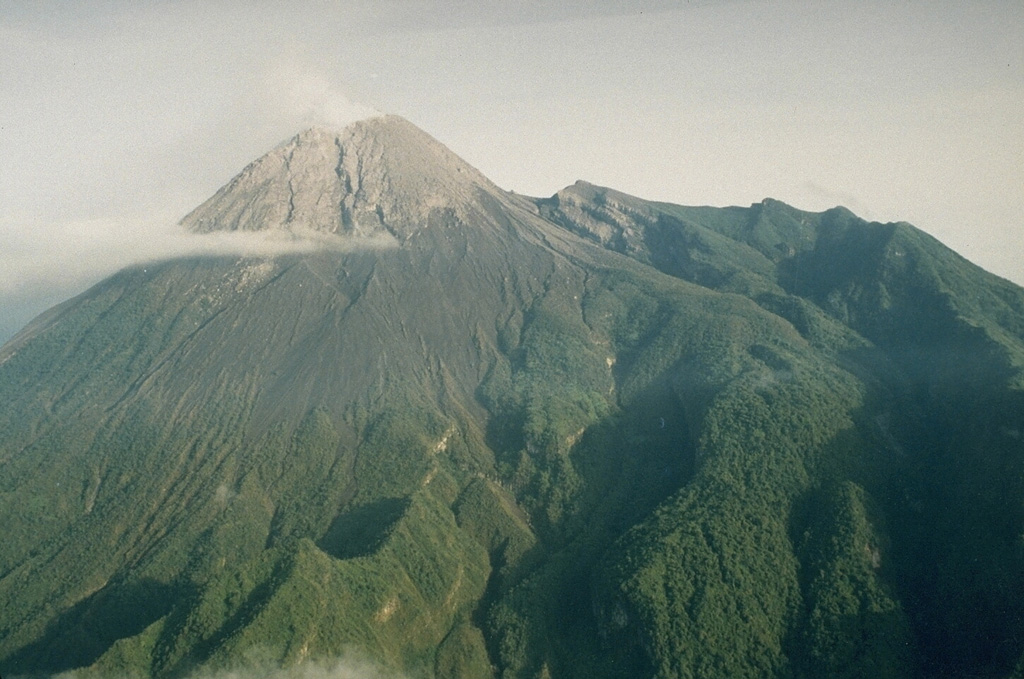
During 17-30 September incandescent lava avalanches traveled SW primarily down the Lamat, Senowo, and Bebeng rivers to a maximum run-out distance of 2.5 km. During 17-23 September 51 lava avalanches were observed. Temperatures at Gendol Crater increased from 590-595 ºC the previous week to 602-617 ºC during 17-23 September and to 598-618 ºC during 24-30 September. Avalanche earthquakes, which dominated the seismicity, increased in comparison to the previous week. Source: Pusat Vulkanologi dan Mitigasi Bencana Geologi (PVMBG, also known as CVGHM) |
Popocatépetl (Mexico) | 26 September-2 October 2001 | Continuing Eruptive Activity
|
|
 Popocatépetl PopocatépetlTrans-Mexican Volcanic Arc |
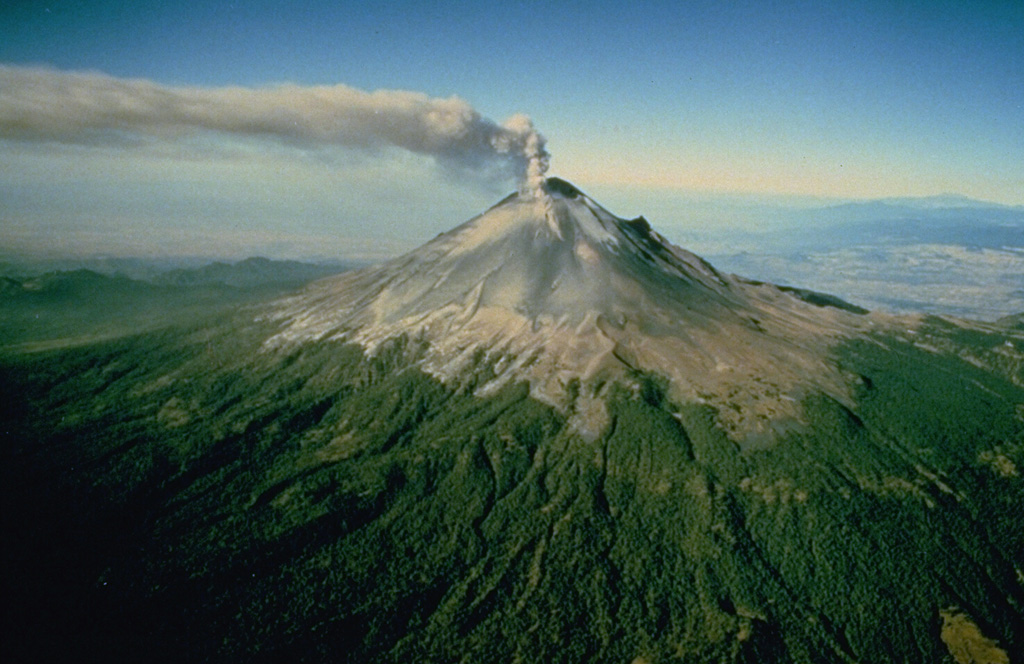
During the week, volcanic activity at Popocatépetl consisted of small emissions of steam, gas, and minor amounts of ash, and episodes of harmonic tremor. Pilots reported that a steam emission rose 4 km above the volcano on 26 September at 1000. Source: Centro Nacional de Prevencion de Desastres (CENAPRED) |
Rabaul (Papua New Guinea) | 26 September-2 October 2001 | Continuing Eruptive Activity
|
|
 Rabaul RabaulBismarck Volcanic Arc |
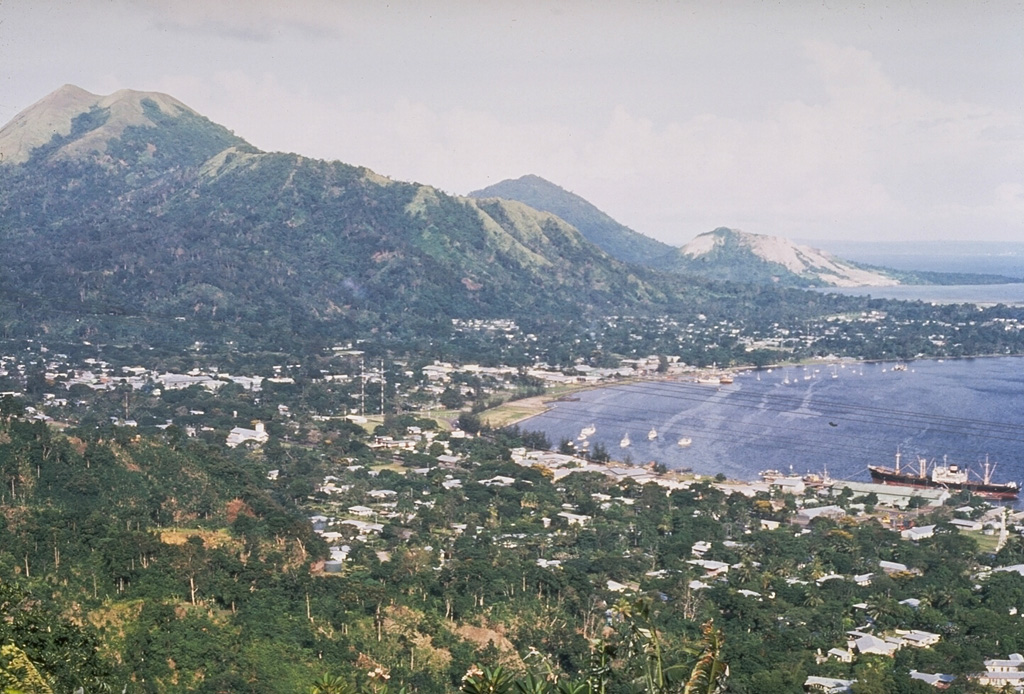
During 10-30 September summit activity at Tavurvur, a stratovolcano of the Rabaul Caldera, was very low. During the report period very small-to-moderate amounts of steam were emitted from the active vent and low-frequency volcanic earthquakes decreased. After the 11th seismic activity was relatively low, except for a slight increase on the 16th. Very slow deflation began on 20 September. Source: Rabaul Volcano Observatory (RVO) |
Semeru (Indonesia) | 26 September-2 October 2001 | Continuing Eruptive Activity
|
|
 Semeru SemeruSunda Volcanic Arc |
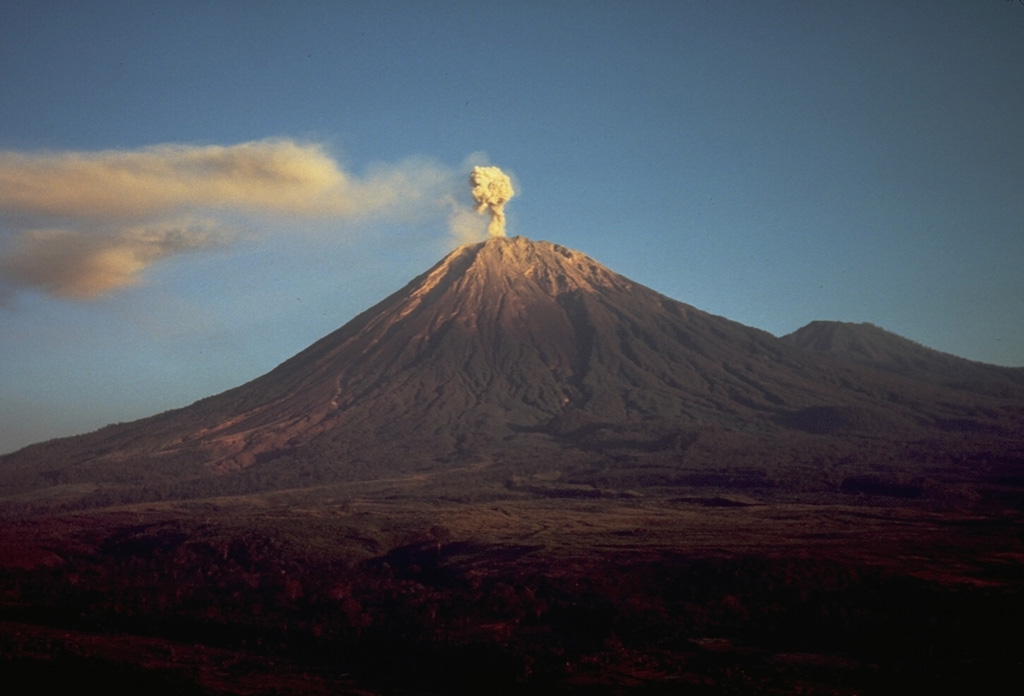
According to the Darwin VAAC, a pilot reported observing an ash plume rising 1-4 km above Semeru on 1 October at 1457. No ash was visible in satellite imagery, possibly due to low-level meteorological clouds obscuring the plume. |
Soufrière Hills (United Kingdom) | 26 September-2 October 2001 | Continuing Eruptive Activity
|
|
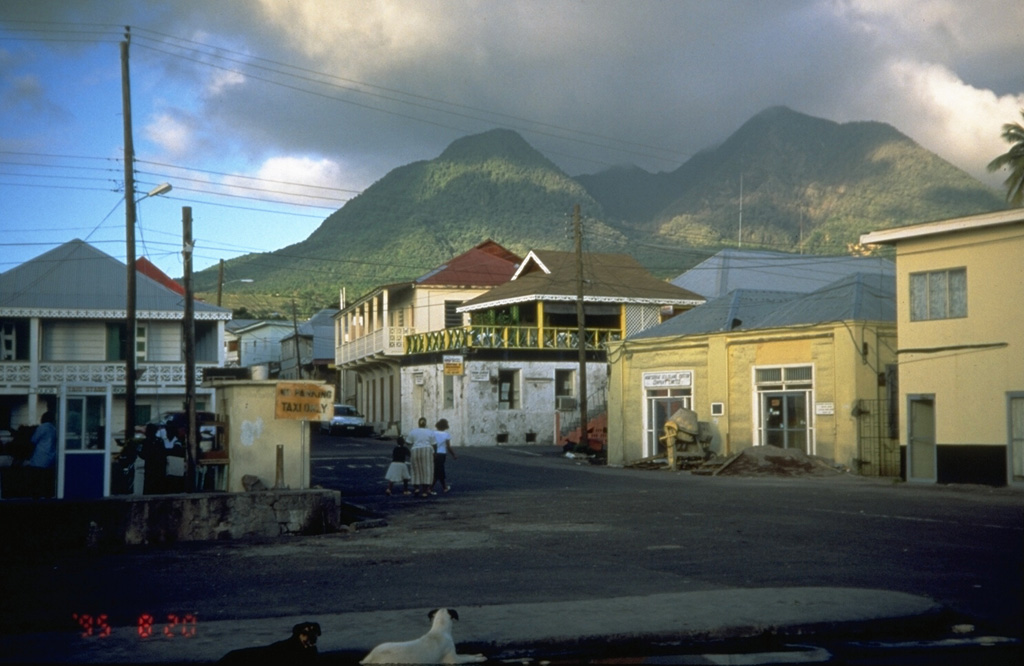 Soufrière Hills Soufrière HillsLesser Antilles Volcanic Arc |
Volcanic activity at Soufrière Hills during 21-28 September was similar to the previous week, except for a slight reduction in the number of hybrid earthquakes. Seismicity continued to be dominated by bands of hybrid earthquake swarms and increased rockfall activity with periodicities of approximately 11 to 13 hours. The active lava dome continued to grow at a moderate rate, producing rockfalls and small but energetic pyroclastic flows that traveled E to the upper reaches of the Tar River Valley. Periods of vigorous ash venting were associated with the hybrid-earthquake swarms. Steam-and-ash clouds were visible on satellite imagery rising to ~500 m above the volcano. Sources: Washington Volcanic Ash Advisory Center (VAAC), Montserrat Volcano Observatory (MVO) |
Tungurahua (Ecuador) | 26 September-2 October 2001 | Continuing Eruptive Activity
|
|
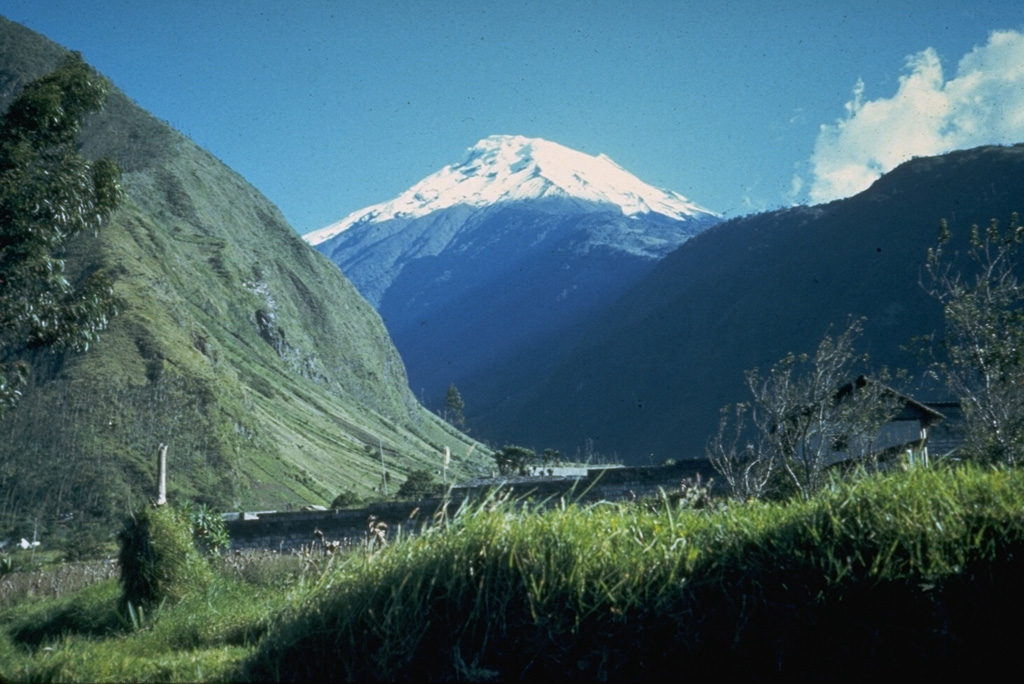 Tungurahua TungurahuaNorthern Andean Volcanic Arc |
On 24 September at 1500 an eruption at Tungurahua produced an ash cloud that rose ~2 km above the volcano and drifted to the W and SW. Roaring and the sound of rockfalls were heard in several towns near the volcano. An eruption on 25 September at 1230 produced a mushroom-shaped ash cloud that rose 5 km above the volcano. The lower portion of the plume drifted to the NW, while the higher portion remained fixed. Ash fell in the town of Cotaló. During the evening of the 25th Strombolian activity was observed, with rockfalls and incandescent volcanic fragments travelling to the W and NW flanks of the volcano. After the eruption volcanic activity consisted of low-level emissions of steam, gas, and ash. Small amounts of ash fell in southern Quero. Sources: Instituto Geofísico-Escuela Politécnica Nacional (IG-EPN), Washington Volcanic Ash Advisory Center (VAAC) |
Ulawun (Papua New Guinea) | 26 September-2 October 2001 | Continuing Eruptive Activity
|
|
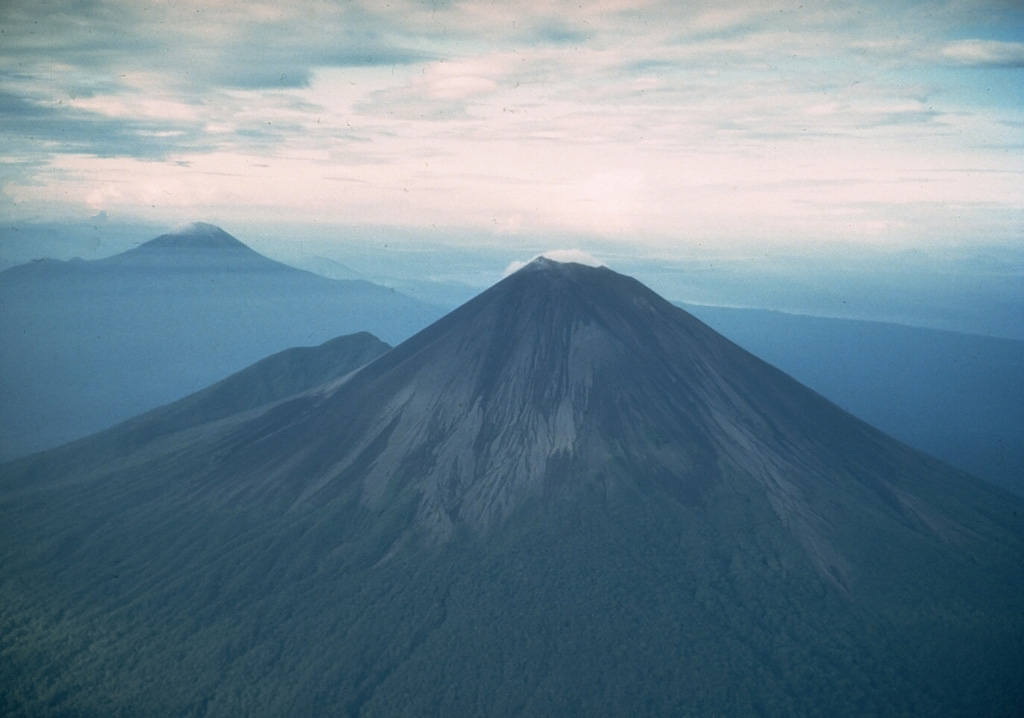 Ulawun UlawunBismarck Volcanic Arc |
Volcanic tremor occurred at Ulawun on 24 September at 2200 through 30 September. After the tremor peaked on the 27th at about 1000 it fluctuated as it generally declined. By 30 September seismic activity was at moderate levels. During 27-30 September a very slow deflationary trend was detected. Source: Rabaul Volcano Observatory (RVO) |
Since the Weekly Volcanic Activity Report began in November 2000, there have been 22,859 individual reports over 1,335 weeks (average of 17 per week) on 351 different volcanoes.
Use the dropdowns to choose the year and week for archived Weekly Reports.
The RSS (Really Simple Syndication) feed is identical to the Weekly Volcanic Activity Report minus some features including the header information (latitude and longitude and summit elevation), the Geological Summary, and a link to the GVP volcano profile page. At the end of each report is a list of the sources used. Each report includes a link from the volcano's name back to the more complete information on the GVP website.
The CAP (Common Alerting Protocol) feeds are XML files specifically formatted for disaster management. They are similar in content to the RSS feed, but contain no active links.
Loading the network link into Google Earth will automatically load placemarks for volcanoes in the current weekly report. Placemark balloons include the volcano name, report date, report text, sources, and links back to the GVP volcano profile page and to the complete Weekly Report for that week.
 Download Smithsonian / USGS Weekly Volcanic Activity Report Network RSS Feed
Download Smithsonian / USGS Weekly Volcanic Activity Report Network CAP Feed
Download Smithsonian / USGS Weekly Volcanic Activity Report Network Link
The Weekly Volcanic Activity Report does not necessarily include all volcanic activity that occurred on Earth during the week. More than a dozen volcanoes globally have displayed essentially continuous eruptive activity for decades or longer, and such routine activity is typically not reported here. Submarine activity is reported when information is available. The Weekly Volcanic Activity Report summarizes volcanic activity that meets one or more of the following criteria:
- A volcano observatory raises or lowers the alert level at the volcano.
- A volcanic ash advisory has been released by a volcanic ash advisory center (VAAC) stating that an ash cloud has been produced from the volcano.
- A verifiable news report of new activity or a change in activity at the volcano has been issued.
- Observers have reported a significant change in volcanic activity. Such activity can include, but is not restricted to, pyroclastic flows, lahars, lava flows, dome collapse, or increased unrest.
Reports categorized as "Activity (New)" indicate eruptive activity that has occurred after at least 3 months of quiescence. Once a volcano is included in this section, updates will remain on that list unless the activity continues for more than 1 month without escalating, after which time updates will be listed in the "Activity (Continuing)" section. Reports are included in the "Unrest" sections (New or Continuing) if the volcano is undergoing non-eruptive activity such as seismicity or deformation that is unusually high for that volcano or is increasing. The "Other" category includes non-eruptive and non-unrest reports, such as Alert Level decreases or previous ash deposits resuspended by winds. Reports through 2025 were only divided into "New Activity/Unrest" and "Continuing Activity", which have been automatically converted to the "Activity (New)" and "Activity (Continuing)" groups, respectively, without a review of content that might change the category to "Unrest" or "Other".
It is important to note that volcanic activity meeting one or more of these criteria may occur during the week, but may not be included in the Weekly Volcanic Activity Report because we did not have the relevant information at the time.
1. The Weekly Volcanic Activity Report is intended to provide timely information about global volcanism on a weekly basis. Consequently, the report is generated rapidly by summarizing volcanic reports from various sources, with little time for fact checking. The accuracy of the Weekly Volcanic Activity Report is dependent upon the quality of the volcanic activity reports we receive. Reports published in the Bulletin of the Global Volcanism Network are cover longer time periods and are more carefully reviewed, although all of the volcanoes discussed in the Weekly Volcanic Activity Report are not necessarily reported in the Bulletin. Reports are updated on the Weekly Volcanic Activity Report web page as they are received, therefore information may be included regarding events that occurred before the current report period.
2. Rapidly developing events lead to coverage that is often fragmentary. Volcanoes, their eruptions, and their plumes and associated atmospheric effects are complex phenomena that may require months to years of data analysis in order to create a comprehensive summary and interpretation of events.
3. Preliminary accounts sometimes contain exaggerations and "false alarms," and accordingly, this report may include some events ultimately found to be erroneous or misleading.
4. Many news agencies do not archive the articles they post on the Internet, and therefore the links to some sources may not be active. To obtain information about the cited articles that are no longer available on the Internet contact the source.
5. USGS Disclaimer Statement for this Website:
Information presented on this website is considered public information and may be distributed or copied. Use of appropriate byline/photo/image credit is requested. We strongly recommend that USGS data be acquired directly from a USGS server and not through other sources that may change the data in some way. While USGS makes every effort to provide accurate and complete information, various data such as names, telephone numbers, etc. may change prior to updating. USGS welcomes suggestions on how to improve our home page and correct errors. USGS provides no warranty, expressed or implied, as to the accuracy, reliability or completeness of furnished data.
Some of the documents on this server may contain live references (or pointers) to information created and maintained by other organizations. Please note that USGS does not control and cannot guarantee the relevance, timeliness, or accuracy of these outside materials.
For site security purposes and to ensure that this service remains available to all users, this government computer system employs software programs to monitor network traffic to identify unauthorized attempts to upload or change information, or otherwise cause damage. Unauthorized attempts to upload information or change information on this website are strictly prohibited and may be punishable under the Computer Fraud and Abuse Act of 1986 and the National Information Infrastructure Protection Act. Information may also be used for authorized law enforcement investigations. (Last modified September 21, 1999.)
U.S. Department of the Interior, U.S. Geological Survey, Reston, VA, USA
URL: https://volcano.si.edu/reports_weekly.cfm

 Cite this Report