The Rabaul Volcano Observatory (RVO) reported that activity at Ulawun was low during 1-20 August. Summit emissions occasionally observed during periods of clearer weather were characterized as white with variable densities; weather clouds obscured views of the summit on most days. There were reports of brief periods of minor summit incandescence observed from the Bakada and Likuranga areas to the NE, but those observations were unconfirmed. Seismicity was dominated by small low- and high-frequency volcanic earthquakes, with low-frequency earthquakes being the dominant signal. Occasionally periods of low-level volcanic tremors were recorded by the seismic network, lasting between one hour and several hours. The Alert Level remained at Stage 1 (the lowest level of a four-stage scale).
Source: Rabaul Volcano Observatory (RVO)
Short explosion on 28 March with minor ashfall on nearby villages; renewed activity in mid-July 2023
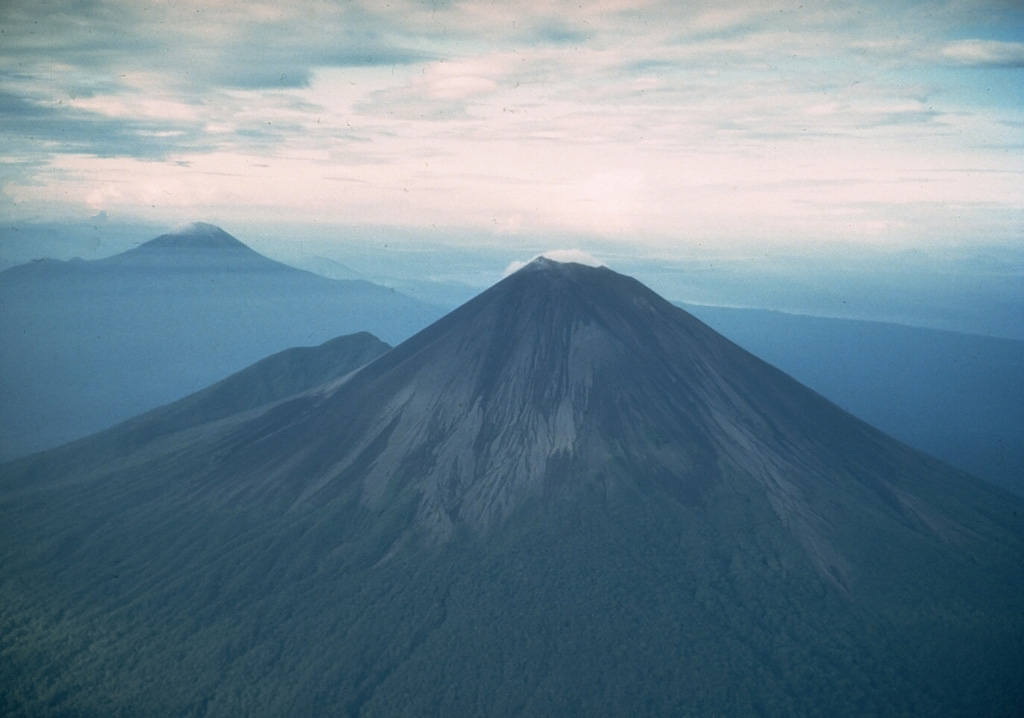
Ulawun is a basaltic-to-andesitic stratovolcano on the island of New Britain, Papua New Guinea, that has been erupting since at least 1700. There have been frequent relatively short eruptions since 2012, with activity including explosions with ash plumes rising as high as 19 km (or 17 km above the summit), lava fountaining and flows, incandescence, brief thermal anomalies, sulfur dioxide emissions, gas-and-steam emissions, and increased seismicity (BGVN 44:09, 44:12). This report covers activity from July 2022 through July 2023 and is based on information from the Rabaul Volcano Observatory (RVO), the Darwin Volcanic Ash Advisory Centre (VAAC), and satellite data.
Thermal anomalies within the summit crater were detected in Sentinel-2 imagery on 19 July, 13 August, 23 August, 2 September, and 12 October 2022, but RVO reported no visible activity through that period. Anomalies were often absent during other days with clear views through July 2023. A single-day eruption took place on 28 March 2023 and then the start a new eruption period began in mid-July 2023.
Activity during March 2023. RVO reported a short explosion during 0408-0425 on 28 March, based on seismic data. A local volcano observer reported minor ashfall in areas to the NW including Ubili village, and the Ulamona Mission, Saltamana, and Ibana Village Oil Palm areas. According to the Darwin VAAC, at 0600 an ash plume was visible in a satellite image drifting W at an altitude of 3.4 km; the plume had dissipated by 1000. Thereafter, seismicity decreased, although weak high-frequency volcanic earthquakes were recorded, and tremor continued through 31 March. Steam plumes of variable densities rose above the summit. Prior to this explosion, small sulfur dioxide plumes were identified during 14-23 March.
Activity during July 2023. Low levels of seismicity were reported by RVO during 1-16 July, consisting of small, discrete, low-frequency earthquakes and occasional small high-frequency volcano-tectonic earthquakes. Late on 16 July RSAM values increased from 50 up to 500, climbing at a slow, erratic rate to 610 through 0500 on 18 July. During 0500-0700 the values dropped to 400-500, though peaks as high as 1,600 were recorded, but by 0700 values had decreased to 300 and remained steady. Minor ash emissions began on 18 June and during the morning of 19 July brown-to-gray emissions with low ash content were rising a few hundred meters about the crater rim and drifting SE.
During 20-25 July steam-and-gas plumes containing up to moderate amounts of ash rose from the summit crater and caused minor ashfall downwind in various directions, but mainly NW. Occasional ash emissions during 25-26 July drifted SE. Sulfur dioxide emissions were detected in satellite images on 21 and 24 July. Moderate seismicity was variable and was dominated by volcanic tremors. RSAM values between 22 and 25 July ranged between 380 and 800. The Alert Level was raised to Stage 2 (the second highest on the four-level scale).
Information Contacts: Rabaul Volcano Observatory (RVO), Geohazards Management Division, Department of Mineral Policy and Geohazards Management (DMPGM), PO Box 3386, Kokopo, East New Britain Province, Papua New Guinea; Darwin Volcanic Ash Advisory Centre (VAAC), Bureau of Meteorology, Northern Territory Regional Office, PO Box 40050, Casuarina, NT 0811, Australia (URL: http://www.bom.gov.au/info/vaac/); Global Sulfur Dioxide Monitoring Page, Atmospheric Chemistry and Dynamics Laboratory, NASA Goddard Space Flight Center (NASA/GSFC), 8800 Greenbelt Road, Goddard, Maryland, USA (URL: https://SO2.gsfc.nasa.gov/); Sentinel Hub Playground(URL: https://www.sentinel-hub.com/explore/sentinel-playground).
2025: March
| April
| August
2024: January
| November
2023: March
| July
| August
| September
| October
| November
| December
2022: June
2021: July
| October
| November
2020: January
2019: June
| July
| August
| September
| October
2018: June
| September
| October
2017: June
| August
| September
| October
| November
2016: October
| November
2014: January
2013: July
| September
| November
| December
2012: May
| November
| December
2011: February
| May
2010: February
| May
| June
| July
| August
| November
2009: May
2008: June
| July
2007: January
| April
| December
2006: March
| April
| May
| August
| November
| December
2005: March
| April
| May
| June
| August
| November
2004: April
| June
| August
2003: February
| April
| May
| June
| September
| October
2002: February
| August
| September
| October
2001: January
| April
| May
| July
| September
| October
The Rabaul Volcano Observatory (RVO) reported that activity at Ulawun was low during 1-20 August. Summit emissions occasionally observed during periods of clearer weather were characterized as white with variable densities; weather clouds obscured views of the summit on most days. There were reports of brief periods of minor summit incandescence observed from the Bakada and Likuranga areas to the NE, but those observations were unconfirmed. Seismicity was dominated by small low- and high-frequency volcanic earthquakes, with low-frequency earthquakes being the dominant signal. Occasionally periods of low-level volcanic tremors were recorded by the seismic network, lasting between one hour and several hours. The Alert Level remained at Stage 1 (the lowest level of a four-stage scale).
Source: Rabaul Volcano Observatory (RVO)
The Rabaul Volcano Observatory (RVO) reported that activity at Ulawun was low during 7-25 April. Summit emissions were white and had variable densities. On some days there were no emissions. Brief low rumbling sounds were heard during 15-16 and 19 April. In general seismicity was low, though slightly higher that background (RSAM values of 100-200). Data from the seismic station (UULA), 2.8 km from the summit on the lower WSW flank, was characterized by both low- and high-frequency volcanic earthquakes, with low-frequency earthquakes being the dominant signal. Brief surges in seismicity activity occasionally occurred and consisted of changes from discrete low- and high-frequency earthquakes to low-level, continuous volcanic tremors that lasted between several minutes and less than few hours. The Alert Level was at Stage 1 (the lowest level of a four-stage scale).
Source: Rabaul Volcano Observatory (RVO)
The Darwin Volcanic Ash Advisory Centre (VAAC) reported that a possible ash plume at Ulawun was observed by a pilot at 0730 on 21 April and rose to 3.7 km (12,000 ft) a.s.l. and drifted S. Weather clouds obscured satellite views.
Source: Darwin Volcanic Ash Advisory Centre (VAAC)
The Rabaul Volcano Observatory (RVO) reported that activity at Ulawun was low during 1-7 April. Summit emissions were characterized as white, having variable densities, and containing small amounts of ash. The plumes drifted S and caused minor ashfall in areas within a few kilometers to the S and SW of the volcano. Low rumbling noises were heard in those same areas on 1 and 4 April. Seismicity generally remained low. The seismic station (UULA), 2.8 km from the summit on the lower WSW flank, recorded small low- and high-frequency volcanic earthquakes, with low-frequency earthquakes being the dominant signal. Starting at about 0800 on 4 April the seismic signals quickly changed to continuous volcanic tremor and the tremor amplitude grew relatively rapidly. The tremor lasted about 5.5 hours, reverting to discrete seismic signals at around 1720. The station ceased being operational at around 1900. The two other seismic stations, UALB (5.6 km) and UULB (10 km NW), did not detect the seismicity due to their distance from the volcano and high levels of cultural noise that obscured signals. RVO noted that a team from the West New Britain Provincial Disaster Office had been conducting community awareness activities within 10 km of Ulawun since 27 March, so far visiting the Ulamona area (10 km NW), Navo, Noau, Voluvolu, Bakada, Sabalbala, Vamakuma, Bago, Kabaia, Soi, and Sohula care center.
Source: Rabaul Volcano Observatory (RVO)
The Rabaul Volcano Observatory (RVO) reported that at 0800 on 27 March a dense, dark-gray ash plume rose 2-3 km above the Ulawun’s summit and drifted S. Two seismic stations, located 10 km NW and 6 km from the volcano, indicated that seismicity remained low, though small, low-frequency earthquakes within background noise were detected by both stations. Increase seismicity was detected at the station 10 km NW in Real-time Seismic-Amplitude Measurement (RSAM) data 1-2 hours before the eruptive event, peaked about 30 minutes after the event, and then decreased to near-background levels about three hours later. RVO noted that the ash event was likely over, though seismic data suggested that there was a low probability that small ash plumes could sometimes occur. Continuous low rumbling was heard on 28 March. During 28 March-1 April activity was low and diffuse plumes contained ash but over the week changed to only white steam plumes.
Operations were restored at the third, and primary, seismic station (UULA) 2.8 km from the summit, on the lower WSW flank, on 28 March. The station immediately began recording small low- and high-frequency volcanic earthquakes, with low-frequency earthquakes being the dominant signal. Both the number and magnitude of both types of earthquakes increased on 1 April.
Source: Rabaul Volcano Observatory (RVO)
The Rabaul Volcano Observatory (RVO) reported that seismicity at Ulawun was low during 1-19 November, dominated by very small low-frequency earthquakes occurring at short intervals. Seismicity increased on 19 November and remained elevated during the rest of the month. High-frequency volcano-tectonic earthquakes began to occur at around 1300 on 19 November; the number of those events increased at 1645 and again at 0000 on 20 November. At around 1800 on 20 November low-amplitude non-harmonic volcanic tremor emerged and a slight increase in the amplitude of those signals began a couple of hours later. Seismicity fluctuated at elevated levels until 0900 on 28 November; during brief periods of reduced tremor, distinct, high-frequency, volcano-tectonic events were evident. RVO recommended a declaration of Alert Level Stage 1 (the lowest level of a four-stage scale).
Source: Rabaul Volcano Observatory (RVO)
The Rabaul Volcano Observatory (RVO) reported that seismicity at Ulawun increased at around 1600 on 19 November and was characterized as an increase in the magnitude of events resembling volcano-tectonic signals. Signals indicating volcanic tremors increased at around 1830 on 20 November, increased again at around 2015, and then slightly decreased and continued at that level. RVO recommended a declaration of Alert Level Stage 1 (the lowest level of a four-stage scale).
Source: Rabaul Volcano Observatory (RVO)
Rabaul Volcano Observatory (RVO) reported that activity at Ulawun was low during 6 December 2023-9 January 2024. During periods of good visibility white steam plumes of variable densities were seen rising from the summit crater. On 19 December visibility was poor, though during a brief clear period, observers noted brown-tinged steam plumes. On 31 December residents of Noau Village photographed dense brown ash plumes rising a few hundred meters above the summit and drifting W, and a small pyroclastic flow descending the NNE flank. The Alert Level remained at Stage 1 (on the four-level scale).
Source: Rabaul Volcano Observatory (RVO)
According to the Darwin VAAC a webcam image at Ulawun showed a pyroclastic flow descending a flank at 1230 on 31 December. An ash plume possibly rose to 2.7 km (9,000 ft) a.s.l. and drifted NE based on similar previous plumes and weather models; weather clouds prevented satellite views.
Source: Darwin Volcanic Ash Advisory Centre (VAAC)
According to ReliefWeb, the U.S. Agency for International Development (USAID) reported that the 20 November eruption at Ulawun resulted in five deaths and the evacuation of more than 16,000 people, with many more affected, as of 9 December. Ashfall from the eruption impacted oil palm trees, water sources, household gardens, and nearby properties.
Source: ReliefWeb
Rabaul Volcano Observatory (RVO) reported that white steam plumes and occasional puffs of ash rose from Ulawun’s summit crater during 22-24 November, though weather clouds hindered views during 23-24 November. Lava continued to flow from a new fissure vent that had opened on the SW flank, near the vent that had formed in 2019. The intensity of the incandescence from the flow decreased during 23-24 November, suggesting that effusion may have slowed. Seismicity remained at background levels. The Alert Level remained at Stage 2 (on the four-level scale).
Source: Rabaul Volcano Observatory (RVO)
Rabaul Volcano Observatory (RVO) reported that the eruption at Ulawun continued to intensify in November and culminated in a larger event during 20-21 November. During 3-18 November white gas-and-steam plumes of variable densities rose from the summit crater. Low-level booming noises were reported on 9 November. Crater incandescence was observed nightly and fluctuated between dull and moderately bright; the most intense incandescence was observed during 10-11 November. Seismicity was at low-to-moderate levels and characterized by continuous, low-level volcanic tremors often punctuated by periods of small-to moderate discrete low-frequency volcanic earthquakes that evolved into sub-continuous volcanic tremors.
Small ash emissions were observed on 19 November. Seismicity began to intensify at around 0200 on 20 November and then again at 0930. The ash emissions increased to moderate levels and eruption noises were heard between 1430-1500. The Alert Level was raised to Stage 3 (on the four-level scale). The ash plumes drifted W and NW, causing ashfall in Navo. The eruption significantly intensified during 1530-1600 and continued at high levels. According to the Darwin VAAC ash plumes rose as high as 9.1 km (30,000 ft) a.s.l. at 1600 and drifted SW. Ash plumes had risen to 15 km (50,000 ft) a.s.l. by 1630 and spread almost 65 km W by 1720.
The Alert Level was raised to Stage 4. Continuous ash plumes obscured the summit area and by 1800 ashfall was reported in the Ulamona Mission area. A photo taken at 1807 showed incandescent material being ejected above the summit and a dark, dense ash plume rising from the crater. Ashfall was significant in areas to the N and NW and absent in areas to the N and E. Roaring and booming noises continued. Residents of Ubili and Ulamona Mission Station moved to Kabaya and Koasa, and Noau and Voluvolu residents moved to Bakada. Video and photos posted on social media showed tall lava fountaining at the summit and a pyroclastic flow descending the NW flank.
Ash plumes continued to obscure the summit along with darkness from 2200 on 20 November to 0200 on 21 November, though the intensity of the eruption had declined. The VAAC continued to report a sustained ash plume rising to 15 km; by 0320 on 21 November ash had drifted as far as 520 km W. By 0450 the VAAC noted that ash had reached the stratosphere, rising to 18.2 km (60,000 ft) a.s.l. and drifting 75 km SE; ash at 15 km continued to drift W. Dark, dense ash emissions rose from the summit crater during 0200-1300 but were less intense. The Alert Level was lowered to Stage 3, but RVO also noted that at 0700 one of the two seismic stations had stopped working, making monitoring even more difficult. Low roaring and booming continued, and ash continued to fall mainly to the W and NW, affecting infrastructure and crops. By sunrise the view from the observation post to the summit was blanketed by ash; dense ash obscured views of the summit and flanks. RVO also noted that pyroclastic flows had likely descended the N, and possibly the SE, flanks during the early part of the eruption the day before. The VAAC reported that sustained ash plumes continued, though by 1630 they were rising to 12.2 km (40,000 ft) a.s.l. and drifting W while the ash at 18.2 km continued to drift E.
During 1300-1400 ash emissions significantly decreased, allowing confirmation of a fissure vent on the SW flank at around 1,000-1,400 m elevation about 1 km SE of the 2019 fissure vent. Webcam images suggested that the lava effusion rate from the fissure was high, and that flows had descended possibly to 400 m elevation. Minor incandescent at the summit was visible as well as on the NW flank, possibly from a pyroclastic flow. Several centimeters of ash and scoria had accumulated on rooftops in areas to the N and NW. Minor ashfall was reported in Kimbe. By 2240 the VAAC stated that the ash at 18.2 km was no longer discernable in satellite images.
RVO reported that during 2100 on 21 November to 0600 on 22 November the eruption was at low levels with only minor amounts of ash being emitted, though lava continued to effuse from the fissure. Summit incandescence was no longer visible by 0319. A few ash puffs were visible during 0600-0800 and then the summit was obscured by weather clouds. The Alert Level was lowered to Stage 2.
Sources: Rabaul Volcano Observatory (RVO); Darwin Volcanic Ash Advisory Centre (VAAC); Reuters; Lekei Kilala
Rabaul Volcano Observatory (RVO) reported that diffuse white plumes rose from Ulawun’s summit crater on 1 November. A low booming noise was heard at 1945. Minor crater incandescence began to be visible later that day at around 2100 and was observed until sunrise. White emissions were visible early on 2 November but by the afternoon clouds of gray-to-brown ash were occasionally observed when weather permitted observations. Crater incandescence was again visible at nightfall but was more intense than the previous night and remained visible until sunrise. Seismicity was dominated by low-level volcanic tremor. Small, low-frequency earthquakes occurring at long intervals began to be recorded at some point before 2300 on 1 November; an increase in both magnitude and frequency occurred after 2300 and the signal again intensified after 0800 on 2 November. Seismicity slightly declined around 0800 on 3 November and remained at those levels at least through noon. The Alert Level remained at Stage 2 (on the four-level scale).
Source: Rabaul Volcano Observatory (RVO)
Rabaul Volcano Observatory (RVO) reported that variable amounts of white steam emissions rose from Ulawun’s summit crater during 1-28 October and drifted SE; small volumes of blue vapor were visible on 18 October. Low-level seismicity, characterized by small continuous volcanic tremors recorded during the last week of September, continued through the first week of October. Small, discrete, low-frequency volcanic earthquakes and short-duration sub-continuous volcanic tremors emerged on 8 October and fluctuated at low-to-moderate levels through 28 October. The pattern of seismicity again changed on 28 October when both low-frequency and high-frequency earthquakes were detected. Though activity was forecasted to remain low, RVO noted that some of the seismic patterns were similar to those observed before the 14 and 25 September eruptions; RVO recommended that the Alert Level be raised to Stage 2 (on the four-level scale).
Source: Rabaul Volcano Observatory (RVO)
Rabaul Volcano Observatory (RVO) reported that diffuse white emissions occasionally rose from the active vent at Ulawun’s summit crater from 1430 on 19 September through most of 25 September. Weather conditions sometimes prevented visual observations. Seismicity was characterized as low during the beginning of the reporting period, dominated by low-level, continuous volcanic tremors that were punctuated by occasional, small, low-frequency, volcanic events. The pattern of seismicity changed just before 1000 on 22 September with the emergence of very distinct, low-frequency volcanic earthquakes and short-duration, sub-continuous, volcanic tremors with increased amplitudes.
The amplitude of the continuous volcanic tremor fluctuated but slowly rose overall until about 1300 on 25 September when the increase became rapid. At around 1739 on 25 September a 4-5-km tall, white-to-pale-gray plume and minor incandescence at the summit vent were visible in webcam images. The incandescence intensified as the evening grew darker. The plume did not change and no ashfall was reported, suggesting low ash content. The incandescence intensified and became distinct in total darkness by 1830. Incandescent lava fragments around the summit crater area and a possible small lava flow on the upper N flank were visible; rumbling and roaring sounds were heard. The eruption was over by 2000. RSAM values peaked at 6,000 during the eruption; at the end of the activity seismicity decreased rapidly and was characterized by low levels of volcanic tremor. The Alert Level remained at Stage 1 (the lowest level on the four-level scale).
Source: Rabaul Volcano Observatory (RVO)
Rabaul Volcano Observatory (RVO) reported a small eruption at Ulawun during 14-15 September. Minor incandescence at the summit crater was first visible at around 2107 on 14 September from Ulamona Observatory. The incandescence intensified, and eruption plumes reflecting the glow were visible in webcam images drifting NE. Starting at about 0004 and lasting to about 0800 on 15 September there were brief periods when the plumes appeared darker, likely due to denser and more intense emissions. The plumes drifted W and WSW. Rumbling noises were reported, though they became less frequent by 0800. The Alert Level was raised to Stage 2 (the second level on the four-level scale).
Staff from the West New Britain Provincial Disaster Office conducted a field inspection on 15 September and found only minor ashfall around the volcano. During 0800 on 15 September to 1430 on 19 September the volcano was quiet; small volumes of diffuse white emissions sometimes rose from the summit and drifted W and WSW. On 19 September RVO recommended that the Alert Level should be lowered to Stage 1.
Increased seismicity coincided with the eruption. During most of 14 September RSAM values were 200-300, though they began to increase at about 1955 and reached a value of around 800 by midnight. RSAM continued to increase; values reached 1,600 by 0100 on 15 September, rapidly increased during 0100-0200, and reached a value of 4,060 almost two hours later at 0300. Seismicity was dominated by continuous low-frequency volcanic tremors. Seismicity began to decline at 0700, reached background levels by 0900, and remained low with values of 200-450. During 16-19 September seismicity was characterized by low level volcanic tremors with sporadic occurrences of discrete, small, low-frequency volcanic events. RSAM values were around 200.
Source: Rabaul Volcano Observatory (RVO)
Rabaul Volcano Observatory (RVO) reported that small-to-moderate volumes of white steam-and-gas plumes were visible in webcam images rising from Ulawun’s summit during 4-6 August. On the rest of the days through 12 August weather conditions mostly prevented views of the summit. No audible sounds or nighttime crater incandescence were reported. RSAM fluctuated during 4 July-12 August but overall showed an upward trend and corresponded to an increase in volcanic tremor amplitudes. RVO warned that minor eruptive activity may occur if the trend continued and that ash emissions had previously occurred at similar RSAM levels. The Alert Level remained at Stage 1 (the lowest level on the four-level scale).
Source: Rabaul Volcano Observatory (RVO)
Rabaul Volcano Observatory (RVO) reported that small, diffuse, white plumes rose from Ulawun’s summit during 27 July-4 August when there were extended periods of good visibility from the webcam in Ulamona (11-12 km NW). Seismicity fluctuated at moderate levels and was dominated by volcanic tremor; RSAM values ranged from 380 to 800. The Alert Level was lowered to Stage 1 (the lowest level on the four-level scale) on 31 July. Overall, RSAM showed a slow and erratic upward trend during 15 July-4 August and corresponded to an increase in volcanic tremor amplitudes. RVO warned that minor eruptive activity may occur if the trend continued and that ash emissions had previously occurred at similar RSAM levels.
Source: Rabaul Volcano Observatory (RVO)
RVO reported that occasional ash emissions at Ulawun occurred during 25-26 July and drifted SE. Moderate seismicity was variable and was dominated by volcanic tremors. RSAM values ranged between 380 and 800. The Alert Level was raised to Stage 2 (the second highest on the four-level scale) on 27 July.
Source: Rabaul Volcano Observatory (RVO)
RVO reported that minor ash emissions at Ulawun began on 18 July, and during the morning of 19 July brown-to-gray emissions with low ash content were rising a few hundred meters above the crater rim and drifting SE. During 20-25 July steam-and-gas plumes with minor-to-moderate amounts of ash rose from the summit crater and rapidly dispersed. The emissions drifted in various directions, but mainly NW; minor ashfall was reported in areas downwind. Sulfur dioxide emissions were detected in satellite images on 21 and 24 July. Seismicity had begun increasing on 16 July, with RSAM values climbing at a slow but erratic rate, and peaking on 18 July. Afterwards RSAM values decreased and remained at low levels (150-200); seismicity was dominated by continuous volcanic tremors. RSAM values steadily increased to 550 during 0400-1400 on 22 July and fluctuated at moderate levels of 300-350 through 23 July. Values were variable on 24 July between values of 400 to 700. The Alert Level remained at Stage 1 (the lowest level on a four-level scale).
Source: Rabaul Volcano Observatory (RVO)
RVO reported that variable amounts of white steam plumes were visible rising from Ulawun during 1-18 July. Seismicity was low during 1-16 July and consisted of small, discrete, low-frequency earthquakes and occasional small high-frequency volcano-tectonic events. RSAM values generally fluctuated around 50, but during 1800-2300 on 16 July the values increased to 500. The values continued to climb at a slow irregular rate to 610 through 0500 on 18 July, but then dropped to 400-500 during the next two hours (0500-0700), though peaks as high as 1,600 were recorded. By 0700 the values had decreased to 300 and remained steady afterwards. Minor ash emissions began on 18 July and during the morning of 19 July brown-to-gray emissions with low ash content were rising a few hundred meters above the crater rim and drifting SE.
Source: Rabaul Volcano Observatory (RVO)
RVO reported that after a short-lived eruption at Ulawun on 28 March seismicity decreased and was characterized by very low levels of volcanic tremor at least through 31 March. In addition, small high-frequency volcanic earthquakes were recorded mainly during 29-30 March. White steam plumes of variable densities rose above the summit.
Source: Rabaul Volcano Observatory (RVO)
RVO reported a short eruption at Ulawun, during 0408-0425 on 28 March, based on seismic data. A local volcano observer reported minor ashfall in areas to the NW including Ubili village, and the Ulamona Mission, Saltamana, and Ibana Village Oil Palm areas. According to the Darwin VAAC at 0600 an ash plume was visible in a satellite image drifting W at 3.4 km (11,000 ft) a.s.l.; the plume had dissipated by 1000.
Sources: Darwin Volcanic Ash Advisory Centre (VAAC); Rabaul Volcano Observatory (RVO)
RVO reported that at 0820 on 2 June a small eruption at Ulawun produced dense gray ash plumes that rose about 3 km above the summit and drifted NW. The elevated activity lasted 10-15 minutes. Minor ashfall was reported in areas downwind, including in Ulamona Mission and on Lolobau Island. Seismicity increased during the event, then dropped back to lower levels. Diffuse white plumes were visible rising from the summit the next day.
Sources: Rabaul Volcano Observatory (RVO); Darwin Volcanic Ash Advisory Centre (VAAC)
The Darwin VAAC raised the Aviation Color Code for Ulawun to Orange (the second highest level on a four-color scale) on 30 November based on reports of unrest by local observers. The reports described increased seismicity, steam emissions, and a small ash eruption the day before.
Source: Darwin Volcanic Ash Advisory Centre (VAAC)
RVO reported increased unrest at Ulawun. Very small discrete seismic events had been recorded for the past several months by the seismometer located on the SW flank, 5 km from the summit. A small thermal anomaly was identified in satellite images at around 0500 on 3 November. At approximately 0800 RSAM values increased to 100, and by 1115, had risen to 1,400. The values fluctuated between 100 and 1,000 units at least through 1300 when the data was summarized. Tremor was detected on a seismometer at Ulamona, 11-12 km NW from the summit, during periods with higher RSAM values. Steam emissions rose from the crater.
Source: Rabaul Volcano Observatory (RVO)
According to the Darwin VAAC, pilots observed ash plumes from Ulawun on 29 July and 3 August rising 3-3.4 km (10,000-11,000 ft) a.s.l. and drifting E and SSE, respectively. Weather clouds prevented satellite confirmation of the emissions.
Source: Darwin Volcanic Ash Advisory Centre (VAAC)
RVO reported that during 17-31 January white vapor plumes rose from Ulawun’s Main Crater and weak, diffuse white vapor rose from the WSW flank fissure. Lahars were detected mid-month. Seismic activity was low with RSAM values below 200 units. The Alert Level remained at Stage 1.
Source: Rabaul Volcano Observatory (RVO)
RVO reported that during 16-22 December 2019 white vapor plumes rose from Ulawun’s Main Crater with some brief periods of no emissions. Occasional emissions rose from the new WSW flank and along the lava flow. A webcam sometimes recoded nighttime incandescence from the area. Seismic activity was low with RSAM values between 100 and 200 units. The Alert Level remained at Stage 1.
Source: Rabaul Volcano Observatory (RVO)
RVO reported that the fissure eruption on Ulawun’s WSW flank had ceased by 4 October, producing only diffuse white-to-gray steam plumes with a blueish tinge from the main coalesced vent. Weak incandescence from the vent was visible at night on 5 October. The lava-flow rate slowed to 3-5 m a day, likely because it was no longer being fed. RSAM decreased to 1,000 units; regular small high-frequency events were recorded during 4-7 October. RVO recommended that the Alert Level be reduced to Stage 2.
Source: Rabaul Volcano Observatory (RVO)
RVO reported that small, discrete, volcano-tectonic earthquakes at Ulawun began occurring more regularly around 1000 on 30 September; by 1130 they were frequent and by 1220 they were characterized as a swarm. The magnitude of the events overall increased with time and some were felt by residents and accompanied by booming sounds. Events were less frequent and intense during 1730-1930. Sometime afterwards RSAM values erratically increased, reaching a high of 10,000 units between 0130 and 0200 on 1 October. The Alert Level was raised to Stage 2 (the second lowest level on a four-stage scale).
Periods of volcano-tectonic earthquakes slowly transformed into continuous tremor with distinct bursts of high-frequency signals marking discrete volcano-tectonic events during 0430-0500 on 1 October. During this time a new vent opened in a deep valley on the SSW flank at 700 m elevation. The eruption was described as a distinct incandescent glow formed from ejecting material rising less than 100 m above the vent. By dawn light-gray ash plumes were visible rising several hundred meters and drifting NW. Lava fountaining continued throughout the day, and gray ash plumes rose several kilometers above the vent and drifted W. RVO recommended that the Alert Level be raised to Stage 3. On 2 October lava fountains rose several hundred meters and ash-and-steam plumes rose to variable heights between 2 and 5 km, causing ashfall in Navo (W). A lava flow which emerged during the night traveled 1-2 km NW, though visibility was hindered due to weather conditions. Loud rumbling and roaring was noted. Seismicity remained high with RSAM values passing 12,000 units.
Source: Rabaul Volcano Observatory (RVO)
RVO reported that during 7-8 August minor emissions of white vapor rose from Ulawun’s summit crater. Seismicity was dominated by low-level volcanic tremor and remained at low-to-moderate levels. RSAM values fluctuated between 400 and 550 units; peaks did not go above 700.
Source: Rabaul Volcano Observatory (RVO)
RVO reported that during 1-2 August white-to-grayish vapor plumes rose from Ulawun’s summit crater and drifted NW. Incandescence from the summit crater was visible at night and jetting noises were audible for a short interval. RSAM values fluctuated but peaked at high levels. During the night of 2-3 August crater incandescence strengthened and roaring noises became louder around 0400. An eruption began between 0430 and 0500 on 3 August; booming noises commenced around 0445. By 0600 dense light-gray ash emissions were drifting NW, causing ashfall in areas downwind including Ulamona Mission. Ash emissions continued through the day and grew from light to dark gray with time. The eruption intensified at 1900 and a lava fountain rose more than 100 m above the crater rim. A Plinian ash plume rose 19 km and drifted W and SW, causing ashfall in areas downwind such as Navo and Kabaya, and as far as Kimbe Town. The Darwin VAAC reported that the ash plume expanded radially and reached the stratosphere, rising to 19.2 km (63,000 ft) a.s.l. The plume then detached and drifted S and then SE.
The Alert Level was raised to Stage 3 (the second highest level on a four-stage scale). The areas most affected by ash and scoria fall were between Navo (W) and Saltamana Estate (NW). Two classrooms at the Navo Primary School and a church in Navo collapsed from the weight of the ash and scoria; one of the classroom roofs had already partially collapsed during the 26 June eruption. Evacuees in tents as a result of the 26 June eruption reported damage. Rabaul town (E) also reported ashfall. Seismicity declined rapidly within two hours of the event, though continued to fluctuate at moderate levels. According to a news source flights in and out of Hoskins airport in Port Moresby were cancelled on 4 August due to tephra fall. The Alert Level was lowered to Stage 1. Small amounts of white and gray vapor were emitted from the summit crater during 4-6 August.
Sources: Rabaul Volcano Observatory (RVO); Darwin Volcanic Ash Advisory Centre (VAAC); Radio New Zealand; Papua New Guinea Post-Courier Online
RVO reported that diffuse white plumes rose from Ulawun’s summit crater and the North Valley vent during 1-4 July, and from the summit only during 5-9 July. The seismic station located 11 km NW of the volcano recorded three volcanic earthquakes and some sporadic, short-duration, volcanic tremors during 1-3 July. The seismic station 2.9 km W of the volcano was restored on 4 July and recorded small sub-continuous tremors. Some discrete high-frequency volcanic earthquakes were also recorded on most days. Sulfur dioxide emissions were 100 tonnes per day on 4 July. According to the United Nations in Papua New Guinea 7,318 people remained displaced within seven sites because of the 26 June eruption.
Sources: Rabaul Volcano Observatory (RVO); United Nations in Papua New Guinea
RVO reported that on 27 June diffuse white plumes rose from Ulawun’s summit crater and incandescence was visible from pyroclastic or lava flow deposits on the N flank from the significant eruption the day before. The seismic station located 11 km NW of the volcano recorded low RSAM values between 2 and 50. According to the Darwin VAAC a strong thermal anomaly was visible in satellite images, though not after 1200. Ash from 26 June explosions continued to move away from the volcano and became difficult to discern in satellite images by 1300, though a sulfur dioxide signal persisted; ash at 13.7 km (45,000 ft) a.s.l. drifted SW to SE and dissipated by 1620, and ash at 16.8 km (55,000 ft) a.s.l. drifted NW to NE and dissipated by 1857. RVO noted that at 1300 on 27 June satellite images captured an ash explosion not reported by ground-based observers likely due to cloudy weather conditions. The Alert Level was lowered to Stage 1.
RSAM values slightly increased at 0600 on 28 June and fluctuated between 80 to 150 units afterwards. During 28-29 June diffuse white plumes continued to rise from the crater and from the North Valley vent. On 29 June a news article stated that around 11,000 people remained evacuated to shelters.
Sources: Rabaul Volcano Observatory (RVO); Darwin Volcanic Ash Advisory Centre (VAAC); ReliefWeb
RVO reported that RSAM values at Ulawun steadily increased during 24-25 June, and then sharply increased at around 0330 on 26 June. The RSAM values reflect an increase in seismicity dominated by volcanic tremor. An eruption began in the morning hours of 26 June with emissions of gray ash that over time became darker and more energetic. The plumes rose 1 km and drifted NW, causing minor ashfall in NW and SW areas. Locals heard roaring and rumbling during 0600-0800.
The Darwin VAAC issued several notices about ash plumes visible in satellite data. These stated that during 1130-1155 ash plumes rose to 6.7-8.5 km (22,000-28,000 ft) a.s.l. and drifted W, while ash plumes that rose to 12.8-13.4 km (42,000-44,000 ft) a.s.l. drifted S and SW. A new pulse of activity generated ash plumes that by 1512 rose to 16.8 km (55,000 ft) a.s.l. and drifted S and SE. By 1730 the ash plume had risen to 19.2 km (63,000 ft) a.s.l. and spread over 90 km in all directions. Ash from earlier ejections continued to drift S at 13.4 km a.s.l. and W at 8.5 km a.s.l. RVO stated that RSAM values peaked at about 2,500 units during 1330-1600, and then dropped to 1,600 units as the eruption subsided.
RVO stated that parts of the ash plume at lower altitudes drifted W, causing variable amounts of ashfall in areas to the NW and SW. A pyroclastic flow descended the N flank. Residents evacuated to areas to the NE and W; a news article noted that around 3,000 people had gathered at a local church. According to another news source an observer in a helicopter reported a column of incandescent material rising from the crater, residents noted that the sky had turned black, and a main road in the N part of the island was blocked by volcanic material. Residents also reported a lava flow near Noau village and Eana Valley. RVO reported that the eruption ceased between 1800 and 1900. Incandescence visible on the N flank was either from a lava flow or pyroclastic flow deposits.
Sources: Rabaul Volcano Observatory (RVO); Darwin Volcanic Ash Advisory Centre (VAAC); Agence France-Presse (AFP); Radio New Zealand
RVO reported that during 1-12 October white and sometimes light gray emissions rose from Ulawun’s summit crater. Seismicity was low.
Source: Rabaul Volcano Observatory (RVO)
According to the Darwin VAAC, a steam-and-ash emission from Ulawun was identified in satellite images and reported by ground observers on 5 October, rising to an altitude of 4.6 km (15,000 ft) a.s.l. and drifting WSW.
Source: Darwin Volcanic Ash Advisory Centre (VAAC)
According to the Darwin VAAC, a pilot observed an ash plume from Ulawun on 21 September rising to an altitude of 3.7 km (12,000 ft) a.s.l. and drifting W. Ash was not confirmed in satellite images, though weather clouds obscured views.
Source: Darwin Volcanic Ash Advisory Centre (VAAC)
According to the Darwin VAAC, a NOTAM (Notice to Airmen) stated that on 8 June an ash plume from Ulawun rose to an altitude of 2.1 km (7,000 ft) a.s.l. and drifted W.
Source: Darwin Volcanic Ash Advisory Centre (VAAC)
Based on analyses of satellite imagery, the Darwin VAAC reported that on 3 November an ash plume from Ulawun rose to an altitude of 3 km (10,000 ft) a.s.l. and drifted NNE, though a RVO report noted only vapor emissions.
Source: Darwin Volcanic Ash Advisory Centre (VAAC)
Based on analyses of satellite imagery, the Darwin VAAC reported that during 26-27 October ash plumes from Ulawun rose to an altitude of 2.4 km (8,000 ft) a.s.l. and drifted 130 km S and SE.
Source: Darwin Volcanic Ash Advisory Centre (VAAC)
Based on analyses of satellite imagery and model data, the Darwin VAAC reported that on 25 September a minor ash plume from Ulawun rose 3 km (10,000 ft) a.s.l. and drifted WSW.
Source: Darwin Volcanic Ash Advisory Centre (VAAC)
Based on analyses of satellite imagery and model data, the Darwin VAAC reported that during 31 August-1 September and 5 September ash plumes from Ulawun rose to an altitude of 2.7 km (9,000 ft) a.s.l. and drifted SW, W, NW, and N.
Source: Darwin Volcanic Ash Advisory Centre (VAAC)
Based on analyses of satellite imagery and wind model data, the Darwin VAAC reported that during 17-18 August ash plumes from Ulawun rose to 2.7 km (9,000 ft) a.s.l. and drifted W.
Source: Darwin Volcanic Ash Advisory Centre (VAAC)
Based on analyses of satellite imagery and wind model data, the Darwin VAAC reported that during 9-10 August ash plumes from Ulawun rose to 2.4 km (8,000 ft) a.s.l. and drifted NW and W.
Source: Darwin Volcanic Ash Advisory Centre (VAAC)
Based on analyses of satellite imagery and wind model data, the Darwin VAAC reported that during 4-8 August ash plumes from Ulawun rose 2.4-2.7 km (8,000-9,000 ft) a.s.l. and drifted NW, W, and SW.
Source: Darwin Volcanic Ash Advisory Centre (VAAC)
Based on analyses of satellite imagery, the Darwin VAAC reported that on 28 June ash plumes from Ulawun rose to an altitude of 2.7 km (9,000 ft) a.s.l. and drifted W.
Source: Darwin Volcanic Ash Advisory Centre (VAAC)
RVO reported that during 1 May-23 June white plume rose from Ulawun. Seismicity was low (and dominated by small low-frequency earthquakes) although RSAM values slowly increased and then spiked on 13 June. Ash emissions began on 11 June and then became dense during 21-23 June. Based on analyses of satellite imagery, the Darwin VAAC reported that during 24-26 June ash plumes rose to an altitude of 3 km (10,000 ft) a.s.l. and drifted W.
Sources: Rabaul Volcano Observatory (RVO); Darwin Volcanic Ash Advisory Centre (VAAC)
Based on analyses of satellite imagery, the Darwin VAAC reported that during 16-18 November ash plumes from Ulawun rose to altitudes of 2.7-3 km (9,000-10,000 ft) a.s.l. and drifted over 30 km SE, SW, and W.
Source: Darwin Volcanic Ash Advisory Centre (VAAC)
RVO reported that during 16-31 October activity at Ulawun was at low levels. Gray and white plumes with varying densities rose 100-200 m above the summit crater and drifted SW, NW, and NE. Low rumbling was heard on 24 October. Based on analyses of satellite imagery, the Darwin VAAC reported that on 7 November an ash plume rose to an altitude of 3 km (10,000 ft) a.s.l. and drifted over 45 km E.
Sources: Rabaul Volcano Observatory (RVO); Darwin Volcanic Ash Advisory Centre (VAAC)
Based on analyses of satellite imagery, the Darwin VAAC reported that during 26-28 October ash plumes from Ulawun rose to altitudes of 2.4-3 km (8,000-10,000 ft) a.s.l. and drifted NW, W, and NE.
Source: Darwin Volcanic Ash Advisory Centre (VAAC)
Based on analyses of satellite imagery, the Darwin VAAC reported that during 19-21 and 23-25 October ash plumes from Ulawun rose to altitudes of 2.7-3 km (9,000-10,000 ft) a.s.l. and drifted 25-110 km NW, W, and SW.
Source: Darwin Volcanic Ash Advisory Centre (VAAC)
RVO reported that during 1 September-15 October white vapor plumes with varying densities rose from Ulawun, although on 12 October pale gray ash plumes rose from the vent. A report from officers at Hargy Palm Oil dated 13 October stated that a “minor eruption” had occurred after 1800 on 12 October, and that there were a few low noises from the volcano and nighttime glow during 12-13 October. RVO noted that the seismic record did not indicate an eruption.
Seismicity was at a low to moderate level, dominated by small low-frequency volcanic earthquakes. RSAM values increased and by mid-October were at the highest values (peak of 200) so far in 2016. Based on analyses of satellite imagery, the Darwin VAAC reported that during 16-17 October ash plumes rose to an altitude of 2.7 km (9,000 ft) a.s.l. and drifted SW and W.
Sources: Rabaul Volcano Observatory (RVO); Darwin Volcanic Ash Advisory Centre (VAAC)
Based on analyses of satellite imagery and observations from RVO, the Darwin VAAC reported that during 11-12 October ash plumes from Ulawun rose to altitudes of 1.8-2.4 km (6,000-8,000 ft) a.s.l. and drifted 65 km WSW and W.
Source: Darwin Volcanic Ash Advisory Centre (VAAC)
RVO reported that activity at Ulawun was low during 16-31 December; diffuse ash plumes rose from the crater during 51-21 December, and white vapor emissions were visible during 22-31 December.
Source: Rabaul Volcano Observatory (RVO)
RVO reported that activity at Ulawun was low during 1-15 December; pale gray ash plumes rose from the crater. People between Sena Estate and Noau on the N flank reported ashfall in early December.
Source: Rabaul Volcano Observatory (RVO)
RVO reported that activity at Ulawun was low during 16-30 November. Small volumes of gray to gray-brown ash plumes rose 100 m from the crater on most days and drifted S. On 21 November ashfall was reported in Navo on the SW flank.
Source: Rabaul Volcano Observatory (RVO)
Based on analyses of satellite imagery, the Darwin VAAC reported that on 26 November an ash plume from Ulawun rose to an altitude of 3.7 km (12,000 ft) a.s.l. and drifted 30 km NW.
Source: Darwin Volcanic Ash Advisory Centre (VAAC)
RVO reported that during 1 October-15 November activity at Ulawun was low; small volumes of white vapor and gray and gray-brown ash plumes rose 100 m above the crater and drifted S. Seismicity was low with RSAM values fluctuating between 100 and 150 units throughout the period.
Source: Rabaul Volcano Observatory (RVO)
RVO reported that activity at Ulawun was low during 4-31 August; emissions from the summit crater consisted of white vapor until 16 August, and were gray during 17-31 August. Emissions were more energetic on 24 August, rising 200 m. A single booming noise and weak incandescence was also reported that day. RSAM values fluctuated but decreased overall.
Source: Rabaul Volcano Observatory (RVO)
RVO reported that activity at Ulawun was low during 22 July-4 August; emissions from the summit crater consisted of white vapor. Seismicity was also low. RSAM values decreased from 80 on 21 July to 50 on 31 July, and then began to increase on early 2 August. By 4 August RSAM values reached 600, attributed to an increase in volcanic tremor.
Source: Rabaul Volcano Observatory (RVO)
RVO reported that activity at Ulawun was low during 15-21 July. Emissions from the summit crater were light gray during 15-16 July, and then changed to white vapor during 17-21 July. RSAM from volcanic tremors had increased on 14 July and reached a peak of 700 just after 0300 on 15 July. RSAM then decreased to 80 on 21 July, which also marked the cessation of volcanic tremors.
Source: Rabaul Volcano Observatory (RVO)
RVO reported that activity at Ulawun was low during 1-14 July. Emissions from the summit crater consisted of white vapor during 1-7 July, and then changed to occasionally sub-continuous, light gray ash clouds during 8 and 11-14 July. Ash clouds changed to gray-brown on 14 July.
Seismic activity was low from 1 July through the early part of 13 July. RSAM increased from about 0700 on 14 July onwards with the emergence of continuous volcanic tremors until it reached a peak of 700 just after 0300 on 15 July. RVO noted that the last significant volcanic tremors at Ulawun were recorded in May and June 2012.
Source: Rabaul Volcano Observatory (RVO)
RVO reported that dense gray-brown ash plumes that began rising from Ulawun on 6 November ceased on 11 December. During 12-16 December variable amounts of white vapor plumes rose from the crater.
Source: Rabaul Volcano Observatory (RVO)
RVO reported that dense gray-brown ash plumes continued to rise 200 m from Ulawun during 1-7 December. Ashfall was reported on the NW flanks, in Ubili (10 km NW) and Ulamona (10 km NW). A small landslide scar appeared near the N valley flank vent, reportedly caused by movement of a large boulder and loose material, triggered by a M 6.1 earthquake that occurred near Pomio (55 km SSE) on 19 November.
Source: Rabaul Volcano Observatory (RVO)
RVO reported that starting on 6 November through 30 November Ulawun produced pale grey and brown ash plumes that rose 200 m and drifted in multiple directions. Ashfall was reported on the N and NW flanks, in Voluvolu, Noau, Ubili (10 km NW), and Ulamona (10 km NW). Low rumbling was heard on 18 November.
Source: Rabaul Volcano Observatory (RVO)
RVO reported that during 1-6 and 10-26 May white plumes rose above Ulawun's summit crater, and during 7-9 and 27-31 May gray-brown ash plumes rose from the crater.
Source: Rabaul Volcano Observatory (RVO)
RVO reported that during 23-27 May gray ash plumes rose above Ulawun's summit crater. Fine ash fell in Ubili and Ulamona on the NW flank on 26 May.
Source: Rabaul Volcano Observatory (RVO)
RVO reported that during 19-22 May gray-to-brown ash plumes rose above Ulawun and fine ash fell on the NW and W flanks. Weak, fluctuating incandescence was observed on 22 May.
Source: Rabaul Volcano Observatory (RVO)
RVO reported that during 13-14 and 17 May gray-to-brown ash plumes rose above Ulawun. On 17 May the emissions were forceful for a short time and booming noises were reported. Light ashfall was reported in areas between Ubili in the NW and Voluvolu in the NE.
Source: Rabaul Volcano Observatory (RVO)
RVO reported that during 1-9 May diffuse white plumes rose from Ulawun and Real-time Seismic-Amplitude Measurement (RSAM) values ranged between 70 and 100. During 9-10 May RSAM values distinctly increased, fluctuated, and peaked at 1300 units before declining back to 100 units. During this time local residents heard booming. On 10 May grey-to-brown ash plumes were observed.
Source: Rabaul Volcano Observatory (RVO)
RVO reported that mild activity from Ulawun that began in May 2010 continued during 1 January-28 February. The activity was characterized by brown-to-gray ash plumes that rose less than 500 m and produced fine ashfall to the SE. Sulfur dioxide plumes drifted SE on 5 and 31 January. During 23-26 February gray ash plumes occasionally drifted NE, SW, and NW.
Source: Rabaul Volcano Observatory (RVO)
Based on analyses of satellite imagery and information from RVO, the Darwin VAAC reported that on 26 November an ash plume from Ulawun rose to an altitude of 3.7 km (12,000 ft) a.s.l. and drifted 55 km NE.
Source: Darwin Volcanic Ash Advisory Centre (VAAC)
RVO reported that white and gray-to-brown plumes rose no more than a few hundred meters above Ulawun during 12-24 August, and fine ash fell on the NW and W flanks. Seismicity continued to decrease as compared to previous weeks.
Source: Rabaul Volcano Observatory (RVO)
RVO reported that white and gray-to-brown plumes rose no more than 300 m above Ulawun during 6-12 August, and fine ash fell on the NW and W flanks. Seismicity decreased as compared to previous weeks.
Source: Rabaul Volcano Observatory (RVO)
RVO reported that white vapor plumes rose 300 m above Ulawun during 21-29 July. Light brownish ash clouds were observed on 23 and 24 July.
Source: Rabaul Volcano Observatory (RVO)
RVO reported that diffuse gray plumes rose 200-500 m above Ulawun during 16-21 July. Volcanic tremors continued, but overall seismicity declined slightly. Real-time Seismic-Amplitude Measurement (RSAM) values remained at a moderate level.
Source: Rabaul Volcano Observatory (RVO)
RVO reported that white-to-gray plumes rose less than 500 m from Ulawun during 27 June-9 July, and fine ash fell in areas to the SW, W, and NW. Occasional roaring noises were heard on 28 June and during 5-6 July. A slight increase in seismicity (above moderate levels) indicated by overlapping tremors and Real-time Seismic-Amplitude Measurement (RSAM) values was noted during 5-8 July.
Source: Rabaul Volcano Observatory (RVO)
Based on analyses of satellite imagery, the Darwin VAAC reported that during 1 and 2-5 July ash plumes from Ulawun drifted 55-195 km at an altitude of 3 km (10,000 ft) a.s.l.
Source: Darwin Volcanic Ash Advisory Centre (VAAC)
RVO reported that white-to-gray plumes rose from Ulawun during 23-25 June and fine ash fell on the SW and NW flanks. Low rumbling was heard and dull fluctuating incandescence was observed for a brief period of time from the SE. During 25-26 June white to gray-brown plumes rose 600 m. Seismicity, dominated by volcanic tremor, remained at a moderate level until 26 June, when Real-time Seismic-Amplitude Measurement (RSAM) values declined.
Source: Rabaul Volcano Observatory (RVO)
RVO reported that during 16-17 June white and gray plumes from Ulawun rose 1 km high. Fine ash fell on the SW, W, and NW flanks. Low rumbling noises were heard from the S and SE flanks, and weak fluctuating incandescence was observed for a brief period of time. On 18 and 19 June, white-to-gray plumes rose from the crater, and roaring noises were reported from the NW flank. Seismicity increased to a high level and was dominated by volcanic tremor. During 19-20 June continuing white and gray emissions produced plumes that rose 1 km. Fine ashfall was seen on the NW and SW flanks. Fluctuating incandescence was seen from the S and SE flanks and occasional low roaring noises were noted. Seismicity declined to moderate levels on 20 June.
Source: Rabaul Volcano Observatory (RVO)
RVO reported that during 9-16 June white and gray plumes from Ulawun rose 800-900 m high. Fine ashfall was reported almost daily and affected the NW, W, and SW flanks. During 9-12 June occasional rumbling noises were reported. Fluctuating incandescence from the crater was seen at night on 9 and 10 June from observers in areas to the SW and for a brief period of time on 13 June from areas N.
Source: Rabaul Volcano Observatory (RVO)
RVO reported that during 2-7 June occasional low roaring or rumbling noises from Ulawun were heard daily in areas on the ESE, SE, and S flanks. During 2-5 June white vapor plumes rose 800-900 m high. Very fine ash particles fell in Ulamona about 10 km NW on 3 June and some gray emissions rose from the volcano on 5 June. Emissions during 6-9 June were white and light gray, and continued to rise no higher than 900 m. Fluctuating incandescence from the crater was seen at night from the S side of the volcano. Ashfall was again reported in Ulamona on 8 June.
Source: Rabaul Volcano Observatory (RVO)
RVO reported that during 22-28 May Ulawun emitted thick white vapor plumes that rose 800 m high. Some areas of the plumes were gray on 22 and 25 May. People on the S and SE sides of the island heard "low jetting" noises during 24-25 May. Weak and fluctuating incandescence was seen at night during 28-29 May by people on the S part of the island. The emissions changed color to gray on 29 May and continued similarly the next two days. On 30 May very fine ashfall was reported in areas to the SSW, S, and SSE. On 1 and 2 June only white vapor emissions were noted. RVO recommended to the WNB Provincial Disaster Committee to declare a Stage 1 Alert to reflect an increasing trend of seismic energy, and a recent presence of occasional gray plumes, incandescence, and audible noises from Ulawun.
Source: Rabaul Volcano Observatory (RVO)
RVO reported that during 1-20 May Ulawun emitted variable amounts of white vapor. Based on analyses of satellite imagery, the Darwin VAAC reported that during 22-25 May ash plumes drifted 35-130 km at an altitude of 3 km (10,000 ft) a.s.l.
Sources: Rabaul Volcano Observatory (RVO); Darwin Volcanic Ash Advisory Centre (VAAC)
RVO reported that during 12-20 February Ulawun emitted white vapor that was occasionally forceful. A plume seen on satellite imagery on 14 February drifted NNE.
Source: Rabaul Volcano Observatory (RVO)
Based on analyses of satellite imagery, the Darwin VAAC reported that during 14-15 February ash plumes from Ulawun drifted 45-95 km at altitudes of 2.4-3.7 km (8,000-12,000 ft) a.s.l.
Source: Darwin Volcanic Ash Advisory Centre (VAAC)
RVO reported that white vapor plumes from Ulawun's summit crater were emitted on 10 May and rose a maximum height of 1.5 km. During 10-12 May, occasional roaring and rumbling noises were reported by villagers on the SE and S sides of the volcano. Weak fluctuating incandescence was also seen by people on the S side.
Source: Rabaul Volcano Observatory (RVO)
RVO reported that white vapor plumes from Ulawun were emitted during 2-6 July. Seismicity was low to moderate; seismometers continued to recorded high-frequency earthquakes. The Alert status remained at "Stage 2," indicating that seismic levels remained above background. During 2-3 July occasional roaring noises were reported.
Source: Rabaul Volcano Observatory (RVO)
RVO reported that increased seismic activity at Ulawun began on 7 June. During 18 June-2 July, mostly moderate-to-strong emissions of white vapor produced plumes that rose from Ulawun and seismometers recorded high-frequency earthquakes. On 22 June, noises heard in villages to the NE accompanied some of the earthquakes. On 28 June, an Intensity II earthquake was felt in areas nearby and accompanied by a booming noise. A team of officers from RVO and West New Britain Provincial Disaster Office informed communities on the activity status of Ulawun. On 30 June, RVO reported that the level of Alert at Ulawun was at "Stage 2", or that there was an increase in seismic activity above background level. During 1-2 July, roaring and jet noises were reported by people to the NE.
Source: Rabaul Volcano Observatory (RVO)
Based on observations of satellite imagery, the Darwin VAAC reported that an ash-and-steam plume from Ulawun drifted W on 25 December.
Source: Darwin Volcanic Ash Advisory Centre (VAAC)
Based on satellite imagery and information from the Rabaul Volcano Observatory, the Darwin VAAC reported that diffuse plumes from Ulawun drifted N on 28 April. On 1 May, an ash plume rose to an altitude of 4 km (13,000 ft) a.s.l. and drifted W.
Source: Darwin Volcanic Ash Advisory Centre (VAAC)
Based on a pilot report, the Darwin VAAC reported that an ash plume from Ulawun rose to an altitude of 2.4 km (8,000 ft) a.s.l. on 18 January and drifted SW.
Source: Darwin Volcanic Ash Advisory Centre (VAAC)
The Darwin VAAC reported that diffuse steam-and-ash plumes from Ulawun were visible on satellite imagery drifting SW on 4 January.
Source: Darwin Volcanic Ash Advisory Centre (VAAC)
The Darwin VAAC reported that ash plumes from Ulawun were visible on satellite imagery on 21, 22, and 25 December drifting ENE, NW, and SW, respectively.
Source: Darwin Volcanic Ash Advisory Centre (VAAC)
Based on satellite imagery, the Darwin VAAC reported that diffuse plumes from Ulawun reached altitudes of 4 km (13,000 ft) a.s.l. on 9 December. Plumes on 11 December reached unreported altitudes.
Source: Darwin Volcanic Ash Advisory Centre (VAAC)
Based on satellite imagery, the Darwin VAAC reported a diffuse ash-and-steam plume from Ulawun on 29 November and an ash plume on 4 December. The altitudes and drift directions were not reported.
Source: Darwin Volcanic Ash Advisory Centre (VAAC)
Based on satellite imagery, the Darwin VAAC reported a diffuse plume from Ulawun on 22 November and an ash-and-steam plume on 28 November.
Source: Darwin Volcanic Ash Advisory Centre (VAAC)
Based on satellite imagery, the Darwin VAAC reported that during 16-17 November diffuse plumes from Ulawun drifted N and NW. An ash-and-steam plume was visible on 18 November.
Source: Darwin Volcanic Ash Advisory Centre (VAAC)
Based on satellite imagery, the Darwin VAAC reported that on 12 November a diffuse plume from Ulawun reached an altitude of 4.6 km (15,000 ft) a.s.l. and drifted NW.
Source: Darwin Volcanic Ash Advisory Centre (VAAC)
Based on satellite imagery, the Darwin VAAC reported that ash-and-steam plumes from Ulawun drifted SW and S on 30 August and 2 September, respectively.
Source: Darwin Volcanic Ash Advisory Centre (VAAC)
The Darwin VAAC reported steam-and-ash plumes from Ulawun that were visible on satellite imagery on 25, 27, and 28 August. The plumes reached altitudes of 3.7 km (12,000 ft) a.s.l. and drifted NW, W, and SW.
Source: Darwin Volcanic Ash Advisory Centre (VAAC)
According to the Darwin VAAC, an ash-and-steam plume from Ulawun that was reported on 15 August by the US Air Force Weather Agency rose to an altitude of ~3.7 km (~12,000 ft.) a.s.l. The plume was also visible on satellite imagery.
Source: Darwin Volcanic Ash Advisory Centre (VAAC)
On 31 May, a thin steam-and-ash plume from Ulawun reached an altitude of below 3 km (10,000 ft) a.s.l.
Source: Darwin Volcanic Ash Advisory Centre (VAAC)
On 25 May, the Darwin VAAC reported a thin steam-and-ash plume from Ulawun that extended 30 miles WNW.
Source: Darwin Volcanic Ash Advisory Centre (VAAC)
On 14 May, an ash plume from Ulawun of unknown height was visible on satellite imagery.
Source: Darwin Volcanic Ash Advisory Centre (VAAC)
A small low-level plume emitted from Ulawun was visible on satellite imagery extending W on 9 April.
Source: Darwin Volcanic Ash Advisory Centre (VAAC)
Based on a pilot report, the Darwin VAAC reported that ash from Ulawun was visible at a height of ~3 km (10,000 ft) a.s.l. Ash was not visible on satellite imagery due to meteorological clouds around the volcano.
Source: Darwin Volcanic Ash Advisory Centre (VAAC)
RVO reported that activity during 1-2 March at Ulawun consisted of strong forcefully expelled "gray-blue emissions" from the main crater. Incandescence may have been visible at the base of the plumes. There were no emissions from the NW vent. Small felt earthquakes occurred and the sound of roaring was heard from nearby villages. According to the Darwin VAAC, RVO reported that activity increased at Ulawun during 1 and 2 March and ash reached ~3 km (10,000 ft) a.s.l. on the 1st. Ash was not visible on satellite imagery.
Sources: Rabaul Volcano Observatory (RVO); Darwin Volcanic Ash Advisory Centre (VAAC)
A thin plume emitted from Ulawun was visible extending N on satellite imagery on 23 November.
Source: Darwin Volcanic Ash Advisory Centre (VAAC)
Volcanic activity remained at low levels at Ulawun during 15-21 August, with steam emitted from the summit crater. Seismicity was at low levels, consisting of small low-frequency earthquakes.
Source: Rabaul Volcano Observatory (RVO) via the Darwin Volcanic Ash Advisory Center
During 30 June to 1 July, thin ash plumes from Ulawun were visible on satellite imagery. The plume heights were not reported.
Source: Darwin Volcanic Ash Advisory Centre (VAAC)
A short plume was visible in satellite imagery at ~3 km (9,800 ft) a.s.l. during 22-27 June and on 27 June a pilot report noted that the plume extended 37 km (20 nautical miles).
Source: Darwin Volcanic Ash Advisory Centre (VAAC)
On 21 June, a small ash plume from Ulawun was visible on satellite imagery extending NW of the volcano's summit. The height of the plume was not reported.
Source: Darwin Volcanic Ash Advisory Centre (VAAC)
On 3, 6, and 7 June plumes from Ulawun were visible on satellite imagery. The heights of the plumes were not reported.
Source: Darwin Volcanic Ash Advisory Centre (VAAC)
Satellite imagery on 19 May showed a small plume from Ulawun at an unknown height extending W.
Source: Darwin Volcanic Ash Advisory Centre (VAAC)
On 6 April, a thin plume from Ulawun was visible extending ~55 km to the SW on satellite imagery.
Source: Darwin Volcanic Ash Advisory Centre (VAAC)
During 25-28 March, volcanic and seismic activity at Ulawun were at low levels. Gas was emitted from the main crater, and low-frequency earthquakes were recorded beneath the volcano. Small-amplitude continuous volcanic tremor was recorded during 27-28 March.
Source: Rabaul Volcano Observatory (RVO)
RVO advised the Darwin VAAC that volcanic activity was relatively low at Ulawun on 8 March, but seismicity was increasing. On 15 March a faint plume was visible on satellite imagery
Source: Darwin Volcanic Ash Advisory Centre (VAAC)
According to the Darwin VAAC, a thin ash plume emitted from Ulawun on 23 August rose ~3 km above the volcano and drifted SW.
Source: Darwin Volcanic Ash Advisory Centre (VAAC)
According to the Darwin VAAC, a thin plume emitted from Ulawun was visible on satellite imagery at a height of ~3 km a.s.l. on 14 and 15 August.
Source: Darwin Volcanic Ash Advisory Centre (VAAC)
During 2-6 July, thin plumes from Ulawun were visible on satellite imagery at heights around 3 km a.s.l. extending as far as ~90 km.
Source: Darwin Volcanic Ash Advisory Centre (VAAC)
On 6 June, satellite imagery of Ulawun showed a plume up to 3 km a.s.l. and extending ~75 km NW.
Source: Darwin Volcanic Ash Advisory Centre (VAAC)
On 14 April, the Darwin VAAC reported that Ulawun emitted an ash plume that rose to ~3 km a.s.l. and extended ~37 km NE.
Source: Darwin Volcanic Ash Advisory Centre (VAAC)
RVO reported that volcanic activity was at low levels at Ulawun during 15 March to 1 April. Only white vapor was emitted from the main summit crater and there were no emissions from the north valley vent. The overall level of seismicity was low, with only small low-frequency volcanic earthquakes recorded. Electric tiltmeter measurements showed a long-term inflationary trend. According to the Darwin VAAC, on 12 and 13 April thin ash plumes from Ulawun were visible on satellite imagery at a height of ~700 m above the volcano. The plumes extended ~75 km E and NE.
Sources: Rabaul Volcano Observatory (RVO); Darwin Volcanic Ash Advisory Centre (VAAC)
An ash plume from Ulawun was visible on satellite imagery on 10 October at an altitude around 3 km, extending ~75 km WNW of the summit.
Source: Darwin Volcanic Ash Advisory Centre (VAAC)
On 5 October a faint ash plume was visible on satellite imagery at a height of ~4.3 km a.s.l., extending 55 km WSW of the summit.
Source: Darwin Volcanic Ash Advisory Centre (VAAC)
An ash plume from Ulawun was visible on satellite imagery on 22 September at a height of ~3.7 km a.s.l. The plume extended toward the NW.
Source: Darwin Volcanic Ash Advisory Centre (VAAC)
On 19 and 20 June faint ash plumes from Ulawun were visible on satellite imagery.
Source: Darwin Volcanic Ash Advisory Centre (VAAC)
During 12-27 May, Ulawun's main summit crater continued to emit weak-to-moderate volumes of white vapor and the N valley vent was quiet with no emissions observed. A slight increase in seismicity occurred during 18-23 May. According to the Darwin VAAC, on 1 June at 0925 a thin, low-level plume was observed on satellite imagery. By 1325 it was no longer visible.
Source: Rabaul Volcano Observatory (RVO)
During this week, aviation sources reported Ulawun ash plumes. A 30 April volcanic ash advisory detected a possible narrow low-level plume extending ~50 km from Ulawun. Satellite imagery for 2 May indicated an ash-and-steam plume rising to ~4 km and blowing W at ~30 km/hour. The plume extended 80 km W of the summit.
Sources: US Air Force Weather Agency; Darwin Volcanic Ash Advisory Centre (VAAC)
The Darwin VAAC reported that a possible low-level ash plume was visible on satellite imagery on 14 April.
Source: Darwin Volcanic Ash Advisory Centre (VAAC)
Volcanic and seismic activity remained at low levels during 17-26 February at Ulawun, with the emission of low-to-moderate volumes of steam. There were no emissions from the north valley vent. Heavy rain on 19, 21, 22, and 24 February led to the reactivation of mudflows on Ulawun's flanks. Residents in the affected areas were evacuated.
Source: Rabaul Volcano Observatory (RVO) via the Darwin Volcanic Ash Advisory Center
A pilot reported seeing ash from Ulawun on 3 November drifting ESE of the volcano at a height of ~3 km a.s.l.
Source: Darwin Volcanic Ash Advisory Centre (VAAC)
The Darwin VAAC reported that on 16 October a low-level ash plume from Ulawun was visible on satellite imagery. The plume drifted to the N.
Source: Darwin Volcanic Ash Advisory Centre (VAAC)
A low-level ash plume from Ulawun was visible on satellite imagery on 1 October. The plume drifted to the NE.
Source: Darwin Volcanic Ash Advisory Centre (VAAC)
On 28 September around 0400 an eruption occurred at Ulawun that produced an ash-and-steam cloud to ~3.7 km a.s.l. The cloud was visible on satellite imagery at 0632 drifting WSW.
Source: Darwin Volcanic Ash Advisory Centre (VAAC)
On 19 September at 0700 a low-level ash plume from Ulawun was visible on satellite imagery.
Source: Darwin Volcanic Ash Advisory Centre (VAAC)
On 12 September at 0700 a low-level ash plume located NNW to NNE of Ulawun was visible on satellite imagery. By 1132 the plume was no longer visible.
Source: Darwin Volcanic Ash Advisory Centre (VAAC)
On 7 September a low-level (less than ~3.6 km a.s.l.) ash plume was visible on satellite imagery, extending to the NW.
Source: Darwin Volcanic Ash Advisory Centre (VAAC)
The Darwin VAAC reported that on 28 August at 0732 a low-level ash cloud from an eruption at Ulawun was visible on satellite imagery. By 1532 the same day ash was no longer visible. According to a news article, ash eruptions had occurred on 26 August and during the previous week, but became larger on the 27th. As of the 28th, care centers were preparing for possible evacuations.
Sources: Papua New Guinea Post-Courier Online; Darwin Volcanic Ash Advisory Centre (VAAC)
During 11-24 February, activity at Ulawun's summit vent remained low, and volcanic tremor was recorded. Weak-to-moderate vapor plumes were emitted from the summit vent, and on the 21st weak roaring noises were heard and a weak red glow was briefly visible. During mid-February tremor increased to moderate levels for the first time since December 2001. After 22 February tremor returned to background levels.
Source: Rabaul Volcano Observatory (RVO)
Volcanic tremor, which had been occurring at moderate-to-high levels during the previous 2 weeks, dropped dramatically on 11 October. After 11 October seismicity only consisted of discrete low-frequency earthquakes. On 8 and 9 October loud roaring noises emanated from the volcano. A deflationary trend continued to be detected.
Source: Rabaul Volcano Observatory (RVO)
Volcanic tremor occurred at Ulawun on 24 September at 2200 through 30 September. After the tremor peaked on the 27th at about 1000 it fluctuated as it generally declined. By 30 September seismic activity was at moderate levels. During 27-30 September a very slow deflationary trend was detected.
Source: Rabaul Volcano Observatory (RVO)
A news report on 9 July stated that residents who were evacuated from their homes near Ulawun were permitted to return home. They were evacuated in May after the occurrence of relatively high seismic activity and an eruption in April. On 14 June, almost a month before the news report was published, the Rabaul Volcano Observatory (RVO) recommended that the Alert Level be reduced to 1. At this stage of alert people could move back to their homes with the approval of the local disaster committee, but many residents were hesitant to return and opted to stay in care centers. After the aforementioned news article was published some people returned home and RVO expects more people to return to their villages in the coming weeks.
Sources: Rabaul Volcano Observatory (RVO); The National
Based on information from the Rabaul Volcanological Observatory, the Darwin VAAC stated that no eruptions of Ulawun had been reported since the 30 April event, though cloudy conditions have inhibited clear views of the volcano. Limited evacuations occurred on 3 May due to the possibility of further volcanic activity. Ulawun is at stage 2 alert.
Source: Darwin Volcanic Ash Advisory Centre (VAAC)
According to the Darwin VAAC, a pilot reported observing a "smoke" cloud produced from Ulawun at 0730 on 30 April. The cloud was at an altitude of ~9 km a.s.l. and drifting to the NW and SW. Satellite imagery indicated that the cloud may have reached ~13.7 km a.s.l. and that the eruption ceased by ~1530 on 30 April. The Rabaul Volcanological Observatory stated that Ulawun is at a high alert level and further eruptions are possible.
Source: Darwin Volcanic Ash Advisory Centre (VAAC)
On 16 January the Darwin VAAC reported that a NOTAM from Port Moresbly stated that Ulawun was emitting a cloud, ashes, and "flames" up to 10.6 km a.s.l. blowing towards the SE. In contrast, an ash cloud was not detected in satellite imagery, and the Papua New Guinea Volcano Observatory stated that recent volcanic activity was limited to low-level vapor emissions.
Source: Darwin Volcanic Ash Advisory Centre (VAAC)
Reports are organized chronologically and indexed below by Month/Year (Publication Volume:Number), and include a one-line summary. Click on the index link or scroll down to read the reports.
Eruption during January produces nuee and ash emissions
Card 0850 (16 January 1970) Major eruption with heavy lava flow; few details available
A major volcano eruption is reported on West New Britain and the administration of Papau and New Guinea is preparing for an emergency evacuation of all people of the area. A brief report reaching Port Moresby said there was a heavy lava flow from Mount Ulawan, the highest peak in New Britain. Senior administration officials in Port Moresby are broadcasting emergency radio messages in an effort to bring transmitters to West New Britain on the air so that an emergency link can be established with the danger area. The acting administrator of Papua and New Guinea, Mr. Johnson, said there is very little information at the moment about the eruption apart from the fact that it appeared to be a very big one. He said a full scale evacuation is being organized by the District staff on New Britain.
Card 0856 (27 January 1970) High level of activity continuing; constant ash emission
"Major eruption at [0405 local time on 22 January] produced nuee which descended NW valley to within 1.25 miles of coast. Trees in path of nuee burning. Ejection of large quantity ash-laden vapor continues. Ulawan volcano continuing high level of activity [on 25 January] with constant emission ash laden vapor. Incandescent nose of lava flow now lowdown in area devastated by nuee in northwest valley. Audible explosions at intervals and slight increase in amplitude of continuance tremor."
Information Contacts: Card 0850 (16 January 1970)Mr. Johnson, Acting Administrator, Territory of Papua and New Guinea.
Card 0856 (27 January 1970)A. Renwick, Geological and Volcanological Branch, Administration of Papua and New Guinea, Port Moresby, Territory of Papua/New Guinea.
Eruption during 4-19 October produces lava flows and ejecta from five vents
Card 1736 (31 October 1973) Eruption during 4-19 October produces lava flows and ejecta from five vents
An eruption commenced . . . on 4 October 1973. The first 36 hours included only quiet lava streaming down the S flank, from a small vent in the side of the south-westerly terminal cone erected during the 1970 eruption. Explosive activity followed, from 6-19 October, with a peak in ash content on 11 October, on which day three small nuees descended the SSW flank. Strombolian ejections of brightly incandescent bombs occurred throughout the explosive phase, at a rate increasing to about 20 per minute during 13-14 October, when peaks of about 600 m elevation were reached. Five explosive vents were active altogether, tending to lie NNE-SSW, colinear but offset to the south of the main alignment of 1970 vents. Lava flowed throughout the eruption. The early flows were very hot and mobile, but the final flow, which commenced at about the time of the nuees and followed the same path, was cooler and more blocky in appearance. The eruption ceased abruptly on 19 October. Volcanologists were stationed 10 km away during 6-7 and 9-22 October, and at least one aerial inspection was made almost every day. No significant tilt effects occurred before or during the eruption, and continuous volcanic tremor was already established by 6 October, when a seismograph was installed. The tremor peaked in amplitude on 11 October, coinciding with the period of nuee production and ceased altogether on 19 October.
Information Contacts: R.J.S. Cooke, Volcanological Observatory, Rabaul, Papua New Guinea.
Large eruption: lava flow, ash, nuée ardente, and radial vents
"A new eruption was first observed just after 1900 on 7 May, when intermittent glow was seen at the summit. This rapidly developed into explosions of incandescent lava fragments from the summit crater, which increased in intensity until by 2100-2200 a full-scale eruption was in progress. At this stage, new ejections were visible every few seconds and explosive sounds were prominent; the intensity was probably as strong as that during the peaks of the 1970 and 1973 eruptions.
"Aerial inspections the following morning showed powerful ejections of red incandescent bombs every few seconds, feeding an eruption column 1-1.5 km high. The ash content in the ejections was fairly small, and the eruption column was relatively thin in texture. Only one source was noted and this appeared to be towards the N part of the 1973 `chasm', which had been deepened considerably by collapse sometime between May and July 1976.
"Similar activity continued through the night of 8-9 May, probably with a slight decline in intensity. However, beginning about 0700 on 9 May the vigor of ejections increased and the ash content built up very rapidly, until by mid-afternoon large quantities of black ash were being erupted in a column about 2.5 km high, and ashfall was accumulating rapidly at the downwind coast. A layer about 1 cm thick was deposited in a few hours 12 km WNW of the summit, and the ash plume extended tens of kilometers out to sea. An aerial inspection early 9 May revealed a weak small second vent on the SE side of the summit. This strong phase slackened off noticeably after about 1630 on 9 May.
"One or more nuées ardentes traveled down the SE flank at the peak of this phase, starting at about 1545, but were not directly observed, being on the opposite side of the volcano to the observation post. Fallen trees were visible only at the edges of the extensive area of forest destroyed by the nuées ardentes. The devastation extended 6-7 km from the summit and exhibited several adjoining lobes (figure 1).
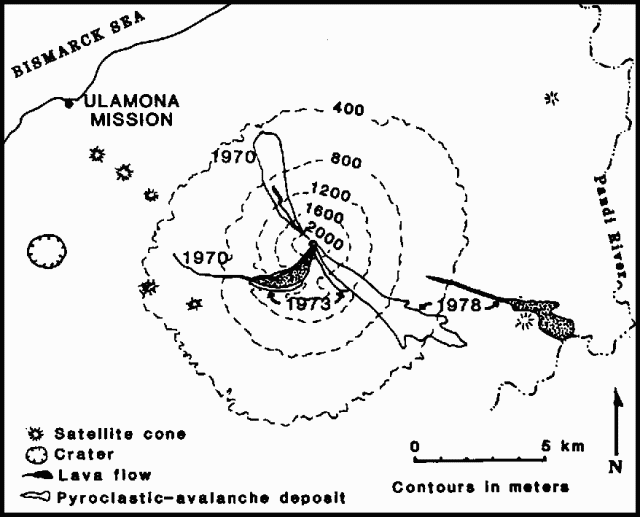 |
Figure 1. Sketch map of Ulawun showing 1970-78 lava flows and pyroclastic avalanche deposits. Contour interval is 400 m. After McKee and others (1981). |
"A spectacular but so far unidentified phenomenon was observed by pilots of two aeroplanes at about 1045 on 9 May, although nothing unusual was noted at that time from the observation post. This had some of the characteristics of both nuées ardentes and lava flows, to judge by the descriptions, and the mountain was [reported] to have split from top to bottom. It is hoped that photographs taken from both planes will assist in interpreting this event.
"Summit activity during the night of 9-10 May was reduced in comparison to that of the previous nights, with much less incandescence, and intermittent spells of inactivity up to 30 seconds long. Little activity was evident by about 0800 on 10 May; rumblings were often heard, but only a thin wispy eruption column was present.
"Later that morning, ash emission again increased strongly, a thick black column of ash was present through 11 May, and additional ashfalls were recorded at the coast. During the night of 10-11 May, incandescent lava fragments were still occasionally ejected from the summit crater, but the next night, only occasional weak glow was noted.
"A morning aerial inspection on the 11th showed that a thick ash column was billowing up rapidly and continuously from virtually the whole area of the summit, although individual projections of dense black ash with little solid content could be seen periodically. No incandescence was visible. A lava flow was active on the lower E flank of the volcano; its source was apparently a radial fissure about 500 m long, some 6 km from the summit and 2,000 m vertically below it, along which a number of individual lava vents could be seen. Some issued lava as brightly incandescent but quiet flows, others as vigorous continuous fountains of bright orange lava estimated (under poor conditions) to be gushing lava to heights of at least 30-40 m. It was thought probable that this fissure had opened sometime the previous day (10 May).
"The lava flow sources remained vigorously active 12-13 May. More than a dozen individual vents were present, five of them fountains. The cumulative effusion rate was probably 100-200 m3/s (provisional estimate), and the lava velocity was about 2-2.5 m/sec near the sources. During this time however, summit explosive activity weakened and eventually ceased in the late afternoon of 13 May. Although ash emission was still fairly strong on the 12th and the morning of the 13th, the ash column was no longer black but a mid-grey/brown color. During the afternoon of the 13th, intermittent periods of only white vapor emission were noted during the final stages of explosive activity.
"By 14 May, the lava flow sources were fewer in number and much weaker; sources higher up the fissure had stopped and only one fountain was still active, at the bottom end of the fissure. Lava flow ceased altogether, probably during the night of 14-15 May, just as the flow front had finished blocking the main channel of the Pandi River (about 11 km from the volcano), diverting it into an existing older channel. Lava had passed less than 50 m from Naisapuna, a hamlet of four houses and the only inhabited spot on the whole E flank, and had cut the only road on that flank (a rough track). Provisionally, the flow may contain 20 x 106 m3 of lava. The lava appears to be basalt, broadly similar to that of the 1970 and 1973 eruptions, although no analyses have yet been carried out.
"A short-period, vertical-component seismograph has been in use at Ulamona Catholic Mission (11 km WNW of Ulawun's summit) since December 1976. Between then and August 1977, a number of brief swarms of B-type volcanic events were recorded. During the last few days of April 1978, a number of barely discernible events, probably of the same kind, were recorded (mostly on 27-29 April) and a few were seen every day until the start of the eruption. Somewhat larger events resembling short bursts of volcanic tremor occurred on 2-3 May. During the few hours before the start of the visible eruption on 7 May, patchy, weak tremor was recorded. This tremor became strong and continuous with the commencement of visible activity, and maximum amplitudes were recorded during the first night. Tremor declined slightly after that and from mid-week, amplitudes fluctuated. Tremor ceased altogether with the end of explosive activity on 13 May. Some large and unusual events were recorded on the 9th and l0th that may be volcanic, but their interpretation is unclear at present."
Further Reference. McKee, C.O., Almond, R.A., Cooke, R.J.S., and Talai, B., 1981, Basaltic pyroclastic avalanches and flank effusion from Ulawun volcano in 1978, in Johnson, R.W. (ed.), Cooke-Ravian Volume of Volcanological Papers: Geological Survey of Papua New Guinea Memoir 10, p. 153-66.
Information Contacts: R. Cooke, RVO.
Ash billows to 6 kilometers above crater
Australian radio reports that Ulawun began to erupt during the night of 6-7 October. Pilots saw ash "billowing" to about 6 km above the crater during the morning of the 7th. A police spokesman said ash was thought to be falling more than 30 km from the volcano. Police were considering the evacuation of Ulamona Catholic mission, the settlement closest to the volcano.
Information Contacts: Melbourne Overseas Service.
Brief, intense explosive eruption
"A brief but powerful eruption took place at Ulawun between 6 and 7 October. The visible commencement of the eruption was late at night on 6 October. At about 2300, faint glow was seen at the summit, intensifying at intervals of 1-2 minutes, presumably signifying weak ejections of incandescent lava fragments. At 0400 on the 7th the lava ejections were more frequent, occurring at intervals of 1 minute or less. No sounds of the eruption had been heard up until this time by observers at Ulamona Catholic Mission, and no significant ash emission had been observed.
"After 0600, weak emissions of dark ash were seen from Ulamona. Observers in aircraft approaching from the NE noted that at about 0640 the emission cloud above Ulawun was slightly more voluminous than normal, and was reported as pale to dark. At about 0700, a series of strong explosions commenced, heard as deep rumbling at Ulamona. Within 10 minutes the top of the eruption column had reached about 4 km above sea level. Red incandescence was seen at the base of the column. By about 0715 the eruption column had grown to about 7-10 km in height. It was vertical and straight-sided right up to its top, where slight lateral expansion had begun.
"Small pyroclastic avalanches were seen shortly after the beginning of the strong explosive activity. At about 0720 they were reportedly much larger and descended all flanks of the volcano, particularly the N and SW flanks. All observers reported that these avalanches originated directly from the crater, and were not formed by collapse of the eruption column. They were described as not moving quickly down the volcano's flanks. Between 0720 and 0730 several particularly strong explosions occurred, accompanied by visible shaking of the volcano, likened to the initial shaking seen in quarry blasts. The eruption column was reinforced by these explosions, and the reports of directly associated pyroclastic avalanches may be interpreted as base surges. However, pyroclastic avalanching was also reported to have been more or less continuous during this period.
"By about 0735 the upper part of the eruption column was spreading out more noticeably and the clouds on the volcano's flanks had become more voluminous. The diameter of the `mushroom' top of the cloud was estimated at 50-60 km. The eruption column continued to be fed by apparently frequent explosions in the crater but only slight upward growth was evident. The volcano gradually became obscured as the eruption cloud began to dissipate. By 1000 the volcano was totally obscured down to its base, and at Ulamona the darkness was total for several hours. The ash cloud drifted slowly towards the SW and was thick enough to cause 1 hour of total darkness in mid-afternoon at Bialla, 45 km from the crater.
"Observations from the flank of a neighbouring volcano indicated that strong explosive activity continued until about 1215. Until this time a violent electrical storm had prevailed in the eruption cloud. The cessation of electrical discharges coincided with the cessation of strong explosions.
"At about 1800 the ash had cleared sufficiently to allow observations of the summit from Ulamona. No ash emission was seen, but through the night a faint glow was present above the crater. Bursts of glow on the upper NE flank and associated clouds of ash on the same flank were observed from Ulamona.
"No further ash emissions from the summit crater were seen. However, ash clouds were seen occasionally for several days on the upper N flanks, and at night spots of incandescence were seen in the same place on the volcano. The ash clouds may have originated as slides of unstable parts of the cone, and in one case a large ash cloud may have been produced by explosive interaction of meteoric water and hot parts of the cone.
"No lava flows were produced during the eruption. Estimation of the total volume of fragmental flows awaits receipt and analysis of aerial photographs, but the volume is probably greater than that of the 1978 pyroclastic avalanche deposits (about 17 x 106 m3 of juvenile material). A preliminary estimate of the volume of airfall ash is 10-20 x 106 m3. The lava appears similar to the basaltic material produced in previous eruptions.
"Apart from the addition of a veneer of deposits from the pyroclastic avalanches and airfall ash, the topographic changes to the volcano brought about by the eruption include the formation of a series of gouges on the upper NE flank and the reaming out of an enlarged summit crater. The crater is now slightly elliptical with its larger diameter, estimated at 100-150 m, oriented E-W. The inner walls of the crater are steep, and the deepest part of the crater floor is about 60-100 m below the rim.
"Since the installation of a short-period vertical component seismograph at Ulamona in December 1976, B-type volcanic earthquakes have been common, sometimes occurring in swarms. During 1980 these events often occurred at intervals of less than 2 minutes, but during the night of 6 October they became more frequent, resembling patchy volcanic tremor. Several strong local earthquakes, probably A-type volcanic events, were recorded on 3, 5, and 6 October.
"At the commencement of the strong, visible activity, the seismic activity intensified dramatically, becoming continuous tremor, which persisted until about 1215 on 7 October. After that time, tremor ceased altogether, signifying cessation of the eruption."
Information Contacts: C. McKee, RVO.
Vapor from summit crater
"The volcano was very quiet throughout December with only continuous moderate emission of white vapour from the summit crater."
Information Contacts: C. McKee, RVO.
Vapor emission for three days
"A very large white vapour cloud was emitted from the summit for several hours during the morning of 24 December, and moderate to strong vapour emission continued for three days. This coincided with a decline in seismicity which had been at a higher than usual level since mid-November. During the last week of the month seismic activity remained below the usual level of 1,000 to 1,500 B-type events per day. The vapour emission on the 24th is the most visible sign of activity since the volcano last erupted in October 1980 (05:10)."
Information Contacts: P. de Saint Ours and P. Lowenstein, RVO.
Weak vapor emission; seismicity increases
"After the 24 December increase in vapour emission, Ulawun was back to a rather low level of activity. The summit crater released a low-pressure, sulfur-laden vapour plume, and daily seismicity included fewer than 1,000 B-type recorded events. In January the seismicity steadily increased again in both amplitude and frequency, to its former moderate level of 1,000-1,300 events per day."
Information Contacts: P. de Saint Ours and B. Talai, RVO.
Increased seismicity and vapor emission
"A notable seismic crisis occurred 21-23 March. From mid-January until 21 March, seismicity had been fluctuating between 400 and 1200 B-type volcanic shocks of moderate amplitude per day, in an apparently cyclic manner with a period of 16 days. On 21 March, shocks occurred at the rate of about 800/day until 1700, when their amplitude decreased sharply. At 1930 their frequency started to increase, and from 2000 they became subcontinuous (1800/day) and moderate in amplitude. This high level of seismicity continued for about 38 hours before gradually decreasing again.
"The volcano was obscured by heavy cloud for most of this period. The first visual observations were made at 0730 on 22 March when 4-6 almost perfect smoke rings, reportedly pale-grey in colour, were ejected rapidly to about 300 m above the summit crater. Consistently strong white vapour emissions from the summit crater commenced on 25 March, contrasting with the usually weak to moderate white emission. A report on 26 March suggests a brief interval of dark grey emission, but seismic records show no changes that could indicate eruptive activity. The decline in seismicity on 23 March was followed by almost 2 weeks of exceptionally low levels interrupted only by a brief increase, 30-31 March.
"It is interesting to note that the high level of seismicity closely followed a heavy rainfall of 65 mm. It also occurred only three days after a major tectonic earthquake (ML 7.7) in the Solomon Sea, felt at MM V in the vicinity of Ulawun. It is possible that the earthquake opened microfissures in the volcanic edifice allowing ground water to penetrate and interact phreatically with shallow magma. The cyclic variations in seismicity since mid-January and increasing instability in March are believed to indicate that an eruption may occur in the near future."
Information Contacts: C. McKee, RVO.
Increased seismicity, including volcanic tremor
"Intriguing seismicity, possibly indicating an eruption in the near future, continued in April and included periods of volcanic tremor. Amplitudes of discrete events were generally low, although a degree of cyclicity in amplitudes was apparent, with a period of about 8-11 days. Daily earthquake totals increased from about 600 to about 1,500.
"After the 21-23 March seismic crisis, Ulawun's seismicity showed a fairly steady decay, reaching a very low level in early April. One clear A-type event was recorded on 7 April. A new seismic crisis, preceded by a lull about 2 hours long, began on 10 April at about 0310. The initial, strong continuous tremor changed to discontinuous tremor within a few hours. The entire period of tremor lasted about 6 hours. After this crisis, a steady decline was evident until 17 April. Small A-type events were recorded 11-16 April.
"On 17 April, 5 periods of tremor occurred. After about 3 hours of very low seismicity, the first began at 1645. A distinct lull also preceded the third period. Tremor was mostly continuous, with total duration of about 280 minutes. Individual periods lasted about 29-106 minutes, and were followed by about 5 hours of frequent discrete shocks and discontinuous tremor. Beginning 18 April a gradual decay in amplitude and frequency of occurrence of the shocks was recorded. Possible small A-type events were recorded 20-29 April.
"No unusual visible activity directly accompanied the seismic crisis. However, ejection of one or more smoke rings, seen to rise rapidly to about 500 m above the summit, was reported 11-18 April. Blue vapour emission was seen 14 April. Ulawun's usual white vapour emissions were moderate to strong throughout the month, but increased toward the end."
Information Contacts: C. McKee, RVO.
Variable seismicity, tremor episode
"Seismicity continued to show interesting variations in May. Very low levels of seismicity were recorded at the beginning and end of the month, but somewhat stronger seismicity took place 5-23 May. On 19 May a new seismic crisis was recorded. Commencing at about 1000, the crisis consisted first of continuous tremor which lasted for about 7 hours. The strongest part of the crisis was in the first few hours. The tremor became discontinuous from about 1700, gradually giving way over the following few hours to frequent discrete shocks.
"Throughout the month, emissions from the summit crater were reported to be strong white vapours. During an aerial inspection 24 May a white emission column rose several hundred meters above the summit, but the vapours were not being emitted with any force. A plume 5-10 km long was formed by the emissions."
Information Contacts: C. McKee, RVO.
Five periods of volcanic tremor
"Ulawun's seismicity continued to show interesting variations, although there appears to be no correlation between the seismicity and the steady, moderate to strong white vapour emission from the summit crater.
"A number of seismic crises took place in June in which periods of volcanic tremor were recorded. The first, on 10-11 June, lasted for about 15 hours and was followed by four more: 15 June (7 hours), 16 June (7 hours), 17-18 June (17 hours), and 30 June - 2 July (48 hours). In the last, several periods of tremor were recorded. Other periods of tremor-like signals were recorded on 14, 27, and 28 June, but these were probably the effects of rainstorms on the volcano.
"Amplitudes of discrete earthquakes were generally low in June, although slightly higher amplitudes were recorded 10-18 June in relation to the first 4 periods of tremor. A brief interval of low amplitudes followed the crisis of 17-18 June, but a steady rise in amplitudes was recorded beginning 20 June.
"At times other than seismic crises, daily totals of volcanic earthquakes were about 1,500, although fluctuations, from 1,000 to 2,000 per day, took place at the end of June."
Information Contacts: C. McKee, RVO.
Strong seismicity but no change in plume
"The moderate white vapour plume released at Ulawun's summit crater was undisturbed by the volcano's continuing unstable seismicity. A seismic crisis that started on 26 June was the longest since March when this pattern of activity started. It consisted of several periods of tremor up to 13 hours long, and sub-continuous volcanic earthquakes. This activity declined progressively 2-3 July to return to a rate of 1000-1500 B-type events per day. However, the average amplitude of discrete events remained fairly high (about 3 times normal levels) until 20 July. Further seismic crises on 16, 17, and 19 July marked the end of this particular period of stronger seismicity. No significant tilt changes were evident in July."
Information Contacts: C. McKee and P. de Saint Ours, RVO.
Gas measurements on 11 September
[Richard Stoiber, Stanley Williams, and Chris McKee used a COSPEC to measure the rate of SO2 emission from several volcanoes in Papua New Guinea during September (table 1). Plumes at and Manam were strong, and plume was small. Activity at Langila was weak 11 September, but had intensified during measurements the next day. The quiet-phase data were collected from the ground; all other data were acquired while flying under the plumes.]
Table 1. Rates of SO2 emission at Bagana, Langila, Manam, and Ulawun, Papua New Guinea, September 1983. Airborne COSPEC data from R. Stoiber, S. Williams, and C. McKee.
| Date | Volcano | SO2 t/d |
| 08 Sep 1983 | Bagana | 3,100 |
| 11 Sep 1983 | Langila | 74 |
| 11 Sep 1983 | Ulawun | 71 |
| 12 Sep 1983 | Langila | 1,300 |
| 12 Sep 1983 | Manam | 920 |
Information Contacts: C. McKee, RVO; R. Stoiber and S. Williams, Dartmouth College.
Five days of strong seismicity; mild explosive activity
"About 2 months of steady mild activity consisting of weak-moderate white vapour emission and low seismicity ended abruptly with a very intense seismic crisis 3-8 November.
"Weak discontinuous tremor began at 1900 on 3 November but showed a dramatic change at 2300 when frequent volcanic earthquakes of large amplitude started. No change was noted in the summit crater emissions. Numerous volcanic earthquakes continued over the next 2 days and a stage-1 alert warning of an increased risk of an eruption was issued on 5 November. At approximately 0200 on 6 November a new period of continuous large-amplitude earthquakes occurred and a stage-2 alert was issued, warning that an eruption was likely in the near future. A series of large events was recorded between 0800 and 1000 while observers near the base of the volcano reported dark summit emissions; one report suggested that they contained incandescent material. A stage-3 volcano alert was issued, warning of the possible development of a full-scale eruption later in the day, and the authorities stood by in case people in the most dangerous areas had to be moved.
"Reports from passing aircraft late in the day indicated that tephra emissions may have recurred in early or mid-afternoon. An aerial inspection at 1700 by an RVO volcanologist failed to confirm the presence of new ejecta on the volcano's flanks, but faint haziness possibly due to earlier ejection of fine dust was noted downwind. The emission plume at the summit was found to be white and normal in size.
"At 0530 on 7 November, shock waves were seen radiating from the summit crater through the emissions, indicating further mild explosive activity. The plume was larger than normal (about 300 m high) and extended 5-10 km from the summit. Seismic activity and emissions remained at high levels until 8 November when they abruptly declined to normal again, allowing a return to a stage-1 alert.
"At the peak of the crisis, over 3,000 volcanic earthquakes per day were recorded, declining to about 1,300 per day between 8-15 November, and 700 at the end of the month. Four A-type events were recorded on 22 November."
Information Contacts: C. McKee, RVO.
Seismicity increases after M 6.4, 6.5 earthquakes
"Volcano-seismic activity continued at a low level throughout most of December but increased suddenly again with the appearance of continuous harmonic tremor at 0200 on 24 December, less than 2 days after two strong regional earthquakes (ML 6.4 and 6.5, MM IV-V) about 150 km ESE of Ulawun at 0932 and 1102 on 22 December.
"The first period of harmonic tremor, which was low in amplitude, lasted less than 2 hours. It was followed by three days (23-26 December) of high seismic activity consisting of further periods of low-amplitude, continuous and discontinuous harmonic tremor and numerous larger-than-normal B-type volcanic events. No changes to the normal white vapour emission were observed during the seismic crisis. Disturbances consisting of loud bangs and the production of vapour rings were observed from Ulamona Catholic Mission on 15-16 and 20-21 December, but were not accompanied by any events on the seismic records."
Information Contacts: P. Lowenstein, RVO.
Explosions and January seismic crisis; 3-month summary
"Following increased seismicity and reports of audible explosions and vapour rings in December 1983, a phase of mild explosive activity took place in January. The eruptions were probably phreatic or phreatomagmatic as some correlation with rainfall is evident. Explosions producing tephra clouds were observed 12-14 and 19-20 January. These emissions rose as high as 2,000 m above the summit. Seismicity throughout this period was of low intensity and characterized by occasional bursts of tremor. A major seismic crisis began at about 1400 on 20 January. Tremor rapidly became strong and continuous. Large-amplitude volcanic earthquakes were discernible in the tremor by 2300. Soon afterwards tremor began to subside. It is not known whether eruptive activity accompanied this seismicity as the volcano was obscured by clouds. For the remainder of January and throughout February, no eruptive activity took place, and seismicity was low.
"An explosion sound from Ulawun was reported on 4 March, and tephra emissions were observed on the 5th and 13th. The emissions on the 13th rose to about 2000 m above the summit. Seismicity was generally at a low level in March. On most days, 100-300 volcanic earthquakes were recorded, but a peak of about 750 events was reached on 9 March. Earthquake amplitudes were slightly higher 9-11 March."
Information Contacts: C. McKee, RVO.
Increased seismicity, then small ash clouds and glow
"Apart from a few minor steam blast explosions earlier in the year, the level of activity in 1984 has been low. However, in mid-August the amplitudes of volcanic earthquakes increased markedly, and by late August the frequency of occurrence of volcanic earthquakes was increasing.
"Since 23 August occasional explosion sounds from the summit have been heard and occasional small ash clouds have been observed rising 400-500 m above the summit. Weak summit crater glow was reported on 25 August, and on the 28th provincial authorities were alerted to the possibility of further developments."
Information Contacts: C. McKee, RVO.
Mild strombolian eruption
"After several weeks of intensified seismicity and occasional small phreatic explosions, a mild Strombolian eruption began on 4 September and ended on 11 September.
"Previous Ulawun eruptions developed rapidly (within hours) to full-scale eruptions, including lava effusion and paroxysmal explosive activity culminating in the formation of pyroclastic flows. However, the 1984 eruption developed slowly from the first appearance of summit glow on 4 September, and no effusion or paroxysmal activity took place. The eruption reached a peak 6-9 September when mild, rhythmic, almost ash-free, Strombolian explosions took place every few seconds.
"During an aerial inspection on 7 September, a pool of fluid lava was observed in the bottom of the summit crater, about 50-100 m below the rim; explosions took place from a small circular central vent. Most ejecta were contained by the crater walls, but occasional larger explosions showered the upper flanks of the volcano with incandescent tephra. Visible shock waves were generated by the stronger explosions. A white eruption plume several tens of kilometers long was formed at the peak of the eruption. Seismic amplitudes were 30-40 times normal on 7 and 8 September, and the seismicity was characterized by irregular tremor produced by the frequent explosions.
"Regular reports and advice were transmitted by RVO to provincial government authorities throughout, and reactions to the eruption were controlled and rational, resulting in minimal disturbance to daily life."
Information Contacts: C. McKee, RVO.
Seismicity increases; vapor emission
"No further eruptive activity has occurred since the short-lived Strombolian eruption, 4-11 September. The only visible activity has been moderate emissions of white vapours. However, volcano seismicity started to increase again on 9 November. Beginning 14 November, daily totals of B-type events averaged about 600, a marked increase from daily totals that usually numbered less than 50, 14 September-8 November. The amplitudes of these events also increased substantially."
Information Contacts: C. McKee, RVO.
Incandescent tephra from lava mound; seismicity builds
"Seismicity, which had intensified in November, decreased to a normal level by early December. A re-intensification began on 17 December and reached a peak near the end of the month, when seismic amplitudes were about 10 times normal.
"Weak summit crater glow was observed on 30 December, indicating that an eruption was probably in progress. Fluctuating glow was observed on 3 January at about 0400, and occasional small dark tephra emissions from the summit crater were noted between 0800 and 0900. Seismic amplitudes began to increase at about 2300 on 3 January and steadily climbed to a peak of about 20 times normal on 8 January.
"Aerial inspections by volcanologists on 4 and 5 January revealed that the eruptive activity consisted of weak ejections of incandescent tephra from several vents in a mound of fresh lava within the summit crater. The ejections occurred at a rate of 1-2 per minute, and the largest rose about 100 m. The ash content of the emissions was low, and the plume was only a few kilometers long.
"A change in visible activity was evident from 9 January when the emissions became rich in white vapour, and ash ejections were less frequent. Crater glow, which had been observed consistently from 3 January, was absent from 9 January. Despite the weaker visible activity, seismicity persisted at about the same level as that of 8 January."
Information Contacts: C. McKee, RVO.
Mild strombolian activity concludes eruptive phase
"The eruption, characterized by generally low-intensity Strombolian activity, terminated on 27 January. At the peak of seismicity (about 20 times normal levels, on 8 January), weak ejections of incandescent tephra occurred at a rate of 1-2/minute from one or two vents in a mound of fresh lava in the summit crater. From 9 January, seismicity declined steadily, and nighttime incandescence from the crater was absent.
"Seismicity stabilized on about 17 January at about ten times normal levels. Despite the reduced seismicity, summit crater incandescence returned on 16 January and persisted until the 25th. Ejections of incandescent tephra were more frequent than earlier in the month, occurring at rates of up to about 10 per minute, and rising to about 130 m above the crater rim. The ash content of ejections was insignificant, and the eruption plume was only 1-2 km long. Seismicity started to decline on 25 January and dropped sharply to normal levels on the 27th, marking the end of the eruption.
"An aerial inspection on 30 January revealed complex topographic changes in the summit crater. The lava dome formed early in the eruption was surmounted by a small cinder cone, and the flanks of the dome were draped with a mantle of scoria and ash. Lava flows formed an almost continuous moat around the base of the dome. There was no overflow of lava onto Ulawun's flanks, but the lava had almost reached the lowest point in the crater rim, at the head of the NW valley. A small pit crater was present near the SW edge of the summit crater. The volume of new lava and tephra in the summit crater is provisionally estimated to be 105-106 m3."
Information Contacts: C. McKee, RVO.
Eruption produces slow-moving lava flows
On 17 November, Ulawun began to erupt ash and lava, producing two slow-moving lava flows. On 21 November, one flow was moving N of the summit; the other to the NW. Officials issued evacuation warnings to the [area's] 700 inhabitants, although there was no immediate danger.
Information Contacts: UPI; AP.
Increasing seismicity then tephra ejection & lava flow
"A brief, spectacular Strombolian eruption took place 17-22 November, developing rapidly after about five days of precursory seismicity.
"Seismic activity began to increase on 12 November with the occasional appearance of small discrete B-type volcanic earthquakes. These increased in size and number over the following three days, resulting in an official notification on the 15th of an increased risk of an eruption. Seismic activity continued to increase over the following two days with the appearance of low-amplitude continuous harmonic tremor on 17 November at 1600.
"At 2000, notification was received by radio from Ulamona Catholic Mission (figure 1) of a summit Strombolian eruption in progress, with ejections of incandescent lava fragments to heights of 300-500 m above the crater every few seconds. The eruption was reported to have begun at about 1830, following, or in association with, a rapid increase in the amplitude of the harmonic tremor.
"The intensity of the eruption increased with the emission of two large, dark clouds of ash at about 2045 before settling down to a more steady pattern of Strombolian explosions every few seconds, accompanied by a fairly constant level of strong continuous harmonic tremor.
"Volcanologists carried out an aerial inspection at about 0700 the next day and observed regular Strombolian ejections of incandescent lava every few seconds to heights of about 200 m above the summit crater. A small cone was being constructed in the summit crater, but some ejecta were falling outside the crater rim. Small debris slides were occurring intermittently around the N side of the crater. The eruption column at that time was about 2 km high and was lightly laden with ash. The eruption plume was about 10 km long and trended approximately S. During the day the rate of ash production increased, resulting in a dense pall of ash on the E side of the volcano.
"A lava flow started to descend the N slope in the early evening of the 18th. This flow originated from a fissure about 70 m below the summit crater, and although it moved rapidly at first on the steep upper slopes of the volcano (it may have advanced about 3 km downslope in the first few hours), its progress became very slow when it reached the volcano's gentler middle slopes.
"Spectacular `fire-fountaining' at the summit crater was observed beginning the night of the 18th. The sub-continuous showering of explosion debris around the crater built up an apron of highly unstable material. Intermittent slides of this material, mainly into the NW valley, produced impressive ash clouds rising from the volcano's slopes. The first of these moderate-sized avalanches was observed moving down the N flank at about 0715 on the 19th. Several more slides occurred later the same day. Throughout the 20th, debris slides were common on the N flank and NW valley. Most advanced less than 4 km from the crater, but a few traveled about 5 km downslope.
"By early morning of the 19th the lava flow had bifurcated, with the E lobe slightly longer. Progress of the flow was slow on the 19th and 20th. At 1400 on the 20th, the nose of the E lobe was about 4 km from the summit, and was about 100 m longer than the W lobe. Their widths were 20-40 m.
"The eruption column was very impressive on the morning of the 20th. Dark grey and convoluted at its base, it paled upward, rising to an altitude of 7-8 km, and was crowned by an elliptical pale grey vapour and ash plume extending W. Most of the ash fallout was controlled by the low-level wind system (below 4 km altitude) blowing from the NW.
"The intensity and mode of activity remained unchanged on the 21st, but seismicity began increasing during the early hours of the 22nd. After reaching a peak at about 0800 on the 22nd, seismicity suddenly declined and within 2 hours, the eruption ended.
"When the eruption stopped, the most distal part of the lava flow was about 5.5 km from the crater. Samples collected from the flow are coarsely porphyritic with conspicuous plagioclase phenocrysts. The lava has a similar appearance to previous Ulawun lavas, which are quartz tholeiites.
"During the eruption, on the 18th and 20th, measurements were made at a number of dry tilt arrays around Ulawun. The readings on these days showed that little or no tilting was occurring. Unfortunately, no base line measurements are available to check whether deformation had occurred prior to the eruption."
Information Contacts: C. McKee and P. Lowenstein, RVO.
Seismic and eruptive activity decrease in December
"Following the eruption of 17-28 November, seismicity at Ulawun remained at a moderately high level for the first half of December (500-1,000 events per day). By the end of the month seismicity had almost dropped back to pre-eruption levels.
"There were no further indications of eruptive activity except for a brief period of weak glow from the summit reported on the night of 2 December. Reports of eruptive activity from the Ulamona Mission on the 4th were probably due to a delayed debris avalanche. Unconsolidated material in the summit area became unstable and flowed down the NW flank. Loose ash was stirred up by the flow and produced an 'eruption-like' plume."
[This report was not included in GV 75-85.]
Information Contacts: C. McKee and P. Lowenstein, RVO.
Seismicity declines
"In early January, seismicity at Ulawun was still declining (100-200 events/day), following the eruption in November 1985. On 22 January seismicity increased slightly to 300-500 events/day for 4 days then returned to previous levels. No significant visible activity was reported.
Information Contacts: P. Lowenstein, RVO.
Low-level seismicity
"Activity . . . remained at a low, non-eruptive level throughout February. No significant visible or audible activity was reported, and the seismicity remained [at about] 100 events/day."
Information Contacts: P. Lowenstein, RVO.
Tremor & low-frequency seismicity but no eruptions seen
"On 10 May, unusual low-frequency events and harmonic tremor were recorded for ~3 hours. Smaller bursts of tremor lasting a few minutes each were also recorded on 13 and 15 May. There was no visible volcanic activity associated with the seismic activity, although the summit was not visible for much of this time."
Information Contacts: P. Lowenstein, RVO.
Low-level seismicity; weak vapor emissions
"Ulawun remained at non-eruptive levels of activity with emissions restricted to weak white vapour. There were no reports of incandescence or audible sounds from the summit, and seismicity was at a very low level."
Information Contacts: P. Lowenstein, RVO.
Low levels of seismicity and steam emission
"Activity remained at non-eruptive levels throughout November. Seismicity was at a very low level and dry tilt measurements indicated no significant tilt between 18 and 21 November. The only reported activity was weak vapour emission from the summit."
Information Contacts: B. Talai and P. Lowenstein, RVO.
Volcanic earthquakes increase; vapor emission
When visible, the summit crater was releasing moderate amounts of white vapour during December. The daily totals of volcanic earthquakes increased on 2 December and averaged ~150 until the 17th. A further, but somewhat irregular, increase began on the 18th and reached a peak of ~800 events/day on 23 and 24 December. Earthquakes then decreased steadily, stabilizing at ~350 events/day after 26 December. The summit was obscured throughout most of the period of increased seismicity.
Information Contacts: C. McKee and P. Lowenstein, RVO.
Continued strong seismicity; vapor emission
The increased seismicity . . . continued through January. Usually, 300-500 small events were recorded/day. A period of sub-continuous tremor began 20 January and lasted for ~27 hours. The summit crater emitted small to moderate amounts of white vapor during the few times that the summit was visible.
Information Contacts: J. Mori and P. Lowenstein, RVO.
Frequent earthquakes and tremor; heavy rain
Conditions for observing Ulawun were poor in February. The mountain was obscured on most days and received very heavy rainfall between the 9th and the end of the month. A maximum of 36 cm of rain was recorded on the 22nd at the base station, 10 km from the summit. In possible association with the rainfall, the recorded seismicity increased markedly, from 10-200 small events/day at the beginning of the month to a maximum of 1400/day on the 27th. In addition, periods of sub-continuous, non-harmonic tremor started on the 11th, becoming continuous for periods of 1-2 hours daily after the 14th. During 26-28 February, the seismic pattern consisted of alternating periods of intense non-harmonic tremor lasting 1-3 hours and periods of seismic quiet. Seismicity was still strong at the end of the month.
There were no dramatic changes in the emissions from the summit crater. Occasional ground and aerial observations indicated emissions were of weak to moderate white vapours.
Information Contacts: P. de Saint-Ours and C. McKee, RVO.
Seismicity remains strong but no eruption
Despite strong microseismicity that began in [December] 1987, Ulawun showed no visible sign of increased activity. White vapour continued to be released in weak to moderate amounts from the summit crater. Recorded seismicity showed dramatic fluctuations in number of events (300-1800/day), amplitude, and style. Records showed periods of low background seismicity interspersed with sub-continuous low-frequency (B-type) events of small to large amplitude, or periods of non-harmonic tremor lasting 1/2-2 hours. No particular pattern could be recognized, but periods of tremor occurred virtually every day, usually 1 or 2 episodes lasting up to ~2 hours, although on some days up to 12 short periods of tremor were recorded.
Information Contacts: P. de Saint-Ours and C. McKee, RVO.
Weak vapor emission; fluctuating seismicity
"Ulawun showed a low level of activity in April, with continued weak emission of white vapours. Seismicity fluctuated in both amplitude and the daily number of events, with a maximum of 1230 recorded on the 4th. However, . . . no tremor was recorded."
Information Contacts: D. Lolok, C. McKee, and B. Talai, RVO.
Increased seismicity associated with higher rainfall
"The low level of visible activity continued during May, with weak emission of white vapours. There was an increase in seismicity during the second half of the month which may correlate with increased rainfall on the volcano. Periods of volcanic tremor were recorded on 15 and 29-31 May."
Information Contacts: H. Patia and P. Lowenstein, RVO.
Seismicity declines; vapor emission; deflation
"Low-level activity persisted. Weak to moderate amounts of white vapour continued to be released from the summit crater. The recorded seismicity fluctuated between 1,500 and 300 small B-type events/day (relatively less numerous than during the last two months). The average amplitude of these events built up considerably (up to 8 times the norm) from early May to mid-June before decreasing again to regular non-eruptive levels. Apparent tremors were also recorded for long periods from 6-10, 15-16, and 19-29 June. It is not certain to what extent that signal was caused by the strong seasonal wind.
"An aerial and field inspection was carried out on 6 and 7 June. The interior of the summit crater was mostly obscured by abundant white and blue vapours. Little morphological change was noted compared to the last inspection, in July 1987, apart from the erosion. However, a series of fissures enhanced by fumarolic encrustations were observed to run horizontally, ~100 m below the rim of the internal S wall.
"Dry tilt measurements indicated summit area deflation of up to 55 µrad since the last eruption in November 1985. EDM measurements showed minor contractions of three lines radial to the flanks of the volcano since previously measured in November."
Information Contacts: P. de Saint-Ours and P. Lowenstein, RVO.
Seismicity subsides to inter-eruptive levels
"No significant activity occurred in July. Summit crater emissions generally consisted of small quantities of white vapours. Seismicity was at normal inter-eruptive levels of only a few tens of small events/day, decreased from the strong seismicity that began in December 1987.
Information Contacts: C. McKee and P. Lowenstein, RVO.
Low-level seismicity, weak vapor emission
"Ulawun showed a very low level of activity in August with continued weak-moderate emission of white vapours from its summit crater. Seismicity was also at a very low level with only a few small B-type events recorded daily. No tremor was recorded throughout the month."
Information Contacts: P. Lowenstein and B. Talai, RVO.
Earthquakes and tremor; vapor emission
"During most days the summit crater remained under cloud cover. When visible, the summit released mostly white vapour in weak to moderate and occasionally large amounts. Recorded seismicity was at a low level during the first four days of October (3-13 small B-type events/day), but a sudden upsurge in the number of seismic events occurred on the 5th with a total of 575 recorded. From the 6th to the 25th, daily totals of events fluctuated between 2 and 415. The average amplitude from the 1st to the 25th remained constant. On the 26th, a sudden change in seismic activity occurred and continued to the end of the month. [This] seismicity was characterized by bands of low-frequency harmonic tremor recorded for long periods (1-2 hours) with a further increase in size and number of accompanying B-type events. These events sometimes occurred in groups (1-3 events/minute) with average amplitude 8 times higher than normal. A steady increase in the number of B-type events occurred from the 26th with the highest number (820) recorded on the 31st."
Information Contacts: D. Lolok, B. Talai, and P. Lowenstein, RVO.
Vapor emission intensifies; tremor
"Ulawun's summit crater was covered by clouds during most of November. When visible, weak-moderate white vapour emissions were observed. Vapour emission intensified during the last week of the month. November's recorded seismicity was mainly characterized by an average of 9 bands of low-amplitude, high-frequency harmonic tremor, each lasting 1-2 hours. The number and size of accompanying B-type events also increased with a maximum of 1,055 recorded on the 19th.
Information Contacts: I. Itikarai and P. Lowenstein, RVO.
Tremor and B-type events; vapor emission
"During most days in December, the summit crater was covered by clouds. When the weather was clear, moderate to strong white vapour emissions were observed. Seismicity was mainly characterized by bands of low-amplitude, high-frequency, harmonic tremor. The daily average of tremor bands was 8, and the mean total duration was 15 hours/day. The tremor bands were accompanied by B-type volcanic events that increased in number and amplitude during the last week of the month."
Information Contacts: H. Patia and P. Lowenstein, RVO.
Eruption ejects ash to 2 km
"A mild eruption took place between 1 and 10 January. Frequent ejections of dark grey ash were observed rising as much as 2 km above the summit. These produced light ashfalls on the SE side of the volcano. Bright red glow from the summit crater was observed during the ejections. During the eruption, visible activity often coincided with regular periods of low-amplitude, high-frequency tremor. Included in the tremor were discrete B-type events. This pattern of seismicity had begun on 26 October 1988. There was a slow, irregular increase in amplitude through November and early December, but a significant increase took place in mid-late December. Seismicity declined during the eruption."
"Dry tilt and EDM measurements were carried out on 2 and 12 January. Compared with the previous tilt measurements in June 1988 (SEAN 13:06), inflationary tilts of as much as 19 µrad had accumulated by 2 January. Further inflation of up to 16 µrad took place between 2 and 12 January. These tilt changes were recorded at stations within a few km of the summit. EDM measurements were inconsistent. From 11 January, mainly white vapour emissions from the summit crater were observed. On some days, emissions appeared to contain ash. The pattern of regular periods of seismic tremor disappeared and was replaced by occasional small B-type events.
"There are some indications that the eruption was phreatomagmatic. Microscopic examination of ash samples indicates that the ash is very fine grained with a large proportion of accessory material. However, some fresh dark glass is also present. Secondly, the significant increase in seismicity in mid-late December coincided with a period of heavy rainfall that may have triggered the eruption. On the basis of tilt measurements, it is speculated that a magmatic eruption could still take place, although it is not considered to be imminent."
Information Contacts: C. McKee, H. Patia, and P. de Saint-Ours, RVO.
Low-level activity follows January eruption
"Activity dropped to a low level in February. Weak to moderate emissions of white vapour were released from the summit crater, and the seismicity was at a very low level."
Information Contacts: D. Lolok and C. McKee, RVO.
Ash emission, seismicity, and glow follow heavy rain
"Unrest appeared related to the amount of rainfall on the volcano. Heavy rainfall started 26 February and continued until 7 March. After ~6 weeks of very low-level activity (following phreatomagmatic eruptions in January; 14:01) volcanic seismicity strengthened on 28 February, with periods of irregular tremor that increased progressively in amplitude. Following the maximum daily rainfall of 142 mm on 3 March, a strong white vapour plume was observed above the summit crater the next day. On the 5th, the plume had become a large ash-laden column rising to 1,000 m, while seismicity reached 8 times 'normal' amplitude levels. A large grey plume with weak red glow was observed on the nights of 5, 6, and 9 March. Seismicity subsided 6-8 March but returned to a moderately high level during the following week, though with a change in pattern; the tremor periods being replaced with a succession of discrete, emergent events.
"Following another period of strong rainfall (63 mm on the 15th), the moderately strong vapour plume again became ash-laden (grey) until the 22nd. The seismicity showed a different response; it suddenly declined from medium intensity to virtually nothing on the 17th, after a period of strong tremor lasting ~10 minutes. Subsequently, seismicity re-intensified progressively until the 20th when it rapidly rose from medium to high, but dropped suddenly again to virtually nothing on the 22nd.
"At the end of the month, the summit crater was gently releasing a weak to moderate white vapour plume and seismicity was at a very low level. On the 30th, an Ms 5 regional earthquake, 75 km away, triggered continuous tremor lasting the following 2 1/2 days.
"The thick dark column and night glows at the beginning of the month caused some degree of alert amung the local population. An on-site inspection and survey on the 6th showed no significant ground deformation, allowing the release of an information bulletin forecasting phreatic or phreatomagmatic activity similar to early January."
Information Contacts: P. de Saint-Ours and C. McKee, RVO.
Small ash emissions, minor seismic increases
"Mild, intermittent, eruptive activity continued in April. Ash emissions occurred 6, 8, 11, 20-22, and 28 April, but their ash content was low, and no significant ashfalls were reported. A strong correlation between activity and preceding heavy rainfall (as observed in March) was not evident. When not producing ash, the volcano emitted white vapours at moderate rates.
"For most of the month, the volcano-seismicity consisted of occasional, small, low-frequency events. Periods of low-amplitude, discontinuous and irregular tremor were recorded between 16 and 18 April. During the last week of April (perhaps correlating with a period of moderate rainfall) discrete events were more numerous, with periods of continuous and discontinuous irregular tremor of low-moderate amplitude."
Information Contacts: C. McKee, RVO.
Ash emissions cease
"Ulawun returned to normal after the mild intermittent eruptive activity in April. Moderate to occasionally strong, white-grey emissions were released from the summit crater. Volcano seismicity was low, with daily totals of 20-30 recorded events."
Information Contacts: H. Patia and C. McKee, RVO.
White vapor plume; seismicity decreases
"The level of activity has shown a continuous decrease since the mild phreatic unrest in March. Throughout the month, the terminal crater was releasing a plume of white vapour, while the seismicity was steadily decreasing . . . "
Information Contacts: P. de Saint-Ours and B. Talai, RVO.
Weak emissions continue; low SO2 flux
The quoted material is a report from RVO, with additional information on SO2 flux supplied by S. Williams. "Throughout July, the volcano quietly released moderate, sometimes strong, white with occasional grey or brown emissions (on the 15th, 16th, 22nd, and 24th). Volcano seismicity remained at a low level with 10-30 small discrete B-type events/day."
During airborne COSPEC measurements on the 27th from 1150 to 1240, a diffuse white plume extended 10-15 km from the crater. Four traverses yielded SO2 emission rates of 149, 66, 120, and 134 t/d. The average flux was 120 t/d, an increase from 1983 values (97, 70, 49, 66 t/d) that yielded an average of 70 t/d. When Williams flew past the volcano on 30 July, the plume remained thin, white, and wispy, but visible for 10-20 km downwind.
Information Contacts: B. Talai and C. McKee, RVO; S. Williams, Louisiana State Univ.
Vapor emission; minor seismicity
"A low level of activity continued in August. Emissions released from the summit crater were mostly weak to moderate white vapours, that were occasionally moderate to strong. Seismic activity remained at a steady low level with 30-60 small B-type events daily."
Information Contacts: I. Itikarai and C. McKee, RVO.
Vapor emission and minor seismicity
"Ulawun remained quiet in September. Emissions from the summit crater were white and in small to moderate volumes. Seismicity remained generally low with ~20 small B-type events recorded daily. On a few days, however, several hundred events were recorded."
Information Contacts: C. McKee, RVO.
Weak-moderate vapor emission
"The low level of activity . . . continued in October. The only visible sign of activity was the steady emission of a weak-moderate white vapour plume from the summit crater. The seismicity has been at background level with <50 small-amplitude B-type events/day."
Information Contacts: C. McKee, RVO.
Vapor emission and weak seismicity
"Activity continued at background level in November. The summit crater released white vapours in weak to moderate volume on most days. Seismicity remained at background level with <50 small-amplitude B-type events/day."
Information Contacts: D. Lolok and P. de Saint-Ours, RVO.
Gas emissions and seismicity remain at background
"Activity continued at background level in December. White vapours were released in weak to moderate volume by the summit crater. Seismicity remained at background level, with only a few events/day of very small amplitude and occasional larger B-type shocks."
Information Contacts: P. de Saint-Ours, RVO.
Weak vapor emission; 10-hour seismic swarm follows M 4.2 earthquake 25 km away
"Activity was at a low level throughout January, as it has been since July 1989. The summit crater emitted white vapour in weak to moderate amounts. The seismicity was also at a very low level, with only a few volcanic (B-type) events of very small amplitude/day. On the 4th, however, an earthquake (ML 4.2) originating 25 km away provoked the onset of a 10-hour swarm of small B-type events (~150) that ended abruptly after a string of a dozen larger events."
Information Contacts: I. Itikarai and P. de Saint-Ours, RVO.
Low-level activity; moderate white-blue summit emissions
"Activity continued at a low level in February. The summit crater emitted white and blue vapours in weak to moderate amounts. An aerial inspection on 13 February showed no change in the configuration of the summit crater or in its activity. Seismicity was very low throughout the month."
Information Contacts: C. McKee, RVO.
Thick vapor emission; weak seismicity
"Activity remained at a low level in March. Summit crater emissions consisted of thick white vapour. Seismicity was low throughout the month."
Information Contacts: I. Itikarai, P. de Saint-Ours, and C. McKee, RVO.
Vapor emission and low-frequency events
"Activity remained at a very low level, with the summit crater releasing white vapour in small to moderate amounts. Seismicity was limited to a few (<=10) very small low-frequency events/day."
Information Contacts: P. de Saint-Ours, and C. McKee, RVO.
Dry tilt suggests radial inflation
"Activity remained at a very low level, with the summit crater releasing white vapour in small to moderate amounts. Seismicity was limited to a few (<=10) very small low-frequency events/day. Aerial inspection 2-4 May showed no significant change in summit morphology.
"The ground deformation network (EDM and dry tilt) was reoccupied 2-4 May. Comparison of the latest EDM measurements with all previous data shows that there have been no significant EDM changes at Ulawun during the network's operation (since November 1985). On the other hand, comparison of the latest dry tilt measurements with the previous measurements (March 1989) indicates considerable changes at stations on the upper flanks. Radial inflationary tilts of 80 and 45 µrad were recorded at stations 1.1 and 2.3 km respectively from the summit."
Information Contacts: P. de Saint-Ours, and C. McKee, RVO.
White vapor emission; low seismicity
"Activity remained at a very low level, with the summit crater releasing white vapour in small to moderate amounts. Seismicity was limited to a few (<=10) very small, low-frequency events/day.
Information Contacts: P. de Saint-Ours, and C. McKee, RVO.
Weak to moderate vapor emission
"Activity at Ulawun remained at a low level in July. Emissions from the summit crater consisted of weak to moderate white vapour. Seismicity was at a very low level during the month."
Information Contacts: H. Patia and C. McKee, RVO.
Weak vapor emission and seismicity
"Activity remained at a very low level in August. Emissions from the summit crater consisted of white vapour in weak to moderate amounts. Seismicity was at a very low level during the month."
Information Contacts: I. Itikarai and C. McKee, RVO.
Weak fumarolic and seismic activity
"Activity in September remained at a very low level. Summit crater emissions consisted of white vapours released at low to moderate rates. Seismicity remained at a very low level."
Information Contacts: I. Itikarai and C. McKee, RVO.
Vapor emission; weak seismicity
"Activity remained at a low level in October. Emissions from the summit crater consisted mainly of white vapour released at moderate rates. Seismic activity remained at a very low level."
Information Contacts: C. McKee and I. Itikarai, RVO.
Small earthquake swarm but no change in vapor emission
"Activity at Ulawun has been at a low level since January 1990, producing small amounts of white vapour and few earthquakes. A temporary increase in seismicity was recorded between 11 and 20 February 1991. The peak was on 17 February when 295 medium-frequency volcanic earthquakes occurred. All of the events in this period were of very small magnitude. There was no change to the summit crater emissions, which continued to consist of white vapour."
Information Contacts: C. McKee, RVO.
Large gas plume and numerous weak earthquakes
"Activity remained at the low, non-erupting level displayed since January 1990, gently releasing a white vapour plume and generating an average of ~200 very small low-frequency earthquakes/day.
"An aerial inspection and ground deformation survey was carried out 14-16 May. The plume emitted by the crater, although of moderate volume, seemed rich in SO2 and could distinctly be seen stretching horizontally >40 km downwind. No significant changes were noted in summit crater morphology since the last inspection in May 1990, apart from a series of cracks on the terminal cone's upper W flank, suggesting a slight inward sagging of this side of the crater rim.
"EDM and dry tilt measurements suggest that no significant deformation has occurred over the last 12 months."
Information Contacts: D. Lolok and P. de Saint-Ours, RVO.
Increased seismicity but surface activity limited to gas emission
Increased seismicity has been observed at Ulawun, but surface activity remained limited to release of small to moderate volumes of white vapor until late September. Recorded seismicity since mid-August has consisted of numerous to nearly continuous, very small, low-frequency events. Larger events began to occur in mid-September. Periods of stronger seismic activity were occasionally separated by intervals of little seismicity, producing a banded appearance on seismograms. Similar seismicity has been recorded previously at Ulawun, and at Karkar prior to its 1979 eruption. Gas emission on 29 and 30 September was stronger, and brown plumes were reported.
Information Contacts: P. de Saint-Ours and C. McKee, RVO.
Seismicity declines without eruption
"A buildup of seismicity observed toward the end of September continued through the first week of October, but the volcano remained in a non-erupting state, releasing vapour in small to moderate volumes. The increased seismicity consisted of periods of frequent discrete, low-frequency earthquakes. The maximum daily number of recorded events was ~350. Despite their increase in number, there was no marked increase in amplitude. This activity waned after a week and by the end of the month was at a low level, with earthquake counts of <30/day. High-frequency volcanic earthquakes were recorded occasionally throughout October."
Information Contacts: P. de Saint-Ours and C. McKee, RVO.
Vapor emission and seismicity
"Ulawun remained in a non-erupting state, releasing only weak to moderate white vapour. A slight increase in seismicity occurred in December after waning temporarily at the beginning of October (BGVN 16:10). Seismic activity consisted of low-frequency earthquakes, with daily counts fluctuating between 10 and 182. High-frequency volcanic earthquakes were also recorded occasionally through the month. Ground deformation continued to show no significant change."
Information Contacts: D. Lolok and B. Talai, RVO.
Vapor emission; seismicity declines
"The volcano remained quiet, releasing only moderate white vapour throughout the month. After a slight increase in seismicity in December, seismic activity was back to a low level in January. Daily totals of volcanic earthquakes ranged from 5 to 35."
Information Contacts: H. Patia, P. de Saint-Ours, and B. Talai, RVO.
Seismicity increases; eruption column to 1,000 m above summit; continued ash emissions
"Seismic activity changed subtly at the end of December. Few low-frequency earthquakes were recorded, but there had been a gradual increase in low-amplitude, long-duration 'tremor events.' By the beginning of January, the increase had been such that the events had coalesced into sub-continuous very low-amplitude tremor. There was a brief return of low-frequency events 1-4 January, including some very unusual signatures. There were also indications of periodically stronger tremor at this time, although the signals could have been due to high winds. From the 5th onwards the level of tremor remained steady and there were only a few low-frequency events. Visible activity was normal, with small amounts of thin vapour being gently released.
"The first sign of any abnormal visible activity was on 12 January, when a report was received of a dark eruption column that was forcefully emitted to ~1,000 m above the summit before declining to 400 m in height and becoming lighter coloured. Many clouds form around Uluwan during the daytime, so there were no other reports to confirm this activity. There was also a report of weak glow seen that night. Aerial and ground inspections were made on 14 and 15 January, when activity consisted of sub-continuous, forceful emissions of low-moderate volumes of white vapour. There were less forceful emissions of blue vapour, and no increase in the level of tremor associated with the increase in visual activity. This type of activity persisted until 19 January.
"There were some reports of weak night glow and sub-continuous noises on the night of 18 January. However, emissions were unchanged at 0900 on the 19th. A change had occurred when the next observation was possible, at 1300, when there were forceful emissions of dark ash clouds to 500 m above the summit. Continuous night glow and sub-continuous deep roaring sounds were reported from Nuau village and Ulamona Mission, both ~12 km from the summit, on the night of the 19th. The level of tremor increased by a factor of about two between 0300 and 0400 on 20 January. Visual activity from dawn (0530) onwards consisted of moderate volumes of grey/brown ash being forcefully emitted up to 1.5 km above the crater. The emissions varied in strength, and during an aerial inspection it was possible to see into the crater, which is elongated in an E-W direction, with its largest dimension ~100 m. No base could be seen to the crater, and the emissions were being released from very deep on the E side. Blue vapour was seen at times. Continuous rumbling and roaring noises were heard on the flanks of the volcano.
"There was a decrease in the ash content and the volume of the emissions on 21 and 22 January, with moderate thick white vapour and occasional dark-grey ash clouds being gently released. Very light ashfall was reported from Sule and Nuau. From 23 January until the end of the month emissions were generally moderate white vapour, some blue vapour, and occasional light-grey ash clouds. At times of low winds, the vapour column rose to over 2 km above the summit. There was almost continuous weak glow from the crater at night. No sounds were heard during this time. Seismic tremor remained at moderate levels. There were some variations in the tremor level 26-27 January, producing slight 'banding' on Helicorder records.
"An aerial inspection on the 29th gave the first clear view of the base of the crater. The inner walls were precipitous and the crater was perhaps 150-200 m deep. Steady incandescence from a body of lava was seen on the E side of the crater floor; no explosive activity was seen. Pale-grey, fresh-looking tephra was noted on the crater walls above the lava surface, and a septum had developed, bisecting the base of the crater."
Information Contacts: R. Stewart, P. de Saint-Ours, and C. McKee, RVO.
Activity continues to decline; glow observed in crater
"Activity . . . continued to decline following the brief phreatic or phreatomagmatic activity in mid-January (BGVN 18:01). However, activity is still above normal levels. Emissions throughout the month consisted of white vapour, in weak to moderate volumes. Blue vapour was seen occasionally. A steady weak night glow was seen 14-18 February. There were also unconfirmed reports of glow at other times during February.
"Seismic activity consisted of low-level, sub-continuous tremor with almost no discrete B-type events. The CVO's RSAM (Real-time Seismic Amplitude Measurement) system was deployed at the end of January to monitor tremor levels. From 29 January until 6 February the tremor level declined markedly. The system was inoperative until 17 February, when the tremor level was about the same as on the 6th. Helicorder readings indicated that tremor level was fairly constant from the 6th until the end of the month. This level of tremor is lower, by a factor of 2-3, than that seen during the peak of activity in mid-January and is comparable to the levels seen in early January.
"An aerial inspection on 18 February gave a reasonably clear view of the base of the crater. The source of the glow, on the E side of the crater, could not be seen directly. Only the glow's reflection on the walls of a vent at the crater base was seen. It was not possible to say whether this has changed since the last observation in January, but no other features in the crater have changed.
"EDM and dry-tilt surveys were carried out from 16-19 February. The EDM surveys showed little change since the last survey in September 1992, although there was some evidence of inflation at two stations high on the flanks. Dry-tilt results from two stations (S. Ridge and NW Valley, respectively 3 and 6.2 km from the summit) showed radial inflation of 25 and 17 µrads since September. Changes at three other stations were not conclusive."
Information Contacts: R. Stewart, P. de Saint-Ours, and C. McKee, RVO.
Activity continues at low level
"Activity . . . continued at the low levels reported for February. White vapour emissions usually varied from weak to moderate but were more forceful 26-27 March. Weak glow was reported on the 8th.
"Seismic activity was at a low level throughout the month; no distinct B-type earthquakes were recorded. Both RSAM and routine manual amplitude readings indicate a gradual decline in tremor levels since mid-February. However, the level of tremor is still higher than before January's brief flurry of activity."
Information Contacts: H. Patia, R. Stewart, and C. McKee, RVO.
Tremor level returns to background
"Activity continued at the low levels reported in the previous two months. Emissions of weak-to-moderate white vapour occurred throughout April, with stronger emissions on 3 and 6 April. Seismic activity was low throughout the month. RSAM showed that the slow decline in tremor amplitude seen in March continued until 20 April. After 20 April, the tremor amplitude remained constant, indicating that tremor had effectively ceased and the natural background noise was being recorded."
Information Contacts: N. LauerR. Stewart, and C. McKee, RVO.
Vapor emissions continue; seismicity very low
"Activity continued at a low level during May with weak-to-moderate emissions of white vapour. The level of seismic activity, as shown by the RSAM tremor monitor, has been steadily declining since the period of mild eruptive activity in January and February. Seismicity seems to have stabilized at a very low level since the end of March."
Information Contacts: I. Itikarai, P. de Saint-Ours, R. Stewart, and C. McKee, RVO.
Vapor emissions; slight increase in seismicity
"Visual activity continued to remain at low levels during June, July, August, and September. Emissions consisted of weak-to-moderate white vapour from June through August, with occasional white/blue vapour in June, August, and September. The RSAM seismic monitor showed an increase in activity for some short periods in July. It was not possible to confirm these observations from the conventional seismograph due to severe radio interference. The few records that were readable appeared to show low-frequency events or short bursts of tremor at times consistent with the RSAM observations. Seismic activity was low in June, August, and September."
Information Contacts: C. McKee, N. Lauer, L. Sipison, B. Talai, R. Stewart, and D. Lolok, RVO.
Activity level remains low
"Activity remained at a low level in October. Emissions consisted of weak-to-strong white vapour and occasional blue vapour. Seismicity remained low throughout the month."
Information Contacts: C. McKee, P. de Saint-Ours, and I. Itikarai, RVO.
Activity level remains low
"Activity remained at a low level for most of the month except for 10 and 11 November when forceful emissions of thick white vapour were observed. On the 11th, these emissions rose to ~100 m above the crater rim. Seismicity remained at a low level throughout the month."
Information Contacts: I. Itikarai, and C. McKee, RVO.
Sharp increase in seismicity followed by strong dark grey emissions
"There was an increase in the level of activity in April. At the beginning of the month, emissions consisted of moderate white vapour. However, these emissions changed through the month to strong thick white vapour and there were occasional reports of grey and blue emissions. On 19 April, very strong, thick, dark grey emissions were reported. Very fine ashfall was reported on the NW side of the volcano on 28 April, and steady weak red glow was seen on the 30th.
"Seismic monitoring was affected by telemetry problems from mid-March until 12 April. When the system was restored, daily earthquake totals were ~400-500. On 18 April there was a sharp increase to ~540 earthquakes/day. The daily totals then increased steadily through the remainder of the month to ~630 at month's end. Earthquake amplitudes showed a progressive increase after 12 April."
Information Contacts: I. Itikarai and C. McKee, RVO.
Seismically active and continuing to emit dark vapor
The increase in the level of venting activity . . . continued into May. Throughout the month the summit crater emitted moderate to thick white vapor, although there were occasional reports of gray and blue emissions on 17 and 18 May, and towards the end of the month. On 23 May, because of the ash cloud, pilots in the region were notified to "exercise caution and to report any increase in activity including height and movement of the ash cloud." In addition, during most nights in the first three weeks of the month the crater emitted a red glow that remained weak but steady.
May seismic activity underwent a slight progressive decrease: Daily earthquake totals early in the month were in the range 400-600; by month's end they had dropped to 400. Since the end of April earthquake amplitudes also decreased.
Information Contacts: I. Itikarai, and C. McKee, RVO; BOM, Darwin.
Strong vapor emissions and steady weak red glow from the summit
"The increase in activity . . . continued through June. During the first half of the month emissions from the summit crater were moderate to strong, consisting of thick white vapour. The emissions increased somewhat to strong thick white vapour in the second half of the month. Grey and blue emissions were also reported on 6, 15, and 21 June. Steady weak red summit crater glow was visible on 6 and 16 June only, compared with consistent steady glow in May until the 23rd. Weak rumbling noises were heard between 2000 and 2300 on 15 June, but these may have been distant thunder.
"Seismic activity in June consisted mainly of sub-continuous low-frequency tremor, with an occasional larger low-frequency earthquake. The RSAM monitoring showed that the seismicity level remained fairly steady throughout the month, with a slight dip in the middle. On a number of occasions, most notably on 9, 20, and 30 June, the activity almost totally stopped for short periods of usually less than an hour. The cause of this is not known. A small number of local high-frequency earthquakes continued to be recorded, although the rate declined during the month.
"On 20 and 21 June there were a number of high-frequency earthquakes with longer S-P times, around 3.5 seconds. Their signals look very similar to those from the earthquake swarms located near Bamus volcano (16 km SW) in 1990 (BGVN 15:2-5)."
Information Contacts: D. Lolok, R. Stewart, I. Itikarai, P. de Saint-Ours, and C. McKee, RVO.
White vapor emissions and low-frequency tremor
"The level of activity . . . was slightly lower in July . . . . The summit crater continued to emit mainly white vapour, of variable volume. Faint blue vapour emissions were seen on 3, 5, 9, and 20 July. No sounds or night glow were reported.
"Seismic activity . . . continued the pattern of previous months, with mainly sub-continuous, low-level, low-frequency tremor, and the occasional larger low-frequency earthquake. Only two high-frequency earthquakes were recorded during the month. Amplitude measurements and RSAM monitoring were made difficult at the start of the month by storm-generated noise. However, both showed a gradual increase through the month until about 23 July when there were sharp drops; gradual increases were again seen through the end of the month."
Information Contacts: B. Talai, R. Stewart, and C. McKee, RVO.
Low-frequency seismicity
"Seismic activity in August continued the pattern of previous months, with mainly sub-continuous low-frequency tremor and occasional larger low-frequency earthquakes. No high-frequency earthquakes were recorded."
Information Contacts: I. Itikarai, R. Stewart, and C. McKee, RVO.
White vapor emissions and low-level seismicity
Activity remained low from September through December 1994. Similar to previous months, white vapor emissions varied from profuse to moderately weak. Low-level seismicity continued.
Information Contacts: D. Lolok, R. Stewart, and B. Talai, RVO.
Continued moderate vapor emissions; SO2 data from October 1994
Activity on most days during January-March remained at a low level, with only moderate or moderate-strong thick white vapor emissions. Seismicity was low during the first week of January, the first three weeks of February, and the first three weeks of March; the seismograph was not operational at other times.
On 6 October 1994 the stratovolcano was visited by Chris McKee and Rod Stewart (RVO), and Stan Williams and Steve Schaefer (ASU), because of reports that the gas plume was abnormally large. Williams suggested that the plume appeared larger in volume and visible extent than during his two other visits in 1983 and 1989. Airborne COSPEC measurements made in clear atmospheric conditions showed the SO2 flux to be 1,260 ± 100 t/d. Prior measurements in 1983 and 1989 were 71 and 120 t/d, respectively.
Information Contacts: B. Talai, C. McKee, and R. Stewart, RVO; S. Williams and S. Schaefer, Arizona State University.
Variable vapor emissions
Activity throughout April-June continued at a low level. During April and May, emissions consisted of weak to strong white vapor, with occasional gray emissions during May. Ulawun released mostly weak to moderate white vapor, occasionally high in volume during June. On 2 June low volumes of blue vapor accompanied the white vapor. Neither audible noises nor summit glow were noted. Throughout April the seismograph was not operational. Seismicity was at a low level between 16 and 27 May, after which time none was recorded.
Information Contacts: Ima Itikarai and Ben Talai, RVO.
Modest degassing
During October-December emissions generally consisted of moderate-to-high amounts of white vapor. Gray emissions were also reportedly observed on three days in October and a number of days in November. Seismic activity was very low in October-November and unreported for December.
Information Contacts: Ben Talai, H. Patia, D. Lolok, and C. McKee, RVO.
Noiseless steaming and seismic quiet continue
During January and, although less closely monitored, during February, Ulawun continued to release moderate to high volumes of white vapor without any audible sounds. There were no night glows. Seismic activity was low during January; the equipment did not operate during February.
Information Contacts: Ima Itikarai and Ben Talai, RVO.
Still emitting low to moderate amounts of steam
As in previous months, during March Ulawun emitted weak to moderate volumes of white vapor. The seismograph did not operate.
Information Contacts: Ben Talai, RVO.
Low to moderate emission of steam continues
The low-level activity of previous months persisted through April and May. White vapor continued to be released in small to moderate volumes, but the rate decreased in May. Seismic activity remained at low levels. The seismograph became non-operational on 23 May.
Information Contacts: D. Lolok and C. McKee, RVO.
Steam emissions continue
The low-level activity of recent months persisted through June. Emissions consisted mainly of small to moderate volumes of white vapor. Seismic recording resumed on 28 June and showed low-level seismicity.
Information Contacts: D. Lolok, and C. McKee, RVO.
Vapor plume present throughout September
A white vapor plume was present throughout September. It appeared to vary in thickness, probably as a result of atmospheric conditions. Observed seismicity was low to moderate.
Information Contacts: B. Talai and H. Patia, RVO.
White vapor plumes throughout September
A white vapor plume was present throughout September; it appeared to vary in thickness, probably as a result of atmospheric conditions. Observed seismicity was low to moderate. An aerial inspection on 1 October, as part of the Ulawun Decade Volcano workshop, showed the summit crater to be open, ~150-200 m in diameter, with vertical sides descending at least 50 m before being lost in thick white fume.
Information Contacts: Patrice de Saint-Ours, Steve Saunders, and Ben Talai, RVO.
Explosions in mid-October-the first in 6.5 years
During the past 6.5 years, through September 1999, summit activity at Ulawun consisted of variable amounts of emissions that ranged from very thin white vapor to moderate volumes of thick white vapor. Seismic activity was generally low. Low frequency earthquakes were recorded. Their occurrence was very variable and the amplitudes of the events fluctuated, but remained near background levels. In June 1998 a number of high-frequency earthquakes began occurring, but have been very sporadic since.
After this period of very low activity, Ulawun produced moderate explosions at 2015 and 2049 (UT) on 19 October. The first explosion produced a thick dark ash column, visible in the moonlight, that rose several hundred meters above the summit before it was blown to the N and NW, causing ashfall on the flanks. The second explosion was smaller but also produced a dark ash column. People on Lolobau Island, ~18 km NW of Ulawun, observed very weak, dull glow on the summit. The partially working seismograph picked up tremor activity during the time of the explosions. The following morning, 20 October, summit activity consisted of thick volumes of white and occasionally gray vapor. This tapered off to moderate volumes of white vapor by the end of the month. Seismic activity also decreased to normal background levels.
Information Contacts: Ima Itikarai, Kila Mulina, and Steve Saunders, RVO.
White vapor emissions and low seismicity
After the mild eruption on 19 October, in November the activity at Ulawun reverted to its usual low level, gently releasing variable amounts of vapor. Seismicity was at background levels. Activity remained low in December. Visual observation reports during 1-21 December indicated that summit activity consisted of weak-to-moderate volumes of white vapor emissions. Seismicity remained low with low-frequency earthquakes through 16 December when the seismograph became unoperational.
Information Contacts: I. Itikarai, H.Patia, and F. Taranu, Rabaul Volcano Observatory (RVO), P.O. Box 386, Rabaul, Papua New Guinea.
Minor vapor emissions continue in early 2000
Low-level activity continued in January with weak emissions of thin white vapor throughout the month. Slightly stronger emissions occurred on 17 and 26 January. Emissions from the summit crater during February consisted of fluctuating volumes of thin-to-thick white vapor being released gently. March emissions consisted of thin white vapor. The seismograph remained out of operational.
Information Contacts: I. Itikarai, D. Lolok, K. Mulina, and F. Taranu, Rabaul Volcano Observatory (RVO), P.O. Box 386, Rabaul, Papua New Guinea.
Vapor emissions during May and June; moderate seismicity in June
This report covers the period from April to June 2000. There were no unusual reports from Ulawun in April. Throughout May, moderate to thick white vapor was emitted. Emissions in June consisted of thin white vapor. However, on 5 and 7 June, the emissions were thick white vapor. Seismic activity for June was at a moderate level.
Information Contacts: I. Itikarai, D. Lolok, K. Mulina, and F. Taranu, Rabaul Volcano Observatory (RVO), P.O. Box 386, Rabaul, Papua New Guinea.
Eruption on 29 September causes the evacuation of nearby towns
The previous Ulawun activity report from June 2000 stated that mainly thin, white vapor was emitted from the volcano and that seismicity was moderate (BGVN 25:07). There were no reports of anomalous activity until 29 September 2000 when a moderate-sized eruption occurred.
A Post Courier news article stated that the eruption began at 0230 on 29 September, but due to communication problems with the Rabaul Volcano Observatory's Mount Ulamona monitoring station they did not receive reports of the eruption until about 0800. The Darwin VAAC issued a volcanic ash advisory stating that volcanic activity was reported to them at 0605 through an air report from Air New Guinea airline, but there was evidence of an ash cloud in satellite imagery starting at about 0400.
Initially the ash cloud rose to ~10.7 km, rapidly grew at the top, and spread ~55 km from the N to the SW. Starting at about 0940 satellite imagery showed that the ash cloud spread to a width of ~110 km in an arc-shape oriented counterclockwise from the ENE to the WSW. The shape and width of the ash cloud were relatively constant until about 1840 when the ash cloud became too diffuse to separate from the surrounding meteorological clouds. At 0830 on 30 September ash emissions were limited to infrequent puffs. By 1223 there was no evidence of ash clouds in the proximity of Ulawan and continual satellite surveillance did not identify any ash from the initial eruption.
The Rabaul Volcano Observatory put Ulawun at stage two alert. Heavy ash fall from the eruption prompted government officials to evacuate 3,750 residents of areas near the volcano including Ubili town, Noau town, Voluvolu villages, and Navo plantations. As of 5 October activity had declined and was relatively stable, but the evacuation orders were still in effect. Several news articles have linked the volcanism at Ulawun to the increased level of activity at Rabaul which is ~150 km to the NE of Ulawun, but according to a Post Courier article the East New Britain Provincial Disaster Committee stated that there was no correlation between the volcanoes' activity.
Information Contacts: Darwin VAAC, Regional Director, Bureau of Meteorology, Northern Territory Regional Office, PO Box 40050, Casuarina, Northern Territory 0811, Australia (URL: http://www.bom.gov.au/info/vaac/); Post Courier (URL: http://www.postcourier.com.pg); Australian Broadcasting Corporation News (URL: http://www. abc.net.au/news/).
An eruption during 28 September-2 October 2000 sends a plume to 10-12 km
An eruption from Ulawun that started on 28 September continued until 2 October 2000 (BGVN 25:08). Preliminary information was based on news media reports and aviation sources. The Rabaul Volcano Observatory (RVO) has since provided more accurate and detailed reports for the August-October 2000 period.
Activity during August. During August, summit activity remained low, chiefly consisting of weak releases of thin white vapor. While the summit activity remained quiet, some obvious changes were recorded in seismicity and ground deformation (electronic tiltmeter).
High-frequency earthquakes had occurred sporadically since mid-1998 in very low numbers (~1/day). A brief period of recording in April 2000 registered ~ 2/day. In mid-June 2000, following the resumption of seismic recording, high-frequency earthquakes were first seen to have increased to 15-20/day. This comparatively high number of earthquakes continued through July and August. Deployment of a portable seismograph during 13-15 August indicated these earthquakes had epicenters at Ulawun.
During August, low-frequency earthquakes occurred as usual. On about 26 August, both amplitudes and event counts dropped by a factor of three. Also beginning in August, an electronic tiltmeter located on the flanks ~2.5 km WSW of the crater vent began to show some inflation on the NS component. By month-end about 7 µrad of inflationary tilt was recorded. The EW component (radial to the vent) lacked changes.
Eruption of 28 September-2 October. A relatively small-to-moderate eruption began on 28 September 2000. Several long-term precursors to the eruption were unambiguous. High-frequency earthquakes increased dramatically after June 2000. Electronic tiltmeter trends showed inflation beginning in early August 2000. Short-term, immediate precursors included an increase in both the number of low-frequency earthquakes and the real-time seismic amplitude measurements (RSAM). The latter began to escalate on 27 September 2000.
The late-stage build-up towards the eruption began at 2200 on 27 September with an increase in low-frequency earthquakes and their amplitudes. A further increase in seismicity took place at about 0200 on the 28th. There began a series of small nonharmonic volcanic tremors with durations up to a few minutes. These increased between 1200 and 1800 on the 28th.
The late-stage buildup also appeared in RSAM readings. RSAM values changed at 2200 on the 27th from a background level of 2 units, rising at 1200 on the 28th to ~10 units, then by 1800 to 30 units. After 1800, RSAM values continued to rise and the instruments registered intense continuous volcanic tremor. Around this time the RSAM counts exhibited an artificial decline attributed to an overwhelmed event-counting system.
Other notable changes in the character of the RSAM plot occurred at 2240 on the 28th, and at 0115 and 0240 on the 29th. The first two times correlated with behavior noted by the observer watching the summit crater. Specifically, at 2240 on the 28th the observer saw the first glow reflecting off an ash-cloud emission. RVO scientists mark this as the beginning of the eruption. At 0120 on the 29th, production of incandescent lava fragments intensified, indicating the onset of a Strombolian eruption.
At 0240 on 29 November, the RSAM peaked at 8045 units. Thus, scientists inferred this as the time when the Strombolian phase of the eruption peaked. During the cover of darkness, ash clouds were just visible, initially illuminated by the glow and gradually by incandescent fragments. The latter became common by about 1200 on the 29th when ash clouds were seen blowing NW. The ash clouds began to become voluminous from 0100 on the 29th, coinciding with the intensification of the Strombolian phase of the eruption. The ash clouds were emitted forcefully, accompanied by loud roaring and rumbling noises.
By first light on 29 September people some distance away from Ulawun were able to see a thick vertical eruption column that rose ~12-15 km above the summit (figure 2). In relatively clear morning weather, the eruption column was visible from Rabaul, ~130 km NE of Ulawun. By this time ash clouds had blown WSW to NW. Roaring and rumbling noises ceased at about 1000 and resumed again at about 1300. At about this time also, there was a slight and brief change in wind direction resulting in the eruption's ash clouds being redirected to the N and NE.
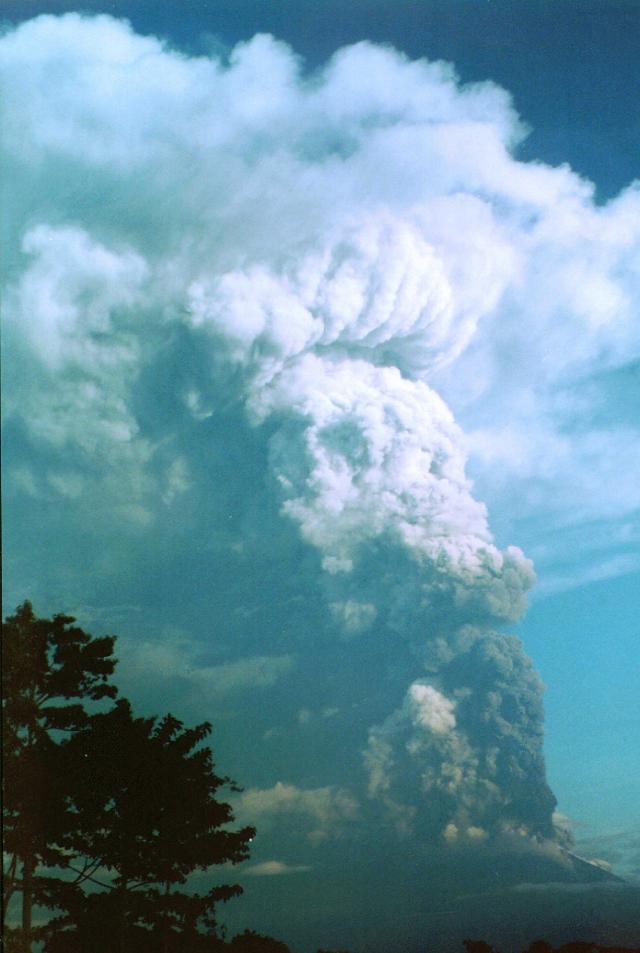 |
Figure 2. Photograph showing the late stages of the ascending eruption column from Ulawun between 0600 and 0700 on 29 September 2000. The column was estimated to be 12-15 km high. Photographed from about 15 km SE of Ulawun by Dave Wright of New Tribes Mission. Courtesy of RVO. |
The eruption continued into the night of 29 September, forcefully ejecting thick, dark, and ash-laden clouds. Explosive roaring and rumbling noises stopped at about 2200 on 29 September and projections of incandescent lava fragments began to subside at about the same time. By 0230 on 30 September, strong discharges had already stopped and glow at the summit had ceased. When daylight came, the summit activity was relatively quiet, involving only puffs of small dark gray ash clouds. A further decline reduced emissions to very thin white vapor by nightfall.
The eruption produced a moderate amount of ashfall. Ashfall was heavy 10 km downwind of the vent. Beyond that, the amount of ashfall was much reduced, lessening still further away from the vent. The ashfall destroyed gardens and cash-crop plantations within 10 km of its main path. Satellite images of the ash distribution showed that the ash was blown downwind 80-100 km from the vent.
The eruption produced three pyroclastic flows. They traveled down pre-existing gullies on the N, NW, and SE flanks. During past eruptions, pyroclastic flows also followed the same gullies down from the cone's 2,300 m summit elevation. The N-directed pyroclastic flow was the biggest. It descended to 580 m elevation. The NW-directed pyroclastic flow was the second biggest. It divided into two arms at 900 m elevation and its terminus reached an elevation similar to the one on the N flank. The SE flow was relatively small. The eruption lacked lava flows.
Scientists inspected the crater area from the air on 7 October and found two vents on the summit (labeled Vents A and B on figure 3). Comparing Vent A to its appearance during 1993, the overall depth of the crater floor appeared to have risen, becoming about 100-150 m shallower. The fill consisted of older material that collapsed from the inner crater wall and possibly new ejecta from the current eruption. A prominent breach on the N crater rim was evident and may have been created by the N pyroclastic flow. Judging by its close proximity, this flow originated from Vent B. En-echelon cracks on the E end of the crater suggested inward sagging of that side of the crater rim. At the time of the inspection, few emissions escaped the vents; however, traces of white and blue vapor wafted from other areas inside the crater.
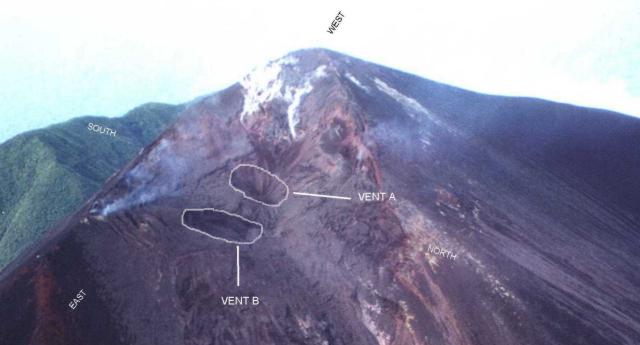 |
Figure 3. An oblique aerial photo showing Ulawun's summit area and Vents A and B between 0800 and 0900 on 7 October 2000. Other visible features include a breach on the NNE crater rim caused by the avalanche of pyroclastic flow material from Vent B. Photographed by Ima Itikarai; courtesy of RVO. |
There were reports of multiple vents during past eruptions. However, aerial inspections in 1985 and 1993 only revealed evidence of Vent A. Ulawun had a flank eruption on the SE side during the 1978 eruption.
RVO staff in Rabaul established communication links with the volcano observer based near Ulawun at 1606 on 27 September after noting increased RSAM values. Data from Ulawun were transmitted to RVO every 20 minutes. The RSAM values led to discussions with civil authorities and directions to local residents throughout the night at two-hour intervals. During the process, alert stages one and two were declared. This resulted in evacuating the local population, an effort accomplished with the help of a local timber company. Assistance was later provided by the West New Britain Provincial Government. This time-line of events is contrary to preliminary information (BGVN 25:08). that relied on local news media.
Activity during October. By 3 October the volcano produced only thin white vapor with no noise or night glow. Various ancillary observations occurred in the next weeks: during 6, 8, 10, 14, 15, 16, 17, 18 October and 1 November observers noted low rumbling or banging or both; when under cover of darkness they usually saw accompanying weak, steady glows. In at least one case they smelled sulfurous odors.
The noises at 1000 on 1 November accompanied a thick dark ash cloud that rose 100-200 m above the summit. By 1100 silent ash clouds were seen forcefully rising ~200 m above the summit. Activity then declined for a few hours until 1430-1700, an interval when observers saw thick dark gray ash clouds and occasionally heard weak rumblings. Activity quieted after that and by 2 November emissions had returned to white vapor without noise or night glow.
On 13 and 17 October small mudflows occurred, originating on the upper NW flanks and sweeping down a dry creek through Ubili village and then to the sea. At certain places the flows spread laterally. No reported damage or casualties were caused by either mudflow.
October seismicity included tremor and numerous low-frequency earthquakes. Volcanic tremors were dominant during 1-4, 8-11, and 30-31 October. The low-frequency earthquakes can be characterized by RSAM data. On 1 October RSAM stood at ~30-40 units; steady decline brought the 7 October RSAM to ~5 units. On the 8th and 11th there followed peaks of over 20 units. After that RSAM declined steadily until it reached background levels on 20 October. On 30 October, RSAM underwent a sudden increase to ~20-30 units heralding the brief 1 November eruption.
The single electronic tiltmeter located on the high WSW flank showed a steady change throughout October. The behavior could possibly be related to edifice inflation.
Information Contacts: Ima Itikarai, David Lolok, Herman Patia, and Steve Saunders, Rabaul Volcano Observatory (RVO), P.O. Box 386, Rabaul, Papua New Guinea.
Eruption on 30 April 2001 sends an ash cloud to a height of ~13.7 km
On 30 April 2001 a moderate-sized ash cloud from an eruption at Ulawun was visible on Geostationary Meteorological Satellite (GMS), U.S. National Oceanic and Atmospheric Administration (NOAA) weather satellite, and Total Ozone Mapping Spectrometer (TOMS) imagery. There had been no reports of anomalous volcanic activity at Ulawun since the 28 September-2 October 2000 eruption sent an ash cloud 12-15 km above the volcano (BGVN 25:11).
The Darwin VAAC received a pilot report that a "smoke" cloud had been emitted from Ulawun on 30 April at 0730. The Rabaul Volcano Observatory (RVO) confirmed the report. The cloud reached an altitude of ~9 km and drifted NW and SW, expanding to 80-113 km in radius. GMS and NOAA weather satellite imagery indicated that the cloud may have reached a maximum height of ~13.7 km and that the eruption ceased by approximately 1530. By 3 May volcanic activity had decreased, but, because further ash emissions could occur, RVO placed the volcano at Stage 2 Alert. RVO reported that limited evacuations occurred. Ash was not observed on satellite imagery after the 30 April eruption, although ash clouds may have been obscured by meteorological clouds near the volcano.
On 30 April around noon, a few hours after reports of an eruption at Ulawun, the Earth Probe TOMS detected a SO2 cloud over SW New Britain,. A gap between successive TOMS swaths over the volcano unfortunately precluded measurement of the full extent of this cloud. Elevated levels of SO2 were recorded in a region bounded approximately by longitudes 147°E and 150°E (swath edge) and by latitudes 5°S and 7°S, at a maximum distance of ~400 km WSW from Ulawun. The highest SO2 concentrations (38 milli atm cm) were recorded in a NNW-SSE trending region ~300 km WSW of the volcano. Preliminary analysis indicates that the portion of the cloud visible in TOMS imagery contained ~5 kilotons of SO2.
Information Contacts: Darwin VAAC, Regional Director, Bureau of Meteorology, Northern Territory Regional Office, PO Box 40050, Casuarina, Northern Territory 0811, Australia (URL: http://www.bom.gov.au/info/vaac/); Simon Carn, Joint Center for Earth System Technology (NASA/UMBC), University of Maryland Baltimore County, 1000 Hilltop Circle Baltimore, MD 21250.
New vent opens during April-May eruption
A previous report about the eruption plumes of late April-early May was based on information received from satellites (e.g., TOMS, which disclosed 5 ktons of SO2) and the Darwin VAAC (BGVN 26:05). This follow-up recounts ground-based reports from the Rabaul Volcano Observatory (RVO). It covers the new flank-vent eruption and its preceding events. Ulawun's prior eruption was about 7 months earlier (BGVN 25:11).
On 25 April, Ulawun began what appeared to ground-based observers as a relatively small eruption that lasted about 6 days (ending the 30th). Activity had been low from the beginning of April until the 24th, with the summit venting mainly small, occasionally moderate volumes of steam. Seismicity consisted mainly of low-frequency earthquakes, which had been present for many months, even before the September 2000 eruption. The low-frequency earthquakes were slightly larger than the usual earthquakes recorded when Ulawun is quiet, but no particular pattern indicated that these earthquakes were forerunners to an eruption. Earthquakes such as these were rare before the build-up to the September eruption, but they have continued since then.
Ashfall from the 25-30 April eruption blew mainly N and NW during the second and third Strombolian episodes, 27-29 April. Most ash fell along a NW-trending axis (270-300° from the summit). Nearby residents were evacuated, and as of 14 June were allowed to return home. No damage or casualties were reported.
Behavior in months prior to the 25 April eruption. Ongoing sporadic tremors followed the 28 September 2000 eruption for most of October-January. A swarm of earthquakes occurred between 31 January and 1 February 2001. The only break in activity was in February, March, and the first part of April.
The high seismicity on 31 January was followed the next day by occasional deep roaring and rumbling noises. On 2 February thick dark-gray and gray-brown emissions caused ashfall to the NW around Ubili village. Poor visibility after 0800 prevented further observations. The next day weak-to-moderate thin white vapor was observed. Similar summit activity was reported on 4 February with occasional booming noises between 1300 and 1400. After the 5th, thin white vapor was present on most days in February.
Seismicity during 31 January-2 February was characterized by B-type volcanic events, which occurred at irregular intervals. During the last week of January, continuous background volcanic tremor was recorded. On the morning of 31 January the seismicity suddenly changed to distinct B-type events. Within a few hours the events intensified and became hard to distinguish due to signal overlap on the analog records. The intense seismic activity lasted for several hours and then declined to a low level. It remained relatively low, with distinct B-type events, until the morning of 2 February, when the B-type events intensified again. Afterwards, seismicity declined to a very low level. Distinct B-type events continued, but in very low numbers. A-type volcanic events also occurred throughout February, but the month was generally quiet.
Most of March was also quiet, characterized by thin white vapor emission, except on 2-4 March when occasional weak puffs of gray-brown ash were produced. Villagers on the N, NW, and SW sides of the volcano reported rumbling and booming noises associated with the ash puffs. A weak, steady glow was observed on 27 March. Low-frequency earthquakes continued throughout the month with an average of 60 per day. Some high-frequency earthquakes also occurred, but no volcanic tremors were recorded during March.
The highest seismicity outside of the eruption took place between 31 January and 1 February. It was followed by a rapid inflation of 3-4 µrad in a few days. This was followed by deflation of about 10 times less. The September 2000 and April 2001 eruptions occurred during deflationary periods preceded by a few months of inflation. In retrospect one might speculate that the seismic swarm and inflation were signs of rapid intrusion of significant volumes of magma to a shallow depth.
Behavior in the days prior to the 25 April eruption. The eruption was preceded by volcanic tremors commencing at about 0600 on 22 April. The tremors were initially small, but at about 2100 the they increased in amplitude and became sub-continuous. On 24 April at 1400 the tremors increased again, making it hard to detect patterns in the analog records.
This was when RSAM (Real-time Seismic Amplitude Measurement) data became useful. According to the RSAM, after 1400 tremor levels increased exponentially until about 1800 on the 25th, when it began to fluctuate. The start of the fluctuations coincided with the beginning of a steady weak glow from the summit vent. Earlier, occasional forceful emissions of weak to moderate gray ash clouds had begun at about 0600 on the 25th, and occasional low rumbling noises began at about 1600. Activation of Stage 1 of the Ulawun Volcano Stage of Alert system was recommended to authorities at 0200 on the 25th.
Phases of the 25-30 April eruption. Volcanism on 25 April consisted of a steady weak red glow, occasional rumbling noises, and thick ash clouds. This lasted until about 0530 on 26 April, when a small Strombolian eruption began. Glowing lava fragments ejected by frequent explosions were restricted to the summit's N and NE sides. Small pyroclastic flows occurred, but also failed to progress beyond the summit area. Ash clouds blew NW dropping very fine ash. The Strombolian activity lasted about an hour. Activity then subsided and noises became infrequent; but forceful ash-bearing emissions continued.
Activity reached a low at about 0300 on the 27th before another phase of Strombolian eruption began at about 0530. The build-up to the second phase was very rapid. Stage 2 hazard status was recommended at 1630 on the 27th. Activity was sustained at an intense level for about 30 hours from 0530 on the 27th to about 1130 on the 28th. Incandescent lava fragments (visible in the early morning) and other rock material from the intense activity rolled almost a third of the way down the slopes. Eruptive material was seen on all sides of the volcano, but most went N and NE, suggesting emissions came from near Vent B (BGVN 25:11) at 1,600-1,800 m elevation. In this interval a pyroclastic flow traveled N-NE following the path of the pyroclastic flow of 28-29 September 2000. The run-out distance of the pyroclastic flow exceeded that of the flow from the September eruption. A lava flow also followed the same path. The distal end of the lava flow reached about 500-600 m elevation.
Another period of slightly lower activity followed the second phase of the eruption. The third phase of Strombolian eruption began at about 0600 on the 29th. This phase was slower and more gradual, peaking at about 1800-2000 on the 29th.
Early in this phase, local people reported ash emissions from a site in a gully where the pyroclastic and lava flows had passed. It was later confirmed that a dike had reached the surface, resulting in a fissure where ash emissions were released. A lava lobe protruded from the new vent and extended about 20 m downslope. Figure 4 shows a mild explosion from this vent on 3 May. Dike intrusions were also observed during the 1978 eruption at Ulawun, and resulted in surface fissure activity on the higher SE slopes and farther down on the E slope, which produced a lava flow.
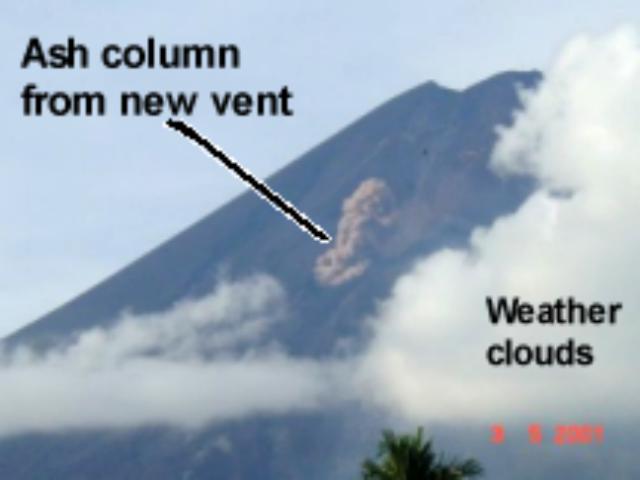 |
Figure 4. A mild explosion on 3 May 2001 from the new vent on Ulawun's NNE flank. The photo was taken just three days after the 25-30 April eruption ended. This fortuitous view of the small ash cloud helped fixed the new vent's location. Courtesy of Ima Itikara, RVO. |
The last phase of this Strombolian eruption fluctuated before it began to decline at about 1130 on 30 April; the eruption stopped at about 2400. Although the 25 April eruption was comparatively small, the development of radial fissures from dike intrusions in the upper interior of the volcanic system might contribute to weaknesses in the structure of the volcano (figure 5).
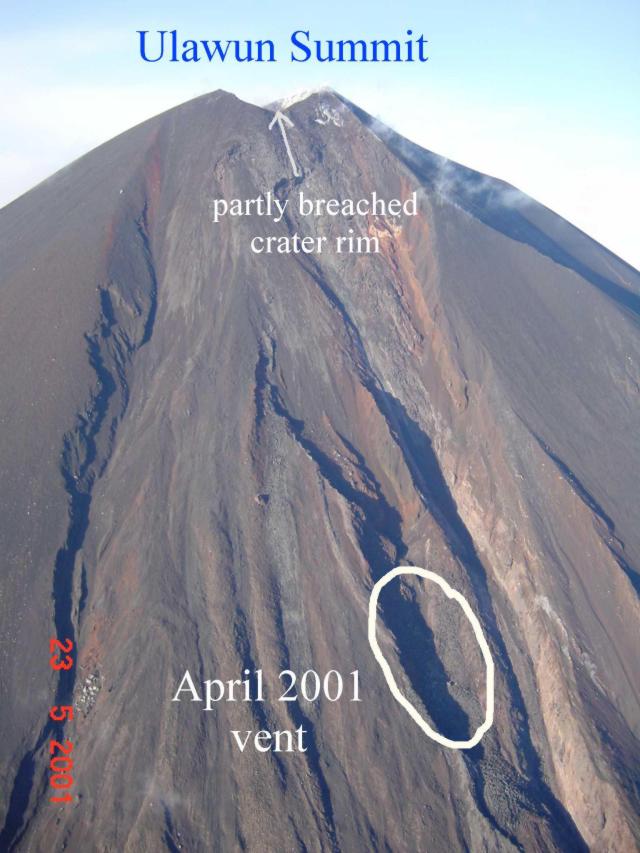 |
Figure 5. The summit and NNE flanks of Ulawun taken 23 May 2001 showing the whereabouts of the new vent near the head of a ravine and a notch in the summit crater's wall at a point upslope from the ravine and vent. The new fissure-shaped vent is not directly visible in this shot; it lies in shadow at the ravine's bottom, and it is not degassing. Courtesy of Ima Itikara, RVO. |
Information Contacts: Ima Itikarai, Rabaul Volcano Observatory (RVO), P.O. Box 386, Rabaul, Papua New Guinea.
Isolated tremor episodes and slow deflation through March 2002
An eruption occurred at Ulawun during 25-30 April 2001 (BGVN 26:06). Limited evacuations occurred on 3 May due to the occurrence of relatively high seismic activity and the possibility of further volcanic activity. On 14 June the Rabaul Volcanological Observatory (RVO) recommended that the Alert Level be reduced from 2 to 1. At this stage of alert, people could move back to their homes with the approval of the local disaster committee.
Volcanic tremor began at 2200 on 24 September. It peaked at about 1000 on 27 September and generally declined afterward. By 30 September seismic activity was at moderate levels. During 27-30 September a very slow deflationary trend was detected. Volcanic tremor continued to occur at moderate-to-high levels until it dropped dramatically on 11 October. After 11 October seismicity only consisted of discrete low-frequency earthquakes. On 8 and 9 October loud roaring noises emanated from the volcano.
During October through March 2002 activity was generally low. The main crater produced weak-to-moderate volumes of white and white-gray vapor. The N valley vent occasionally released weak volumes of thin white vapor. RSAM data revealed conspicuous seismicity on 26 October; incandescence was observed that night. A rapid trend of deflation beneath the summit area during the previous two weeks stopped on 24 December.
During mid-February tremor increased to moderate levels for the first time since December 2001. On 21 February weak roaring noises were heard and weak incandescence was visible for a short time. After 22 February tremor returned to background levels. Seismic activity returned to background levels after volcanic tremor ceased on 18 March. Discrete low-frequency earthquakes continued to occur in small numbers. The electronic tiltmeter continued to show long-term deflation of the summit area. Based on recent observations, activity at Ulawun is expected to remain low.
General References. Johnson, R.W., Davies, R.A., and White, A.J.R., 1972, Ulawun volcano, New Britain: Australia Bureau of Mineral Resources, Geology and Geophysics, Bulletin 142, 42 p.
McKee, C.O., 1983, Volcanic hazards at Ulawun volcano: Geological Survey of Papua New Guinea Report 83/13, 21 p.
Information Contacts: Ima Itikarai, Rabaul Volcano Observatory (RVO), P.O. Box 386, Rabaul, Papua New Guinea.
Ash eruptions during August 2002; plumes visible on satellite imagery
A NNW-trending plume was visible from Ulawun on MODIS imagery on 22 August 2002 (figure 6). The Darwin VAAC reported that on 28 August at 0732 a low-level ash cloud from an eruption at Ulawun was visible on satellite imagery. By 1532 the same day ash was no longer visible. According to a Post-Courier news article, ash eruptions had occurred on 26 August and during the previous week, but became larger on the 27th. As of the 28th, care centers were preparing for possible evacuations. NASA satellite images provided by the Air Force Weather Agency showed a NW-trending plume on 6 September (figure 7). The next day the Darwin VAAC reported a low-level (less than ~3.6 km altitude) ash plume visible on satellite imagery, extending NW.
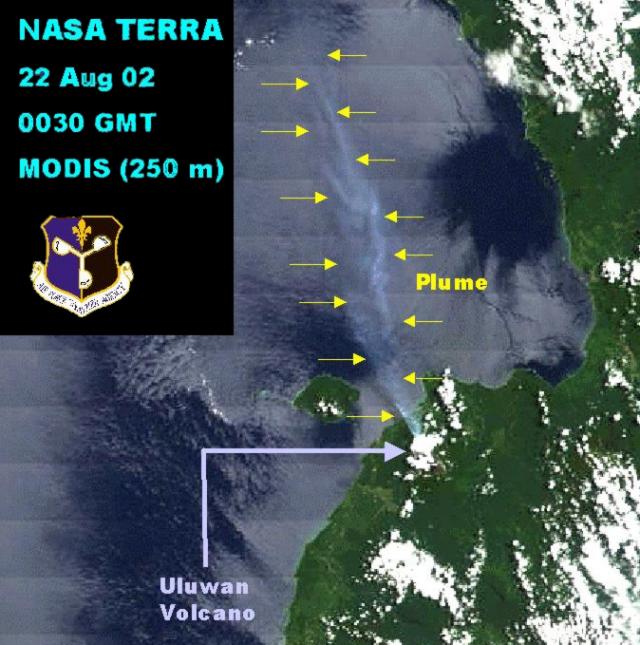 |
Figure 6. MODIS imagery on 22 August 2002 at 0030 (UTC) shows a NNW-trending plume from Ulawun. The land appears slightly darker in the image than the sea. Courtesy Air Force Weather Agency. |
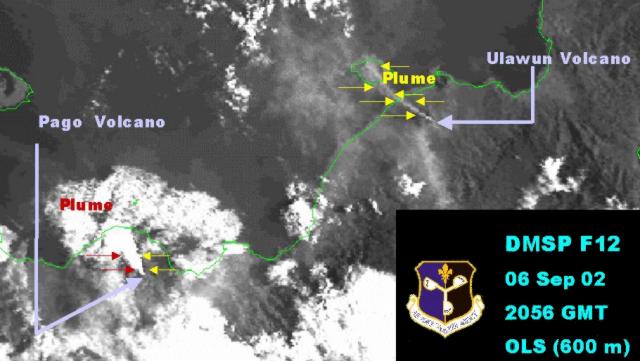 |
Figure 7. MODIS imagery on 6 September 2002 at 2056 (UTC) shows a NW-trending plume from Ulawun. Courtesy Air Force Weather Agency. |
Information Contacts: Darwin Volcanic Ash Advisory Center (VAAC), Bureau of Meteorology, Northern Territory Regional Office, PO Box 40050, Casuarina, NT 0811, Australia (URL: http://www.bom.gov.au/info/vaac/); Charles Holliday, Air Force Weather Agency (AFWA), Satellite Applications Branch, Offutt AFB, NE 68113-4039; Post Courier Online, http://www.postcourier.com.pg/20020828/news09.
Intermittent ash plumes from August through early November 2002
During mid-March 2002 through at least early February 2003, activity from the main crater and the N valley vents of Ulawun were unchanged and generally remained low. The vent in the main crater released weak-to-moderate volumes of white and white-gray vapor. The N valley vents sometimes produced very weak traces of thin white vapor. Seismicity returned to background levels after volcanic tremors ceased on 18 March 2002. Discrete low-frequency earthquakes continued to occur in small numbers. During 15-28 April the seismicity level was low, however from 29 April seismicity increased to a moderate level following an episode of continuous volcanic tremor. The tremor ceased on 25 May. In June, RVO reported that the electronic tiltmeter continued to show long-term deflation of the summit area, but the amount of change was smaller than in the previous 1-3 months. Small continuous volcanic tremors became more prominent beginning on 21 January 2003 and ceased on 27 January.
Satellite imagery showed eruption plumes on 22 and 28 August (news reports indicated continued activity that entire week), and 6-7 September 2002 (BGVN 27:08). The Darwin VAAC issued advisories about low-level ash plumes on 12 and 19 September, and an ash-and-steam cloud to ~3.7 km on 28 September. Low-level ash plumes were noted again on 2 and 16 October, with another higher plume (~3.6 km) on the 22nd. At 0630 on 3 November an Air Niugini pilot reported ash drifting ESE from the volcano at ~3 km altitude.
MODVOLC Thermal Alerts, 2001-2002. Throughout 2001 and 2002, thermal alerts for Ulawun occurred only during 26-28 April 2001. The first detected anomaly was at 2225 on 26 April and consisted of four alert-pixels with a maximum alert ratio of -0.095. By the following day the anomaly had increased in spatial dimension to eight alert-pixels although the maximum alert ratio was lower (-0.224). On 28 April at 2215 the anomaly had increased to 15 alert-pixels with a higher maximum alert ratio of -0.053. After that no more anomalies were detected.
This sequence can be related to events reported by the Rabaul Volcano Observatory (BGVN 26:06) On 26 April 2001 at 0530 a small Strombolian eruption began. This was characterized by glowing lava fragments ejected by frequent explosions followed by small pyroclastic flows. During the day activity decreased but on 27 April at 0530 another phase of Strombolian activity began. A small pyroclastic flow occurred followed by a lava flow that descended to about 500-600 m above sea-level. This is presumably the cause of the 15-pixel alert on 28 April (figure 8). A third phase of Strombolian activity began at about 0600 on 29 April. This phase was slower and more gradual, peaking at about 1800-2200 on 29 April, and did not produce a MODIS thermal alert.
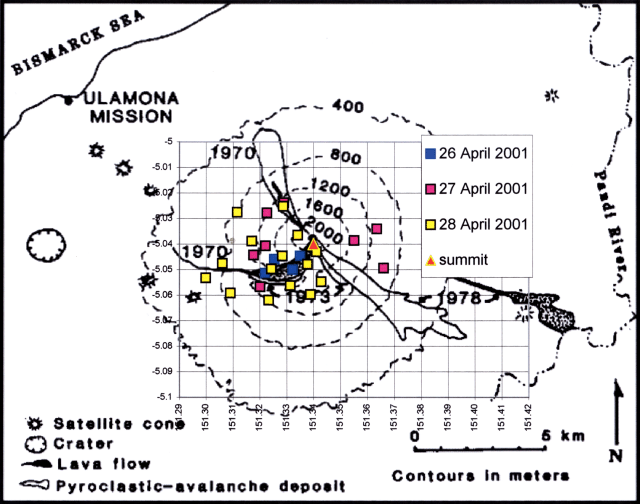 |
Figure 8. Locations of MODIS alert-pixels on Ulawun during 2001-2002. Courtesy of Diego Coppola and David Rothery, The Open University. |
Information Contacts: Ima Itikarai, Rabaul Volcano Observatory (RVO), P.O. Box 386, Rabaul, Papua New Guinea; Darwin Volcanic Ash Advisory Center (VAAC), Bureau of Meteorology, Northern Territory Regional Office, PO Box 40050, Casuarina, NT 0811, Australia (URL: http://www.bom.gov.au/info/vaac/); Diego Coppola and David A. Rothery, Department of Earth Sciences, The Open University, Milton Keynes, MK7 6AA, United Kingdom.
Variable seismicity and minor deflation; debris flows in February
The main summit crater continued to release variable amounts of thin-to-thick white vapor during January-March 2003, and no activity was observed from the N valley vent that formed in May 2001. Heavy rains during February and especially on the 19th, 21st, 22nd, and 24th, caused debris flows on the NW side of Ulawun. The debris channeled into Namo creek and later swept down to the coast. Along its course it overflowed into Ubili village. Muddy water flowed into six houses built on concrete floors and left a thin sheet of dried mud a few centimeters thick.
The long-term deformation trend based on measurements from an electronic tiltmeter is slow deflation of the summit area. No significant changes were noted in January. In February there was 2 µrad of deflation, and measurements showed a very small amount (~2-3 µrad) of deflation between the beginning of March through the 25th. After that the trend became steady.
Seismic activity had been low through January-February, but an increase was evident starting on 2 March. This was shown by an increase in RSAM values on the same day. The increased activity remained at low to moderate levels between 2 and 12 March. After that, it declined gradually, reaching low levels on the 20th. Due to technical problems with the only seismograph to monitor Ulawun, no analogue waveforms were recorded, making it difficult to ascertain the type of seismicity associated with the increased RSAM values. However, it is assumed that another of the sporadic volcanic tremor episodes recorded since the September 2000 and April 2001 eruptions was the cause.
Information Contacts: Ima Itikarai, Rabaul Volcano Observatory (RVO), P.O. Box 386, Rabaul, Papua New Guinea.
White vapor emissions from the main crater; offshore effervescence
Variable amounts of emergent vapor and minor debris flows at Ulawun were reported during January-March 2003 (BGVN 28:03). Rabaul Volcanological Observatory (RVO) reports, covering much of the period 14 April-5 October 2003, indicated the volcano remained quiet over this time, without emissions from the N-valley vent.
The main summit crater continued to release weak to moderate volumes of white (occasionally white-gray) vapor during 14-29 April, 7-27 May, and 11-18 June. Seismicity was low except for an episode of volcanic tremor between 15 and 19 April. Gas effervescence was reported close offshore of Ulamona Jetty in the second half of April. A slight increase in seismicity was noted between 18 and 23 May.
The period 25 June-22 July was quiet, with no audible noise or night-time glow, and weak to moderate volumes of vapor from the main summit crater. The Volcanic Ash Advisory Center in Darwin reported these plumes as being visible on weather satellite imagery. The plumes appeared white-gray on occasions and were unusually strong bluish white gray over the last three days of the period. Volcanic seismicity was low, with several strongly felt tectonic earthquakes on the night of 3-4 July. A large regional earthquake centered 45 km N of Rabaul affected the area on 16 July, leading to a large tiltmeter offset, which slowly recovered over the following days.
Reports for the period 12 September-5 October indicated that the main summit continued to release weak to moderate volumes of white vapor, with occasional white-gray emissions. Seismicity was low with no significant ground movements.
Information Contacts: Ima Itikarai, Rabaul Volcanological Observatory, P.O. Box 386, Rabaul, Papua New Guinea; Darwin Volcanic Ash Advisory Centre (VAAC), Bureau of Meteorology, Northern Territory Regional Office, PO Box 40050, Casuarina, NT 0811, Australia (URL: http://www.bom.gov.au/info/vaac/).
Intermittent ash plumes during September-October
The Darwin Volcanic Ash Advisory Centre reported that an ash plume from Ulawun was visible on satellite imagery on 22 September at an altitude of ~3.7 km extending NW. On 5 October a faint ash plume was identified on satellite imagery at ~4.3 km altitude, extending 55 km WSW of the summit. Another ash plume was seen reaching ~75 km WNW of the summit on satellite imagery on 10 October at an altitude around 3 km.
According to the Rabaul Volcano Observatory, the main summit crater at Ulawun released weak to moderate volumes of white-gray vapor emissions over the period 6 November-22 December 2003. The two north valley vents were quiet, with no emissions observed. The seismograph, restored on 31 October 2003; showed seismicity was low throughout this period, with small low frequency volcanic earthquakes and some high frequency volcano-tectonic events. The electronic tiltmeter, restored at the same time; recorded no significant changes.
Information Contacts: Ima Itikarai, Rabaul Volcano Observatory (RVO), P.O. Box 386, Rabaul, Papua New Guinea; Darwin Volcanic Ash Advisory Centre (VAAC), Commonwealth Bureau of Meteorology, Northern Territory Regional Office, PO Box 40050, Casuarina, NT 0811, Australia (URL: http://www.bom.gov.au/info/vaac/).
Tabulation of aviation reports issued during 2000-mid-2003
Activity on Ulawun occurs frequently and is monitored and reported from several sources including the Rabaul Volcano Observatory (RVO), the Darwin Volcanic Ash Advisory Center (VAAC), the U.S. Air Force Weather Agency (AFWA), and imagery from several satellites including NOAA GMS (daylight) and MODIS (infrared). The continuing activity after an eruption on 28 September 2000 (see BGVN 25:08) resulted in BGVN reports every few months since that event (BGVN reports on Ulawun have appeared in nine subsequent issues through the end of 2003).
This issue supplements the Bulletin reports with those from the Darwin VAAC archives (table 2), which included information provided from ground, airborne, and space-based sensing. RVO reports that Ulawun remained quiet during February 2004. Emissions from the main vent consisted of white vapor being released at weak to moderate rates. No noise or night-time glow were reported during the month. No emission was reported from the two N-valley vents. Seismicity was at a low level.
Table 2. Dates of issue and the principal comments in Darwin VAAC reports concerning Ulawun, September 2000-July 2003. Similar or duplicate messages are not shown. In many cases ash cloud trajectory information has been omitted. On this table, the distance unit Nautical Miles (NM) has not been converted to kilometers (1 NM = 1.852 km (exactly)). Courtesy of the Darwin VAAC.
| Date | Source | Eruption Details / Ash Cloud |
| 28 Sep 2000 | AIREP, AIR NIUGINI, ANK. | Volcanic Activity reported at 28/2005Z - Ash plume to 11 km, rapid growth at top, spreading out 30 NM to N to SW. ASH CLOUD: Latest satellite imagery shows possible ash cloud extending 60 NM in an arc from ENE to the WSW. |
| 29 Sep 2000 | AIREP, AIR NIUGINI, ANK. | There is evidence of volcanic ash on satellite imagery from 28/1800Z |
| 30 Sep 2000 | AIREP/Geological Survey Papua New Guinea. | The Geological Survey confirms this eruption and notes that limited evacuations have commenced with the prospect of further seismic and eruptive activity. However 29/2230Z ash emissions were limited to infrequent puffs. |
| 01 Oct 2000 | AIREP/Geological Survey Papua New Guinea. | A Geological Survey report (at 01/0001Z) noted the summit activity was relatively quiet for last 24 hours. QANTAS AIREP at 30/0501Z also observed the lack of activity. |
| 29 Apr 2001 | AIREP from PNG at 292130Z. | Aircraft observed smoke cloud up to 9 km and drifting NW and SW direction out to 50/70 miles radius. ASH CLOUD: Satellite imagery [29/2132Z] shows possible volcanic plume extending 65 NM to the W and 30 NM to the N and S. |
| 30 Apr 2001 | -- | Examination of latest satellite imagery [30/0530Z] indicates significant eruption has ceased. Ash plume may reach 14 km. |
| 01 May 2001 | Visual and infra-red GMS and NOAA satellite imagery, RVO. | RVO advise remains on a high alert level with further eruptions possible. ASH CLOUD: There is no evidence of ash cloud at this time, but widespread cloud in the area is making detection difficult. |
| 03 May 2001 | AIREP from PNG 29/4/2001 2130Z. Visual and infra-red GMS and NOAA satellite imagery, RVO. | A report by an aircraft of volcanic activity [on 29 April] at about 2130Z with smoke/ash cloud up to 9 km, and confirmed by the RVO and satellites surveillance, initiated a series of Volcanic Advisories. The latest report from RVO this morning states that activity has moderated. ASH CLOUD: Satellite surveillance has not identified any ash cloud since the initial eruption. |
| 28 Aug 2001 | GMS/NOAA Satellite Imagery. | Ash observed on satellite imagery. Analysis indicates eruption is low level. ASH CLOUD: Ash plume 5 NM wide, extending 15 miles to the S of the summit. Ash expected to be below 4 km. |
| 12 Sep 2002 | NOAA/GMS satellite imagery. | Small low level plume detected on visible satellite imagery at 11/2100Z. Plume extended 60 NM from summit in the sector NNW to NNE. |
| 18 Sep 2002 | GMS satellite imagery. | Low level plume detected on visible satellite imagery at 18/2100Z. ASH CLOUD: Very thin plume extends 40 NM to the WSW |
| 19 Sep 2002 | GMS satellite imagery. | Plume can no longer be detected on latest GMS imagery. |
| 27 Sep 2002 | GMS satellite imagery. | Ash plume observed on satellite imagery [27/]2030Z. ASH CLOUD: Narrow ash cloud extends 40 NM to SW |
| 28 Sep 2002 | GMS satellite imagery. | Ash plume observed on satellite imagery 2130Z. ASH CLOUD: Narrow ash cloud extends 20 NM to the NNW. |
| 15 Oct 2002 | GMS satellite imagery. | Low level ash plume observed on satellite imagery 15/2225Z. ASH CLOUD: Ash plume extends 20 NM N of volcano. Winds indicate plume probably low level. |
| 21 Oct 2002 | AIREP PZ-ANF, GMS imagery. | Smoke reported in area, and plume observed via GMS imagery. ASH CLOUD: Cloud up to 4 km, extending 5 NM, 30 NM wide to SE. |
| 01 Nov 2002 | AIREP. | Smoke observed 01/0042Z drifting to NW of volcano at 3 km. |
| 02 Nov 2002 | AIREP AIR NIUGINI. | Ash observed 02/2030Z drifting to ESE of volcano to 3 km. |
| 11 Apr 2003 | NOAA and GMS imagery. | Plume evident on 10/2019Z and 11/0357Z NOAA image[s], height estimated below 3 km. |
| 14 Apr 2003 | GMS imagery. | Possible plume evident on 13/2032Z, 13/2132Z and 13/2225Z [images], height estimated below 3 km |
| 26 Apr 2003 | GMS imagery. | Possible plume evident on 26/0325Z MODIS as reported by KGWC/ Washington VAAC, height estimated below 4 km. |
| 30 Apr 2003 | GMS and MODIS imagery. | Possible narrow low level plume evident on 30/0010Z MODIS and 30/0230Z GMS visible image[s], extending 30 NM WNW, height estimated below 3 km. |
| 03 May 2003 | KGWC. | Ash/steam plume observed on 02/2026Z F13 DMSP Imagery. Plume extends 80 NM W of volcano, height to 4 km. |
| 04 May 2003 | NOAA satellite imagery. | Thin low level plume observed on 04/2053Z. Plume extends 10 NM SW of Ulawun, height estimated at 4 km. |
| 06 May 2003 | GMS satellite imagery. | Thin low level plume observed on 06/2032Z. |
| 01 Jun 2003 | GOES9 satellite imagery. | Thin low level plume observed on [May] 31/2325Z. |
| 18 Jun 2003 | AFWA. | Faint ash/steam plume seen on 18/2206Z satellite imagery. |
| 20 Jun 2003 | NOAA 17. | Faint plume seen on NOAA 17 20/0004Z satellite imagery. |
| 20 Jun 2003 | NOAA 15. | Faint plume seen 20/2050Z. |
| 23 Jun 2003 | NOAA 15. | Faint plume seen on 23/2120Z. |
| 24 Jun 2003 | NOAA 15. | Faint plume seen on 24/2057Z. |
| 26 Jun 2003 | MODIS. | Faint plume seen on 26/0005Z extending 25 NM SW, height estimated at 4 km. |
| 28 Jun 2003 | NOAA 15. | Faint plume seen on 28/2101Z. |
| 02 Jul 2003 | NOAA 15. | Thin ash plume to 5 km extending 25 NM WSW of summit on 02/2108Z. |
| 13 Jul 2003 | AFWA. | Thin ash plume to 4 km moving to the W at 10 knots [10 NM/hour or 18 km/hour]. |
| 22 Jul 2003 | GOES9. | Possible ash plume seen on 22/0130Z visible GOES imagery, extending 30 NM to NW, height estimated at 3 km. |
The VAAC reports contain numerous abbreviations; however, a few of the terms here are in widespread use referring to satellites, meteorology, and various related agencies (NOAA, AFWA, GOES9, MODIS, and KGWC . . . DMSP Imagery, etc.) or AIREP (atmospheric conditions reported from aircraft). "RVO" stands for Rabaul Volcano Observatory. Other terms may be less familiar: "AIR NIUGINI, ANK." refers to a commuter plane in the fleet of the national airline based in Papua New Guinea. The stated dates and times are not local ones, but instead refer to those at the zero (prime) meridian. For example, 04/2240Z means the fourth day of the stated month at 2240 UTC (i.e. "Z," spoken as Zulu, is shorthand for Coordinated Universal Time (UTC).
Information Contacts: Rabaul Volcano Observatory (RVO), P.O. Box 386, Rabaul, Papua New Guinea; Darwin Volcanic Ash Advisory Center (VAAC), Commonwealth Bureau of Meteorology, Northern Territory Regional Office, PO Box 40050, Casuarina, NT 0811, Australia (URL: http://www.bom.gov.au/info/vaac/).
Quiet during early 2004; thin ash plumes 12-14 April
The Rabaul Volcano Observatory (RVO) reported that activity at Ulawun remained quiet during February 2004. The main vent emitted white vapor at weak to moderate rates. No emissions were reported from the two north valley vents. No noise or night time glow was reported, and seismicity was at a low level. RVO reported in similar terms for the period 15 March-1 April, noting also that tiltmeter measurements recorded a long-term inflationary trend. According to Darwin VAAC, on 12 and 13 April thin ash plumes from Ulawun were visible on satellite imagery at a height of -~ 700 m above the volcano extending ~ 75 E and NE. On 14 April the ash plume rose ~ 3 km altitude and extended ~ 37 km NE. No HIGP-MODIS thermal alerts were recorded at Ulawun over the year to 11 May 2004.
Note that a 16 January 2001 VAAC report of Ulawun emitting a cloud, ashes, and 'flames' ~ 10.6 km altitude, which was not confirmed by satellite imagery or RVO, has not previously been mentioned in the Bulletin.
Information Contacts: Ima Itikarai and Herman Patia, Rabaul Volcano Observatory, Papua New Guinea; Darwin Volcanic Ash Advisory Centre (VAAC), Commonwealth Bureau of Meteorology, Northern Territory Regional Office, PO Box 40050, Casuarina, NT, 0811, Australia (URL: http://www.bom.gov.au/info/vacc/).
No MODVOLC thermal anomalies detected despite other observed activity
No new activity was detected by MODVOLC as recently as mid-2004. This was the case despite reports of seismic activity and deflation during January-March 2003 (BGVN 28:03), as well as white vapor emissions and offshore effervescence (BGVN 28:09) and intermittent ash plumes during September-December 2003 (BGVN 28:11).
Data acquisition and analysis. Reports from Diego Coppola and David A. Rothery provided analyses of MODIS thermal alerts during 2001 and 2002 (using the MODVOLC alert-detection algorithm) extracted from the MODIS Thermal Alerts website (http://modis.hgip.hawaii.edu/) maintained by the University of Hawaii HIGP MODIS Thermal Alerts team (BGVN 28:01). Rothery and Charlotte Saunders provided updates to 31 May 2004. MODVOLC data are now routinely available from the Aqua satellite (equator crossing times 0230 and 1430 local time) in addition to the original Terra satellite (equator crossing times 1030 and 2230 local time).
Information Contacts: David A. Rothery and Charlotte Saunders, Department of Earth Sciences, The Open University, Milton Keynes, MK7 6AA, United Kingdom.
Thin white-and-blue vapor emissions but otherwise quiet during July
Ulawun remained quiet during July 2004. Emissions from the main vent consisted of white vapor being released at moderate rates. Wisps of blue vapor were reported on 4-5, 7, and 12-14 July. No noise or night-time glow was reported during the month. Emission of thin white vapor from the two N-valley vents was reported during 4-6 July. Seismic activity was at a low level. Ground deformation continued to show a steady uplift that began late last year.
Air Niugini pilot David Innes noted on 23 August that he had flown past Uluwan early the previous week and noted what appeared to be steam and light 'smoke,' but did not note any ash.
The Darwin Volcanic Ash Advisory Center posted two reports on Ulawun. The initial 22 August report noted "thin plume to FL 100 [~ 3 km altitude] extends 60 NM [~ 110 km] to SW on NOAA 15 [image of 2038 UTC on 22 August] . . .. At 0330 UTC on 23 August ash was not identifiable from satellite data."
Andrew Tupper reported that on the morning of 23 August satellite imagery showed a plume ~ 50 km long escaping from Ulawun (figure 9). He went on to comment that the light at that time and the meteorological conditions were perfect for creating and seeing plumes. Discussion with RVO suggested that Ulawun often steams in roughly the same manner, but that atmospheric conditions are only sometime advantageous for seeing the plume. Tupper noted that "In stagnant and/or unstable air, the plume might rise higher above the volcano, but be less visible to satellites (and be obscured by convective clouds); fresh dry-season airflow is by far the best for creating and spotting plumes."
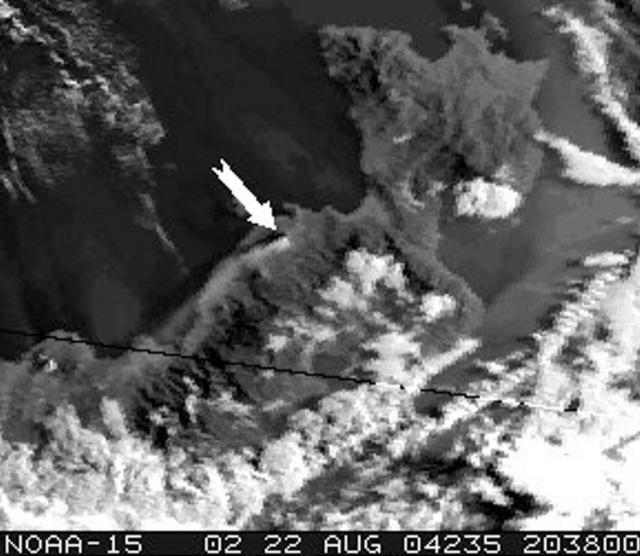 |
Figure 9. NOAA satellite image of plume from Ulawun taken on 22 August. Arrow points to Ulawun; the plume was ~ 50-60 km long. Courtesy of Andrew Tupper. |
Information Contacts: Ima Itikarai and Herman Patia, Rabaul Volcano Observatory (RVO), P. O. Box 386, Rabaul, Papua New Guinea; David Innes, Air Niugini, PO Box 7186, Boroko, Port Moresby, National Capital District, Papua New Guinea (URL: http://www.airniugini.com.pg/); Andrew Tupper, Darwin Volcanic Ash Advisory Centre (VAAC), Commonwealth Bureau of Meteorology, Northern Territory Regional Office, PO Box 40050, Casuarina, NT 0811, Australia (URL: http://www.bom.gov.au/info/vaac/).
Frequent ash/steam plumes during March-August 2005
Long steam plumes during 22-23 August 2004 (BGVN 29:07) were observed on satellite imagery. Additional plumes were seen earlier that month, prompting the Darwin Volcanic Ash Advisory Center to issue advisories on four days.
Ulawun remained quiet from August 2004 until March 2005. During March 2005, weak to moderate volumes of thick white vapor were released from the main crater. On 27 and 28 March light gray emissions were observed, and small continuous volcanic tremor was recorded for six hours. The N vent remained quiet. Seismic activity continued at low levels with low-frequency earthquakes recorded. A tiltmeter was installed on 15 March but no significant movements were detected.
During April-July 2005 white vapor from the main vent was common, and plumes were frequently visible on satellite imagery. On 6 April, a thin plume was visible extending ~ 55 km to the SW. On 19 May a small plume to an unknown height extended W. Plumes to unknown altitudes were again released on 3 and 6 June. Plumes rising to 3 km altitude were seen on satellite imagery on 6 and 21 June. The 21 June plume contained ash, and initially extended W and WSW; imagery about six hours later showed the plume blowing NW. A short plume was visible at ~ 3 km altitude during 22-27 June, and on 27 June a pilot reported that the plume extended 37 km. During 30 June to 1 July, thin ash plumes were visible on satellite imagery, but heights were not given. No noise, night-time glow, or emissions were reported during this time. Small low-frequency earthquakes were recorded. Volcanic tremor was registered on 16-17 June.
On 9 August a plume drifting to the S was visible on satellite imagery (figure 10). During the rest of August, the summit crater released thick white vapor. Seismicity was characterized by small low-frequency earthquakes. One high-frequency earthquake and small periodic volcanic tremors were recorded.
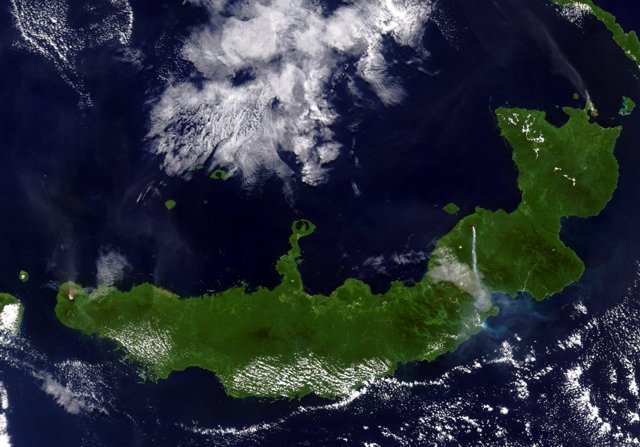 |
Figure 10. Terra MODIS satellite image of New Britain Island showing a distinct ash plume drifting S from Ulawun (middle right) at 0809 on 9 August 2005 (UTC). Plumes can also be seen originating from Rabaul (NW end of the island, upper right) and Langila (E end of the island, left). Photo courtesy of MODIS Rapid Response Team, NASA Goddard Space Flight Center. |
Information Contacts: Ima Itikarai, Rabaul Volcano Observatory (RVO), P. O. Box 386, Rabaul, Papua New Guinea; David Innes, Air Niugini, PO Box 7186, Boroko, Port Moresby, National Capital District, Papua New Guinea (URL: http://www.airniugini.com.pg/); Darwin Volcanic Ash Advisory Centre (VAAC), Commonwealth Bureau of Meteorology, Northern Territory Regional Office, PO Box 40050, Casuarina, NT 0811, Australia (URL: http://www.bom.gov.au/info/vaac/).
Thick plumes and earthquakes during late August to mid-September 2005
During the week of 22-28 August 2005, Ulawun often remained quiet but also displayed continued restlessness. People from Tauke, on the S side of the volcano reported occasional low roaring, rumbling, and booming noises on 21-22 and 26-28 August. Emissions from the summit crater consisted of moderate volumes of thick grayish vapor released forcefully. Some traces of blue vapor were also visible, but no glow was observed. Seismicity fluctuated between low and moderate, marked by small low-frequency earthquakes and small sporadic volcanic tremors. Only one high-frequency earthquake was recorded. An earthquake was felt on 22 August by people from Tauke. Apparently the earthquake was not reported by the observer at Ulamona, NW of the volcano, suggesting it was local and focused on the S side of the volcano.
Ulawun remained quiet through mid-September 2005, with the summit crater releasing weak to moderate volumes of thick white vapor.
Information Contacts: Rabaul Volcano Observatory, Papua New Guinea.
Ash emission on 1 March, more than four months after last eruption
Ulawun remained relatively quiet from mid-September 2005, the date of our last report (BGVN 30:09), until 1-2 March 2006 when strong, forcefully expelled "gray-blue emissions" were observed from the main crater. There may also have been incandescence at the base of the plumes. There were no emissions from the NW vent. Small, felt earthquakes occurred and the sound of roaring was heard by nearby villagers. According to the Darwin VAAC, RVO reported that ash reached ~ 3 km (10,000 ft) altitude on 1 March. However, ash was not visible on satellite imagery.
Information Contacts: Ima Itikarai, Rabaul Volcano Observatory (RVO), P.O. Box 386, Rabaul, Papua New Guinea; Andrew Tupper, Darwin Volcanic Ash Advisory Centre (VAAC), Bureau of Meteorology, Northern Territory Regional Office, PO Box 40050, Casuarina, Northern Territory 0811, Australia (URL: http://www.bom.gov.au/info/vaac/).
Frequent ash plumes
A previous report (BGVN 31:02) described small earthquakes on 1-2 March 2006, accompanied by "gray-blue emissions." Subsequent ongoing eruptions continued at Ulawun through 18 January 2007, generating almost daily aviation reports describing plumes blowing W to NW and of generally modest height (table 3). The tallest plume of the reporting interval rose to 4.6 km altitude.
Table 3. A summary of key events at Ulawun observed during the reporting interval 22 March 2006-18 January 2007. Reported plumes did not attain an altitude of over 4 km except on 12 November, when they reached an altitude of 4.6 km. Information based primarily on satellite data and pilot reports from the Darwin VAAC and in a few cases, the US Air Force Weather Agency (AFWA).
| Date | Comments |
| 22-28 Mar 2006 | Ash visible at an altitude of ~3 km (pilot report). |
| 09 Apr 2006 | Small low-level plume extending W. |
| 14 May 2006 | An ash plume of unknown height. |
| 25 May 2006 | Thin steam-and-ash plume. |
| 31 May 2006 | A thin steam-and-ash plume reached an altitude of below 3 km. |
| 15 Aug 2006 | Ash-and-steam plume to an altitude of ~3.7 km. |
| 25 Aug 2006 | Steam-and-ash plumes reached altitudes of 3.7 km and drifted NW. |
| 27 Aug 2006 | Steam-and-ash plumes reached altitudes of 3.7 km and drifted W. |
| 28 Aug 2006 | Steam-and-ash plumes reached altitudes of 3.7 km and drifted SW. |
| 30 Aug 2006 | Ash-and-steam plumes drifting SW. |
| 02 Sep 2006 | Ash-and-steam plumes drifting S visible on satellite imagery. |
| 12 Nov 2006 | Diffuse plume to altitude of 4.6 km drifted NW. |
| 16-18 Nov 2006 | Diffuse plumes drifting N and NW. Ash-and-steam plume visible on 18 November. |
| 22 Nov 2006 | Diffuse plume. |
| 28 Nov 2006 | Ash-and-steam plume. |
| 29 Nov 2006 | Diffuse ash-and-steam plume. The altitudes and drift directions were not reported. |
| 04 Dec 2006 | Ash plume. Altitudes and drift directions not reported. |
| 09 Dec 2006 | Diffuse plumes reaching altitudes of 4 km. |
| 11 Dec 2006 | Plumes reached unreported altitudes. |
| 21 Dec 2006 | Ash plumes drifting ENE. |
| 22 Dec 2006 | Ash plumes drifting NW. |
| 25 Dec 2006 | Ash plumes drifting SW. |
| 04 Jan 2007 | Diffuse steam-and-ash plumes drifting SW. |
| 18 Jan 2007 | Pilot report noted an ash plume to an altitude of 2.4 km drifting SW. |
No MODIS thermal alerts were identified between March 2006 and January 2007 on the Hawai'i Institute of Geophysics and Planetology MODIS Thermal Alert System web site. The lack of thermal anomalies may indicate explosive eruptions, and not lava emissions. However, such activity has occurred at the summit in the past. One such episode, in November 1985, generated Strombolian activity and pyroclastic flows (figure 11).
 |
Figure 11. Photograph of Ulawun taken from a helicopter on 25 November 1985. The view from the NE shows emission of large clots of molten lava into the air above the vent and pyroclastic flows (right). The other large stratovolcano in the background is 2,248-m-tall Bamus. Photographs were taken and provided by James Mori, Disaster Prevention Research Institute, Kyoto University. |
Four Volcanic Ash Advisory Centers (VAAC): Tokyo, Washington, Darwin, and Wellington, have an interest in this volcano, because plumes may enter their areas of responsibility (figure 12). The VAACs came into existence to keep aviators informed of volcanic hazards. A key player in their development was the International Civil Aviation Organization (ICAO), a United Nations Related Agency that is the recognized international authority regarding a large number of aviation isses. Nine VAAC were created, in Anchorage (Alaska), Buenos Aires (Argentina), Darwin (Australia), London (England), Montreal (Canada), Tokyo (Japan), Toulouse (France), Washington (United States), and Wellington (New Zealand). These centers are tasked with monitoring volcanic ash plumes and providing Volcanic Ash Advisories (VAA) whenever those plumes enter their assigned airspace. The VAACs are often integrated with aviation weather centers; many have developed back-up sites. For example, the Washington VAAC is backed-up by the US Air Force Weather Agency; the Tokyo by Japan Meteorological Association Headquarters, and Darwin by the National Meteorological & Oceanographic Centre.
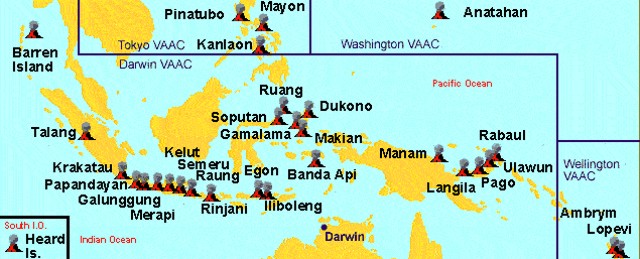 |
Figure 12. Map of Indonesia and Papua New Guinea showing selected volcanoes, including Ulawun on New Britain (right center), with areas of responsibility for local VAACs. Courtesy of Darwin VAAC. |
Information Contacts: Rabaul Volcano Observatory (RVO), P. O. Box 386, Rabaul, Papua New Guinea; Darwin Volcanic Ash Advisory Centre (VAAC), Bureau of Meteorology, Northern Territory Regional Office, PO Box 40050, Casuarina, NT 0811, Australia (URL: http://www.bom.gov.au/info/vaac/); US Air Force Weather Agency (AFWA), Satellite Applications Branch, Offutt AFB, NE 68113-4039, USA; Hawai'i Institute of Geophysics and Planetology (HIGP) Thermal Alerts System, School of Ocean and Earth Science and Technology (SOEST), Univ. of Hawai'i, 2525 Correa Road, Honolulu, HI 96822, USA (URL: http://modis.higp.hawaii.edu/); James Mori, Disaster Prevention Research Institute, Kyoto University, Uji, Kyoto 611-0011, Japan (URL: http://eqh.dpri.kyoto-u.ac.jp/~mori/).
Mostly gentle emissions of white vapor; low-frequency earthquakes
This report updates activity through March 2008. Our last overview of Ulawun (BGVN 32:02) reported little activity of note other than frequent ash plumes from March 2006 to January 2007. Typical activity at Ulawun has consisted of gentle emission of thin-to-thick white vapor from the summit Based on satellite imagery and information from the Rabaul Volcano Observatory (RVO), the Darwin VAAC reported that diffuse plumes from Ulawun drifted N on 28 April 2007. On 1 May, an ash plume rose to an altitude of 4 km and drifted W.
[On 29 May 2007, RVO reported thick white vapor; there were no audible noises or night glow.] The two N valley vents remained quiet. Seismicity was at a low to moderate level dominated by low-frequency earthquakes. Through May, between 500 and 1,265 low frequency events were recorded daily with the most recorded on 28 and 29 May.
Similar conditions continued through the end of 2007 with only minor incidental variation. On 6 June, the elevated characteristics of the forceful emissions of 28-29 May were repeated. The daily total number of low-frequency earthquakes fluctuated between 400 and 1,042 events with the highest numbers recorded on 24 June (1,032) and 8 August (1,042). A high-frequency earthquake was recorded on 1 August. On 3 September forceful emissions were recorded sending the vapor plume ~ 1 km above the summit before being blown SE. On 25 December, based on satellite imagery observations, the Darwin VAAC reported that an ash-and-steam plume from Ulawun drifted W.
Low levels of activity continued from January through March 2008. Emissions consisted of thin to thick white vapor and with no audible noises and no glow visible at night. Seismicity continued at moderate level dominated by low frequency volcanic earthquakes. Variable amounts of white fume were emitted, sometimes forcefully. The two N valley vents continued to remain quiet.
Information Contacts: Herman Patia, Rabaul Volcano Observatory (RVO), P. O. Box 386, Rabaul, Papua New Guinea; Darwin Volcanic Ash Advisory Centre (VAAC), Commonwealth Bureau of Meteorology, Northern Territory Regional Office, PO Box 40050, Casuarina, NT 0811, Australia (URL: http://www.bom.gov.au/info/vaac/); US Air Force Weather Agency (AFWA), Satellite Applications Branch, Offutt AFB, NE 68113-4039, USA; Hawai'i Institute of Geophysics and Planetology (HIGP) Thermal Alerts System, School of Ocean and Earth Science and Technology (SOEST), Univ. of Hawai'i, 2525 Correa Road, Honolulu, HI 96822, USA (URL: http://modis.higp.hawaii.edu/); James Mori, Disaster Prevention Research Institute, Kyoto University, Uji, Kyoto 611-0011, Japan (URL: http://eqh.dpri.kyoto-u.ac.jp/~mori/).
Earthquake swarm followed by incandescence in June 2008
Aactivity at Ulawun since early 2007 has consisted primarily of low-frequency earthquakes and white vapor emissions, with ash reported on 1 May and 25 December 2007 (BGVN 33:03). No additional activity was reported by the Rabaul Volcano Observatory (RVO) until a seismic swarm preceded observations of glow on 13-14 June 2008. Incandescence was seen again in mid-May 2009.
RVO reported that increased seismic activity at Ulawun consisting of high-frequency volcano-tectonic (VT) earthquakes began on 7 June 2008. After peaking at 22 events on 12 June, the daily totals dropped and fluctuated between one and seven events per day, although totals of 14-15 events occurred on 14, 29, and 30 June. Some of the VT earthquakes were felt, including three on 30 June. Low-frequency earthquakes continued to occur as well, but remained within background levels; daily totals were between 257 and 775.
Summit activity was very low and consisted of variable amounts of white vapor. Bluish vapor was observed on some days during 16-21 June. Other reported activity included low roaring noises on 1, 2, 12, and 14 June, and summit glow on the 13th and 14th. On 22 June noises heard in villages to the NE accompanied some of the earthquakes. On 28 June an earthquake accompanied by a booming noise was felt in nearby areas. White vapor plumes were emitted during 2-6 July, and occasional roaring noises were reported during 1-3 July.
Additional reports by RVO in February and April 2009 noted that the volcano remained quiet, only releasing white vapor, with no reports of glow at night. Seismicity was moderate to low in February until power problems disabled the instrument. The number of seismic events that month fluctuated between 400 and 950 before declining to a range of 250-300 during 20-24 February. Low-frequency events dominated the record, although some high-frequency activity was recorded at a daily rate of 1-6 events.
Ulawun remained quiet throughout September and October 2009. Summit activity was dominated by weak to moderate volumes of white vapor, and seismicity was generally low. During September, daily totals for high-frequency volcano-tectonic events ranged between 0 and 7, and low-frequency earthquakes were registered at a rate of 167-547. For the month of October, daily totals for high-frequency volcano-tectonic events were as high as 11, and the number of low-frequency earthquakes ranged between 74 and 404.
Information Contacts: Ima Itikarai, Rabaul Volcano Observatory (RVO), P.O. Box 386, Rabaul, Papua New Guinea.
Steam plumes (with some possible ash) in February 2010
A Rabaul Volcano Observatory (RVO) report noted steam plumes (figure 13) and increased seismicity at Ulawun during February 2010. Some of the mid-February plumes may have contained ash. As late as October 2009, Ulawun was generally quiet except for modest seismicity (BGVN 34:10).
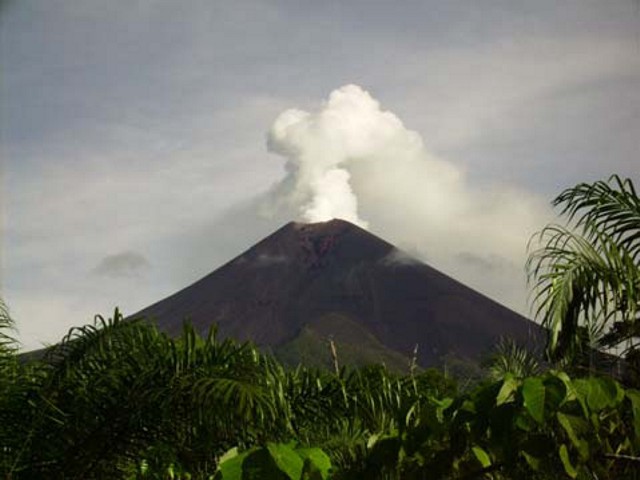 |
Figure 13. Ulawun issuing passive steaming as seen from the SE side in this undated photo. RVO described this as "moderate volumes of white vapor from the summit crater." From Arumba (2009). |
A government report written in October 2009 mentioning Ulawun (Arumba, 2009) summarized activity during 2008 as generally quiet, but noted it had changed "with the commencement and continuation of high frequency volcano-tectonic earthquakes from about March [2008] onwards."
The increase in the seismicity was slight and took place during the second half of February 2010. RVO noted that during 12-27 February, Ulawun emitted steam, sometimes forcefully. There was no audible noise and no glow visible from the crater at night. According to the Darwin Volcanic Ash Advisory Centre, the plumes seen during 14-15 February 2010 may have contained ash. They reached 2.4-3.7 km altitude and drifted 45-95 km NNE.
RVO noted a further increase in the seismicity during 19-24 February, with overlapping tremor events and an increase in RSAM (Real-time Seismic-Amplitude Measurement). Volcano-tectonic earthquakes were recorded on 1, 3, 7, 8, 17, and 24 February, with daily totals ranging between 1 and 5. Low-frequency earthquakes were recorded almost every day, with daily totals between 201 and 646.
A check of MODVOLC thermal alerts in mid-April 2010 found no anomalies for Ulawun as far back as May 2001. Those 2001 alerts corresponded with new vents and large plumes in early 2001 (BGVN 26:05, 26:06). A few months earlier, observers had seen Strombolian eruptions (BGVN 25:11).
Reference. Arumba, J., 2009, Agenda Item 3, Coordinating Committee for Geoscience Programmes in East and Southeast Asia (CCOP), 46th CCOP Annual Session, 18-23 October 2009, Vungtau, Vietnam; Member Country Report of Papua New Guinea, October 2009, Annual member country report, 16 p.
Information Contacts: Ima Itikarai, Rabaul Volcano Observatory (RVO), P.O. Box 386, Rabaul, Papua New Guinea; Darwin Volcanic Ash Advisory Centre (VAAC), Commonwealth Bureau of Meteorology, Northern Territory Regional Office, PO Box 40050, Casuarina, NT 0811, Australia (URL: http://www.bom.gov.au/info/vaac/); Hawai'i Institute of Geophysics and Planetology (HIGP) Thermal Alerts System, School of Ocean and Earth Science and Technology (SOEST), Univ. of Hawai'i, 2525 Correa Road, Honolulu, HI 96822, USA (URL: http://modis.higp.hawaii.edu/).
Modest eruptions included ash plumes to 4 km through February 2011
This report discusses volcanism and seismicity at Ulawun between early 2010 through February 2011, a period when the volcano (figure 14) discharged several ash plumes to as high as 3-4 km altitude. In one case, ash plumes were seen in satellite imagery drifting for almost 200 km. Our previous reporting noted steam plumes and increased seismicity in February 2010 (BGVN 35:02), which followed a multi-year interval of comparative quiet (BGVN 33:03 and 34:10).
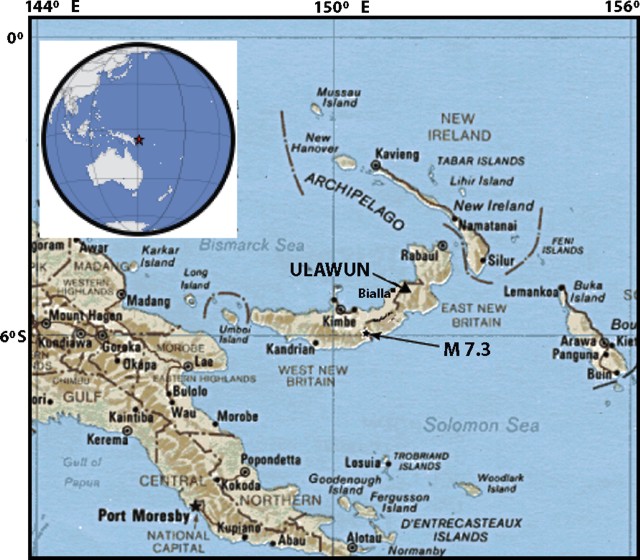 |
Figure 14. (Upper left) Index map showing Ulawun's location on New Britain Island to N of Australia. (Main map) Map of New Britain island and adjacent regions showing the epicenter of the Mw 7.3 earthquake of 18 July 2010. A more detailed map of the area appeared in a report on Likuranga volcano (BGVN 31:10). Main map specified as a 1985 edition (but authorship not found); provided by the University of Texas Library (ww.lib.utexas.edu). |
As an overview of this report, the Rabaul Volcano Observatory (RVO) noted that during May 2010, the volcano produced occasional gray plumes, incandescence, audible noises, and increased seismicity. Accordingly, RVO recommended that the hazard status be set at Stage 1 Alert (in their 4-stage alert system), where it stayed through the rest of the reporting interval. Large regional earthquakes took place in June and July 2010 (figure 14).
Activity during May-July 2010. During 1-21 May, RVO reported variable amounts of white vapor; during late May to July, emissions were darker in color, with some specific examples highlighted below. Based on analyses of satellite imagery, the Darwin Volcanic Ash Advisory Centre (VAAC) reported ash plumes during 22-25 May that drifted 35-130 km at an altitude of 3 km. During late May through late June, RVO reported that white to gray plumes rose up to 1 km high and at times ashfall occurred. RVO noted gray plumes on 22, 25, and 29 May. People on the S part of New Britain observed fluctuating incandescence on 28-29 May.
Very fine ashfall was reported on 30 May in areas to the SSW, S, and SSE. It was again reported on 3 and 8 June, ~10 km NW (in Ulamona). During 9-25 June, fine ashfall was reported almost daily on the NW, SW, and sometimes W flanks.
Between late May and early July, low roaring or rumbling noises often were reported. Fluctuating incandescence from the crater was observed at night during 28-29 May, 6-10 June, 13 June, and 16-25 June.
On 18 and 19 June, seismicity increased to a high level and was dominated by volcanic tremor. The next day, seismicity declined to a moderate level and continued to do so after 26 June.
According to the Darwin VAAC, during 1-5 July ash plumes drifted 55-195 km at an altitude of 3 km. RVO reported that, at times during late June and July, white-to-gray plumes rose up to 500 m above the volcano. During 27 June-9 July fine ash fell in areas to Ulawun's SW, W, and NW.
During 5-8 July RVO noted a slight increase in seismicity (above moderate levels), which included tremor. During 16-21 July, volcanic tremors continued, but overall seismicity declined slightly. Seismic amplitude (RSAM) values remained moderate.
RVO reported that on 23-24 July ash plumes were observed.
Large regional earthquakes. RVO reported that several large earthquakes occurred during June and July (table 4). The largest of those were the adjacent 18 July earthquakes, a foreshock of Mw 6.9 and a mainshock of Mw 7.3. The latter, which was destructive, was the largest in about a decade. The Provincial Disaster Office reported significant building damage near the epicenter and in the town of Kimbe (65 km NW of the mainshock's epicenter, figure 14). The mainshock's epicenter was also ~45 km S of Pago volcano and 134 km SW of Ulawun. Many damaged houses had been constructed of bush materials, but some houses also included modern building materials. At least one death was reported. Numerous aftershocks followed the main Mw 7.3 shock.
Table 4. Large regional earthquakes near Ulawun that occurred on the days 2, 3, and 24 June and 18 July 2010. Courtesy of RVO.
| Date | Time (local) | Mw | Type | Depth (km) | Location and comments |
| 02 Jun 2010 | 1929 | 5.8 | Regional earthquake | 80 | Offshore near Kandrian |
| 03 Jun 2010 | 1715 | -- | High-frequency volcano-tectonic earthquake | -- | Felt by island residents with Modified Mercalli (MM) intensity up to IV |
| 24 Jun 2010 | 1532 | 6.2 | Tectonic earthquake | 70-80 | In central New Britain centered~30-40 km SSE of Bialla town (70-80 km). MM Intensity of ~IV at Rabaul Town |
| 18 Jul 2010 | 2304 | 6.9 | Foreshock | 42 | Both earthquakes occurred on the S side of West New Britain Province near Gasmata. Residents felt them very strongly near the epicenter and in Kimbe area. |
| 18 Jul 2010 | 2335 | 7.3 | Mainshock | 35 | -- |
Highlights of behavior, August 2010 through February 2011. During 6-24 August, white and gray-to-brown plumes rose no more than 300 m above Ulawun, and fine ash fell on the NW and W flanks. Seismicity decreased compared to previous weeks.
During 26 November 2010, based on analyses of satellite imagery and information from RVO, the Darwin VAAC reported that an ash plume rose to an altitude of 3.7 km and drifted 55 km NE.
RVO reported that mild activity continued during 1 January through at least 28 February 2011, characterized by brown-to-gray ash plumes that rose less than 500 m. These produced fine ashfall to the SE. Sulfur dioxide plumes drifted SE on 5 and 31 January. During 23-26 February, gray ash plumes occasionally drifted NE, SW, and NW.
Information Contacts: Rabaul Volcano Observatory (RVO), P.O. Box 386, Rabaul, Papua New Guinea; Darwin Volcanic Ash Advisory Centre (VAAC), Commonwealth Bureau of Meteorology, Northern Territory Regional Office, PO Box 40050, Casuarina, NT 0811, Australia (URL: http://www.bom.gov.au/info/vaac/).
Seismicity ongoing with plumes during May 2010-May 2011
This report discusses Ulawun's ongoing mild seismicity, variably colored, though often white plumes, and other observations during May 2010 to late May 2011. The bulk of the reporting came from the Rabaul Volcano Observatory (RVO) with some information on plumes from the Darwin Volcanic Ash Advisory Center (VAAC) and others. Seismicity at Ulawun has generally been low since 2007, with occasional modest increases and steam emission (BGVN 33:03, 34:10, and 35:02).
Activity during 2010. RVO reported that, according to Real-time Seismic Amplitude Measurements (RSAM), seismic activity increased on 18 May 2010. According to RVO, white vapor emitted during 1-20 May 2010 became thicker during 22-28 May. On 22 and 25 May, some plumes were partially gray. According to the Darwin VAAC, plumes on 22-28 May reached an altitude of 3 km and extended as far as 70 NM in variable directions.
People on the S and SE sides of the island heard "low jetting" noises during 24-25 May 2010. Weak and fluctuating incandescence was seen from the S at night during 28-29 May. Emissions became gray in color during 29-31 May, and on 30 May very fine ashfall was reported in areas to the SSW, S, and SSE. On 1 and 2 June only white vapor emissions were noted. RVO recommended a Stage 1 Alert as a result of increasing seismicity and occasional gray plumes, incandescence, and audible noises. According to a news report (Radio Australia), up to 10,000 residents live adjacent to Ulawun.
According to RVO, during 2-12, 16-19, and 23-25 June 2010 residents heard occasional low roaring or rumbling noises daily on the ESE, SE, S, and NW flanks. During 2-19 and 23-26 June, white to gray-brown plumes rose to ~3 km altitude (figure 15). The Darwin VAAC noted that between 3-6 June, the plumes extended up to 315 km W. On 16-17 and 19-20 June, white and gray plumes rose 1 km above the summit. Very fine ash particles fell in Ulamona (~10 km NW) on 3 and 8 June, and then fell daily during 9-19 and 23-25 June on the NW, W, and SW flanks. Throughout June, fluctuating incandescence from the summit crater was seen at night from the S, SW, N, and SE flanks. RVO reported that on 18 and 19 June, seismicity increased to a high level and was dominated by volcanic tremor. Seismicity declined to moderate levels on 20 June and, based on RSAM values, declined further on 26 June 2010.
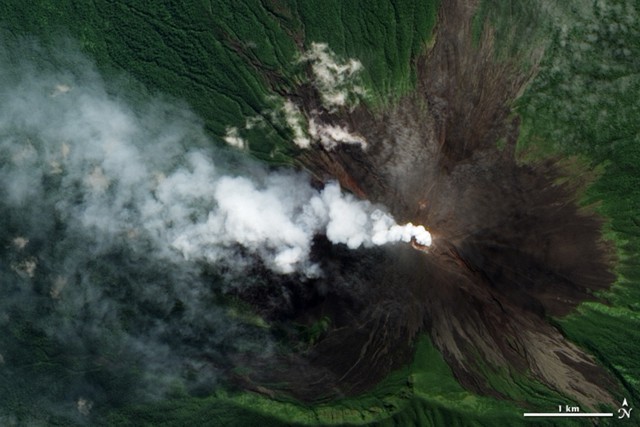 |
Figure 15. Natural-color image of a small white plume venting from Ulawun's summit crater and blowing W on 10 June 2010. Image was taken by the Advanced Land Imager on NASA's Earth Observing-1 (EO-1) satellite. Green vegetation predominates outboard of 1-2 km from the summit. On the upper slopes, bare (unvegetated) volcanic rocks prevail, appearing as charcoal-brown streaks. The plume's pale color suggests that, of the visible components in the plume, steam rather than ash predominates. NASA Earth Observatory image created by Jesse Allen, using EO-1 ALI data provided courtesy of the NASA EO-1 team and the United States Geological Survey. Original (but now slightly revised) caption crafted by Michon Scott. |
According to RVO, white-to-gray plumes rose less than 500 m from Ulawun during 27 June-9 July 2010, and fine ash fell in areas to the SW, W, and NW. The Darwin VAAC reported that during 1-5 July, ash plumes drifted 55-195 km at an altitude of 3 km. On 28 June and during 5-6 July the volcano omitted occasional roaring noises. A slight increase in seismicity (above moderate levels) took place during 5-8 July.
RVO reported diffuse gray plumes that rose 200-500 m above Ulawun during 16-21 July 2010. Plumes were white to light-brown during 21-29 July. During 6-24 August, white and gray-to-brown plumes rose no more than 300 m above Ulawun, and fine ash fell on the NW and W flanks. Tremor continued, but overall seismicity declined slightly. RSAM values remained at a moderate level.
Based on analyses of satellite imagery and information from RVO, the Darwin VAAC reported that on 26 November 2010 an ash plume from Ulawun rose to an altitude of 3.7 km and drifted 55 km NE.
Several videos of Ulawun's plumes as posted on the web in 2010 showed them as white in color (Sabretoothed69, 2010). Other brief video by the same author take viewers to the Ulawun seismic station and its drum recorder, and to witness aspects of local culture such as villagers dancing.
Activity during 2011. According to RVO, the mild activity that began in May 2010 continued during 1 January-28 February 2011. The activity was characterized by brown-to-gray ash plumes that rose less than 500 m and produced fine ashfall to the SE. Sulfur-dioxide plumes drifted SE on 5 and 31 January. During 23-26 February, gray ash plumes occasionally drifted NE, SW, and NW.
RVO reported that during 1-9 May 2011, diffuse white plumes rose from Ulawun and low to modest RSAM values occurred (70-100 units). During 9-10 May, RSAM values distinctly increased, fluctuated, and peaked at 1,300 units before declining back to 100 units. During this time, local residents heard booming.
During 10, 13-14, 17, and 19-27 May, RVO reported gray-to-brown ash plumes rose above Ulawun's summit crater. On 17 May, emissions became briefly forceful and booming noises were reported. Light ashfall deposited between Ubili and Ulamona to the NW and Voluvolu to the NE, as well as on the NW and W flanks. Weak, fluctuating incandescence was observed on 22 May.
Reference. Sabretoothed69, 2010 (uploaded on 7 November 2010), YouTube (URL: http://www.youtube.com/watch?v=UnCSeky3Mes, uploaded by sabretoothed69)
Information Contacts: Rabaul Volcano Observatory (RVO), PO Box 386, Rabaul, Papua New Guinea; Darwin Volcanic Ash Advisory Centre (VAAC), Bureau of Meteorology, Northern Territory Regional Office, PO Box 40050, Casuarina, NT 0811, Australia (URL: http://www.bom.gov.au/info/vaac/); NASA Earth Observatory (URL: http://earthobservatory.nasa.gov/); Radio Australia (URL: http://www.radioAustralia.net.au/pacbeat/).
Intermittent ash plumes during eruptive periods in May 2012, November-December 2012, July-December 2013, and October-November 2016
Ongoing seismicity and emissions were reported at Ulawun during May 2010-May 2011 (BGVN 36:05). Subsequent activity has been intermittent, with white, gray-brown, and gray ash plumes continuing to rise from the crater. RSAM values briefly rose as high as 650 units on 25 May 2012 and as high as 700 units on 15 July 2013. Eruptive activity with ash plumes occurred during May and November-December 2012, and July-December 2013. After almost three years without reports, ash plumes again rose from the crater during October and November 2016.
Activity during May 2012. The Rabaul Volcano Observatory (RVO) reported that during 1-6 and 10-26 May 2012 white plumes rose above the summit crater. However, gray-brown ash plumes rose from the crater during 7-9 and 27-31.
Seismicity was low during 1-6 May, consisting of discrete, low-frequency earthquakes. During this period RSAM values averaged ~25 units. Beginning at 1900 on 6 May RSAM values increased, reaching a peak of about 600 units at 0200 on 8 May, and then declined to ~250 units at 0100 on 9 May. Activity fluctuated between 250 and 430 units until 10 May, after which there was a further decline, reaching and remaining steady at a near-background level of ~50-70 units between 13-15 May. During 15-20 May seismicity included some discrete phases of moderate to strong tremor; RSAM values ranged between background and 200 units. RSAM values increased early on 20 May, and maintained an increasing trend with some fluctuation until reaching a peak of 650 on 25 May. After that the values declined again to 300, and fluctuated between 250 and 350 until the end of the month. The increased RSAM values reported above were associated with ongoing sporadic phases of volcanic tremors which had been going on since about March 2012.
Activity during November-December 2012. RVO reported that during 6-30 November pale-gray and brown ash plumes rose 200 m and drifted in multiple directions (figure 16). Ashfall was reported on the N and NW flanks, in Voluvolu, Noau, Ubili, and Ulamona (10 km NW). Low rumbling was heard on 18 November. A small landslide scar appeared near the N valley flank vent, reportedly caused by a large bolder and loose material sliding, triggered by a M 6.1 earthquake centered near Pomio (55 km SSE) on 19 November.
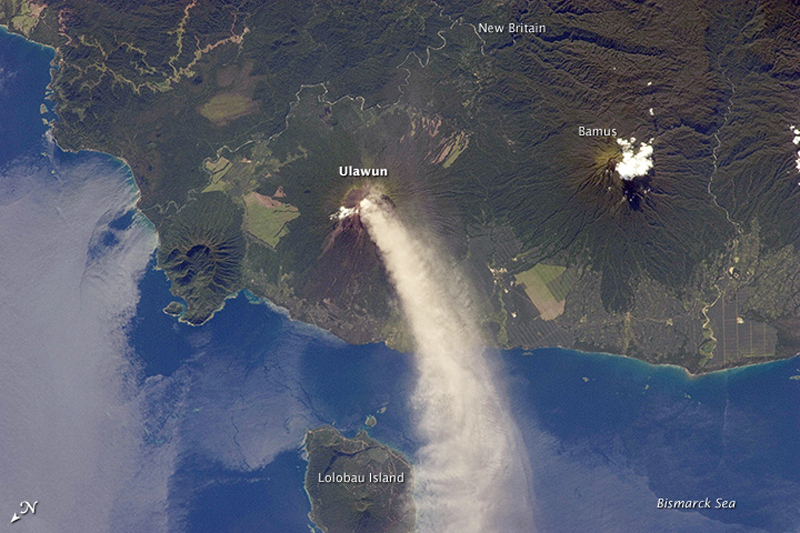 |
Figure 16. Photo of an eruption plume of white steam and brown ash from Ulawun on 30 November 2012. Note that the image is oriented with north towards the lower left, so the plume is extending from the summit crater towards the NW. The plume begins to broaden as it passes the SW coast of Lolobau Island, approximately 23 km downwind. The summit of Bamus volcano is obscured by non-volcanic white cumulus clouds (upper right). A large region of ocean surface highlighted by sunglint (sunlight reflecting off the water surface, lending it a mirror-like appearance) is visible to the NNE of Ulawun, beyond the breached Likuruanga crater (left). Photo by an Expedition 34 crew member on the International Space Station (image ISS034-E-0054960, original caption by William L. Stefanov, Jacobs/ESCG at NASA-JSC. Courtesy of NASA Earth Observatory. |
Dense, gray-brown ash plumes continued to rise to 200 m during 1-7 December. Ash fell on the NW flanks, in Ubili and Ulamona. Ash plumes ceased on 11 December, though variable amounts of white vapor plumes rose from the crater through the 16th.
Activity during July-December 2013. RVO reported low activity during 1-14 July 2013. Emissions from the summit crater consisted of white vapor during 1-7 July, and then changed to occasionally sub-continuous, light-gray ash clouds during 8 and 11-14 July. Ash clouds changed to a gray-brown color on 14 July.
Seismic activity was low from 1 July through the early part of 13 July, with RSAM values mostly near 50 units, though rises up to 100 units were recorded on 3 and 8 July. RSAM increased at around 0700 on 14 July, with the emergence of continuous volcanic tremor, and peaked at 700 units just after 0300 on 15 July. The report noted that the last significant volcanic tremors recorded at Ulawun were in May and June 2012.
RVO reported low activity during 4-31 August. Emissions from the summit crater consisted of white vapor until 16 August, and then changed to gray during 17-31 August. Emissions were more energetic on 24 August, rising to 200 m. A single booming noise and weak incandescence was also reported that day. RSAM values fluctuated but decreased overall.
Activity from 1 October to 31 December remained generally low. Between 1 October and 15 November small volumes of white vapor, and gray and gray-brown ash plumes rose 100 m above the crater and drifted S. Seismicity was low with RSAM values fluctuating between 100 and 150 units throughout the period. RVO reported that on most days during 16-30 November small volumes of gray to gray-brown ash plumes rose 100 m from the crater and drifted S. On 21 November ashfall was reported in Navo on the SW flank.
Based on analyses of satellite imagery, the Darwin VAAC reported that on 26 November an ash plume rose to an altitude of 3.7 km (1.4 km above the crater rim) and drifted 30 km NW.
During 1-15 December pale gray ash plumes rose from the crater. Residents between Sena Estate and Noau on the N flank reported ashfall in early December. Diffuse ash plumes rose from the crater during 15-21 December, and white vapor emissions were visible during 22-31 December. Seismicity was low, according to RVO reports. RSAM values generally fluctuated between 100 and 150 units throughout October-December, with a low of 60 on 20 December. No ash was reported after 21 December 2013.
Activity during October-November 2016. Ash plumes were once again reported by the Darwin VAAC starting on 11-12 October, based on satellite imagery and observations from RVO. The plumes rose to altitudes of 1.8-2.4 km and drifted 65 km WSW and W. RVO noted that there had been white plumes visible since 1 September. A report from officers at Hargy Palm Oil dated 13 October stated that a "minor eruption" had occurred after 1800 on 12 October, and that there were a few low noises from the volcano and nighttime glow during 12-13 October.
RVO noted that seismicity was at a low to moderate level, dominated by small low-frequency volcanic earthquakes. RSAM values increased and by mid-October were at the highest values (peak of 200) so far in 2016. The 12 October eruption was not evident in the seismic data.
Based on analyses of satellite imagery, the Darwin VAAC reported that during 16-17 October ash plumes rose to an altitude of 2.7 km and drifted SW and W. Additional ash plumes were seen during 19-21 and 23-28 October to altitudes of 2.4-3 km drifting 25-110 km NW, W, NE, and SW.
Despite the ash plumes extending far downwind, RVO reported that during 16-31 October activity was at low levels. Gray and white plumes with varying densities rose 100-200 m above the summit crater and drifted SW, NW, and NE. Low rumbling was heard on 24 October.
The Darwin VAAC reported that on 7 November an ash plume rose to an altitude of 3 km and drifted over 45 km E. More ash plumes were noted during 16-18 November that rose to altitudes of 2.7-3 km and drifted over 30 km SE, SW, and W.
Information Contacts: Rabaul Volcano Observatory (RVO), PO Box 386, Rabaul, Papua New Guinea; Darwin Volcanic Ash Advisory Centre (VAAC), Bureau of Meteorology, Northern Territory Regional Office, PO Box 40050, Casuarina, NT 0811, Australia (URL: http://www.bom.gov.au/info/vaac/); NASA Earth Observatory, EOS Project Science Office, NASA Goddard Space Flight Center, Goddard, Maryland, USA (URL: http://earthobservatory.nasa.gov/).
Intermittent ash plumes during June-November 2017
Activity at Ulawun has been characterized by intermittent seismic activity and weak ash emissions. The last significant episode was during October-November 2016 (BGVN 41:12). This report summarizes the next eruption, which began on 11 June 2017 and continued sporadically at least through October 2017. Data were provided by the Rabaul Volcano Observatory (RVO) and Darwin Volcanic Ash Advisory Centre (VAAC).
RVO reported that during 1 May-23 June 2017, white plumes rose from Ulawun. Seismicity was low and dominated by small low-frequency earthquakes, although RSAM values slowly increased and then spiked on 13 June. Ash emissions began on 11 June and then became dense during 21-23 June. Volcanic ash advisories from the Darwin VAAC warned of ash plumes from between 24 June and 3 November 2017 (table 5); no further volcanic ash warnings were issued after 3 November. Plumes generally rose to altitudes of 2.4-3 km, or a maximum of 700 m above the summit.
Table 5. Ash plumes from Ulawun during January-November 2017, based upon analyses of satellite imagery. Courtesy of Darwin VAAC.
| Dates | Plume altitude (km) | Plume drift |
| 24-26 Jun 2017 | 3 | W |
| 28 Jun 2017 | 2.7 | W |
| 04-08 Aug 2017 | 2.4-2.7 | NW, W, and SW |
| 09-10 Aug 2017 | 2.4 | NW, W |
| 17-18 Aug 2017 | 2.7 | W |
| 31 Aug-01 Sep 2017 | 2.7 | SW, W, NW, and N |
| 05 Sep 2017 | 2.7 | SW |
| 25 Sep 2017 | 3 | WSW |
| 26-27 Oct 2017 | 2.4 | 130 km S and SE |
| 03 Nov 2017 | 3 | NNE |
Information Contacts: Darwin Volcanic Ash Advisory Centre (VAAC), Bureau of Meteorology, Northern Territory Regional Office, PO Box 40050, Casuarina, NT 0811, Australia (URL: http://www.bom.gov.au/info/vaac/); Rabaul Volcano Observatory (RVO), Geohazards Management Division, Department of Mineral Policy and Geohazards Management (DMPGM), PO Box 3386, Kokopo, East New Britain Province, Papua New Guinea.
Ash plumes on 8 June, 21 September, and 5 October 2018
Typical activity at Ulawun consists of sporadic explosions with weak ash plumes. During 2017, sporadic explosions occurred between late June through early November with ash plumes rising no more than 3 km in altitude (BGVN 42:12). This report describes activity between January and September 2018.
According to the Darwin Volcanic Ash Advisory Centre (VAAC), a NOTAM (Notice to Airmen) stated that on 8 June 2018 an ash plume rose to an altitude of 2.1 km and drifted W. The Darwin VAAC also reported that a pilot observed an ash plume on 21 September 2018 rising to an altitude of 3.7 km and drifting W. Ash was not confirmed in satellite images, though weather clouds obscured views.
On 5 October 2018 the Darwin VAAC identified a steam-and-ash emission in satellite images rising to an altitude of 4.6 km and drifting WSW. It was also reported by ground observers. The Rabaul Volcano Observatory reported that during 1-12 October white, and sometimes light gray, emissions rose from the summit crater; seismicity was low.
Information Contacts: Darwin Volcanic Ash Advisory Centre (VAAC), Bureau of Meteorology, Northern Territory Regional Office, PO Box 40050, Casuarina, NT 0811, Australia (URL: http://www.bom.gov.au/info/vaac/); Rabaul Volcano Observatory (RVO), Geohazards Management Division, Department of Mineral Policy and Geohazards Management (DMPGM), PO Box 3386, Kokopo, East New Britain Province, Papua New Guinea.
Explosions on 26 June and 3 August 2019 send plumes above 19 km altitude
Typical activity at Ulawun consists of occasional weak explosions with ash plumes. During 2018 explosions occurred on 8 June, 21 September, and 5 October (BGVN 43:11). The volcano is monitored primarily by the Rabaul Volcano Observatory (RVO) and Darwin Volcanic Ash Advisory Centre (VAAC). This report describes activity from November 2018 through August 2019; no volcanism was noted during this period until late June 2019.
Activity during June-July 2019. RVO reported that Real-time Seismic-Amplitude Measurement (RSAM) values steadily increased during 24-25 June, and then sharply increased at around 0330 on 26 June. The RSAM values reflect an increase in seismicity dominated by volcanic tremor. An eruption began in the morning hours of 26 June with emissions of gray ash (figure 17) that over time became darker and more energetic. The plumes rose 1 km and caused minor ashfall to the NW and SW. Local residents heard roaring and rumbling during 0600-0800.
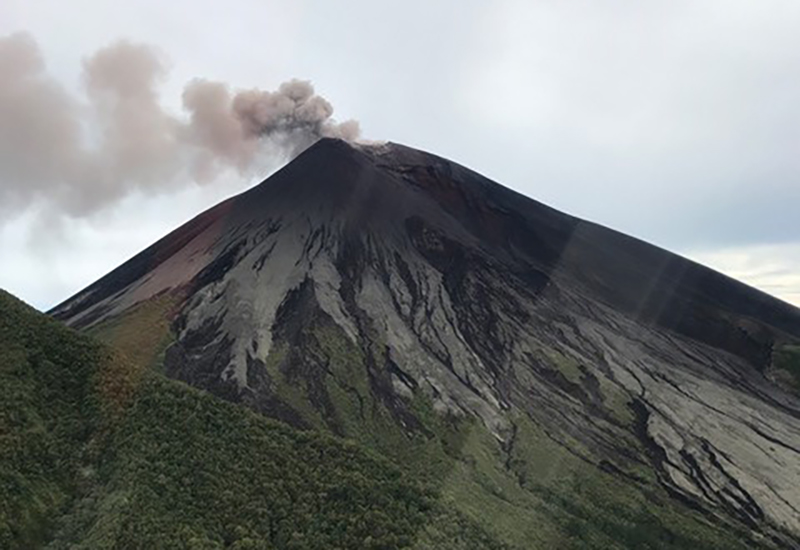 |
Figure 17. Photograph of a small ash plume rising from the summit crater of Ulawun taken by a helicopter pilot at 1030 local time on 26 June 2019. According to the pilot, the amount of ash observed was not unusual. Image has been color adjusted from original. Courtesy of Craig Powell. |
The Darwin VAAC issued several notices about ash plumes visible in satellite data. These stated that during 1130-1155 ash plumes rose to altitudes of 6.7-8.5 km and drifted W, while ash plumes that rose to 12.8-13.4 km drifted S and SW. A new pulse of activity (figures 17 and 18) generated ash plumes that by 1512 rose to an altitude of 16.8 km and drifted S and SE. By 1730 the ash plume had risen to 19.2 km and spread over 90 km in all directions. Ash from earlier ejections continued to drift S at an altitude of 13.4 km and W at an altitude of 8.5 km. RVO stated that RSAM values peaked at about 2,500 units during 1330-1600, and then dropped to 1,600 units as the eruption subsided.
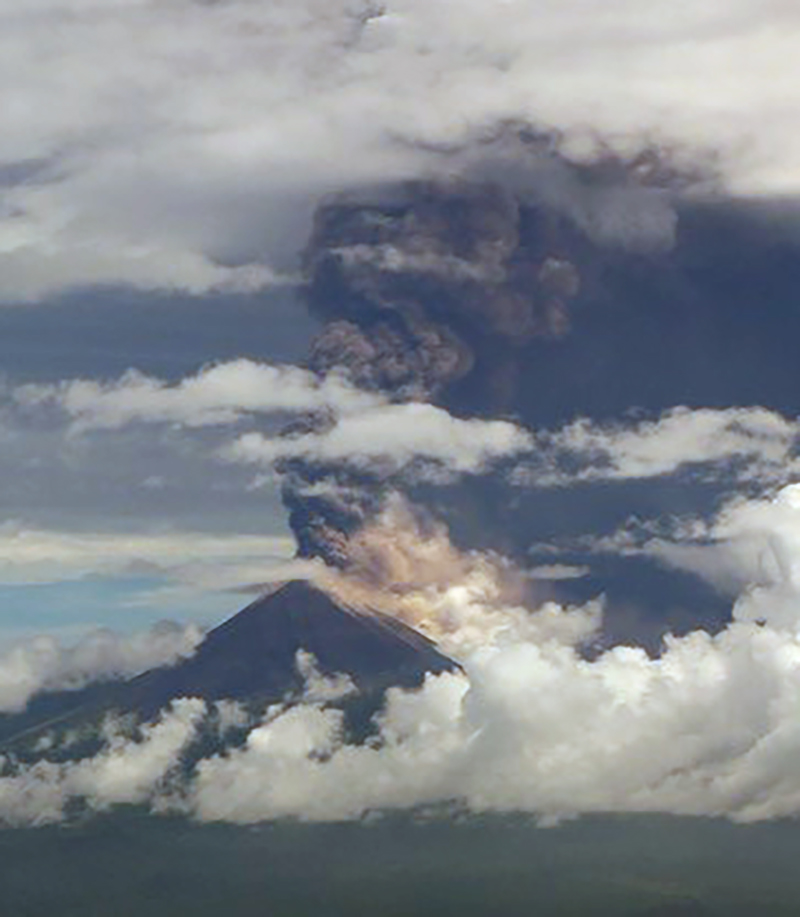 |
Figure 18. Photograph of Ulawun taken by a helicopter pilot at 1310 local time on 26 June 2019 showing a tall ash plume rising from the summit crater. Image has been color adjusted from original. Courtesy of Craig Powell. |
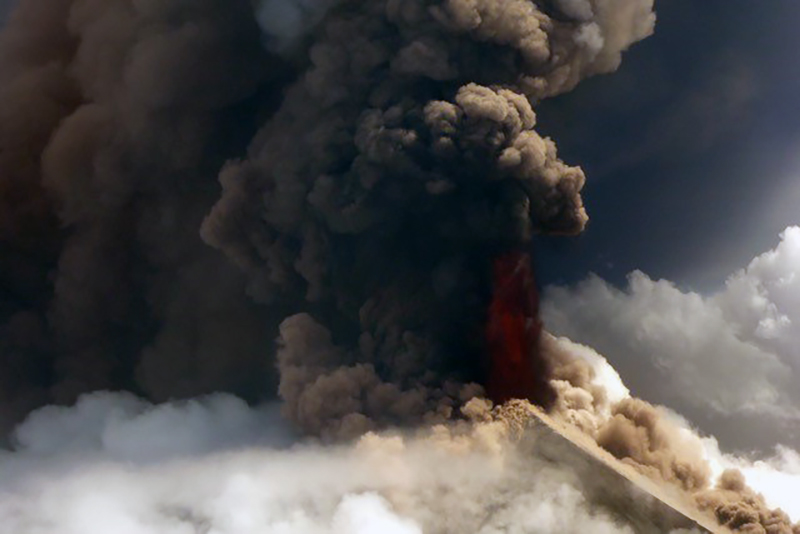 |
Figure 19. Photograph of Ulawun taken by a helicopter pilot at 1350 local time on 26 June 2019 showing a close-up view of the ash plume rising from the summit crater along with an area of incandescent ejecta. According to the pilot, this was the most active phase. Image has been color adjusted from original. Courtesy of Craig Powell. |
According to RVO, parts of the ash plume at lower altitudes drifted W, causing variable amounts of ashfall in areas to the NW and SW. A pyroclastic flow descended the N flank. Residents evacuated to areas to the NE and W; a news article (Radio New Zealand) noted that around 3,000 people had gathered at a local church. According to another news source (phys.org), an observer in a helicopter reported a column of incandescent material rising from the crater, residents noted that the sky had turned black, and a main road in the N part of the island was blocked by volcanic material. Residents also reported a lava flow near Noau village and Eana Valley. RVO reported that the eruption ceased between 1800 and 1900. Incandescence visible on the N flank was from either a lava flow or pyroclastic flow deposits.
On 27 June diffuse white plumes were reported by RVO as rising from the summit crater and incandescence was visible from pyroclastic or lava flow deposits on the N flank from the activity the day before. The seismic station 11 km NW of the volcano recorded low RSAM values of between 2 and 50. According to the Darwin VAAC a strong thermal anomaly was visible in satellite images, though not after 1200. Ash from 26 June explosions continued to disperse and became difficult to discern in satellite images by 1300, though a sulfur dioxide signal persisted. Ash at an altitude of 13.7 km drifted SW to SE and dissipated by 1620, and ash at 16.8 km drifted NW to NE and dissipated by 1857. RVO noted that at 1300 on 27 June satellite images captured an ash explosion not reported by ground-based observers, likely due to cloudy weather conditions. The Alert Level was lowered to Stage 1 (the lowest level on a four-stage scale).
RSAM values slightly increased at 0600 on 28 June and fluctuated between 80 to 150 units afterwards. During 28-29 June diffuse white plumes continued to rise from the crater (figure 20) and from the North Valley vent. On 29 June a ReliefWeb update stated that around 11,000 evacuated people remained in shelters.
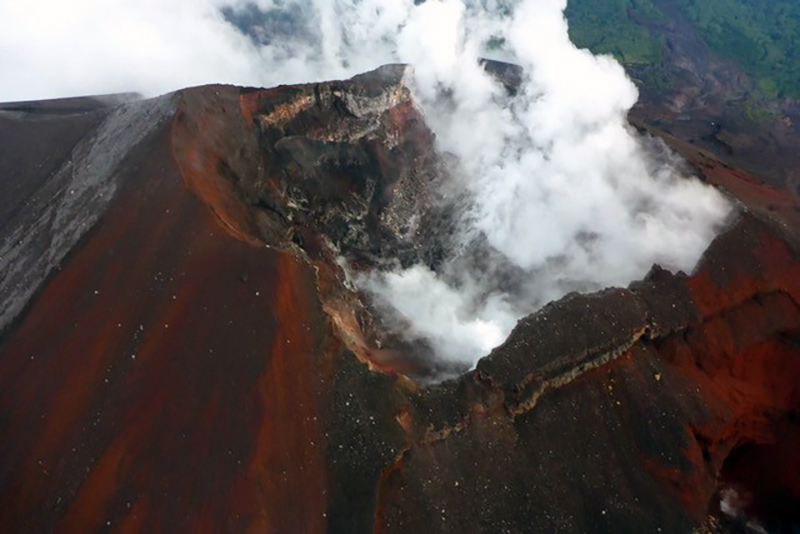 |
Figure 20. Photograph of the steaming summit crater at Ulawun taken by a helicopter pilot at 0730 local time on 29 June 2019. Image has been color adjusted from original. Courtesy of Craig Powell. |
According to RVO, diffuse white plumes rose from Ulawun's summit crater and the North Valley vent during 1-4 July and from the summit only during 5-9 July. The seismic station located 11 km NW of the volcano recorded three volcanic earthquakes and some sporadic, short-duration, volcanic tremors during 1-3 July. The seismic station 2.9 km W of the volcano was restored on 4 July and recorded small sub-continuous tremors. Some discrete high-frequency volcanic earthquakes were also recorded on most days. Sulfur dioxide emissions were 100 tonnes per day on 4 July. According to the United Nations in Papua New Guinea, 7,318 people remained displaced within seven sites because of the 26 June eruption.
Activity during August 2019. During 1-2 August RVO reported that white-to-gray vapor plumes rose from the summit crater and drifted NW. Incandescence from the summit crater was visible at night and jetting noises were audible for a short interval. RSAM values fluctuated but peaked at high levels. During the night of 2-3 August crater incandescence strengthened and roaring noises became louder around 0400. An explosion began between 0430 and 0500 on 3 August; booming noises commenced around 0445. By 0600 dense light-gray ash emissions were drifting NW, causing ashfall in areas downwind, including Ulamona Mission (10 km NW). Ash emissions continued through the day and changed from light to dark gray with time.
The eruption intensified at 1900 and a lava fountain rose more than 100 m above the crater rim. A Plinian ash plume rose 19 km and drifted W and SW, causing ashfall in areas downwind such as Navo and Kabaya, and as far as Kimbe Town (142 km SW). The Darwin VAAC reported that the ash plume expanded radially and reached the stratosphere, rising to an altitude of 19.2 km. The plume then detached and drifted S and then SE.
The Alert Level was raised to Stage 3. The areas most affected by ash and scoria fall were between Navo (W) and Saltamana Estate (NW). Two classrooms at the Navo Primary School and a church in Navo collapsed from the weight of the ash and scoria; one of the classroom roofs had already partially collapsed during the 26 June eruption. Evacuees in tents because of the 26 June explosion reported damage. Rabaul town (132 km NE) also reported ashfall. Seismicity declined rapidly within two hours of the event, though continued to fluctuate at moderate levels. According to a news source (Radio New Zealand, flights in and out of Hoskins airport in Port Moresby were cancelled on 4 August due to tephra fall. The Alert Level was lowered to Stage 1. Small amounts of white and gray vapor were emitted from the summit crater during 4-6 August. RVO reported that during 7-8 August minor emissions of white vapor rose from the summit crater.
Additional observations. Seismicity was dominated by low-level volcanic tremor and remained at low-to-moderate levels. RSAM values fluctuated between 400 and 550 units; peaks did not go above 700. Instruments aboard NASA satellites detected high levels of sulfur dioxide near or directly above the volcano on 26-29 June and 4-6 August 2019.
Thermal anomalies, based on MODIS satellite instruments analyzed using the MODVOLC algorithm, were observed at Ulawun only on 26 June 2019 (8 pixels by the Terra satellite, 4 pixels by the Aqua satellite). The MIROVA (Middle InfraRed Observation of Volcanic Activity) system detected three anomalies during the reporting period, one during the last week of June 2019 and two during the first week of August, all three within 3 km of the volcano and of low to moderate energy.
Information Contacts: Rabaul Volcano Observatory (RVO), Geohazards Management Division, Department of Mineral Policy and Geohazards Management (DMPGM), PO Box 3386, Kokopo, East New Britain Province, Papua New Guinea; Darwin Volcanic Ash Advisory Centre (VAAC), Bureau of Meteorology, Northern Territory Regional Office, PO Box 40050, Casuarina, NT 0811, Australia (URL: http://www.bom.gov.au/info/vaac/); Global Sulfur Dioxide Monitoring Page, Atmospheric Chemistry and Dynamics Laboratory, NASA Goddard Space Flight Center (NASA/GSFC), 8800 Greenbelt Road, Goddard, Maryland, USA (URL: https://so2.gsfc.nasa.gov/); Hawai'i Institute of Geophysics and Planetology (HIGP) - MODVOLC Thermal Alerts System, School of Ocean and Earth Science and Technology (SOEST), Univ. of Hawai'i, 2525 Correa Road, Honolulu, HI 96822, USA (URL: http://modis.higp.hawaii.edu/); MIROVA (Middle InfraRed Observation of Volcanic Activity), a collaborative project between the Universities of Turin and Florence (Italy) supported by the Centre for Volcanic Risk of the Italian Civil Protection Department (URL: http://www.mirovaweb.it); ReliefWeb (URL: https://reliefweb.int/); Radio New Zealand (URL: https://www.rnz.co.nz); phys.org (URL: https://phys.org); United Nations in Papua New Guinea (URL: http://pg.one.un.org/content/unct/papua_new_guinea/en/home.html).
New vent, lava fountaining, lava flow, and ash plumes in late September-October 2019
Ulawun is a basaltic-to-andesitic stratovolcano located in West New Britain, Papua New Guinea, with typical activity consisting of seismicity, gas-and-steam plumes, and ash emissions. The most recent eruption began in late June 2019 involving ash and gas-and-steam emissions, increased seismicity, and a pyroclastic flow (BGVN 44:09). This report includes volcanism from September to October 2019 with primary source information from the Rabaul Volcano Observatory (RVO) and the Darwin Volcanic Ash Advisory Centre (VAAC).
Activity remained low through 26 September 2019, mainly consisting of variable amounts of gas-and-steam emissions and low seismicity. Between 26 and 29 September RVO reported that the seismicity increased slightly and included low-level volcanic tremors and Real-Time Seismic Amplitude Measurement (RSAM) values in the 200-400 range on 19, 20, and 22 September. On 30 September small volcanic earthquakes began around 1000 and continued to increase in frequency; by 1220, they were characterized as a seismic swarm. The Darwin VAAC advisory noted that an ash plume rose to 4.6-6 km altitude, drifting SW and W, based on ground reports.
On 1 October 2019 the seismicity increased, reaching RSAM values up to 10,000 units between 0130 and 0200, according to RVO. These events preceded an eruption which originated from a new vent that opened on the SW flank at 700 m elevation, about three-quarters of the way down the flank from the summit. The eruption started between 0430 and 0500 and was defined by incandescence and lava fountaining to less than 100 m. In addition to lava fountaining, light- to dark-gray ash plumes were visible rising several kilometers above the vent and drifting NW and W (figure 21). On 2 October, as the lava fountaining continued, ash-and-steam plumes rose to variable heights between 2 and 5.2 km (figures 22 and 23), resulting in ashfall to the W in Navo. Seismicity remained high, with RSAM values passing 12,000. A lava flow also emerged during the night which traveled 1-2 km NW. The main summit crater produced white gas-and-steam emissions, but no incandescence or other signs of activity were observed.
 |
Figure 21. Photographs of incandescence and lava fountaining from Ulawun during 1-2 October 2019. A) Lava fountains along with ash plumes that rose several kilometers above the vent. B) Incandescence and lava fountaining seen from offshore. Courtesy of Christopher Lagisa. |
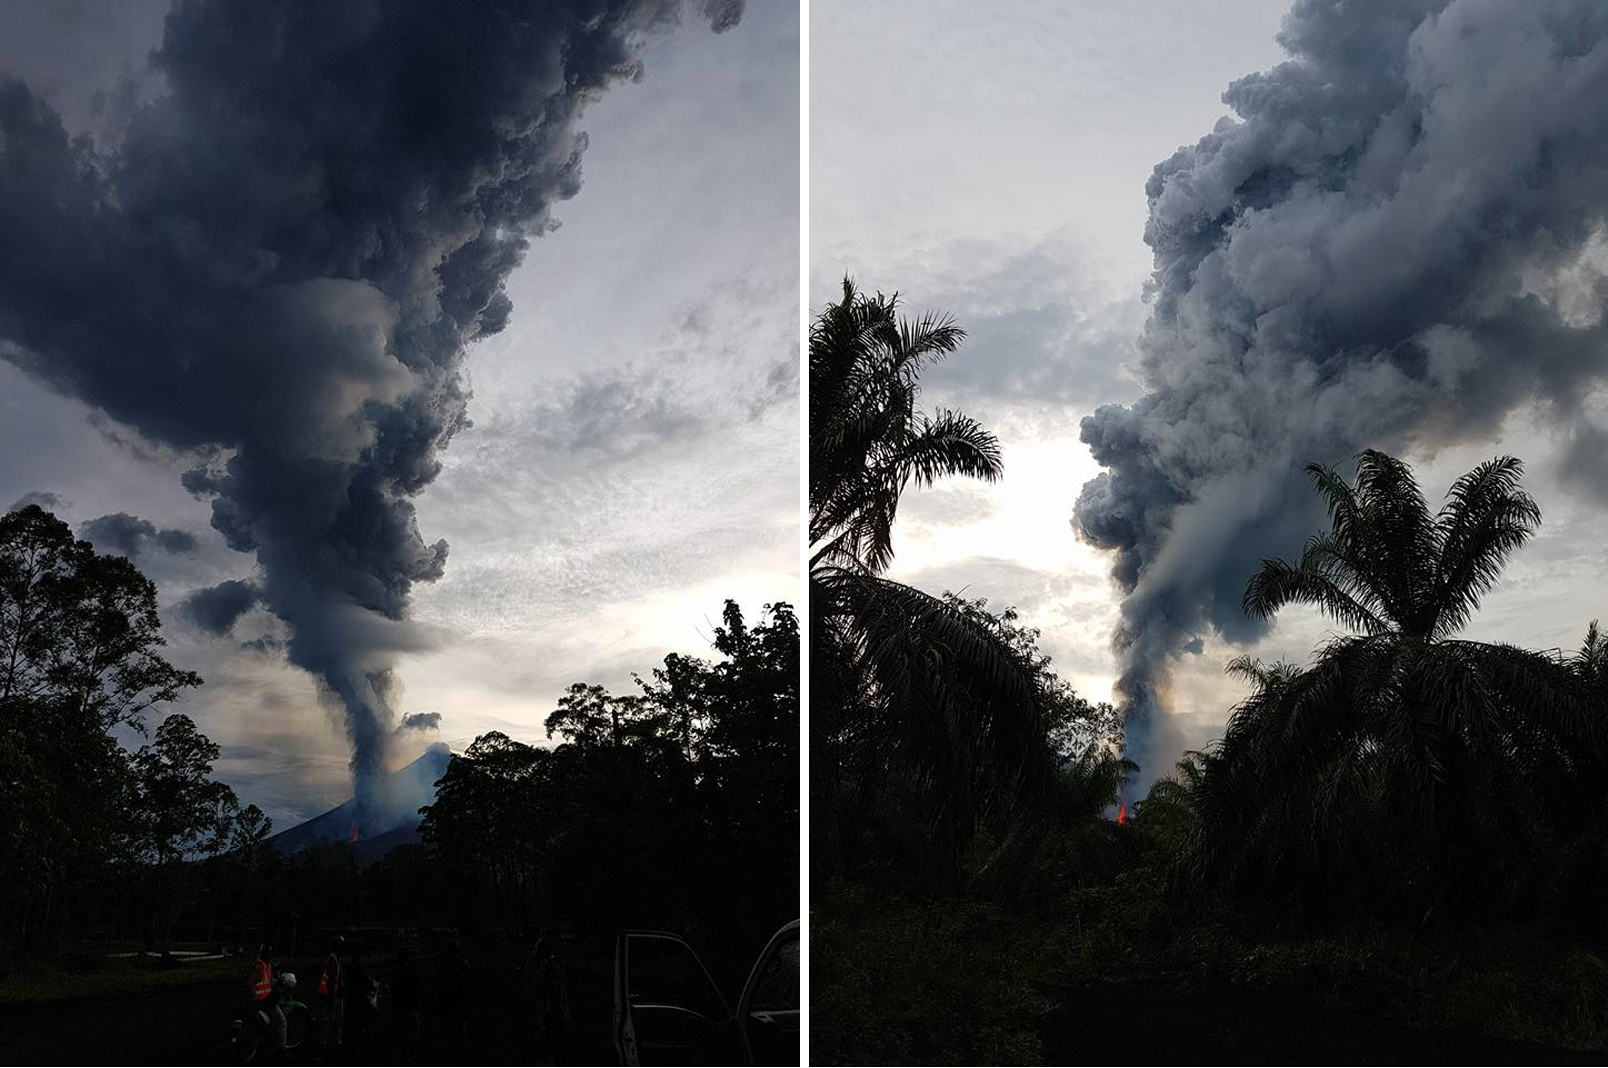 |
Figure 22. Photographs of an ash plume rising from Ulawun on 1 October 2019. In the right photo, lava fountaining is visible. Courtesy of Christopher Lagisa. |
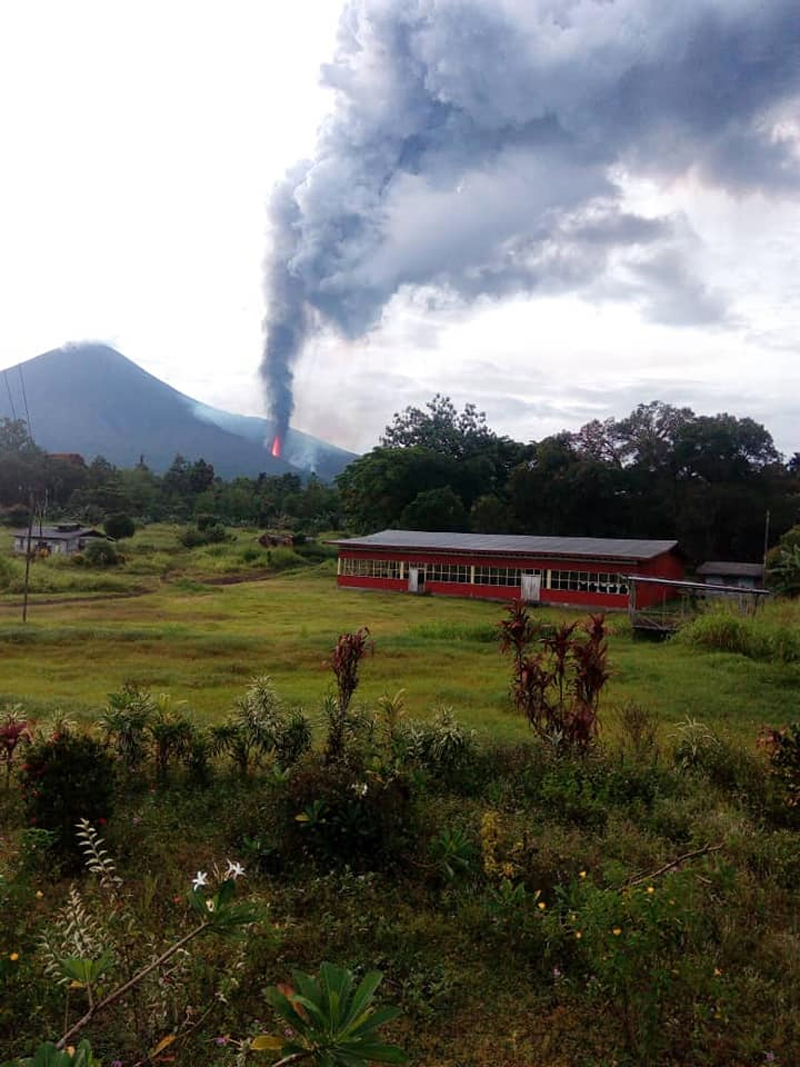 |
Figure 23. Photograph of lava fountaining and an ash plume rising from Ulawun on 1 October 2019. Courtesy of Joe Metto, WNB Provincial Disaster Office (RVO Report 2019100101). |
Ash emissions began to decrease by 3 October 2019; satellite imagery and ground observations showed an ash cloud rising to 3 km altitude and drifting N, according to the Darwin VAAC report. RVO reported that the fissure eruption on the SW flank stopped on 4 October, but gas-and-steam emissions and weak incandescence were still visible. The lava flow slowed, advancing 3-5 m/day, while declining seismicity was reflected in RSAM values fluctuating around 1,000. RVO reported that between 23 and 31 October the main summit crater continued to produce variable amounts of white gas-and-steam emissions (figure 24) and that no incandescence was observed after 5 October. Gas-and-steam emissions were also observed around the new SW vent and along the lava flow. Seismicity remained low until 27-29 October; it increased again and peaked on 30 October, reaching an RSAM value of 1,700 before dropping and fluctuating around 1,200-1,500.
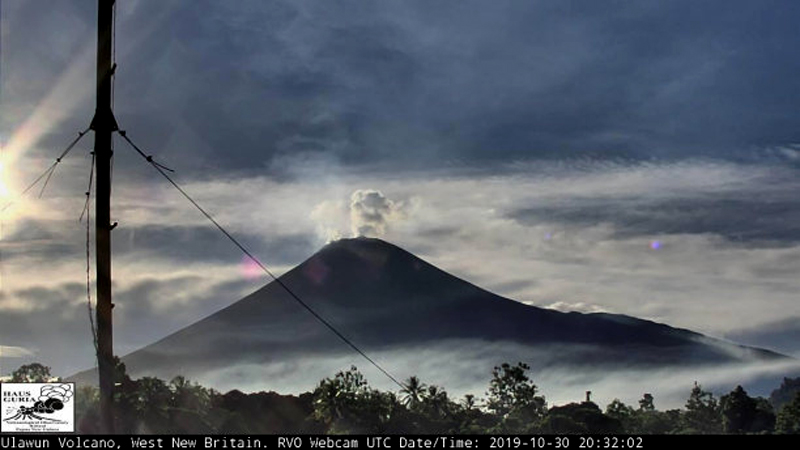 |
Figure 24. Webcam photo of a gas-and-steam plume rising from Ulawun on 30 October 2019. Courtesy of the Rabaul Volcano Observatory (RVO). |
In addition to ash plumes, SO2 plumes were also detected between September and October 2019. Sentinel-5P/TROPOMI data showed SO2 plumes, some of which exceeded 2 Dobson Units (DU) drifting in different directions (figure 25). MIROVA (Middle InfraRed Observation of Volcanic Activity) analysis of MODIS satellite data showed strong, frequent thermal anomalies within 5 km of the summit beginning in early October 2019 and throughout the rest of the month (figure 26). Only one thermal anomaly was detected in early December.
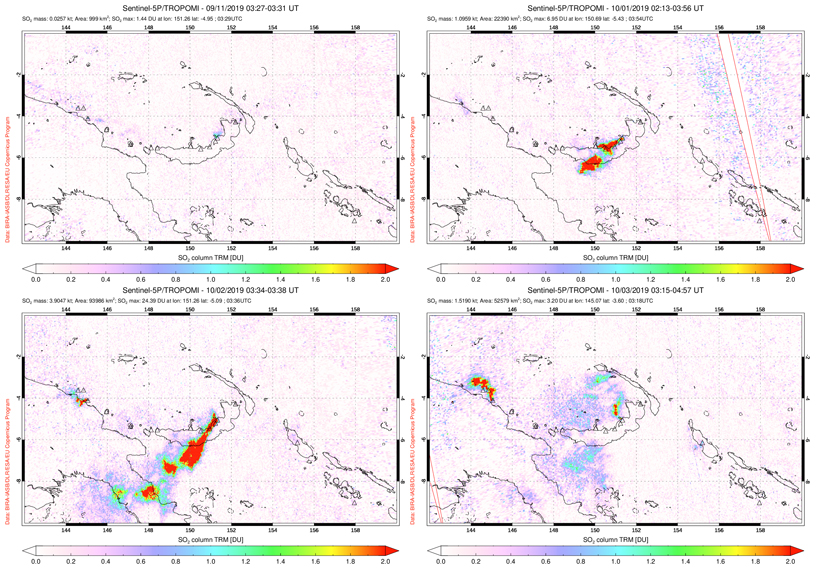 |
Figure 25. Sentinel-5P/TROPOMI data showing a high concentration of SO2 plumes rising from Ulawun between late September-early October 2019. Top left: 11 September 2019. Top right: 1 October 2019. Bottom left: 2 October 2019. Bottom right: 3 October 2019. Courtesy of the NASA Space Goddard Flight Center. |
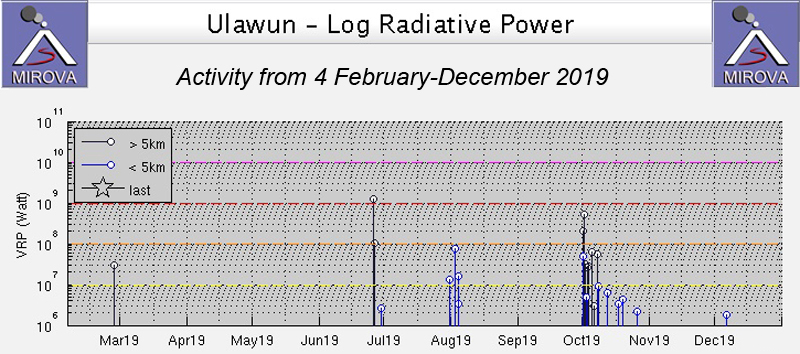 |
Figure 26. Frequent and strong thermal anomalies at Ulawun for February through December 2019 as recorded by the MIROVA system (Log Radiative Power) began in early October and continued throughout the month. Courtesy of MIROVA. |
Activity in November was relatively low, with only a variable amount of white gas-and-steam emissions visible and low (less than 200 RSAM units) seismicity with sporadic volcanic earthquakes. Between 9-22 December, a webcam showed intermittent white gas-and-steam emissions were observed at the main crater, accompanied by some incandescence at night. Some gas-and-steam emissions were also observed rising from the new SW vent along the lava flow.
Information Contacts: Rabaul Volcano Observatory (RVO), Geohazards Management Division, Department of Mineral Policy and Geohazards Management (DMPGM), PO Box 3386, Kokopo, East New Britain Province, Papua New Guinea; Darwin Volcanic Ash Advisory Centre (VAAC), Bureau of Meteorology, Northern Territory Regional Office, PO Box 40050, Casuarina, NT 0811, Australia (URL: http://www.bom.gov.au/info/vaac/); MIROVA (Middle InfraRed Observation of Volcanic Activity), a collaborative project between the Universities of Turin and Florence (Italy) supported by the Centre for Volcanic Risk of the Italian Civil Protection Department (URL: http://www.mirovaweb.it/); Global Sulfur Dioxide Monitoring Page, Atmospheric Chemistry and Dynamics Laboratory, NASA Goddard Space Flight Center (NASA/GSFC), 8800 Greenbelt Road, Goddard, Maryland, USA (URL: https://SO2.gsfc.nasa.gov/); Christopher Lagisa, West New Britain Province, Papua New Guinea (URL: https://www.facebook.com/christopher.lagisa, images posted at https://www.facebook.com/christopher.lagisa/posts/730662937360239 and https://www.facebook.com/christopher.lagisa/posts/730215604071639).
SO2 emissions, ash plumes, and thermal anomalies during July-November 2021
Ulawun is the highest volcano on the Bismarck arc on the N coast of New Britain, located in Papua New Guinea. Historical eruptions date back to 1700; twentieth-century eruptions were mildly explosive until 1967. Its most recent eruption occurred during late June through early October 2019 and was characterized by a new vent, lava fountaining and a flow, and ash plumes (BGVN 44:12). A new eruption was reported during July 2021 and consisted of ash plumes, gas-and-steam emissions, and brief thermal anomalies. This report covers activity during July through November 2021 with information from Rabaul Volcano Observatory (RVO), the Darwin Volcanic Ash Advisory Centre (VAAC), and satellite data.
Activity after October 2019 and throughout 2020 was relatively low; RVO reported that intermittent white gas-and-steam plumes rose from the Main Crater during late December into early February. Occasional emissions rose from WSW flank by the October 2019 vent and lava flow. A webcam sometimes recorded nighttime incandescence from this same area during late December into early January 2020. RVO reported mudflows during mid-January that deposited material on the upper flanks. Seismicity through early February 2020 was low, with RSAM values no higher than 200 units.
During the first half of 2021 activity remained relatively low. Data from the TROPOMI instrument on the Sentinel-5P satellite showed a strong sulfur dioxide concentration on 26 January. Some periods of increased seismicity were recorded during 4-8, 24-25, 26-28, and 29-30 June (figure 27). Occasional high-frequency volcano-tectonic earthquakes were also detected. TROPOMI identified weaker sulfur dioxide emissions drifting generally W on 4 and 7 July (figure 28). Sentinel-2 infrared satellite imagery showed a small thermal anomaly in the summit crater on 9 and 14 July (figure 29), with a weaker anomaly on 24 July partially obscured by a steam plume. The Darwin VAAC issued one notice on 29 July and two on 3 August, reporting ash plumes that rose to 3 and 3.4 km altitude, and drifted E and SSE, respectively, according to pilot reports. Weather clouds prevented clear views in satellite imagery. Another weak SO2 plume was present on 5 August.
 |
Figure 27. Graph of the gradually increasing seismicity at Ulawun showing daily Real-time Seismic Amplitude Measurement (RSAM) data during June 2021. Courtesy of RVO (VOLCANO INFORMATION BULLETIN – No. 01-062021). |
 |
Figure 28. Sentinel-5P/TROPOMI data showing a high concentration of sulfur dioxide above Ulawun on 26 January 2021 (top left). Weaker plumes were visible on 4 (top right) and 7 (bottom left) July and 5 August (bottom right) drifting generally W. Courtesy of NASA Global Sulfur Dioxide Monitoring Page. |
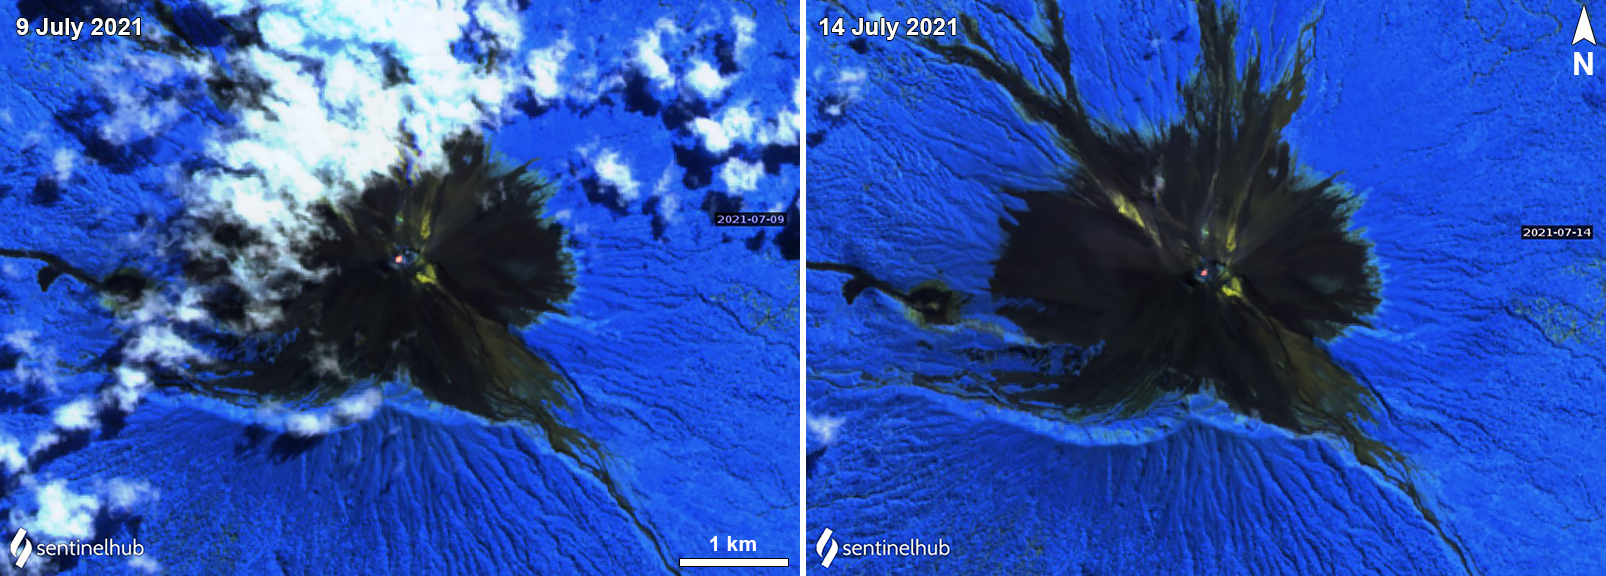 |
Figure 29. Sentinel-2 infrared satellite images showing a small thermal anomaly in the summit crater of Ulawun on 9 July (left) and 14 July (right) 2021. Sentinel-2 images with "Atmospheric penetration" (bands 12, 11, 8A) rendering. Courtesy of Sentinel Hub Playground. |
In early November RVO reported that very small, discrete, seismic events had been recorded over the previous several months by the seismometer located 5 km from the summit on the SW flank. No surface activity was noted until a small thermal anomaly was identified in satellite images around 0500 on 3 November, according to RVO. At 0800 that same day, RSAM values increased to 100, and by 1115 they had increased further to 1,400. Values continued to fluctuate between 100 and 1,000 units at least through 1300. Tremors were detected on a seismometer at Ulamona (11-12 km NW from the summit) during periods with higher RSAM values. Gas-and-steam emissions continued to be visible above the crater. On 30 November the Darwin VAAC raised the Aviation Color Code to Orange (the second highest level on a four-color scale), due to reports from local observers who described increased seismicity, gas-and-steam emissions, and a small ash eruption on the 29th.
Information Contacts: Rabaul Volcano Observatory (RVO), Geohazards Management Division, Department of Mineral Policy and Geohazards Management (DMPGM), PO Box 3386, Kokopo, East New Britain Province, Papua New Guinea; Darwin Volcanic Ash Advisory Centre (VAAC), Bureau of Meteorology, Northern Territory Regional Office, PO Box 40050, Casuarina, NT 0811, Australia (URL: http://www.bom.gov.au/info/vaac/); NASA Global Sulfur Dioxide Monitoring Page, Atmospheric Chemistry and Dynamics Laboratory, NASA Goddard Space Flight Center (NASA/GSFC), 8800 Greenbelt Road, Goddard, Maryland, USA (URL: https://so2.gsfc.nasa.gov/); Sentinel Hub Playground (URL: https://www.sentinel-hub.com/explore/sentinel-playground).
New ash eruption and light ashfall on 2 June 2022
Ulawun rises above the N coast of New Britain, Papua New Guinea, and is part of the Bismarck arc. Documented eruptions date back to the 18th century and mildly explosive eruptions occurred during the 20th century through 1967. The most recent eruption began in July 2021 and ended on 29 November 2021, which was primarily characterized by ash eruptions, seismicity, small thermal anomalies, and sulfur dioxide emissions (BGVN 46:12). This report covers a new eruption on 2 June 2022 using information from the Rabaul Volcano Observatory (RVO), the Darwin Volcanic Ash Advisory Centre (VAAC), and satellite data.
Activity during December 2021 and May 2022 was relatively low and consisted mostly of intermittent sulfur dioxide emissions, based on data from the TROPOMI instrument on the Sentinel-5P satellite (figure 30). According to a report from RVO, a short, single day eruption was detected at 0820 on 2 June 2022. Dense ash plumes were visible rising about 3 km above the summit and drifting NW for 10-15 minutes, causing light ashfall in downwind areas to the SE, including Ulamona Mission and on Lolobau Island. A sulfur dioxide plume drifting to the NW was detected by the TROPOMI instrument aboard the Sentinel-5P satellite; maximum column abundance more than 2 Dobson Units (DU) was detected in the plume. On 3 June diffuse white gas-and-steam plumes were visible rising above the summit. Seismicity increased during this event, dominated by continuous volcanic tremors, and consisted of RSAM units between 400 and 500. After the eruption, the units dropped back to lower levels of less than 100 and by the end of June, they had risen to 200.
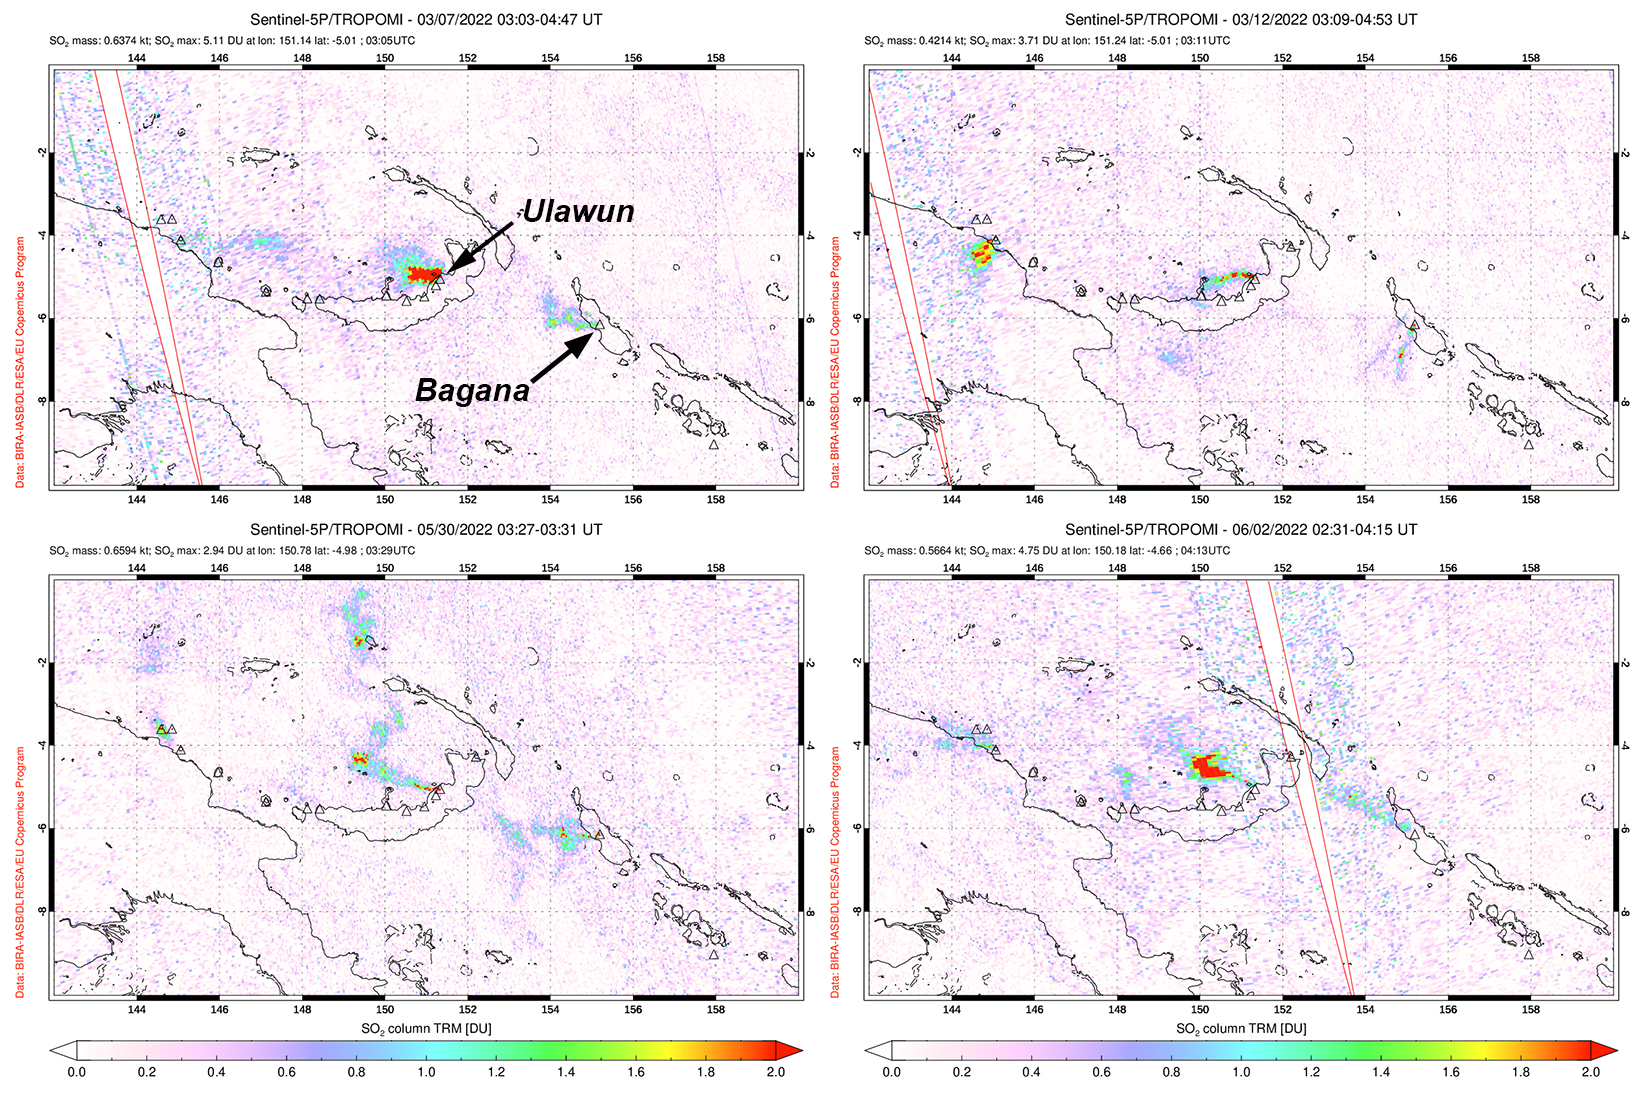 |
Figure 30. Sentinel-5P/TROPOMI data showing intermittent sulfur dioxide plumes above originating from Ulawun on 7 March 2022 (top left), 12 March 2022 (top right), 30 May 2022 (bottom left), and 2 June 2022 (bottom right) that generally drifted W and NW. Each of these plumes exceeded 2 Dobson Units (DU). Courtesy of NASA Global Sulfur Dioxide Monitoring Page. |
Information Contacts: Rabaul Volcano Observatory (RVO), Geohazards Management Division, Department of Mineral Policy and Geohazards Management (DMPGM), PO Box 3386, Kokopo, East New Britain Province, Papua New Guinea; Darwin Volcanic Ash Advisory Centre (VAAC), Bureau of Meteorology, Northern Territory Regional Office, PO Box 40050, Casuarina, NT 0811, Australia (URL: http://www.bom.gov.au/info/vaac/); NASA Global Sulfur Dioxide Monitoring Page, Atmospheric Chemistry and Dynamics Laboratory, NASA Goddard Space Flight Center (NASA/GSFC), 8800 Greenbelt Road, Goddard, Maryland, USA (URL: https://so2.gsfc.nasa.gov/).
Short explosion on 28 March with minor ashfall on nearby villages; renewed activity in mid-July 2023
Ulawun is a basaltic-to-andesitic stratovolcano on the island of New Britain, Papua New Guinea, that has been erupting since at least 1700. There have been frequent relatively short eruptions since 2012, with activity including explosions with ash plumes rising as high as 19 km (or 17 km above the summit), lava fountaining and flows, incandescence, brief thermal anomalies, sulfur dioxide emissions, gas-and-steam emissions, and increased seismicity (BGVN 44:09, 44:12). This report covers activity from July 2022 through July 2023 and is based on information from the Rabaul Volcano Observatory (RVO), the Darwin Volcanic Ash Advisory Centre (VAAC), and satellite data.
Thermal anomalies within the summit crater were detected in Sentinel-2 imagery on 19 July, 13 August, 23 August, 2 September, and 12 October 2022, but RVO reported no visible activity through that period. Anomalies were often absent during other days with clear views through July 2023. A single-day eruption took place on 28 March 2023 and then the start a new eruption period began in mid-July 2023.
Activity during March 2023. RVO reported a short explosion during 0408-0425 on 28 March, based on seismic data. A local volcano observer reported minor ashfall in areas to the NW including Ubili village, and the Ulamona Mission, Saltamana, and Ibana Village Oil Palm areas. According to the Darwin VAAC, at 0600 an ash plume was visible in a satellite image drifting W at an altitude of 3.4 km; the plume had dissipated by 1000. Thereafter, seismicity decreased, although weak high-frequency volcanic earthquakes were recorded, and tremor continued through 31 March. Steam plumes of variable densities rose above the summit. Prior to this explosion, small sulfur dioxide plumes were identified during 14-23 March.
Activity during July 2023. Low levels of seismicity were reported by RVO during 1-16 July, consisting of small, discrete, low-frequency earthquakes and occasional small high-frequency volcano-tectonic earthquakes. Late on 16 July RSAM values increased from 50 up to 500, climbing at a slow, erratic rate to 610 through 0500 on 18 July. During 0500-0700 the values dropped to 400-500, though peaks as high as 1,600 were recorded, but by 0700 values had decreased to 300 and remained steady. Minor ash emissions began on 18 June and during the morning of 19 July brown-to-gray emissions with low ash content were rising a few hundred meters about the crater rim and drifting SE.
During 20-25 July steam-and-gas plumes containing up to moderate amounts of ash rose from the summit crater and caused minor ashfall downwind in various directions, but mainly NW. Occasional ash emissions during 25-26 July drifted SE. Sulfur dioxide emissions were detected in satellite images on 21 and 24 July. Moderate seismicity was variable and was dominated by volcanic tremors. RSAM values between 22 and 25 July ranged between 380 and 800. The Alert Level was raised to Stage 2 (the second highest on the four-level scale).
Information Contacts: Rabaul Volcano Observatory (RVO), Geohazards Management Division, Department of Mineral Policy and Geohazards Management (DMPGM), PO Box 3386, Kokopo, East New Britain Province, Papua New Guinea; Darwin Volcanic Ash Advisory Centre (VAAC), Bureau of Meteorology, Northern Territory Regional Office, PO Box 40050, Casuarina, NT 0811, Australia (URL: http://www.bom.gov.au/info/vaac/); Global Sulfur Dioxide Monitoring Page, Atmospheric Chemistry and Dynamics Laboratory, NASA Goddard Space Flight Center (NASA/GSFC), 8800 Greenbelt Road, Goddard, Maryland, USA (URL: https://SO2.gsfc.nasa.gov/); Sentinel Hub Playground(URL: https://www.sentinel-hub.com/explore/sentinel-playground).
|
|
||||||||||||||||||||||||||
There is data available for 47 confirmed eruptive periods.
2025 Mar 27 - 2025 Sep 19 (continuing) Confirmed Eruption (Explosive / Effusive)
| Episode 1 | Eruption (Explosive / Effusive) | ||||
|---|---|---|---|---|
| 2025 Mar 27 - 2025 Sep 19 (continuing) | Evidence from Observations: Reported | |||
2023 Jul 18 - 2023 Dec 31 Confirmed Eruption (Explosive / Effusive) VEI: 3
| Episode 1 | Eruption (Explosive / Effusive) | |||||||||||||||||||
|---|---|---|---|---|---|---|---|---|---|---|---|---|---|---|---|---|---|---|---|
| 2023 Jul 18 - 2023 Dec 31 | Evidence from Observations: Reported | ||||||||||||||||||
|
List of 2 Events for Episode 1
|
|||||||||||||||||||
2023 Mar 28 - 2023 Mar 28 Confirmed Eruption (Explosive / Effusive) VEI: 1
| Episode 1 | Eruption (Explosive / Effusive) | |||||||||||||||||||
|---|---|---|---|---|---|---|---|---|---|---|---|---|---|---|---|---|---|---|---|
| 2023 Mar 28 - 2023 Mar 28 | Evidence from Observations: Reported | ||||||||||||||||||
| A short eruption identified using seismic data occurred during 0408-0425 on 28 March 2023. A local volcano observer reported minor ashfall in areas to the NW. | |||||||||||||||||||
|
List of 2 Events for Episode 1
|
|||||||||||||||||||
2022 Jun 2 - 2022 Jun 2 Confirmed Eruption (Explosive / Effusive) VEI: 2
| Episode 1 | Eruption (Explosive / Effusive) | ||||||||||||||||||||||||
|---|---|---|---|---|---|---|---|---|---|---|---|---|---|---|---|---|---|---|---|---|---|---|---|---|
| 2022 Jun 2 - 2022 Jun 2 | Evidence from Observations: Reported | |||||||||||||||||||||||
| At 0820 on 2 June 2022 a small eruption produced dense gray ash plumes that rose about 3 km above the summit and drifted NW. The elevated activity lasted 10-15 minutes. Minor ashfall was reported in areas downwind, including in Ulamona Mission and on Lolobau Island. | ||||||||||||||||||||||||
|
List of 3 Events for Episode 1
|
||||||||||||||||||||||||
2021 Jul 9 - 2021 Nov 29 Confirmed Eruption (Explosive / Effusive) VEI: 2
| Episode 1 | Eruption (Explosive / Effusive) | ||||||||||||||||||||||||
|---|---|---|---|---|---|---|---|---|---|---|---|---|---|---|---|---|---|---|---|---|---|---|---|---|
| 2021 Jul 9 - 2021 Aug 4 ± 1 days | Evidence from Observations: Reported | |||||||||||||||||||||||
| According to the Darwin VAAC, pilots observed ash plumes on 29 July and 3 August rising to 3-3.4 km altitude and drifting E and SSE, respectively. Weather clouds prevented satellite confirmation of the emissions. | ||||||||||||||||||||||||
|
List of 3 Events for Episode 1
|
||||||||||||||||||||||||
| Episode 2 | Eruption (Explosive / Effusive) | ||||||||||||||||||||||||
|---|---|---|---|---|---|---|---|---|---|---|---|---|---|---|---|---|---|---|---|---|---|---|---|---|
| 2021 Nov 3 - 2021 Nov 29 | Evidence from Observations: Reported | |||||||||||||||||||||||
| Thermal anomaly and seismicity 3 November; small ash eruption 29 November. | ||||||||||||||||||||||||
|
List of 3 Events for Episode 2
|
||||||||||||||||||||||||
2019 Jun 26 - 2019 Oct 5 Confirmed Eruption (Explosive / Effusive) VEI: 4
| Episode 1 | Eruption (Explosive / Effusive) | ||||||||||||||
|---|---|---|---|---|---|---|---|---|---|---|---|---|---|---|
| 2019 Jun 26 - 2019 Oct 5 | Evidence from Observations: Reported | |||||||||||||
|
List of 1 Events for Episode 1
|
||||||||||||||
2018 Sep 21 - 2018 Oct 12 (on or before) Confirmed Eruption (Explosive / Effusive) VEI: 2
| Episode 1 | Eruption (Explosive / Effusive) | Summit crater | ||||||||||||||||||||||||||||
|---|---|---|---|---|---|---|---|---|---|---|---|---|---|---|---|---|---|---|---|---|---|---|---|---|---|---|---|---|---|
| 2018 Sep 21 - 2018 Oct 12 (on or before) | Evidence from Observations: Reported | ||||||||||||||||||||||||||||
|
List of 4 Events for Episode 1 at Summit crater
|
|||||||||||||||||||||||||||||
2018 Jun 8 - 2018 Jun 8 Confirmed Eruption (Explosive / Effusive) VEI: 1
| Episode 1 | Eruption (Explosive / Effusive) | Summit crater | ||||||||||||||||||
|---|---|---|---|---|---|---|---|---|---|---|---|---|---|---|---|---|---|---|---|
| 2018 Jun 8 - 2018 Jun 8 | Evidence from Observations: Reported | ||||||||||||||||||
|
List of 2 Events for Episode 1 at Summit crater
|
|||||||||||||||||||
2017 Jun 11 - 2017 Nov 3 Confirmed Eruption (Explosive / Effusive) VEI: 1
| Episode 1 | Eruption (Explosive / Effusive) | Summit crater | ||||||||||||||||||||||||||||||||||||||||||||||||||||||||||||||||||||||||||||||||||||||||||||||||||
|---|---|---|---|---|---|---|---|---|---|---|---|---|---|---|---|---|---|---|---|---|---|---|---|---|---|---|---|---|---|---|---|---|---|---|---|---|---|---|---|---|---|---|---|---|---|---|---|---|---|---|---|---|---|---|---|---|---|---|---|---|---|---|---|---|---|---|---|---|---|---|---|---|---|---|---|---|---|---|---|---|---|---|---|---|---|---|---|---|---|---|---|---|---|---|---|---|---|---|---|
| 2017 Jun 11 - 2017 Nov 3 | Evidence from Observations: Reported | ||||||||||||||||||||||||||||||||||||||||||||||||||||||||||||||||||||||||||||||||||||||||||||||||||
|
List of 18 Events for Episode 1 at Summit crater
|
|||||||||||||||||||||||||||||||||||||||||||||||||||||||||||||||||||||||||||||||||||||||||||||||||||
2016 Oct 11 - 2016 Nov 18 Confirmed Eruption (Explosive / Effusive) VEI: 1
| Episode 1 | Eruption (Explosive / Effusive) | Summit crater | ||||||||||||||||||||||||||||||||||||||||||||||||||||||||||||||||||||
|---|---|---|---|---|---|---|---|---|---|---|---|---|---|---|---|---|---|---|---|---|---|---|---|---|---|---|---|---|---|---|---|---|---|---|---|---|---|---|---|---|---|---|---|---|---|---|---|---|---|---|---|---|---|---|---|---|---|---|---|---|---|---|---|---|---|---|---|---|---|
| 2016 Oct 11 - 2016 Nov 18 | Evidence from Observations: Reported | ||||||||||||||||||||||||||||||||||||||||||||||||||||||||||||||||||||
|
List of 12 Events for Episode 1 at Summit crater
|
|||||||||||||||||||||||||||||||||||||||||||||||||||||||||||||||||||||
2013 Jul 8 - 2013 Dec 21 Confirmed Eruption (Explosive / Effusive) VEI: 1
| Episode 1 | Eruption (Explosive / Effusive) | Summit crater | ||||||||||||||||||||||||||||||||||||||||||||||||||||||||||||||||||||
|---|---|---|---|---|---|---|---|---|---|---|---|---|---|---|---|---|---|---|---|---|---|---|---|---|---|---|---|---|---|---|---|---|---|---|---|---|---|---|---|---|---|---|---|---|---|---|---|---|---|---|---|---|---|---|---|---|---|---|---|---|---|---|---|---|---|---|---|---|---|
| 2013 Jul 8 - 2013 Dec 21 | Evidence from Observations: Reported | ||||||||||||||||||||||||||||||||||||||||||||||||||||||||||||||||||||
|
List of 12 Events for Episode 1 at Summit crater
|
|||||||||||||||||||||||||||||||||||||||||||||||||||||||||||||||||||||
2012 Nov 6 - 2012 Dec 11 Confirmed Eruption (Explosive / Effusive) VEI: 1
| Episode 1 | Eruption (Explosive / Effusive) | Summit crater | ||||||||||||||||||||||||||||||||||||||
|---|---|---|---|---|---|---|---|---|---|---|---|---|---|---|---|---|---|---|---|---|---|---|---|---|---|---|---|---|---|---|---|---|---|---|---|---|---|---|---|
| 2012 Nov 6 - 2012 Dec 11 | Evidence from Observations: Reported | ||||||||||||||||||||||||||||||||||||||
|
List of 6 Events for Episode 1 at Summit crater
|
|||||||||||||||||||||||||||||||||||||||
2012 May 7 - 2012 May 31 Confirmed Eruption (Explosive / Effusive) VEI: 1
| Episode 1 | Eruption (Explosive / Effusive) | Summit crater | ||||||||||||||||||||||||||||
|---|---|---|---|---|---|---|---|---|---|---|---|---|---|---|---|---|---|---|---|---|---|---|---|---|---|---|---|---|---|
| 2012 May 7 - 2012 May 31 | Evidence from Observations: Reported | ||||||||||||||||||||||||||||
|
List of 4 Events for Episode 1 at Summit crater
|
|||||||||||||||||||||||||||||
2010 May 26 ± 4 days - 2011 May 27 Confirmed Eruption (Explosive / Effusive) VEI: 2 (?)
| Episode 1 | Eruption (Explosive / Effusive) | Summit crater | ||||||||||||||||||||||||||||||||||||||||||||||||||||||||||||||||||||||||||||||||||||||||||||||||||||||||||||
|---|---|---|---|---|---|---|---|---|---|---|---|---|---|---|---|---|---|---|---|---|---|---|---|---|---|---|---|---|---|---|---|---|---|---|---|---|---|---|---|---|---|---|---|---|---|---|---|---|---|---|---|---|---|---|---|---|---|---|---|---|---|---|---|---|---|---|---|---|---|---|---|---|---|---|---|---|---|---|---|---|---|---|---|---|---|---|---|---|---|---|---|---|---|---|---|---|---|---|---|---|---|---|---|---|---|---|---|---|---|
| 2010 May 26 ± 4 days - 2011 May 27 | Evidence from Observations: Reported | ||||||||||||||||||||||||||||||||||||||||||||||||||||||||||||||||||||||||||||||||||||||||||||||||||||||||||||
|
List of 20 Events for Episode 1 at Summit crater
|
|||||||||||||||||||||||||||||||||||||||||||||||||||||||||||||||||||||||||||||||||||||||||||||||||||||||||||||
[ 2007 Dec 25 ] Uncertain Eruption
| Episode 1 | Eruption (Explosive / Effusive) | ||||||||||||||||||||||||
|---|---|---|---|---|---|---|---|---|---|---|---|---|---|---|---|---|---|---|---|---|---|---|---|---|
| 2007 Dec 25 - Unknown | Evidence from Unknown | |||||||||||||||||||||||
|
List of 3 Events for Episode 1
|
||||||||||||||||||||||||
2007 May 1 - 2007 May 1 Confirmed Eruption (Explosive / Effusive) VEI: 2
| Episode 1 | Eruption (Explosive / Effusive) | ||||||||||||||||||||||||
|---|---|---|---|---|---|---|---|---|---|---|---|---|---|---|---|---|---|---|---|---|---|---|---|---|
| 2007 May 1 - 2007 May 1 | Evidence from Observations: Reported | |||||||||||||||||||||||
|
List of 3 Events for Episode 1
|
||||||||||||||||||||||||
2006 Mar 1 - 2007 Jan 18 Confirmed Eruption (Explosive / Effusive) VEI: 2
| Episode 1 | Eruption (Explosive / Effusive) | |||||||||||||||||||||||||||||||||||||||
|---|---|---|---|---|---|---|---|---|---|---|---|---|---|---|---|---|---|---|---|---|---|---|---|---|---|---|---|---|---|---|---|---|---|---|---|---|---|---|---|
| 2006 Mar 1 - 2007 Jan 18 | Evidence from Observations: Reported | ||||||||||||||||||||||||||||||||||||||
|
List of 6 Events for Episode 1
|
|||||||||||||||||||||||||||||||||||||||
2005 Mar 27 (?) - 2005 Aug 9 (?) Confirmed Eruption (Explosive / Effusive) VEI: 2
| Episode 1 | Eruption (Explosive / Effusive) | ||||||||||||||||||||||||||||||||||
|---|---|---|---|---|---|---|---|---|---|---|---|---|---|---|---|---|---|---|---|---|---|---|---|---|---|---|---|---|---|---|---|---|---|---|
| 2005 Mar 27 (?) - 2005 Aug 9 (?) | Evidence from Observations: Reported | |||||||||||||||||||||||||||||||||
|
List of 5 Events for Episode 1
|
||||||||||||||||||||||||||||||||||
2004 Apr 12 - 2004 Apr 14 Confirmed Eruption (Explosive / Effusive) VEI: 2
| Episode 1 | Eruption (Explosive / Effusive) | ||||||||||||||||||||||||
|---|---|---|---|---|---|---|---|---|---|---|---|---|---|---|---|---|---|---|---|---|---|---|---|---|
| 2004 Apr 12 - 2004 Apr 14 | Evidence from Observations: Reported | |||||||||||||||||||||||
|
List of 3 Events for Episode 1
|
||||||||||||||||||||||||
2003 Apr 14 (?) - 2003 Oct 10 Confirmed Eruption (Explosive / Effusive) VEI: 2
| Episode 1 | Eruption (Explosive / Effusive) | |||||||||||||||||||||||||||||
|---|---|---|---|---|---|---|---|---|---|---|---|---|---|---|---|---|---|---|---|---|---|---|---|---|---|---|---|---|---|
| 2003 Apr 14 (?) - 2003 Oct 10 | Evidence from Observations: Reported | ||||||||||||||||||||||||||||
|
List of 4 Events for Episode 1
|
|||||||||||||||||||||||||||||
2002 Aug 22 (?) - 2002 Nov 3 Confirmed Eruption (Explosive / Effusive) VEI: 2
| Episode 1 | Eruption (Explosive / Effusive) | |||||||||||||||||||||||||||||
|---|---|---|---|---|---|---|---|---|---|---|---|---|---|---|---|---|---|---|---|---|---|---|---|---|---|---|---|---|---|
| 2002 Aug 22 (?) - 2002 Nov 3 | Evidence from Observations: Reported | ||||||||||||||||||||||||||||
|
List of 4 Events for Episode 1
|
|||||||||||||||||||||||||||||
2001 Aug 28 - 2001 Aug 28 Confirmed Eruption (Explosive / Effusive) VEI: 2
| Episode 1 | Eruption (Explosive / Effusive) | ||||||||||||||||||||||||
|---|---|---|---|---|---|---|---|---|---|---|---|---|---|---|---|---|---|---|---|---|---|---|---|---|
| 2001 Aug 28 - 2001 Aug 28 | Evidence from Observations: Reported | |||||||||||||||||||||||
|
List of 3 Events for Episode 1
|
||||||||||||||||||||||||
2001 Jan 16 (?) - 2001 May 3 Confirmed Eruption (Explosive / Effusive) VEI: 3 (?)
| Episode 1 | Eruption (Explosive / Effusive) | Summit and NNE flank | |||||||||||||||||||||||||||||||||||||||||||||||||||||||||||||||
|---|---|---|---|---|---|---|---|---|---|---|---|---|---|---|---|---|---|---|---|---|---|---|---|---|---|---|---|---|---|---|---|---|---|---|---|---|---|---|---|---|---|---|---|---|---|---|---|---|---|---|---|---|---|---|---|---|---|---|---|---|---|---|---|---|
| 2001 Jan 16 (?) - 2001 May 3 | Evidence from Observations: Reported | |||||||||||||||||||||||||||||||||||||||||||||||||||||||||||||||
|
List of 11 Events for Episode 1 at Summit and NNE flank
|
||||||||||||||||||||||||||||||||||||||||||||||||||||||||||||||||
2000 Sep 28 - 2000 Nov 1 Confirmed Eruption (Explosive / Effusive) VEI: 4
| Episode 1 | Eruption (Explosive / Effusive) | ||||||||||||||||||||||||||||||||||||||||||||||||||||||||||||||||||||||||||
|---|---|---|---|---|---|---|---|---|---|---|---|---|---|---|---|---|---|---|---|---|---|---|---|---|---|---|---|---|---|---|---|---|---|---|---|---|---|---|---|---|---|---|---|---|---|---|---|---|---|---|---|---|---|---|---|---|---|---|---|---|---|---|---|---|---|---|---|---|---|---|---|---|---|---|
| 2000 Sep 28 - 2000 Nov 1 | Evidence from Observations: Reported | |||||||||||||||||||||||||||||||||||||||||||||||||||||||||||||||||||||||||
|
List of 13 Events for Episode 1
|
||||||||||||||||||||||||||||||||||||||||||||||||||||||||||||||||||||||||||
1999 Oct 20 - 1999 Oct 20 Confirmed Eruption (Explosive / Effusive) VEI: 1
| Episode 1 | Eruption (Explosive / Effusive) | |||||||||||||||||||||||||||||
|---|---|---|---|---|---|---|---|---|---|---|---|---|---|---|---|---|---|---|---|---|---|---|---|---|---|---|---|---|---|
| 1999 Oct 20 - 1999 Oct 20 | Evidence from Observations: Reported | ||||||||||||||||||||||||||||
|
List of 4 Events for Episode 1
|
|||||||||||||||||||||||||||||
1994 Apr 19 (?) - 1994 Jun 16 ± 15 days Confirmed Eruption (Explosive / Effusive) VEI: 1
| Episode 1 | Eruption (Explosive / Effusive) | |||||||||||||||||||||||||||||||||||||||
|---|---|---|---|---|---|---|---|---|---|---|---|---|---|---|---|---|---|---|---|---|---|---|---|---|---|---|---|---|---|---|---|---|---|---|---|---|---|---|---|
| 1994 Apr 19 (?) - 1994 Jun 16 ± 15 days | Evidence from Observations: Reported | ||||||||||||||||||||||||||||||||||||||
|
List of 6 Events for Episode 1
|
|||||||||||||||||||||||||||||||||||||||
1993 Jan 12 - 1993 Jan 31 (?) Confirmed Eruption (Explosive / Effusive) VEI: 2
| Episode 1 | Eruption (Explosive / Effusive) | |||||||||||||||||||||||||||||||||||||||||||||||||
|---|---|---|---|---|---|---|---|---|---|---|---|---|---|---|---|---|---|---|---|---|---|---|---|---|---|---|---|---|---|---|---|---|---|---|---|---|---|---|---|---|---|---|---|---|---|---|---|---|---|
| 1993 Jan 12 - 1993 Jan 31 (?) | Evidence from Observations: Reported | ||||||||||||||||||||||||||||||||||||||||||||||||
|
List of 8 Events for Episode 1
|
|||||||||||||||||||||||||||||||||||||||||||||||||
1989 Jan 1 - 1989 Dec 16 (?) ± 15 days Confirmed Eruption (Explosive / Effusive) VEI: 2
| Episode 1 | Eruption (Explosive / Effusive) | |||||||||||||||||||||||||||||||||||||||||||||||||
|---|---|---|---|---|---|---|---|---|---|---|---|---|---|---|---|---|---|---|---|---|---|---|---|---|---|---|---|---|---|---|---|---|---|---|---|---|---|---|---|---|---|---|---|---|---|---|---|---|---|
| 1989 Jan 1 - 1989 Dec 16 (?) ± 15 days | Evidence from Observations: Reported | ||||||||||||||||||||||||||||||||||||||||||||||||
|
List of 8 Events for Episode 1
|
|||||||||||||||||||||||||||||||||||||||||||||||||
1985 Nov 17 - 1985 Nov 22 Confirmed Eruption (Explosive / Effusive) VEI: 3
| Episode 1 | Eruption (Explosive / Effusive) | ||||||||||||||||||||||||||||||||||||||||||||||||||||||
|---|---|---|---|---|---|---|---|---|---|---|---|---|---|---|---|---|---|---|---|---|---|---|---|---|---|---|---|---|---|---|---|---|---|---|---|---|---|---|---|---|---|---|---|---|---|---|---|---|---|---|---|---|---|---|
| 1985 Nov 17 - 1985 Nov 22 | Evidence from Observations: Reported | |||||||||||||||||||||||||||||||||||||||||||||||||||||
|
List of 9 Events for Episode 1
|
||||||||||||||||||||||||||||||||||||||||||||||||||||||
1984 Dec 30 - 1985 Jan 27 Confirmed Eruption (Explosive / Effusive) VEI: 1
| Episode 1 | Eruption (Explosive / Effusive) | ||||||||||||||||||||||||||||||||||||||||||||||||||||||
|---|---|---|---|---|---|---|---|---|---|---|---|---|---|---|---|---|---|---|---|---|---|---|---|---|---|---|---|---|---|---|---|---|---|---|---|---|---|---|---|---|---|---|---|---|---|---|---|---|---|---|---|---|---|---|
| 1984 Dec 30 - 1985 Jan 27 | Evidence from Observations: Reported | |||||||||||||||||||||||||||||||||||||||||||||||||||||
|
List of 9 Events for Episode 1
|
||||||||||||||||||||||||||||||||||||||||||||||||||||||
1984 Aug 23 - 1984 Sep 11 Confirmed Eruption (Explosive / Effusive) VEI: 1
| Episode 1 | Eruption (Explosive / Effusive) | |||||||||||||||||||||||||||||||||||||||
|---|---|---|---|---|---|---|---|---|---|---|---|---|---|---|---|---|---|---|---|---|---|---|---|---|---|---|---|---|---|---|---|---|---|---|---|---|---|---|---|
| 1984 Aug 23 - 1984 Sep 11 | Evidence from Observations: Reported | ||||||||||||||||||||||||||||||||||||||
|
List of 6 Events for Episode 1
|
|||||||||||||||||||||||||||||||||||||||
1983 Nov 6 - 1984 Mar 13 Confirmed Eruption (Explosive / Effusive) VEI: 1
| Episode 1 | Eruption (Explosive / Effusive) | |||||||||||||||||||||||||||||||||||||||
|---|---|---|---|---|---|---|---|---|---|---|---|---|---|---|---|---|---|---|---|---|---|---|---|---|---|---|---|---|---|---|---|---|---|---|---|---|---|---|---|
| 1983 Nov 6 - 1984 Mar 13 | Evidence from Observations: Reported | ||||||||||||||||||||||||||||||||||||||
|
List of 6 Events for Episode 1
|
|||||||||||||||||||||||||||||||||||||||
1980 Oct 6 - 1980 Oct 7 Confirmed Eruption (Explosive / Effusive) VEI: 3
| Episode 1 | Eruption (Explosive / Effusive) | ||||||||||||||||||||||||||||||||||||||||||||||||||||||
|---|---|---|---|---|---|---|---|---|---|---|---|---|---|---|---|---|---|---|---|---|---|---|---|---|---|---|---|---|---|---|---|---|---|---|---|---|---|---|---|---|---|---|---|---|---|---|---|---|---|---|---|---|---|---|
| 1980 Oct 6 - 1980 Oct 7 | Evidence from Observations: Reported | |||||||||||||||||||||||||||||||||||||||||||||||||||||
|
List of 9 Events for Episode 1
|
||||||||||||||||||||||||||||||||||||||||||||||||||||||
1978 May 7 - 1978 May 14 Confirmed Eruption (Explosive / Effusive) VEI: 3
| Episode 1 | Eruption (Explosive / Effusive) | Summit, lower east flank | ||||||||||||||||||||||||||||||||||||||||||||||||||||||||||||||||||||
|---|---|---|---|---|---|---|---|---|---|---|---|---|---|---|---|---|---|---|---|---|---|---|---|---|---|---|---|---|---|---|---|---|---|---|---|---|---|---|---|---|---|---|---|---|---|---|---|---|---|---|---|---|---|---|---|---|---|---|---|---|---|---|---|---|---|---|---|---|---|
| 1978 May 7 - 1978 May 14 | Evidence from Observations: Reported | ||||||||||||||||||||||||||||||||||||||||||||||||||||||||||||||||||||
|
List of 12 Events for Episode 1 at Summit, lower east flank
|
|||||||||||||||||||||||||||||||||||||||||||||||||||||||||||||||||||||
1973 Oct 4 - 1973 Oct 19 Confirmed Eruption (Explosive / Effusive) VEI: 2
| Episode 1 | Eruption (Explosive / Effusive) | ||||||||||||||||||||||||||||||||||||||||||||||||||||||
|---|---|---|---|---|---|---|---|---|---|---|---|---|---|---|---|---|---|---|---|---|---|---|---|---|---|---|---|---|---|---|---|---|---|---|---|---|---|---|---|---|---|---|---|---|---|---|---|---|---|---|---|---|---|---|
| 1973 Oct 4 - 1973 Oct 19 | Evidence from Observations: Reported | |||||||||||||||||||||||||||||||||||||||||||||||||||||
|
List of 9 Events for Episode 1
|
||||||||||||||||||||||||||||||||||||||||||||||||||||||
1970 Jan 15 - 1970 Feb 11 Confirmed Eruption (Explosive / Effusive) VEI: 3
| Episode 1 | Eruption (Explosive / Effusive) | |||||||||||||||||||||||||||||||||||||||||||||||||||||||||||||||||||||
|---|---|---|---|---|---|---|---|---|---|---|---|---|---|---|---|---|---|---|---|---|---|---|---|---|---|---|---|---|---|---|---|---|---|---|---|---|---|---|---|---|---|---|---|---|---|---|---|---|---|---|---|---|---|---|---|---|---|---|---|---|---|---|---|---|---|---|---|---|---|
| 1970 Jan 15 - 1970 Feb 11 | Evidence from Observations: Reported | ||||||||||||||||||||||||||||||||||||||||||||||||||||||||||||||||||||
|
List of 12 Events for Episode 1
|
|||||||||||||||||||||||||||||||||||||||||||||||||||||||||||||||||||||
1967 Jan 22 - 1967 Dec 28 Confirmed Eruption (Explosive / Effusive) VEI: 2
| Episode 1 | Eruption (Explosive / Effusive) | ||||||||||||||||||||||||||||||||||||||||||||
|---|---|---|---|---|---|---|---|---|---|---|---|---|---|---|---|---|---|---|---|---|---|---|---|---|---|---|---|---|---|---|---|---|---|---|---|---|---|---|---|---|---|---|---|---|
| 1967 Jan 22 - 1967 Dec 28 | Evidence from Observations: Reported | |||||||||||||||||||||||||||||||||||||||||||
|
List of 7 Events for Episode 1
|
||||||||||||||||||||||||||||||||||||||||||||
1963 Mar 17 - 1963 May 2 (?) Confirmed Eruption (Explosive / Effusive) VEI: 2
| Episode 1 | Eruption (Explosive / Effusive) | |||||||||||||||||||||||||||||
|---|---|---|---|---|---|---|---|---|---|---|---|---|---|---|---|---|---|---|---|---|---|---|---|---|---|---|---|---|---|
| 1963 Mar 17 - 1963 May 2 (?) | Evidence from Observations: Reported | ||||||||||||||||||||||||||||
|
List of 4 Events for Episode 1
|
|||||||||||||||||||||||||||||
1960 Jul 29 ± 3 days - 1962 Nov 16 ± 15 days Confirmed Eruption (Explosive / Effusive) VEI: 2
| Episode 1 | Eruption (Explosive / Effusive) | |||||||||||||||||||
|---|---|---|---|---|---|---|---|---|---|---|---|---|---|---|---|---|---|---|---|
| 1960 Jul 29 ± 3 days - 1962 Nov 16 ± 15 days | Evidence from Observations: Reported | ||||||||||||||||||
|
List of 2 Events for Episode 1
|
|||||||||||||||||||
1958 Feb 1 ± 60 days Confirmed Eruption (Explosive / Effusive) VEI: 2
| Episode 1 | Eruption (Explosive / Effusive) | ||||||||||||||||||||||||
|---|---|---|---|---|---|---|---|---|---|---|---|---|---|---|---|---|---|---|---|---|---|---|---|---|
| 1958 Feb 1 ± 60 days - Unknown | Evidence from Observations: Reported | |||||||||||||||||||||||
|
List of 3 Events for Episode 1
|
||||||||||||||||||||||||
[ 1951 Jul 2 ± 182 days ] Uncertain Eruption
| Episode 1 | Eruption (Explosive / Effusive) | ||||||||||||||
|---|---|---|---|---|---|---|---|---|---|---|---|---|---|---|
| 1951 Jul 2 ± 182 days - Unknown | Evidence from Unknown | |||||||||||||
|
List of 1 Events for Episode 1
|
||||||||||||||
1941 Jan 26 - 1941 Jan 26 Confirmed Eruption (Explosive / Effusive) VEI: 2
| Episode 1 | Eruption (Explosive / Effusive) | |||||||||||||||||||
|---|---|---|---|---|---|---|---|---|---|---|---|---|---|---|---|---|---|---|---|
| 1941 Jan 26 - 1941 Jan 26 | Evidence from Observations: Reported | ||||||||||||||||||
|
List of 2 Events for Episode 1
|
|||||||||||||||||||
[ 1937 May ] Uncertain Eruption
| Episode 1 | Eruption (Explosive / Effusive) | ||||||||||||||
|---|---|---|---|---|---|---|---|---|---|---|---|---|---|---|
| 1937 May - Unknown | Evidence from Unknown | |||||||||||||
|
List of 1 Events for Episode 1
|
||||||||||||||
1927 Jul - 1927 Sep 17 (on or after) Confirmed Eruption (Explosive / Effusive) VEI: 2
| Episode 1 | Eruption (Explosive / Effusive) | ||||||||||||||||||||||||
|---|---|---|---|---|---|---|---|---|---|---|---|---|---|---|---|---|---|---|---|---|---|---|---|---|
| 1927 Jul - 1927 Sep 17 (on or after) | Evidence from Observations: Reported | |||||||||||||||||||||||
|
List of 3 Events for Episode 1
|
||||||||||||||||||||||||
1919 May 28 (?) Confirmed Eruption (Explosive / Effusive) VEI: 2
| Episode 1 | Eruption (Explosive / Effusive) | |||||||||||||||||||
|---|---|---|---|---|---|---|---|---|---|---|---|---|---|---|---|---|---|---|---|
| 1919 May 28 (?) - Unknown | Evidence from Observations: Reported | ||||||||||||||||||
|
List of 2 Events for Episode 1
|
|||||||||||||||||||
1918 Jul 21 (?) Confirmed Eruption (Explosive / Effusive) VEI: 2
| Episode 1 | Eruption (Explosive / Effusive) | |||||||||||||||||||
|---|---|---|---|---|---|---|---|---|---|---|---|---|---|---|---|---|---|---|---|
| 1918 Jul 21 (?) - Unknown | Evidence from Observations: Reported | ||||||||||||||||||
|
List of 2 Events for Episode 1
|
|||||||||||||||||||
1915 Apr Confirmed Eruption (Explosive / Effusive) VEI: 3
| Episode 1 | Eruption (Explosive / Effusive) | ||||||||||||||||||||||||||||||||||
|---|---|---|---|---|---|---|---|---|---|---|---|---|---|---|---|---|---|---|---|---|---|---|---|---|---|---|---|---|---|---|---|---|---|---|
| 1915 Apr - Unknown | Evidence from Observations: Reported | |||||||||||||||||||||||||||||||||
|
List of 5 Events for Episode 1
|
||||||||||||||||||||||||||||||||||
[ 1912 ] Discredited Eruption
The original sources are unknown for statements that Ulawun was active in 1912. Possibly there was a misunderstanding of a report by Ludwig Couppé (published in 1912) that in November 1911 he had seen four active volcanoes (in a general sense), including Ulawun, when only Pago was actually in eruption (Cooke, 1981).
1898 Confirmed Eruption (Explosive / Effusive) VEI: 3
| Episode 1 | Eruption (Explosive / Effusive) | ||||||||||||||||||||||||
|---|---|---|---|---|---|---|---|---|---|---|---|---|---|---|---|---|---|---|---|---|---|---|---|---|
| 1898 - Unknown | Evidence from Observations: Reported | |||||||||||||||||||||||
|
List of 3 Events for Episode 1
|
||||||||||||||||||||||||
1878 Confirmed Eruption (Explosive / Effusive) VEI: 2
| Episode 1 | Eruption (Explosive / Effusive) | ||||||||||||||||||||||||
|---|---|---|---|---|---|---|---|---|---|---|---|---|---|---|---|---|---|---|---|---|---|---|---|---|
| 1878 - Unknown | Evidence from Observations: Reported | |||||||||||||||||||||||
|
List of 3 Events for Episode 1
|
||||||||||||||||||||||||
1700 Mar 11 Confirmed Eruption (Explosive / Effusive) VEI: 2
| Episode 1 | Eruption (Explosive / Effusive) | |||||||||||||||||||
|---|---|---|---|---|---|---|---|---|---|---|---|---|---|---|---|---|---|---|---|
| 1700 Mar 11 - Unknown | Evidence from Observations: Reported | ||||||||||||||||||
|
List of 2 Events for Episode 1
|
|||||||||||||||||||
This compilation of synonyms and subsidiary features may not be comprehensive. Features are organized into four major categories: Cones, Craters, Domes, and Thermal Features. Synonyms of features appear indented below the primary name. In some cases additional feature type, elevation, or location details are provided.
Synonyms |
| Ulawon | Uluwun | Father, the | Vatr |
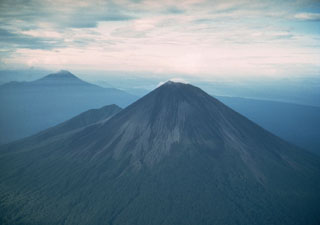 The symmetrical Ulawun is one of Papua New Guinea's most frequently active volcanoes. Ulawun and Bamus volcano (upper left) are the two highest volcanoes of the Bismarck Archipelago, and are known as the Father and South Son volcanoes, respectively. The upper 1,000 m of Ulawun is unvegetated. Historical eruptions date back to the beginning of the 18th century.
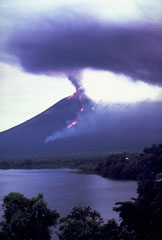 An ash plume erupts from the summit crater of Ulawun volcano on 21 November 1985. Smoke from burning vegetation rises from the front of an incandescent lava flow that is descending the NW flank. Strombolian eruptions had begun four days earlier and lava emission began the following day. The lava flow front bifurcated on the lower flanks of the volcano and the eastern lobe traveled slightly farther, eventually reaching 5.5 km from the summit.
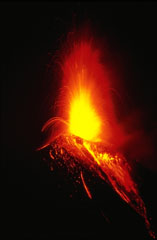 Strombolian eruptions the night of 20 November 1985 ejected incandescent bombs that fell back around the crater and tumbled down the upper flanks. Vigorous Strombolian eruptions resulted in the accumulation of large amounts of unstable material on the upper flanks that produced incandescent avalanches reaching out to 5 km from the crater. This photo was taken three days after the start of the week-long eruption. Lava flows also effused from the summit crater and traveled down the NW flank.
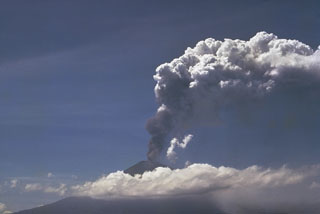 An explosive eruption from Ulawun began on 15 January 1970. On 22 January pyroclastic flows were produced, followed by periodic lava emission that produced a flow reaching 5 km SW of the crater. This photo shows an ash plume rising above the summit on 23 January.
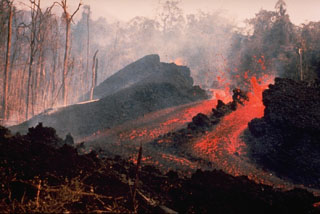 An E-flank fissure located 5 km from the summit produced an incandescent lava flow during 10-14 May 1978 that traveled 6 km to the Pandi River. Explosive activity took place from the summit crater of Ulawun over 7-13 May, accompanied by pyroclastic flows from a fissure high on the SE flank on 9 May. At least a dozen vents were active during this eruption.
 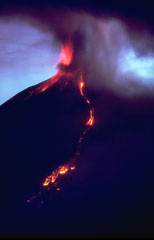 Incandescent lava flows descend the NW flank of Ulawun at dusk on 21 November 1985 as Strombolian activity occurs at the summit. Strombolian explosions began with the onset of the eruption on 17 November. Lava flows began descending the N slope the next day and eventually reached 5.5 km from the summit. On 20 November an ash plume reached an altitude of 7-8 km. The eruption ended the day after this photo was taken.
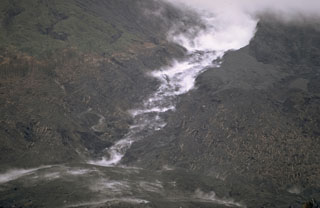 A white plume rises above a lava flow descending a channel on the NW flank of Ulawun volcano in February 1970. A pyroclastic flow descended the channel on 22 January to produce the deposits in the foreground. Pyroclastic surges at the margins of the hot avalanches knocked down rainforest trees in the direction facing away from the volcano as far as 5 km from the summit. The eruption lasted from 15 January to 11 February.
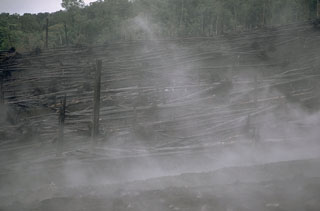 Steam rises from a pyroclastic flow deposit on the NW flank of Ulawun in February 1970. Rainforest trees were blown down facing away from the volcano by a high-velocity pyroclastic surge at the margins of the 22 January pyroclastic flow, which traveled 5 km from the summit. Pyroclastic flow velocities on the upper part of the volcano were estimated to exceed 100 km/hour.
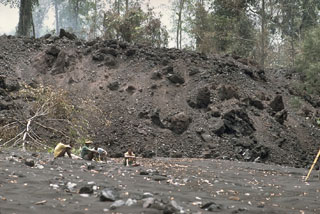 The toe of a blocky lava flow above members of a volcanological field team at Ulawun volcano in February 1970. The lava flow traveled 5 km from the summit, covering a broad area on the upper SW flank before being restricted to a narrow valley on the lower W flank. At its distal end, the flow front was 50 m wide and 8 m high and advanced slowly at a rate of 10 m/hour.
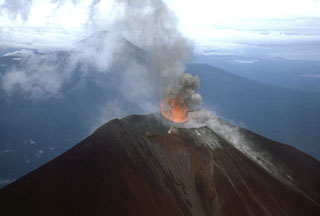 Photograph of Ulawun taken from a helicopter on 25 November 1985. This view from the NE shows the ejection of lava into the air above the vent during Strombolian activity. The other large stratovolcano in the background is Bamus.
 The following 51 samples associated with this volcano can be found in the Smithsonian's NMNH Department of Mineral Sciences collections, and may be availble for research (contact the Rock and Ore Collections Manager). Catalog number links will open a window with more information.
| Catalog Number | Sample Description | Lava Source | Collection Date |
|---|---|---|---|
| NMNH 112516-1 | Basalt | -- | -- |
| NMNH 112516-10 | Basaltic Volcanic Ash | -- | -- |
| NMNH 112516-11 | Basalt | -- | -- |
| NMNH 112516-12 | Basalt | -- | -- |
| NMNH 112516-13 | Basaltic Volcanic Ash | -- | -- |
| NMNH 112516-14 | Basaltic Volcanic Ash | -- | -- |
| NMNH 112516-15 | Basalt | -- | -- |
| NMNH 112516-16 | Basaltic Tephra | -- | -- |
| NMNH 112516-17 | Basalt | -- | -- |
| NMNH 112516-18 | Basalt | -- | -- |
| NMNH 112516-19 | Basalt | -- | -- |
| NMNH 112516-20 | Basalt | -- | -- |
| NMNH 112516-21 | Basalt | -- | -- |
| NMNH 112516-22 | Basalt | -- | -- |
| NMNH 112516-23 | Basalt | -- | -- |
| NMNH 112516-24 | Basalt | -- | -- |
| NMNH 112516-25 | Basalt | -- | -- |
| NMNH 112516-26 | Basalt | -- | -- |
| NMNH 112516-27 | Basalt | -- | -- |
| NMNH 112516-28 | Basalt | -- | -- |
| NMNH 112516-29 | Basalt | -- | -- |
| NMNH 112516-3 | Basaltic Volcanic Ash | -- | -- |
| NMNH 112516-30 | Basalt | -- | -- |
| NMNH 112516-31 | Basalt | -- | -- |
| NMNH 112516-32 | Basalt | -- | -- |
| NMNH 112516-33 | Basalt | -- | -- |
| NMNH 112516-34 | Basaltic Tephra | -- | -- |
| NMNH 112516-35 | Basalt | -- | -- |
| NMNH 112516-36 | Basalt | -- | -- |
| NMNH 112516-37 | Basaltic Tephra | -- | -- |
| NMNH 112516-38 | Basalt | -- | -- |
| NMNH 112516-39 | Basalt | -- | -- |
| NMNH 112516-41 | Basaltic Tephra | -- | -- |
| NMNH 112516-5 | Basaltic Volcanic Ash | -- | -- |
| NMNH 112516-6 | Basaltic Volcanic Ash | -- | -- |
| NMNH 112516-7 | Basaltic Volcanic Ash | -- | -- |
| NMNH 112516-8 | Basaltic Volcanic Ash | -- | -- |
| NMNH 112516-9 | Basaltic Volcanic Ash | -- | -- |
| NMNH 115435-1 | Basalt Volcanic Bomb | -- | -- |
| NMNH 115435-10 | Volcanic Ash | -- | -- |
| NMNH 115435-2 | Basalt Volcanic Bomb | -- | -- |
| NMNH 115435-3 | Basalt Volcanic Bomb | -- | -- |
| NMNH 115435-4 | Basalt Volcanic Bomb | -- | -- |
| NMNH 115435-5 | Basalt Volcanic Bomb | -- | -- |
| NMNH 115435-6 | Basalt Volcanic Bomb | -- | -- |
| NMNH 115435-7 | Basalt Volcanic Bomb | -- | -- |
| NMNH 115435-8 | Volcanic Ash | -- | -- |
| NMNH 115435-9 | Volcanic Ash | -- | -- |
| NMNH 116178 | Lava | -- | -- |
| NMNH 116179 | Volcanic Bomb | -- | -- |
| NMNH 116852-2 | Basalt | -- | -- |
| Copernicus Browser | The Copernicus Browser replaced the Sentinel Hub Playground browser in 2023, to provide access to Earth observation archives from the Copernicus Data Space Ecosystem, the main distribution platform for data from the EU Copernicus missions. |
| MIROVA | Middle InfraRed Observation of Volcanic Activity (MIROVA) is a near real time volcanic hot-spot detection system based on the analysis of MODIS (Moderate Resolution Imaging Spectroradiometer) data. In particular, MIROVA uses the Middle InfraRed Radiation (MIR), measured over target volcanoes, in order to detect, locate and measure the heat radiation sourced from volcanic activity. |
| MODVOLC Thermal Alerts | Using infrared satellite Moderate Resolution Imaging Spectroradiometer (MODIS) data, scientists at the Hawai'i Institute of Geophysics and Planetology, University of Hawai'i, developed an automated system called MODVOLC to map thermal hot-spots in near real time. For each MODIS image, the algorithm automatically scans each 1 km pixel within it to check for high-temperature hot-spots. When one is found the date, time, location, and intensity are recorded. MODIS looks at every square km of the Earth every 48 hours, once during the day and once during the night, and the presence of two MODIS sensors in space allows at least four hot-spot observations every two days. Each day updated global maps are compiled to display the locations of all hot spots detected in the previous 24 hours. There is a drop-down list with volcano names which allow users to 'zoom-in' and examine the distribution of hot-spots at a variety of spatial scales. |
|
WOVOdat
Single Volcano View Temporal Evolution of Unrest Side by Side Volcanoes |
WOVOdat is a database of volcanic unrest; instrumentally and visually recorded changes in seismicity, ground deformation, gas emission, and other parameters from their normal baselines. It is sponsored by the World Organization of Volcano Observatories (WOVO) and presently hosted at the Earth Observatory of Singapore.
GVMID Data on Volcano Monitoring Infrastructure The Global Volcano Monitoring Infrastructure Database GVMID, is aimed at documenting and improving capabilities of volcano monitoring from the ground and space. GVMID should provide a snapshot and baseline view of the techniques and instrumentation that are in place at various volcanoes, which can be use by volcano observatories as reference to setup new monitoring system or improving networks at a specific volcano. These data will allow identification of what monitoring gaps exist, which can be then targeted by remote sensing infrastructure and future instrument deployments. |
| Volcanic Hazard Maps | The IAVCEI Commission on Volcanic Hazards and Risk has a Volcanic Hazard Maps database designed to serve as a resource for hazard mappers (or other interested parties) to explore how common issues in hazard map development have been addressed at different volcanoes, in different countries, for different hazards, and for different intended audiences. In addition to the comprehensive, searchable Volcanic Hazard Maps Database, this website contains information about diversity of volcanic hazard maps, illustrated using examples from the database. This site is for educational purposes related to volcanic hazard maps. Hazard maps found on this website should not be used for emergency purposes. For the most recent, official hazard map for a particular volcano, please seek out the proper institutional authorities on the matter. |
| IRIS seismic stations/networks | Incorporated Research Institutions for Seismology (IRIS) Data Services map showing the location of seismic stations from all available networks (permanent or temporary) within a radius of 0.18° (about 20 km at mid-latitudes) from the given location of Ulawun. Users can customize a variety of filters and options in the left panel. Note that if there are no stations are known the map will default to show the entire world with a "No data matched request" error notice. |
| UNAVCO GPS/GNSS stations | Geodetic Data Services map from UNAVCO showing the location of GPS/GNSS stations from all available networks (permanent or temporary) within a radius of 20 km from the given location of Ulawun. Users can customize the data search based on station or network names, location, and time window. Requires Adobe Flash Player. |
| DECADE Data | The DECADE portal, still in the developmental stage, serves as an example of the proposed interoperability between The Smithsonian Institution's Global Volcanism Program, the Mapping Gas Emissions (MaGa) Database, and the EarthChem Geochemical Portal. The Deep Earth Carbon Degassing (DECADE) initiative seeks to use new and established technologies to determine accurate global fluxes of volcanic CO2 to the atmosphere, but installing CO2 monitoring networks on 20 of the world's 150 most actively degassing volcanoes. The group uses related laboratory-based studies (direct gas sampling and analysis, melt inclusions) to provide new data for direct degassing of deep earth carbon to the atmosphere. |
| Large Eruptions of Ulawun | Information about large Quaternary eruptions (VEI >= 4) is cataloged in the Large Magnitude Explosive Volcanic Eruptions (LaMEVE) database of the Volcano Global Risk Identification and Analysis Project (VOGRIPA). |
| EarthChem | EarthChem develops and maintains databases, software, and services that support the preservation, discovery, access and analysis of geochemical data, and facilitate their integration with the broad array of other available earth science parameters. EarthChem is operated by a joint team of disciplinary scientists, data scientists, data managers and information technology developers who are part of the NSF-funded data facility Integrated Earth Data Applications (IEDA). IEDA is a collaborative effort of EarthChem and the Marine Geoscience Data System (MGDS). |

