Report on Colima (Mexico) — June 2002
Bulletin of the Global Volcanism Network, vol. 27, no. 6 (June 2002)
Managing Editor: Richard Wunderman.
Colima (Mexico) Perilous summit visits during 2001 and 2002
Please cite this report as:
Global Volcanism Program, 2002. Report on Colima (Mexico) (Wunderman, R., ed.). Bulletin of the Global Volcanism Network, 27:6. Smithsonian Institution. https://doi.org/10.5479/si.GVP.BGVN200206-341040
Colima
Mexico
19.514°N, 103.62°W; summit elev. 3850 m
All times are local (unless otherwise noted)
The following report documents several climbs to the summit of Volcán de Colima, carried out in order to accurately measure the size of the growing lava dome, measure fumarole temperatures, and sample gases when possible. Strict safety precautions were followed and climbs were only undertaken during periods of low seismicity. Time is local (calibrated to RESCO seismographic clock). Coordinates and most calculations were obtained by GPS navigator (accuracies of 3-6 m indicated by the instrument) and GARMIN software.
Between 19 August 2001 and 29 June 2002, Nick Varley, Juan Carlos Gavilanes-Ruiz, Mitchell Ventura-Fishgold, Philippa Swannell, and Ruri Ursúa-Calvario performed four ascents to the growing dome, obtaining fresh lava samples, as well as ballistic-projectile samples ejected by the pre-extrusion explosion that occurred on 22 February 2001 (table 12). The lava sample of 18 February 2002 was obtained by Carlos Navarro-Ochoa (a block from a rockfall at the active lava front).
Table 12. The authors took fresh lava samples at Colima at these specified dates and locations. Latitude and longitude are given in degrees, minutes, and decimal minutes. Courtesy Universidad de Colima and Instituto de Geofísica.
| Date | Sample | Sampling site | Coordinates |
| 22 Feb 2001 | 1 | El Playon, 1.72 km to the NE of the crater (ballistic projectile). | 19°31.607'N, 103°36.645'W |
| 19 Aug 2001 | 2 | Growing dome (1 meter from a glowing fumarole at 808°C). | 19°30.773'N, 103°37.013'W |
| 26 Nov 2001 | 3 | Growing dome (andesitic spine). | 19°30.747'N, 103°36.983'W |
| 18 Feb 2002 | A | W face, ~1.2 km below the lava flow's active front. | [location unknown?] |
| 22 Feb 2002 | 4 | Growing dome (see figure 57). | 19°30.788'N, 103°37.021'W |
| 29 Jun 2002 | 5 | Growing dome SE part. | 19°30.755'N, 103°36.904'W |
During each ascent GPS and geometric measurements were taken in order to calculate the volume of the dome and the current rate of extrusion. Figures 53 and 54 show the preliminary calculations of these variations. The samples collected during the ascents were analyzed by Juan Carlos Mora-Chaparro.
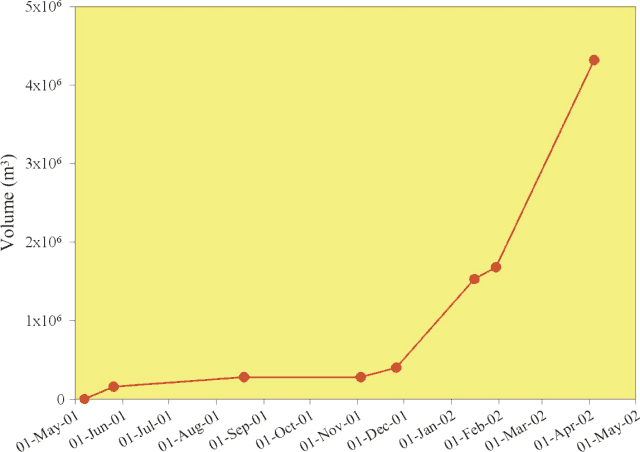 |
Figure 53. Increase in volume of lava dome and flows measured at Colima during May 2001-April 2002. Courtesy Universidad de Colima and Instituto de Geofísica. |
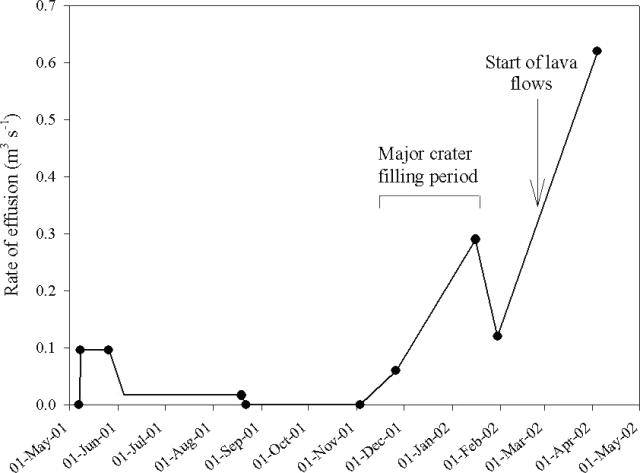 |
Figure 54. Variation in effusion rates seen at Colima from May 2001 to April 2002. Courtesy Universidad de Colima and Instituto de Geofísica. |
Ascent to the crater, 19 August 2001. On this occasion Varley and Gavilanes descended into the crater and circumnavigated the dome discovered on 26 May 2001. The volume of the dome had increased by ~77% since then, and a new lobe had appeared. The GPS tracks recorded around the dome revealed a maximum distance of 103 m in its N-S axis, and a maximum of 122 m in the E-W axis. A zone of incandescent fumaroles (with temperatures up to 877°C) was found on the NE slope of the dome and on the adjacent crater floor (figure 55). This high-temperature zone was located in the same position as the high-temperature group of fumaroles that existed above the previous dome and was monitored between 1995 and 1998. This suggests that the location of the main conduit has not changed since then. During the nearly 4-hour-long stay (0950-1400) on the crater rim and inside the crater, only two small rockfalls were heard.
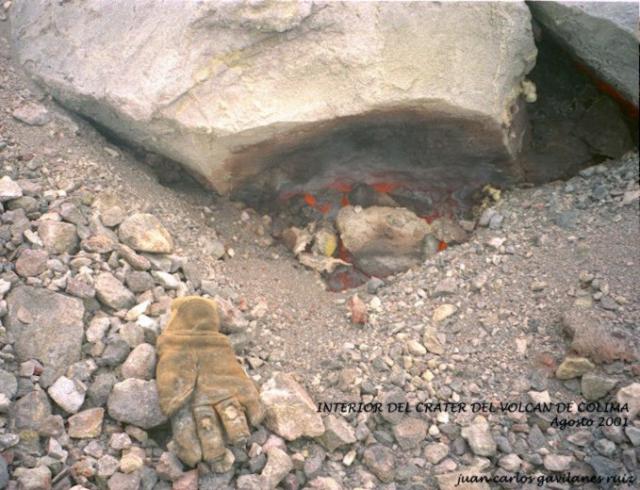 |
Figure 55. Incandescent fumarole on the E flank of the growing dome inside the major crater on 19 August 2001. A lava sample was obtained 1 m to the left. Photo taken by J.C. Gavilanes-Ruiz. Courtesy Universidad de Colima and Instituto de Geofísica. |
Samples of high-temperature fumarolic gases were taken during this ascent. Unlike previous samples from Colima, they were relatively uncontaminated by atmospheric air. The results of the analyses are shown in table 13. The temperature ranges recorded in the N crater-floor field and in the N and NE crater-rim field are shown in table 14.
Table 13. Volume of gases of high-temperature fumarolic gas collected on 19 August 2001 at Colima. R/Ra represents the isotopic ratio of helium normalized to the atmospheric ratio. (Gas volumes are in mol%). Courtesy Universidad de Colima and Instituto de Geofísica.
| H2O | H2 | CO2 | CO | Stot | HCl | HF | N2 | CH4 | He | R/Ra | He/Ne |
| 95.22 | 0.75 | 0.99 | 0.006 | 2.04 | 0.42 | 0.010 | 0.39 | 0 | 0.0001 | 6.2 | 48 |
Table 14. Temperature ranges of fumarole fields at Colima during 19 August 2001-26 November 2002. Courtesy Universidad de Colima and Instituto de Geofísica.
| Date | Fumarole field | Temperature range |
| 19 Aug 2001 | N and NE rim | 122-330°C |
| 26 Nov 2001 | N and NE rim | 100-295°C |
| 22 Feb 2002 | N and NE rim | 128-221°C |
| 29 Jun 2002 | N and NE rim | 162-272°C |
| 19 Aug 2001 | NE crater-floor | 590-877°C |
| 26 Nov 2002 | South side of the dome | 80-140°C |
Ascent to the crater and to the base of the active dome, 26 Nov 2001. During this excursion Varley and Ventura descended into the crater and measured temperatures of the new fumarole field on the S border of the growing dome (figure 56). Meanwhile, Gavilanes and Ursúa measured the fields located on the N and NE borders of the main crater and performed GPS measurements. Gas condensates were sampled from the NE fumarole field. Rock samples were taken from the andesitic spine (figure 57) first observed almost one month previously by personnel of Proteccion Civil of the State of Jalisco. The spine was located in the same area where the maximum temperatures were found on 19 August 2001. The mean frequency of rockfalls from the active dome caused by the lava effusion was once every 5 minutes, with larger events occurring approximately once every 30 minutes. Ranges of fumarole temperatures measured on the S side of the dome and in the NE field are shown in table 14.
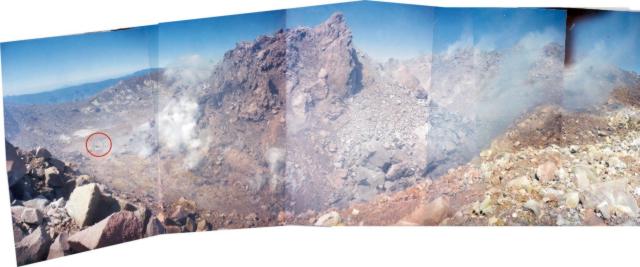 |
Figure 56. Composite photos giving a wide-angle view of the growing dome and collapsing spine from the E border of the main crater on 26 November 2001. The circle (left) locates Nick Varley and Mitch Ventura who were measuring fumarole temperatures in the S sector of the main crater. GPS data indicated that by this day the dome measured 98 m along its N-S axis. Photo taken by J.C. Gavilanes-Ruiz. Courtesy Universidad de Colima and Instituto de Geofísica. |
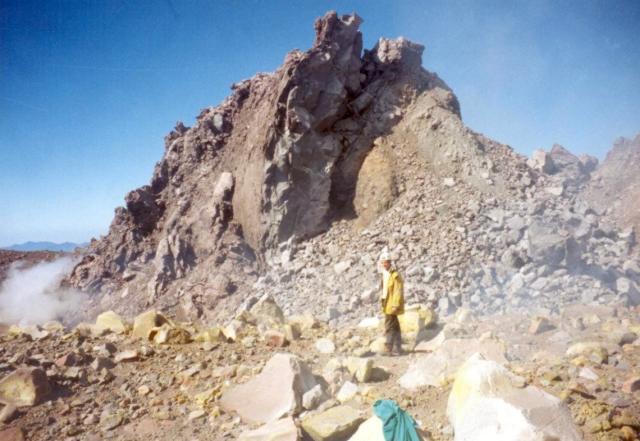 |
Figure 57. Photo taken on 26 November 2001 showing Ruri Ursúa standing on the E inner border of the main crater of Colima. The highest part of the growing dome can be seen in the background, the andesitic spine in the center of the photo (~ 10 m high in the visible part). Photo taken by J.C. Gavilanes-Ruiz. Courtesy Universidad de Colima and Instituto de Geofísica. |
Ascent to the dome, 22 Feb 2002. During this ascent several light ashfall-producing, small explosive events were observed (figure 58). One event expelled several bombs (up to 20 cm in diameter) to a height of ~20 m above the dome. The explosions appeared to originate from the central to W side of the dome. Small rockfalls were occurring approximately once every 15 to 20 minutes on the E side of the dome. Due to the potential of rockfalls, a temperature was only obtained from the fumarole field to the N. There had been an increase in the size of this field, which was located outside of the crater, high on the N flank. The temperature range is shown in table 14.
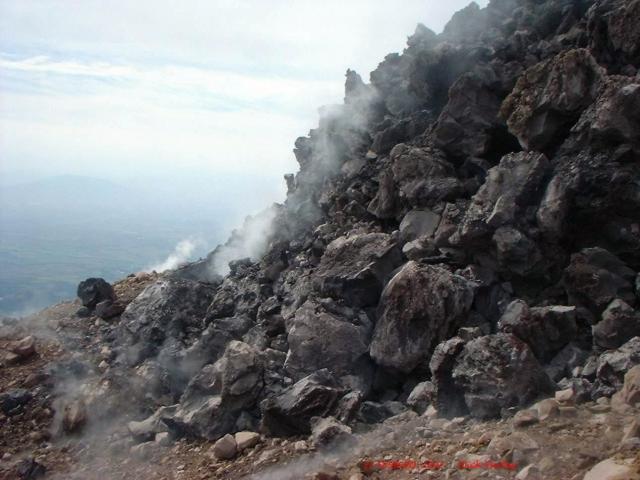 |
Figure 58. The ~10 m-high E border of the growing dome at Colima on 22 February 2002. The area covered by the outermost blocks is the remaining ~ 20 m-wide part of the 1987 crater. Photo taken by Nick Varley. Courtesy Universidad de Colima and Instituto de Geofísica. |
Ascent to the lava flow's front, 7 June 2002. On this ascent Varley and Gavilanes, climbing the S flank of the volcano, reached a point (19°30.218N, 103°37.392W) located at the same elevation (3,090 m) and approximately 75 m to the E of the front of the active lava flow emplaced on the upper part of the Cordobán Central ravine. The maximum length of the Cordobán Central 2002 lava flow was estimated to be 1,290 m on 7 June 2002. During this 6-hour-long ascent, the average frequency of rockfalls originating from both the lava flow front and the active dome was on the order of one rockfall every 10 minutes. No pyroclastic flows were observed.
Ascent to El Volcancito. On 11 June 2001 Juan Carlos Gavilanes and Alejandro Elizalde ascended to the dome formed in 1869-1872 called El Volcancito in order to repair the meteorological station (19°30.996 N, 103°36.511 W). El Volcancito is located on Colima's E summit (1,010 m horizontal distance, and N62°E of the center of the active dome of Volcán de Colima at 19°30.746 N, 103°37.020 W). Only one rockfall was observed on the E face while the team was 1,750 m from the dome, during the period from 1200-1545. In comparison to the 22 February 2001 observations performed from the same distance, no substantial changes in the size of the dome were apparent from El Volcancito (figure 59).
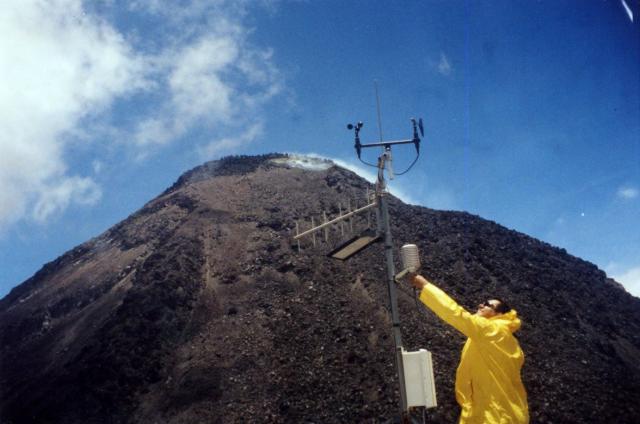 |
Figure 59. Alejandro Elizalde repairing the meteorological station located on El Volcancito dome. Volcancito sits ~1 km NE of Volcán de Colima's active summit dome, which can be seen capping the summit in the background. Photo taken by J.C. Gavilanes-Ruiz. Courtesy Universidad de Colima and Instituto de Geofísica. |
Ascent to the dome, 29 June 2002. Varley and Gavilanes remained on the N (figure 60), NE, and E borders of the active dome during 1147-1540. On the NE and N borders they measured angular heights and distances between the crater's lip and the upper part of the new dome borders. Only a small volume of lava blocks was observed to have fallen outside of the crater rim on the N border, extending only 4 m. No rockfalls were observed. The team tried to reach the center of the dome, but the complicated array of big scoriaceous and fragile new lava blocks, with abundant 3-to 7-m-deep void spaces between them (figure 61), impeded movement. They measured temperatures at the N fumarole field (table 14) and obtained a condensate gas sample. They also saw and/or heard several short-lived and high-pressure emissions of volcanic gas (table 15).
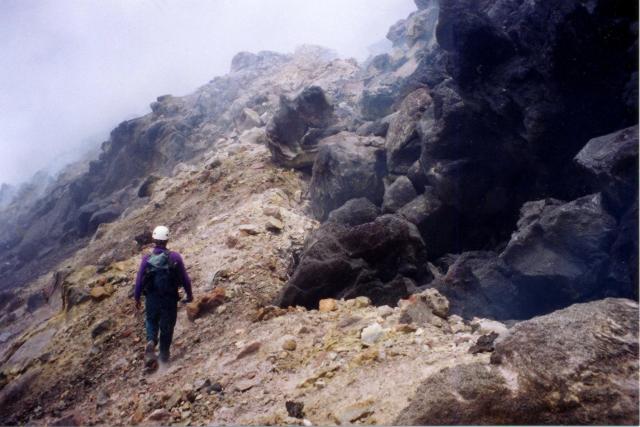 |
Figure 60. Photo on 29 June 2002 showing Nick Varley walking adjacent to the crater's N rim. The dark blocks of lava (on the right) represent loose debris that has fallen from the active dome. Photo taken by J.C. Gavilanes-Ruiz. Courtesy Universidad de Colima and Instituto de Geofísica. |
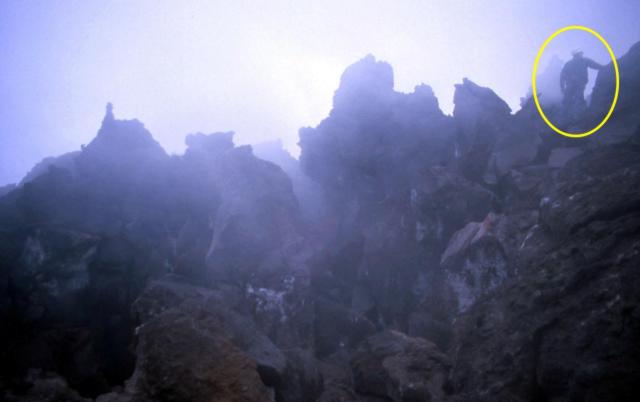 |
Figure 61. Photo on 29 June 2002 showing J.C. Gavilanes-Ruiz (enclosed by the circle) walking on the NE border of the active dome. Photo taken by Nick Varley. Courtesy Universidad de Colima and Instituto de Geofísica. |
Table 15. High-pressure emissions of volcanic gas at Colima on 29 June 2002. Courtesy Universidad de Colima and Instituto de Geofísica.
| Date | Time | Observations |
| 29 June 2002 | 1252 | Observed and heard at 40 m (white/bluish gas discharges ~30 m high) |
| 29 June 2002 | 1420 | Observed and heard at 50 m (white/bluish gas discharges ~30 m high) |
| 29 June 2002 | 1520 | Heard at 250 m |
| 29 June 2002 | 1603 | Heard at 250 m |
| 29 June 2002 | 1857 | Heard at 1,800 m |
Petrographical and chemical analyses were conducted on recent rock samples from Volcán de Colima at the Instituto de Geofísica, UNAM. The results were compared with similar analyses reported by Mora et al. (2002) from the 1998, 1999, and 2001 samples (table 16).
Table 16. Chemical composition of Colima lava. Numbers in parentheses correspond to the sample numbers in table 12. Fe2O3t = Fe total (except 1913). References: 1Mora et al. (2002), 2Luhr and Carmichael (1982). New data courtesy Universidad de Colima and Instituto de Geofísica.
| Sample/wt. % | 1818 | 1818 | 18182 | 19132 | 19981 | 19981 | 19991 | 19991 | 20001 | 2001 (1) | 2001 (2) | 2001 (3) | 2002 (A) | 2002 (4) | 2002 (5) |
| SiO2 | 58.71 | 57.70 | 58.52 | 57.57 | 60.44 | 61.00 | 60.59 | 59.83 | 60.77 | 59.53 | 59.81 | 59.60 | 60.67 | 59.10 | 59.70 |
| TiO2 | 0.66 | 0.79 | 0.83 | 0.79 | 0.62 | 0.55 | 0.64 | 0.63 | 0.61 | 0.63 | 0.64 | 0.64 | 0.61 | 0.64 | 0.64 |
| Al2O3 | 17.88 | 17.71 | 17.53 | 17.42 | 18.10 | 18.06 | 18.29 | 18.83 | 18.08 | 16.84 | 17.14 | 16.90 | 17.23 | 17.01 | 17.32 |
| Fe2O3t | 6.25 | 6.78 | 6.89 | 2.64 | 5.28 | 4.91 | 5.09 | 5.99 | 5.85 | 6.14 | 6.08 | 6.31 | 5.83 | 6.20 | 6.07 |
| FeO | -- | -- | -- | 3.74 | -- | -- | -- | -- | -- | -- | -- | -- | -- | -- | -- |
| MnO | 0.11 | 0.12 | 0.12 | 0.12 | 0.10 | 0.09 | 0.08 | 0.11 | 0.11 | 0.11 | 0.11 | 0.11 | 0.11 | 0.11 | 0.11 |
| MgO | 3.82 | 4.26 | 3.77 | 4.14 | 3.22 | 3.42 | 3.07 | 3.70 | 2.54 | 4.13 | 3.96 | 4.60 | 2.91 | 4.35 | 3.99 |
| CaO | 6.54 | 6.96 | 7.11 | 7.02 | 6.04 | 5.88 | 6.56 | 6.33 | 6.16 | 6.18 | 6.23 | 6.22 | 5.76 | 6.26 | 6.13 |
| Na2O | 4.50 | 4.49 | 4.46 | 4.40 | 4.69 | 4.56 | 4.53 | 4.68 | 4.47 | 4.53 | 4.56 | 4.43 | 4.72 | 4.51 | 4.59 |
| K2O | 1.22 | 1.32 | 1.23 | 1.16 | 1.35 | 1.37 | 1.12 | 1.31 | 1.28 | 1.30 | 1.27 | 1.29 | 1.36 | 1.29 | 1.38 |
| P2O5 | 0.19 | 0.24 | 0.20 | 0.19 | 0.13 | 0.12 | 0.18 | 0.20 | 0.13 | 0.20 | 0.20 | 0.19 | 0.23 | 0.19 | 0.19 |
| LOI | 0.19 | -0.03 | -- | 0.49 | 0.34 | 0.36 | 0.12 | 0.16 | 0.41 | -0.25 | -0.24 | -0.12 | -0.04 | 0.04 | 0.02 |
| Total | 100.07 | 100.34 | 101.66 | 99.68 | 100.31 | 100.32 | 100.27 | 100.77 | 100.91 | 99.34 | 99.76 | 100.17 | 99.39 | 99.70 | 100.14 |
Chemical analyses indicated that the new rocks registered a slight decrease in SiO2 and Al2O3 contents, and a slight increase in MgO with respect to the 1998 samples. Trace elements registered a decrease of Ba, and increases of Cu, Cr, and Ni (table 16).
Chemical analyses of rocks from 1818 to 2002 eruptions (Luhr, J.F. and Carmichael, I.S.E., 1982; Mora et al. 2002), show maximum variations of ~4 wt.% SiO2 (57 to 61 wt.%), and ~1.6 wt.% MgO (3.0 to 4.6 wt.%). The most mafic compositions were recorded in the products of the largest explosive eruptions (1818 and 1913). Notable disequilibrium textures observed in phenocrysts, as well as the shift to less evolved compositions in the new dome (2002 samples) with respect to the 1998 eruptive products may indicate an input of magma from a deeper chamber or an injection of new magma into the more shallow magma chamber. Therefore, we think that these detailed petrographic and chemical studies of the more recent eruptive products may provide valuable information for the monitoring of this volcano.
References. Luhr, J.F., and Carmichael, I.S.E., 1982, The Colima Volcanic Complex, Mexico: Part III, Ash and scoria-fall deposits from the upper slopes of Volcán Colima: Contrib. Mineral. Petrol., v. 80, p. 262-275.
Mora, J.C., Macías, J.L., Saucedo, R., Orlando A., Manetti, P., and Vaselli, O., 2002, Petrology of the 1998-2000 products of Volcán de Colima, Mexico: Accepted in the Special Issue of the Journal of Volcanology and Geothermal Research "Volcán de Colima, México, and its Activity in 1997-2000" (in press).
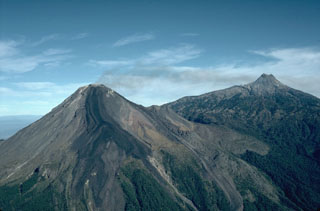
Geological Summary. The Colima complex is the most prominent volcanic center of the western Mexican Volcanic Belt. It consists of two southward-younging volcanoes, Nevado de Colima (the high point of the complex) on the north and the historically active Volcán de Colima at the south. A group of late-Pleistocene cinder cones is located on the floor of the Colima graben west and east of the complex. Volcán de Colima (also known as Volcán Fuego) is a youthful stratovolcano constructed within a 5-km-wide scarp, breached to the south, that has been the source of large debris avalanches. Major slope failures have occurred repeatedly from both the Nevado and Colima cones, producing thick debris-avalanche deposits on three sides of the complex. Frequent recorded eruptions date back to the 16th century. Occasional major explosive eruptions have destroyed the summit (most recently in 1913) and left a deep, steep-sided crater that was slowly refilled and then overtopped by lava dome growth.
Information Contacts: N. Varley, J. C. Gavilanes-Ruiz, Facultad de Ciencias and Centro Universitario de Investigaciones en Ciencias del Ambiente, Universidad de Colima; J.C. Mora, J.L. Macias, R. Castro, R. Arias, Instituto de Geofísica, UNAM.