On 13 October the Centro Universitario de Estudios Vulcanológicos (CUEV) - Universidad de Colima reported that during the previous week three lahars descended the Zarco (WSW), Montegrande (S), and La Arena drainages, triggered by Hurricane Lidia. In general, steam-and-gas emissions were low and rose from the NE part of the crater.
Source: Centro Universitario de Estudios Vulcanológicos (CUEV) - Universidad de Colima
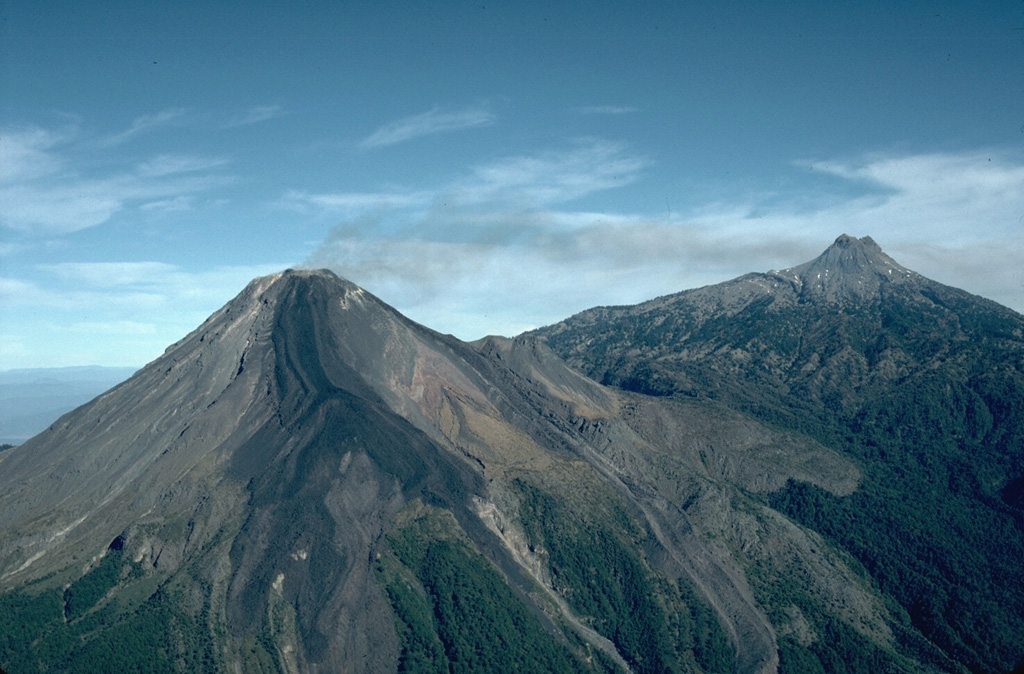
Renewed volcanism after two years of quiet; explosion on 11 May 2019
Frequent historical eruptions at Volcán de Colima date back to the 16th century and include explosive activity, lava flows, and large debris avalanches. The most recent eruptive episode began in January 2013 and continued through March 2017. Previous reports have covered activity involving ash plumes with extensive ashfall, lava flows, lahars, and pyroclastic flows (BGVN 41:01 and 42:08). In late April 2019, increased seismicity related to volcanic activity began again. This report covers activity through July 2019. The primary source of information was the Centro Universitario de Estudios e Investigaciones de Vulcanologia, Universidad de Colima (CUEIV-UdC).
On 11 May 2019, CUEIV-UdC reported an explosion that was recorded by several monitoring stations. A thermal camera located south of Colima captured thermal anomalies associated with the explosion as well as intermittent degassing, which mainly consisted of water vapor (figure 134). A report from the Unidad Estatal de Protección Civil de Colima (UEPCC), and seismic and infrasound network data from CUEIV-UdC, recorded about 60 high-frequency events, 16 landslides, and 14 low-magnitude explosions occurring on the NE side of the crater during 11-24 May. Drone imagery showed fumarolic activity occurring on the inner wall of this crater on 22 May (figure 135).
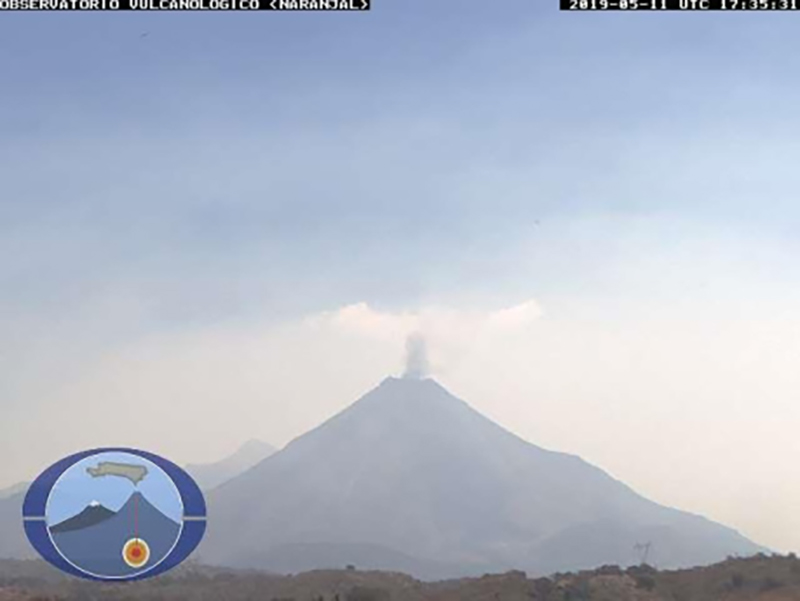 |
Figure 134. Gas emissions from Colima during the 11 May 2019 eruption as seen from the Naranjal station. Courtesy of CUEIV-UdC (Boletin Seminal de la Actividad del Volcan de Colima 17 mayo 2019 no 121). |
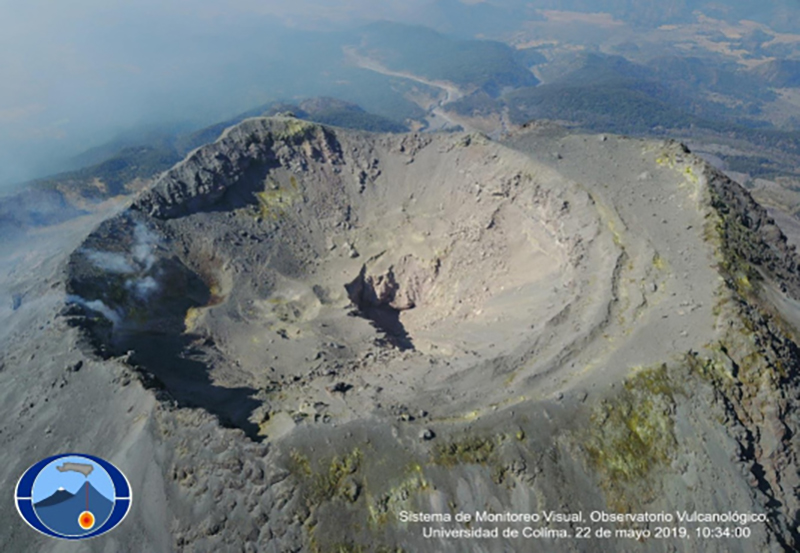 |
Figure 135. A drone photo showing fumarolic activity occurring within the NE wall of the crater at Colima on 22 May 2019. Courtesy of CUEIV-UdC (Boletin Seminal de la Actividad del Volcan de Colima 24 mayo 2019 no 122). |
Small explosions and gas-and-steam emissions continued intermittently through mid-July 2019 concentrated on the NE side of the crater. An overflight on 9 July 2019 revealed that subsidence from the consistent activity slightly increased the diameter of the vent; other areas within the crater also showed evidence of subsidence and some collapsed material on the outer W wall (figure 136). During the weeks of 19 and 26 July 2019, monitoring cameras and seismic data recorded eight lahars.
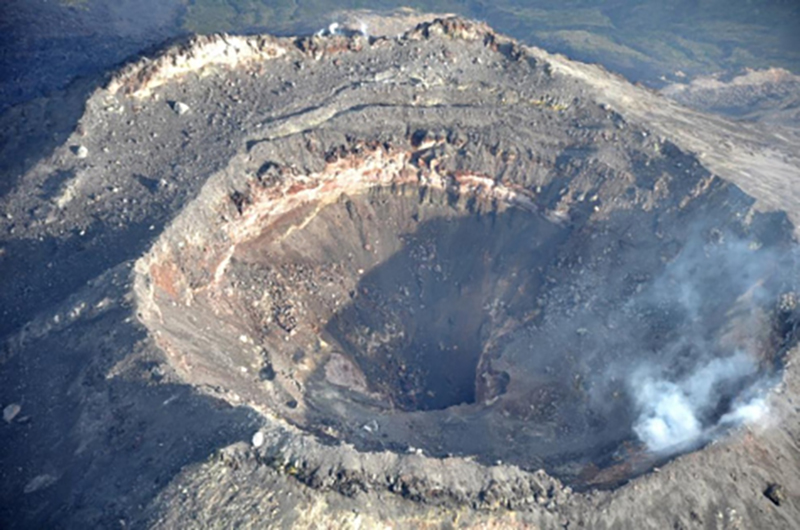 |
Figure 136. A drone photo of the crater at Colima on 8 July 2019 shows continuing fumarolic activity and evidence of a collapsed wall on the W exterior side. Courtesy of CUEIV-UdC (Boletin Seminal de la Actividad del Volcan de Colima 12 julio 2019 no 129). |
Information Contacts: Centro Universitario de Estudios e Investigaciones de Vulcanologia, Universidad de Colima (CUEIV-UdC), Colima, Col. 28045, Mexico; Centro Universitario de Estudios Vulcanologicos y Facultad de Ciencias de la Universidad de Colima, Avenida Universidad 333, Colima, Col. 28045, Mexico (URL: http://portal.ucol.mx/cueiv/); Unidad Estatal de Protección Civil, Colima, Roberto Esperón No. 1170 Col. de los Trabajadores, C.P. 28020, Mexico (URL: http://www.proteccioncivil.col.gob.mx/).
2023: October
2019: May
| June
| July
2017: January
| February
| March
| April
| May
| July
2016: January
| February
| March
| April
| May
| June
| July
| August
| September
| October
| November
| December
2015: January
| February
| March
| April
| May
| June
| July
| August
| September
| October
| November
| December
2014: January
| February
| March
| May
| November
| December
2013: January
| November
2011: January
2010: October
| November
2009: February
| March
| April
| May
| July
| October
| December
2008: February
| March
| April
| May
| June
| August
| October
| December
2007: March
| April
| May
| September
| October
| November
| December
2006: January
| February
| March
| July
| October
| November
| December
2005: January
| February
| March
| April
| May
| June
| July
| August
| September
| October
| November
| December
2004: January
| February
| March
| April
| May
| June
| July
| August
| September
| October
| November
| December
2003: January
| April
| May
| June
| July
| August
| September
| October
| November
| December
2002: January
| February
| March
| April
| May
| June
| October
2001: February
| May
| October
| November
| December
2000: November
On 13 October the Centro Universitario de Estudios Vulcanológicos (CUEV) - Universidad de Colima reported that during the previous week three lahars descended the Zarco (WSW), Montegrande (S), and La Arena drainages, triggered by Hurricane Lidia. In general, steam-and-gas emissions were low and rose from the NE part of the crater.
Source: Centro Universitario de Estudios Vulcanológicos (CUEV) - Universidad de Colima
Centro Universitario de Estudios e Investigaciones de Vulcanologia - Universidad de Colima reported that intermittent steam-and-gas emissions, mainly from the NE side of the crater, and two small explosions were recorded during 5-12 July. Five lahars descended the Montegrande ravine. An overflight on 9 July revealed that the diameter of the vent had slightly increased, likely caused by subsidence, and other areas of minor subsidence within the crater were noted. An area of collapsed material on the outer W wall was also identified. Temperatures inside the crater were 116 degrees Celsius, lower than the temperature of 250 degrees Celsius recorded in May. The temperatures in the fumarolic area decreased from 202 degrees Celsius in May to 169 degrees. A thermal camera located S of the volcano recorded thermal anomalies associated with fumarolic emissions. Weather conditions sometimes prevented observations of the crater.
Source: Centro Universitario de Estudios Vulcanológicos (CUEV) - Universidad de Colima
Centro Universitario de Estudios e Investigaciones de Vulcanologia - Universidad de Colima reported that intermittent steam-and-gas emissions, mainly from the NE side of the crater, and three small explosions were recorded during 29 June-5 July. A thermal camera located S of the volcano recorded thermal anomalies associated with emissions. Weather conditions sometimes prevented observations of the crater.
Source: Centro Universitario de Estudios Vulcanológicos (CUEV) - Universidad de Colima
Centro Universitario de Estudios e Investigaciones de Vulcanologia - Universidad de Colima reported that intermittent steam-and-gas emissions, mainly from the NE side of the crater, and small explosions continued to be recorded during 14-21 June. Weather conditions often prevented visual observations of the crater.
Source: Centro Universitario de Estudios Vulcanológicos (CUEV) - Universidad de Colima
Centro Universitario de Estudios e Investigaciones de Vulcanologia - Universidad de Colima reported that intermittent steam-and-gas emissions mainly from the NE side of the crater and small explosions continued to be recorded during 8-14 June. Weather conditions often prevented visual observations of the crater.
Source: Centro Universitario de Estudios Vulcanológicos (CUEV) - Universidad de Colima
Centro Universitario de Estudios e Investigaciones de Vulcanologia - Universidad de Colima reported that small explosions and intermittent steam-and-gas emissions, originating mainly from the NE side of the crater, continued to be recorded during 1-7 June. Weather conditions often prevented visual observations of the crater.
Source: Centro Universitario de Estudios Vulcanológicos (CUEV) - Universidad de Colima
Centro Universitario de Estudios e Investigaciones de Vulcanologia - Universidad de Colima reported that during 25-31 May small explosions and intermittent steam-and-gas emissions mainly from the NE side of the crater continued to be recorded. During overflights conducted during 23-24 May scientists observed that the new feature (a crack or cavity) reported the previous week had become a hole due to the combination of excavation due to explosions and probable subsidence. The maximum temperature recorded with a portable thermal camera was 252 degrees Celsius, an increase of 80 degrees since recorded on 1 May.
Source: Centro Universitario de Estudios Vulcanológicos (CUEV) - Universidad de Colima
Centro Universitario de Estudios e Investigaciones de Vulcanologia - Universidad de Colima reported that 51 low-magnitude explosions mainly from the NE part of Colima’s crater were recorded by the seismic and infrasound network during 11-24 May. Emissions from the explosions consisted mainly of water vapor and gas, and were the first surficial manifestations of activity since seismicity increased in the past few weeks. Footage from five drone overflights conducted on 22 May showed fumarolic activity on the inner wall of the NE part of the crater and a new small explosion crater near the center of the main crater.
Source: Centro Universitario de Estudios Vulcanológicos (CUEV) - Universidad de Colima
Centro Universitario de Estudios e Investigaciones de Vulcanologia - Universidad de Colima reported increased seismicity at Colima during 20-26 April characterized by a considerable increase in the number of high-frequency and volcano-tectonic events. On 26 April a consensus was reached to raise the Alert Level to Yellow (the second lowest level on a four-color scale) and extend the exclusion zone to a 8-km radius during a meeting of the Coordinación Nacional de Protección Civil (CNPC), the Unidad Estatal de Protección Civil Colima (UEPC), the Unidad Estatal de Protección Civil y Bomberos de Jalisco (UEPCBJ), the Universidad de Colima (UdeC), and la Universidad de Guadalajara (UdeG). Seismicity continued to be elevated through 3 May. The largest events (M 2.4-3) were located 0.5-3 km deep in the N and NE parts of the volcano.
Source: Centro Universitario de Estudios Vulcanológicos (CUEV) - Universidad de Colima
On 2 June the Centro Universitario de Estudios e Investigaciones de Vulcanologia - Universidad de Colima reported that during the previous week seismic data revealed 45 high-frequency events, 12 long-period events, 1.2 hours of tremor, 3 landslides, and one low-intensity explosion. Two lahars descended the La Lumbre ravine (SW) and three descended the Montegrande ravine (SSE); both ravines are in Colima state.
Source: Centro Universitario de Estudios Vulcanológicos (CUEV) - Universidad de Colima
On 2 June the Centro Universitario de Estudios e Investigaciones de Vulcanologia - Universidad de Colima reported that during the previous week seismic data revealed 21 high-frequency events, 14 long-period events, 1.7 hours of tremor, 12 landslides, and zero explosions. During 25-26 May sulfur dioxide emissions were low at 35-51 tons per day, close to the detectable limits.
Source: Centro Universitario de Estudios Vulcanológicos (CUEV) - Universidad de Colima
On 26 May the Centro Universitario de Estudios e Investigaciones de Vulcanologia - Universidad de Colima reported that during the previous week seismic data revealed 36 high-frequency events, 20 long-period events, 2.6 hours of tremor, 12 landslides, and three low-intensity explosions. On 23 May sulfur dioxide emissions were below detectable limits (8.6 tons/day). A short-lived, low-amplitude episode of tremor was detected on 24 May.
Source: Centro Universitario de Estudios Vulcanológicos (CUEV) - Universidad de Colima
On 19 May the Centro Universitario de Estudios e Investigaciones de Vulcanologia - Universidad de Colima reported that during the previous week seismic data revealed 25 high-frequency events, 15 long-period events, 2.2 hours of tremor, 12 landslides, and three low-intensity explosions. During 15-16 May sulfur dioxide emissions were below detectable limits (8.6 t/d).
Source: Centro Universitario de Estudios Vulcanológicos (CUEV) - Universidad de Colima
On 12 May the Centro Universitario de Estudios e Investigaciones de Vulcanologia - Universidad de Colima reported that during the previous week seismic data revealed 26 high-frequency events, 21 long-period events, 2.5 hours of tremor, 12 landslides, and three low-intensity explosions.
Source: Centro Universitario de Estudios Vulcanológicos (CUEV) - Universidad de Colima
On 28 April the Centro Universitario de Estudios e Investigaciones de Vulcanologia - Universidad de Colima reported that during the previous week seismic data revealed 34 high-frequency events, 26 long-period events, 2.5 hours of tremor, 8 landslides, and one low-intensity explosion. During fieldwork on the N part of the volcano, scientists found deposits of ballistics within 1.9 km of the crater. A higher density of deposits was found to the NNE, and deposits from pyroclastic flows were noted as far as 1.5 and 1.7 km N of the crater.
Source: Centro Universitario de Estudios Vulcanológicos (CUEV) - Universidad de Colima
On 14 April the Centro Universitario de Estudios e Investigaciones de Vulcanologia - Universidad de Colima reported that during the previous week seismic data revealed 48 high-frequency events, 30 long-period events, 3.3 hours of tremor, 10 landslides, and two explosions.
Source: Centro Universitario de Estudios Vulcanológicos (CUEV) - Universidad de Colima
On 7 April the Centro Universitario de Estudios e Investigaciones de Vulcanologia - Universidad de Colima reported that during the previous week the seismic data revealed 38 high-frequency events, 23 long-period events, 2.4 hours of tremor, 18 landslides, and two low-intensity explosions. The sulfur dioxide flux was as high as 640 tons/day.
Source: Centro Universitario de Estudios Vulcanológicos (CUEV) - Universidad de Colima
On 31 March the Centro Universitario de Estudios e Investigaciones de Vulcanologia - Universidad de Colima reported that during the previous week the seismic data revealed 45 high-frequency events, 33 long-period events, 2.5 hours of tremor, 11 landslides, and two low-intensity explosions. The sulfur dioxide flux was 360 tons/day, an increase compared to the week before.
Source: Centro Universitario de Estudios Vulcanológicos (CUEV) - Universidad de Colima
On 24 March the Centro Universitario de Estudios e Investigaciones de Vulcanologia - Universidad de Colima reported that during the previous week the seismic data revealed 70 high-frequency events, 25 long-period events, over one hour of tremor, four landslides, and four low-intensity explosions. The sulfur dioxide flux was 11-74 tons/day, reflecting low volcanic activity.
Source: Centro Universitario de Estudios Vulcanológicos (CUEV) - Universidad de Colima
Based on Centro Universitario de Estudios e Investigaciones de Vulcanologia - Universidad de Colima observations, the Unidad Estatal de Protección Civil de Colima reported that during 10-16 March there were three low-intensity explosions at Colima. A slight decrease of sulfur dioxide was detected. During an overflight scientists observed gas emissions from small explosion craters on the floor of the main crater; there was no evidence of a new lava dome. The report noted that the public should not enter the 6-km-radius exclusion zone.
Source: Unidad Estatal de Protección Civil de Colima
Based on Centro Universitario de Estudios e Investigaciones de Vulcanologia - Universidad de Colima observations, the Unidad Estatal de Protección Civil de Colima reported that during 3-9 March there were six low-intensity explosions at Colima. At 1823 on 7 March an ash plume rose about 2 km above the crater and drifted SW. The report noted that the public should not enter the 8-km-radius exclusion zone.
Source: Unidad Estatal de Protección Civil de Colima
On 24 February the Centro Universitario de Estudios e Investigaciones de Vulcanologia - Universidad de Colima reported low-intensity explosions at Colima during the previous week. The internal crater remained about 250 m in diameter and 50-60 m deep; previous lava domes had been destroyed in late September and mid-November 2016. Scientists who visited the terminus of a 4.5-km-long pyroclastic flow that had been emplaced on 8 January observed that the flow was blocky with very little ash, and that the local vegetation had not been burnt, suggesting that the flow was low-temperature. The Unidad Estatal de Protección Civil de Colima noted that the public should not enter the 8-km-radius exclusion zone, and also stay away from ravines.
Sources: Centro Universitario de Estudios Vulcanológicos (CUEV) - Universidad de Colima; Unidad Estatal de Protección Civil de Colima
Based on Centro Universitario de Estudios e Investigaciones de Vulcanologia - Universidad de Colima observations, the Unidad Estatal de Protección Civil de Colima reported that during 10-16 February there were 10 low-intensity explosions at Colima. Gas emissions were at low-to-moderate levels. The report noted that the public should not enter the 8-km-radius exclusion zone.
Source: Unidad Estatal de Protección Civil de Colima
The Universidad de Colima reported that a large explosion at Colima was recorded at 1732 on 3 February, generating an ash plume that rose 6 km above the crater rim and drifted SSW. A small pyroclastic flow traveled down the E flank. The report stated that the internal crater is about 250 m in diameter and 50-60 m deep; previous lava domes had been destroyed in late September and mid-November 2016. On 9 February the sulfur dioxide gas flux was low (19 tons/day). Based on webcam and satellite images, the Washington VAAC reported that on 11 February an ash plume rose to an altitude of 4 km (13,000 ft) a.s.l. and drifted W. On 14 February an ash plume rose to an altitude of 5.2 km (17,000 ft) a.s.l. and drifted NE.
Sources: Washington Volcanic Ash Advisory Center (VAAC); Centro Universitario de Estudios Vulcanológicos (CUEV) - Universidad de Colima
The Washington VAAC reported that on 1 February an ash emission was recorded by the webcam rising from Colima. Weather clouds prevented satellite observations of the event. Based on webcam and satellite images, the Mexico City MWO, and model data, the VAAC noted that during 3-6 February ash plumes rose to altitudes of 5.2-7.6 km (17,000-25,000 ft) a.s.l. and drifted NW, W, SW, and S.
Source: Washington Volcanic Ash Advisory Center (VAAC)
Based on webcam and satellite images, the Mexico City MWO, and model data, the Washington VAAC reported that during 25-29 January ash plumes from Colima rose to altitudes of 4.7-7 km (17,000-26,000 ft) a.s.l. and drifted NE. Ash plumes were identified in satellite images at least 370 and 650 km NE of Colima on 25 and 27 January, respectively.
Source: Washington Volcanic Ash Advisory Center (VAAC)
The Unidad Estatal de Protección Civil de Colima reported that at 0027 on 18 January a moderate-to-large explosion at Colima ejected incandescent material as far as 2 km onto the W, SW, SE, and N flanks.
Based on webcam and satellite images, the Mexico City MWO, and pilot observations, the Washington VAAC reported that during 18-24 January ash plumes from Colima rose to altitudes of 4.1-6.7 km (15,000-25,000 ft) a.s.l. and drifted in multiple directions. On 19 January explosions were recorded by the webcam and noted by the Jalisco Civil protection agency; ashfall was also reported in Comala and Cuauhtémoc by the agency. A strong thermal anomaly was identified in satellite images. Remnant ash clouds were centered about 350 km SE on 20 January and about 185 km S on 22 January. A large ash plume rose to an altitude of 10.7 km (35,000 ft) a.s.l. on 23 January and drifted NE.
Sources: Unidad Estatal de Protección Civil de Colima; Washington Volcanic Ash Advisory Center (VAAC)
Based on webcam and satellite images, and the Mexico City MWO, the Washington VAAC reported that during 11-17 January ash plumes from Colima rose to altitudes of 4.1-6.4 km (15,000-24,000 ft) a.s.l. and drifted in multiple directions.
Source: Washington Volcanic Ash Advisory Center (VAAC)
Based on webcam and satellite images, the Mexico City MWO, and Colima Towers, the Washington VAAC reported that during 3-10 January ash plumes from Colima rose to altitudes of 4.7-6.7 km (17,000-25,000 ft) a.s.l. and drifted E, SE, S, and SW. The Unidad Estatal de Protección Civil de Colima reported that an explosion detected at 1602 on 7 January was slightly stronger than a moderate level, and that winds were drifting SSE.
Source: Washington Volcanic Ash Advisory Center (VAAC)
Based on webcam and satellite images, information from the Mexico City MWO, and wind data the Washington VAAC reported that during 28 December 2016-3 January 2017 ash plumes from Colima rose to altitudes of 4.6-7.6 km (15,000-25,000 ft) a.s.l. and drifted as far as 135 km in multiple directions.
Source: Washington Volcanic Ash Advisory Center (VAAC)
Based on information from the National Civil Protection coordinator, news articles reported that an explosion at Colima occurred at 0943 on 16 December, generating an ash plume that rose 2.3 km above the crater rim and drifted NNW. At 0807 on 17 December an explosion sent an ash plume 1 km above the crater that then drifted NE. Later that day at 2058 a strong explosion (the strongest registered within the past 16 months) ejected incandescent material onto the flanks and ash plumes as high as 2 km. Lava flows and rolling incandescent material traveled as far as 1.7 km down the flanks. Explosions on 18 December produced ash plumes that again rose as high as 2 km above the crater.
Sources: Informador; Informador; CBS News; Reuters
Based on webcam and satellite images, and information from the Mexico City MWO, the Washington VAAC reported that ash plumes from Colima rose to altitudes of 4.6-7.3 km (15,000-24,000 ft) a.s.l. during 7-11 December and drifted almost 170 km in multiple directions.
Source: Washington Volcanic Ash Advisory Center (VAAC)
Based on satellite, webcam, and wind data, the Washington VAAC reported that on 26 November an ash plume from Colima rose to an altitude of 4.9 km (16,000 ft) a.s.l. and drifted 75 km W. The next day a gas plume with possible ash content rose to an altitude of 5.5 (18,000 ft) a.s.l. and drifted almost 20 km N. On 28 November an ash plume rose to an altitude of 5.2 km (17,000 ft) a.s.l. and drifted 13 km NE.
Source: Washington Volcanic Ash Advisory Center (VAAC)
Based on satellite and webcam images, the Washington VAAC reported that on 4 November an ash plume from Colima rose to an altitude of 4.6 km (15,000 ft) a.s.l. and drifted over 30 km SW.
Source: Washington Volcanic Ash Advisory Center (VAAC)
Based on satellite images, the Washington VAAC reported that on 30 October an ash plume from Colima rose to an altitude of 4.3 km (14,000 ft) a.s.l. and drifted SW.
Source: Washington Volcanic Ash Advisory Center (VAAC)
Based on multiple sources including webcam and satellite images, the Mexico City MWO, and Jalisco Civil Protection agency, the Washington VAAC reported that ash plumes from Colima rose to altitudes of 4.7-6.7 km (15,400-22,000 ft) a.s.l. and drifted N, NE, and SW during 18-20, 22, and 24 October.
On 21 October the Unidad Estatal de Protección Civil de Colima reported that lava continued to flow down the S flank. The lava flow was 2.3 km long, 320 m wide, and had an estimated volume of 21 million m3. Low-to-moderate explosions continued. The exclusion zone was maintained at 12 km in the Montegrande canyon (SSE) and 8 km on the other flanks.
Sources: Washington Volcanic Ash Advisory Center (VAAC); Unidad Estatal de Protección Civil de Colima
Based on webcam and satellite images, and information from Colima Towers, the Washington VAAC reported that ash plumes from Colima rose to altitudes of 5.2-7 km (17,000-23,000 ft) a.s.l. and drifted 35-215 km W, NW, N, and NE during 11-18 October.
Source: Washington Volcanic Ash Advisory Center (VAAC)
Based on webcam and satellite images, and information from the Mexico City MWO, the Washington VAAC reported that ash plumes from Colima rose to altitudes of 4.3-6.1 km (14,000-20,000 ft) a.s.l. during 5-6 and 8-11 October. Thermal anomalies were observed on most days; a strong hotspot consistent with lava flow was observed on 9 October.
Source: Washington Volcanic Ash Advisory Center (VAAC)
The Unidad Estatal de Protección Civil de Colima reported that on 26 September seismicity at Colima increased, and crater incandescence was observed later that day. On 27 September small landslides originating from a new and growing lava dome traveled 100 m down the S flank. The exclusion zone was increased from 5 to 10 km in the Montegrande canyon; a 5-km exclusion zone was maintained in the other areas. According to news articles, incandescent landslides traveled down the S and SE flanks during 29 September-1 October. Gas-and-ash plumes rose 4 km and caused ashfall in nearby areas including La Becererra, La Yerbabuena, San Antonio, and El Jabali in the municipality of Comala, Montitlán in the municipality of Cuauhtémoc, and Juan Barragan in Tonila, Jalisco. On 1 October the Colima State government stated that the communities of La Yerbabuena (80 people) and La Becerrera (230 people) were preemptively evacuated, and the exclusion zone was extended to 12 km except on the Jalisco side (maintained at 7.5 km). A news article noted that Juan Barragan was also evacuated.
The Washington VAAC reported that on 29 September gas-and-steam emission possibly containing minor amounts of ash rose to an altitude of 4.9 km (16,000 ft) a.s.l. and drifted NW. On 30 September the webcam showed intense activity and crater incandescence, and gas-and-steam emissions that may have contained ash drifting WNW. An intense thermal anomaly was visible in short-wave infrared satellite images. Later that day an ash plume rose to an altitude of 5.8 km (19,000 ft) a.s.l. and drifted 35 km W. Possible emissions with ash were recorded by the webcam on 1 October; weather clouds obscured views of the crater. An ash plume detected in satellite images drifted almost 40 km S and SW. Later that day the webcam recorded explosions and pyroclastic flows. On 2 October ash plumes rose to altitudes of 6.1-8.2 km (20,000-27,000 ft) a.s.l. and drifted SW and W. Emissions later that day were mostly comprised of gas and steam; seismicity decreased, though a thermal anomaly continued to be detected in satellite images. On 3 October ash plumes rose to altitudes of 5.5-6.4 km (18,000-21,000 ft) a.s.l. and drifted 25-40 km SW and SWW. Ashfall was reported in areas on the S and SW flanks. Based on webcam views ash emissions rose to an estimated altitude of 5.5 km (18,000 ft) a.s.l. and drifted S on 4 October.
Sources: Unidad Estatal de Protección Civil de Colima; Washington Volcanic Ash Advisory Center (VAAC); Televisa
Based on webcam and satellite images, and information from the Mexico City MWO, the Washington VAAC reported that on 25 September an ash emission from Colima rose to an altitude of 5.2 km (17,000 ft) a.s.l. and drifted NNE.
Source: Washington Volcanic Ash Advisory Center (VAAC)
Based on webcam and satellite images, and information from the Mexico City MWO, the Washington VAAC reported an ash emission from Colima on 18 September. Ash plumes rose to altitudes of 4.3-5.5 km (14,000-18,000 ft) a.s.l. during 19-20 September.
Source: Washington Volcanic Ash Advisory Center (VAAC)
Based on satellite and webcam images, the Washington VAAC reported that on 7 September an ash plume from Colima rose to an altitude of 4.9 km (16,000 ft) a.s.l. and drifted W.
Source: Washington Volcanic Ash Advisory Center (VAAC)
Based on satellite and webcam images, the Washington VAAC reported that on 1 September an ash plume from Colima rose to an altitude of 5.5 km (18,000 ft) a.s.l. and drifted almost 30 km W.
Source: Washington Volcanic Ash Advisory Center (VAAC)
Based on satellite and webcam images, and information from the Mexico City MWO, the Washington VAAC reported that during 26-27 August ash plumes from Colima rose to altitudes of 5.2-5.8 km (17,000-19,000 ft) a.s.l. and drifted SE and S. Plumes drifted almost 30 km on 27 August. The webcam recorded an ash plume rising to an altitude of 6.1 km (20,000 ft) a.s.l. on 29 August.
Source: Washington Volcanic Ash Advisory Center (VAAC)
Based on satellite and webcam images, the Washington VAAC reported that on 20 August ash plumes from Colima rose to an altitude of 4.9 km (16,000 ft) a.s.l. and drifted almost 30 km W and N.
Source: Washington Volcanic Ash Advisory Center (VAAC)
Based on satellite and webcam images, the Washington VAAC reported that on 12, 14, and 16 August ash plumes from Colima rose to altitudes of 4.3-5.5 km (14,000-18,000 ft) a.s.l. and drifted NW and W.
Source: Washington Volcanic Ash Advisory Center (VAAC)
The Washington VAAC reported that steam-and-gas puffs containing minor amounts of ash rose from Colima on 28 July. The next day an ash plume identified in satellite images and recorded by the webcam rose to an altitude of 5.8 km (19,000 ft) a.s.l. and drifted NW. On 31 July Colima Towers and the Mexico City MWO reported that ash plumes rose to altitudes of 5.2-7.3 km (17,000-24,000 ft) a.s.l. and drifted W and WSW.
Source: Washington Volcanic Ash Advisory Center (VAAC)
Based on information from the Mexico City MWO, and webcam and satellite views, the Washington VAAC reported that during 21 and 23-25 July ash plumes from Colima rose to altitudes of 4.3-7 km (14,000-23,000 ft) a.s.l. and drifted W and NW.
Source: Washington Volcanic Ash Advisory Center (VAAC)
Based on satellite and webcam images, the Washington VAAC reported that on 17 July an ash emission from Colima rose to an altitude of 4.9 km (16,000 ft) a.s.l., drifted just over 10 km NW, and quickly dissipated. The next day an ash plume rose to an altitude of 4.6 km (15,000 ft) a.s.l. and drifted W.
Source: Washington Volcanic Ash Advisory Center (VAAC)
Based on information from the Mexico City MWO and webcam views, the Washington VAAC reported that on 29 June an ash plume from Colima rose to an altitude of 6.1 km (20,000 ft) a.s.l. and drifted W.
Source: Washington Volcanic Ash Advisory Center (VAAC)
Based on satellite images and wind data, the Washington VAAC reported that on 23 June an ash plume from Colima rose to an altitude of 5.8 km (19,000 ft) a.s.l. and drifted SW.
Source: Washington Volcanic Ash Advisory Center (VAAC)
The Washington VAAC reported that a steam plume containing minor amounts of ash was recorded by the webcam rising from Colima to an altitude of 4.6 (15,000 ft) a.s.l. and drifting SW.
Source: Washington Volcanic Ash Advisory Center (VAAC)
Based on satellite images and wind data, the Washington VAAC reported that on 3 June an ash plume from Colima rose to an altitude of 5.2 km (17,000 ft) a.s.l. and drifted SW.
Source: Washington Volcanic Ash Advisory Center (VAAC)
Based on satellite images, the Washington VAAC reported that on 27 May a possible ash plume from Colima rose to an altitude of 5.8 km (19,000 ft) a.s.l. and drifted NE.
Source: Washington Volcanic Ash Advisory Center (VAAC)
Based on information from the Mexico City MWO, satellite data, and webcam views, the Washington VAAC reported that on 19 and 24 May ash plumes from Colima rose to altitudes of 4.3-4.9 km (14,000-16,000 ft) a.s.l. and drifted NE.
Source: Washington Volcanic Ash Advisory Center (VAAC)
Based on information from the Mexico City MWO and webcam views, the Washington VAAC reported that duirng 15-17 May ash plumes from Colima rose to altitudes of 5.5-7.6 km (18,000-25,000 ft) a.s.l. and drifted ENE and E.
Source: Washington Volcanic Ash Advisory Center (VAAC)
Based on information from Colima Towers and the Mexico City MWO, and webcam and satellite views, the Washington VAAC reported that on 4, 6, and 9-10 May ash plumes from Colima rose to altitudes of 5.2-6.1 km (17,000-20,000 ft) a.s.l. and drifted NW, NE, and E.
Source: Washington Volcanic Ash Advisory Center (VAAC)
The Washington VAAC reported that a three-minute-long ash emission was recorded on 28 April by Colima's webcam. On 1 May ash puffs observed with the webcam and satellite images rose to an altitude of 4.6 km (15,000 ft) a.s.l. and drifted E. Based on information from Colima Towers and the Mexico City MWO, and webcam and satellite views, ash plumes rose to an altitude of 5.2 km (17,000 ft) a.s.l. and drifted NE during 2-3 May.
Source: Washington Volcanic Ash Advisory Center (VAAC)
Based on satellite images, wind data, webcam images, and notices from the Mexico City MWO, the Washington VAAC reported that during 20-22 and 25 April ash plumes from Colima rose to altitudes of 4.9-6.7 km (16,000-24,000 ft) a.s.l. and drifted NE and NW.
Source: Washington Volcanic Ash Advisory Center (VAAC)
Based on satellite images, wind data, webcam images, and notices from the Mexico City MWO, the Washington VAAC reported that during 13 and 15-16 April ash plumes from Colima rose to altitudes of 4.9-6.4 km (16,000-21,000 ft) a.s.l. and drifted NE.
Source: Washington Volcanic Ash Advisory Center (VAAC)
Based on satellite images, wind data, webcam images, and notices from the Mexico City MWO, the Washington VAAC reported that during 6-8 April ash plumes from Colima rose to altitudes of 5.8-6.1 km (19,000-20,000 ft) a.s.l. and drifted NNE and NE.
Source: Washington Volcanic Ash Advisory Center (VAAC)
Based on satellite and webcam images, the Washington VAAC reported that during 30 March and 1-2 April ash plumes from Colima rose to altitudes of 4-5.5 km (13,000-18,000 ft) a.s.l. and drifted E and NE.
Source: Washington Volcanic Ash Advisory Center (VAAC)
Based on satellite and webcam images, the Washington VAAC reported that during 24 and 27-29 March ash plumes from Colima rose to altitude of 4-6.1 km (13,000-20,000 ft) a.s.l. and drifted NE.
Source: Washington Volcanic Ash Advisory Center (VAAC)
Based on webcam images, the Washington VAAC reported that on 16 March a minor ash emission from Colima drifted NNE. The next day an ash plume rose to an altitude of 5.5 km (18,000 ft) a.s.l. and drifted NW.
Source: Washington Volcanic Ash Advisory Center (VAAC)
Based on satellite and webcam images, the Washington VAAC reported that during 11-12 March ash plumes from Colima rose altitudes of 4.3-5.2 km (14,000-17,000 ft) a.s.l. and drifted SE and E.
Source: Washington Volcanic Ash Advisory Center (VAAC)
Based on satellite and webcam images, notices from the Mexico City MWO, and information from Colima Towers, the Washington VAAC reported that on 2, 4, 5, and 7 March ash plumes from Colima rose to altitude of 4.3-5.5 km (14,000-18,000 ft) a.s.l. and drifted NE and SW. A hotspot was detected on 2 March.
Source: Washington Volcanic Ash Advisory Center (VAAC)
Based on satellite and webcam images, and notices from the Mexico City MWO, the Washington VAAC reported that during 24-25 and 27 February ash plumes from Colima rose to altitude of 5.2-5.8 km (17,000-19,000 ft) a.s.l. and drifted as far as 150 km NE and N.
Source: Washington Volcanic Ash Advisory Center (VAAC)
Based on satellite and webcam images, and wind data, the Washington VAAC reported that during 18-19 February gas-and-ash plumes from Colima rose to altitudes of 4.6-5.5 km (15,000-18,000 ft) a.s.l. and drifted N, S, and SSW.
Source: Washington Volcanic Ash Advisory Center (VAAC)
Based on satellite and webcam images, and notices from the Mexico City MWO, the Washington VAAC reported that during 14-15 February ash plumes from Colima rose to an altitude of 5.8 km (19,000 ft) a.s.l. and drifted E and SE.
Source: Washington Volcanic Ash Advisory Center (VAAC)
Based on satellite images, wind data, webcam images, and notices from the Mexico City MWO, the Washington VAAC reported that during 3-8 February ash plumes from Colima rose to altitudes of 4.9-6.7 km (16,000-22,000 ft) a.s.l. and drifted 75-140 km in multiple directions.
Source: Washington Volcanic Ash Advisory Center (VAAC)
Based on satellite images, wind data, webcam images, and notices from the Mexico City MWO, the Washington VAAC reported that on 29 January and 1 February ash plumes from Colima rose to altitudes of 4.6-6.7 km (15,000-22,000 ft) a.s.l. and drifted as far as 145 km ENE, E, SE, S, and W. Minor ash emissions were observed on 25 January.
Source: Washington Volcanic Ash Advisory Center (VAAC)
Based on satellite images, wind data, webcam images, and notices from the Mexico City MWO, the Washington VAAC reported that during 20-24 and 26 January ash plumes from Colima rose to altitudes of 4.6-6.7 km (15,000-22,000 ft) a.s.l. and drifted as far as 145 km E, SE, S, and W. Minor ash emissions were observed on 25 January.
Source: Washington Volcanic Ash Advisory Center (VAAC)
Based on satellite images, wind data, webcam images, and notices from the Mexico City MWO, the Washington VAAC reported that during 14-19 January ash plumes from Colima rose to altitudes of 4.3-6.7 km (14,000-22,000 ft) a.s.l. and drifted NE, E, SE, and S.
Source: Washington Volcanic Ash Advisory Center (VAAC)
Based on satellite images, wind data, webcam images, and notices from the Mexico City MWO, the Washington VAAC reported that during 6-12 January ash plumes from Colima rose to altitudes of 4.6-6.7 km (15,000-22,000 ft) a.s.l. and drifted NE, ENE, and E.
Source: Washington Volcanic Ash Advisory Center (VAAC)
Based on satellite images, wind data, webcam images, and notices from the Mexico City MWO, the Washington VAAC reported that during 30 December-3 January and 5 January ash plumes from Colima rose to altitudes of 4.6-6.7 km (15,000-22,000 ft) a.s.l. and drifted NW, N, NE, and E.
Source: Washington Volcanic Ash Advisory Center (VAAC)
Based on satellite images, wind data, webcam images, Colima Towers, and notices from the Mexico City MWO, the Washington VAAC reported that during 23-29 December ash plumes from Colima rose to altitudes of 4.6-6.1 km (15,000-20,000 ft) a.s.l. and drifted as far as 150 km NE, ENE, and E.
Source: Washington Volcanic Ash Advisory Center (VAAC)
Based on satellite images, wind data, webcam images, and notices from the Mexico City MWO, the Washington VAAC reported that during 16-21 December ash plumes from Colima rose to altitudes of 4.6-7.3 km (15,000-24,000 ft) a.s.l. and NW, NNE, NE, and E.
Source: Washington Volcanic Ash Advisory Center (VAAC)
Based on satellite images, wind data, webcam images, and notices from the Mexico City MWO, the Washington VAAC reported that during 9 and 13-15 December ash plumes from Colima rose to altitudes of 4.6-7.6 km (15,000-25,000 ft) a.s.l. and E, ENE, and NE.
Source: Washington Volcanic Ash Advisory Center (VAAC)
Based on satellite images, wind data, webcam images, and notices from the Mexico City MWO, the Washington VAAC reported that during 2-7 December ash plumes from Colima rose to altitudes of 4.6-7.6 km (15,000-25,000 ft) a.s.l. and drifted multiple directions.
Source: Washington Volcanic Ash Advisory Center (VAAC)
Based on satellite images, wind data, webcam images, and notices from the Mexico City MWO, the Washington VAAC reported that during 24 November-1 December ash plumes from Colima rose to altitudes of 5.2-6.6 km (17,000-22,000 ft) a.s.l. and drifted multiple directions.
Source: Washington Volcanic Ash Advisory Center (VAAC)
Based on satellite images, wind data, webcam images, and notices from the Mexico City MWO, the Washington VAAC reported that during 18-20 and 22-23 November ash plumes from Colima rose to altitudes of 4.9-7 km (16,000-23,000 ft) a.s.l. and drifted NW, W, and SW.
Source: Washington Volcanic Ash Advisory Center (VAAC)
Based on satellite images, wind data, webcam images, and notices from the Mexico City MWO, the Washington VAAC reported that during 11-17 November ash plumes from Colima rose to altitudes of 4.3-6.3 km (14,000-21,000 ft) a.s.l. and drifted NE, NW, W, and SW.
Source: Washington Volcanic Ash Advisory Center (VAAC)
Based on satellite images, wind data, and notices from Colima Towers and the Mexico City MWO, the Washington VAAC reported that during 4-7 and 9 November ash plumes from Colima rose to altitudes of 4.9-6 km (16,000-20,000 ft) a.s.l. and drifted 13-24 km N, NW, W, SW, and S. On 10 November emissions released about every two hours rose to an altitude of 5.7 (19,000 ft) a.s.l. and drifted SW and WSW.
Source: Washington Volcanic Ash Advisory Center (VAAC)
Based on satellite images, wind data, and notices from the Mexico City MWO, the Washington VAAC reported that during 31 October-1 November ash plumes from Colima rose to altitudes of 6-6.7.3 km (20,000-24,000 ft) a.s.l. and drifted 20-45 km W and E. On 2 November ash emissions drifted NNE.
Source: Washington Volcanic Ash Advisory Center (VAAC)
Based on satellite images, wind data, webcam views, and notices from the Mexico City MWO and Colima Tower, the Washington VAAC reported continuing emission from Colima. On 21 October an ash plume drifted N and quickly dissipated, and on 24 October an ash puff dissipated to the E. On 25 October a gas plume with minor amounts of ash was detected. An emission drifted NE on 28 October.
Source: Washington Volcanic Ash Advisory Center (VAAC)
The Unidad Estatal de Protección Civil de Colima reported that on 6 October scientists conducted an overflight of Colima and noted that the summit crater was 200 m wide and 50 m deep. Explosions had excavated parts of the crater, exposing the inner wall stratigraphy in the W and N parts of the crater. Fumarolic plumes rose from vents outside of the crater and from the SE interior. Weaker fumarolic activity was present in the NE and W sectors. An explosion on 5 October had produced a small pyroclastic flow that had traveled 2.1 km down the flanks. The report reminded the public to stay at least 5 km away from the crater, and 12 km away in the Montegrande drainage. Based on satellite images, wind data, webcam views, and notices from the Mexico City MWO, the Washington VAAC reported that during 13-16 and 18-19 October ash plumes from Colima rose to altitudes of 5.5-6.7 km (15,000-22,000 ft) a.s.l. and drifted SW and NW.
Sources: Unidad Estatal de Protección Civil de Colima; Washington Volcanic Ash Advisory Center (VAAC)
Based on satellite images, wind data, webcam views, and notices from the Mexico City MWO, the Washington VAAC reported that during 3-5 October ash plumes from Colima rose to altitudes of 5.5-8.2 km (18,000-27,000 ft) a.s.l. and drifted N, NNE, and NE.
Source: Washington Volcanic Ash Advisory Center (VAAC)
Based on satellite images, wind data, and webcam views, the Washington VAAC reported that on 22 September ash plumes from Colima drifted over 15 km W and SW. On 23 September ash plumes rose to altitudes of 6.7-7 km (22,000-23,000 ft) a.s.l., drifted SW, and dissipated near the coast. Ash plumes the next day drifted 15-30 km WSW.
Source: Washington Volcanic Ash Advisory Center (VAAC)
On 18 September the Washington VAAC reported that the webcam at Colima recorded a short-duration ash plume that rose to an altitude of 5.2 km (17,000 ft) a.s.l. Based on satellite images, the Mexico City MWO, and seismic data, the VAAC noted that during 20-21 September ash plumes rose to altitudes of 5.5-6.7 km (18,000-22,000 ft) a.s.l. and drifted km W and WSW.
Source: Washington Volcanic Ash Advisory Center (VAAC)
Based on satellite images, the Washington VAAC reported that during 9-10 and 12 September a gas-and-ash plume from Colima rose to altitudes of 4.6-6.7 km (15,000-22,000 ft) a.s.l. and drifted NW, WSW, and SW.
Source: Washington Volcanic Ash Advisory Center (VAAC)
Based on satellite images, the Washington VAAC reported that on 5 September a gas-and-ash plume from Colima rose to an altitude of 6.1 km (20,000 ft) a.s.l. and drifted 60 km NW.
Source: Washington Volcanic Ash Advisory Center (VAAC)
Based on satellite images, webcam views, and notices from the Mexico City MWO, the Washington VAAC reported that during 27-30 August some of the daily ash emissions from Colima rose to altitudes of 4.3-6.1 km (14,000-20,000 ft) a.s.l. and drifted SW, WSW, W and NW.
Source: Washington Volcanic Ash Advisory Center (VAAC)
Based on satellite images, webcam views, and notices from the Mexico City MWO, Colima Observatory, and Jalisco civil protection agency, the Washington VAAC reported that during 20-21 and 24 August ash-and-gas plumes from Colima rose to altitudes of 4.2-7 km (14,000-23,000 ft) a.s.l. and drifted W, WNW, NW, NE, and SE. On 18 August an ash plume rose to an altitude of 5.2 km (17,000 ft) a.s.l. and slowly drifted W.
Source: Washington Volcanic Ash Advisory Center (VAAC)
Based on satellite images, webcam views, and notices from the Mexico City MWO, the Washington VAAC reported that during 12-16 August some of the daily ash emissions from Colima rose to altitudes of 4.9-5.8 km (16,000-19,000 ft) a.s.l. and drifted W and SW. On 18 August an ash plume rose to an altitude of 5.2 km (17,000 ft) a.s.l. and slowly drifted W.
Source: Washington Volcanic Ash Advisory Center (VAAC)
Based on satellite images, notices from the Mexico City MWO, wind data, and webcam views, the Washington VAAC reported that during 5-9 and 11 August multiple ash emissions from Colima rose to altitudes of 5.5 km (18,000-25,000 ft) a.s.l. and drifted 35-150 km NNE, NNW, NW, W, and SW. A thermal anomaly was detected on 11 August.
Source: Washington Volcanic Ash Advisory Center (VAAC)
Based on satellite images and the Mexico City MWO, the Washington VAAC reported that multiple ash plumes from Colima rose to an altitude of 5.5 km (15,000 ft) a.s.l. and drifted 110 km WSW and SW on 31 July. On 3 August a gas plume possibly containing ash drifted 30-40 km N and W. The next day an ash plume rose to an altitude of 6.1 km (20,000 ft) a.s.l. and drifted over 35 km NW.
Source: Washington Volcanic Ash Advisory Center (VAAC)
The Washington VAAC reported that on 15 July the webcam at Colima recorded no ash emissions; however, incandescent avalanches continued to descend the flanks. According to a news article the lava dome had been excavated during increased activity from 10 to 12 July; on 16 July explosions were less continuous and extrusion of a lava flow on the S flank has decreased. A total of 670 evacuees remained in temporary shelters.
Sources: Washington Volcanic Ash Advisory Center (VAAC); Latin America Herald Tribune
In a 7 July bulletin, the Unidad Estatal de Protección Civil de Colima reported that during the previous week explosions from a fast-growing lava dome at Colima generated ash plumes that rose 3 km above the crater. Incandescent rock avalanches, from explosions and the lava dome overtopping the crater rim, descended the flanks. Ashfall was reported in various communities downwind. The report warned the public not to enter an area within a 5-km radius of the crater, and to avoid drainages within 14 km due to lahar hazards. La Coordinación Nacional de Protección Civil reported that during 7-10 July a gradual increase in the number of emissions and landslides was detected. Pyroclastic flows traveled at most 2.5 km down the N, W, and S flanks. During 9-10 July incandescent material was ejected from the crater.
Based on satellite images and webcam views, the Washington VAAC reported an intense thermal anomaly and constant ash emissions on 10 July. A large event at 1200 produced an ash plume that rose to an altitude of 7.6 km (25,000 ft) a.s.l. and drifted 150 km W. La Coordinación Nacional de Protección Civil noted that activity further increased at 2017 on 10 July, characterized by incandescent material descending the WSW flanks, pyroclastic flows, and ash plumes that rose 4 km above the crater. Ash fell in the communities of La Yerbabuena (5-cm-thick ash deposits), La Becerrera (88 SW), San Antonio, Carrizalillo, El Naranjal, Nuevo Naranjal, and Suchitlán (18 km SSW) in Colima State. The Unidad Estatal de Protección Civil de Colima ordered 19 residents in La Yerbabuena to evacuate, and some residents in nearby towns self-evacuated. A pyroclastic flow traveled 9 km S. By 1030 on 11 July there were 70 confirmed evacuees in shelters. Citing large eruptions in the past, La Coordinación Nacional de Protección Civil enforced a preventative evacuation within 12 km of the crater. Ashfall was reported in Comala, Villa de Alvarez, and Colima. An additional 70 people had evacuated, and the national airport, El Aeropuerto Nacional de Colima, suspended operations due to ashfall. Ejected incandescent material, ash emissions, incandescent landslides, and pyroclastic flows continued at a moderate level during 11-12 July. Evacuations continued on 12 July, and ashfall persisted in Comala, Villa de Alvarez, and Colima. The report noted that La Unidad Estatal de Protección Civil and Bomberos de Jalisco continued to monitor the towns of Lomas de las Flores and San José del Carmen, and the municipality of Zapotitlán de Vadillo because they were the areas most affected by ashfall.
Sources: Unidad Estatal de Protección Civil de Colima; La Coordinación Nacional de Protección Civil; Washington Volcanic Ash Advisory Center (VAAC)
The Washington VAAC reported that an ash-and-gas plume from an explosion at Colima was recorded by the webcam on 24 June; weather clouds prevented views of the volcano.
Source: Washington Volcanic Ash Advisory Center (VAAC)
Based on webcam views, the Washington VAAC reported an explosion at Colima on 18 June that ejected lava onto the flanks and possibly produced an ash emission. Ash emissions were visible in the webcam later that day. On 21 June satellite images showed a diffuse ash plume drifting WNW, and Colima Tower reported ash to altitudes of 4.6-6.1 km (15,000-20,000 ft) a.s.l.
Source: Washington Volcanic Ash Advisory Center (VAAC)
The Washington VAAC reported that a possible ash plume from Colima was recorded by a webcam on 15 June.
Source: Washington Volcanic Ash Advisory Center (VAAC)
Based on satellite images and webcam views, the Washington VAAC reported that on 3 June an ash plume from Colima rose to an altitude of 5.2 km (17,000 ft) a.s.l. and drifted WSW.
Source: Washington Volcanic Ash Advisory Center (VAAC)
Based on satellite images and webcam views, the Washington VAAC reported that on 27 May two ash plumes from Colima rose to an altitude of 5.8 km (19,000 ft) a.s.l. Later that day an ash plume drifted 40 km W.
Source: Washington Volcanic Ash Advisory Center (VAAC)
Based on satellite images, the Washington VAAC reported that on 21 May an ash plume rose from Colima to an altitude below 4.9 km (16,000 ft) a.s.l. and drifted W.
Source: Washington Volcanic Ash Advisory Center (VAAC)
Based on satellite images, webcam views, and wind models, the Washington VAAC reported that on 16 May an ash plume rose from Colima to an altitude of 5.5 km (18,000 ft) a.s.l. and drifted 95 km ESE before dissipating. A thermal anomaly was also visible. Ash emissions later that day also dissipated within 95 km ESE.
Source: Washington Volcanic Ash Advisory Center (VAAC)
Based on satellite images, wind data, webcam views, and the Mexico City MWO, the Washington VAAC reported that on 7 May ash plumes from Colima rose to an altitude of 6.7 km (22,000 ft) a.s.l. and drifted 80-200 km E. On 10 May ash plumes rose to altitudes of 5.2-6.7 km (17,000-22,000 ft) a.s.l. and drifted NE and ESE. Ash emissions were recorded by the webcam on 11 May.
Source: Washington Volcanic Ash Advisory Center (VAAC)
Based on satellite images, the Washington VAAC reported that on 30 April an ash plume from Colima drifted 30 km E before dissipating. Another ash plume drifted almost 20 km E. On 2 May an ash puff rose to an altitude of 4.3 km (14,000 ft) a.s.l. and drifted 150 km ENE to W. Another ash plume rose to an altitude of 6.7 km (22,000 ft) a.s.l. and drifted E. Later that day an ash plume drifted almost 85 km E before dissipating.
Source: Washington Volcanic Ash Advisory Center (VAAC)
Based on satellite images, and webcam views, Mexico City MWO notices, and wind data, the Washington VAAC reported multiple ash emissions from Colima during 21-26 and 28 April. Ash plumes rose to altitudes of 5.5-7.3 km (15,000-24,000 ft) a.s.l. and drifted NW to NE. On 25 April ashfall was reported in areas 85 km N.
Source: Washington Volcanic Ash Advisory Center (VAAC)
Based on satellite images, and webcam views, information from Colima University, Jalisco Civil Protection notices, Mexico City MWO notices, and wind data, the Washington VAAC reported multiple ash emissions per day from Colima during 15-20 April. Ash plumes rose to altitudes of 5.5-8.5 km (15,000-26,000 ft) a.s.l. and drifted NNE to E. Thermal anomalies were detected on 15 and 17 April. According to a news article ashfall was reported to the W in Guzman on 16 April.
Sources: Washington Volcanic Ash Advisory Center (VAAC); Agence France-Presse (AFP)
Based on satellite images, and webcam views, Mexico City MWO notices, and wind data, the Washington VAAC reported multiple ash emissions per day from Colima during 8-10 and 13-14 April. Ash plumes rose to altitudes of 5.5-8.5 km (18,000-28,000 ft) a.s.l. and drifted in varied directions during 9-10 and 13-14 April.
Source: Washington Volcanic Ash Advisory Center (VAAC)
Based on satellite images, Mexico City MWO, Colima Observatory notices, webcam views, and local media the Washington VAAC reported multiple ash emissions per day from Colima during 1-3 and 5-7 April. A small ash puff drifted 13 km E on 1 April. The next day an ash plume rose to an altitude of 6.4 km (21,000 ft) a.s.l. and drifted N. Ash emissions on 3 April drifted N, NE, E, and SE. On 5 April ash plumes rose to altitudes of km (14,000-23,000 ft) a.s.l. and drifted 20-40 km NNE and SW. The next day an ash plume rose to an altitude of 5.2 km (17,000 ft) a.s.l. and drifted SW. On 7 April an ash cloud drifted almost 20 km W.
Source: Washington Volcanic Ash Advisory Center (VAAC)
Based on satellite images, Mexico City MWO, Colima Observatory notices, and webcam views, the Washington VAAC reported multiple ash emissions per day from Colima during 24-30 March. Gas-and-ash plumes on 24 March drifted E and dissipated around 90 km away. During 25-30 March some ash plumes rose to altitudes of 4-7.6 km (13,000-25,000 ft) a.s.l.; ash emissions drifted 15-140 km NE, ENE, E, and SE. Ash plumes on 30 March also drifted W.
Source: Washington Volcanic Ash Advisory Center (VAAC)
Based on satellite images, Mexico City MWO, webcam images, and METAR notices, the Washington VAAC reported that during 18-24 March daily ash plumes from Colima rose to altitudes of 4.9-8.2 km (16,000-27,000 ft) a.s.l. and drifted 40-150 km NNE, NE, ENE, and E.
Source: Washington Volcanic Ash Advisory Center (VAAC)
Based on satellite images, Mexico City MWO, Colima Tower notices, and a webcam, the Washington VAAC reported ash plumes from Colima during 11-13 March. On 12 March an ash cloud observed in satellite images was located between 40 and 90 km ENE. Additional emissions produced ash plumes that drifted 50-90 km ENE. Later that day ash plumes rose to altitudes of 6.1-6.7 km (20,000-22,000 ft) a.s.l. and drifted E, ESE, and SE. On 13 March an ash plume rose to an altitude below 4.9 km (16,000 ft) a.s.l. and drifted E. Thermal anomalies were detected during 12-13 March.
Source: Washington Volcanic Ash Advisory Center (VAAC)
Based on satellite images and wind models, the Washington VAAC reported that on 4 March an ash plume rose from Colima to an altitude of 5.2 km (17,000 ft) a.s.l. and drifted 65 km NE and ENE. The webcam recorded an ash plume rising from the crater and drifting NE later that day. On 5 March the webcam recorded an ash plume that rose to an altitude of 7.6 km (25,000 ft) a.s.l. and drifted NNE. Gas emissions with some possible ash continued to be recorded. An explosion at 1546 on 6 March generated an ash plume that rose to an altitude of 7.6 km (25,000 ft) a.s.l. and drifted NNE. Satellite images detected a plume drifting almost 65 km E at an altitude of 6.1 km (20,000 ft) a.s.l. The webcam recorded continuing ash puffs on 7 March drifting NW. A wide ash plume rose to an altitude of 7 km (23,000 ft) a.s.l. and fanned out N and NE. On 9 March the Mexico City MWO reported an ash plume that rose to an altitude of 6.1 km (20,000 ft) a.s.l. and drifted NE. Webcam views indicated that the emission rose higher. Multiple ash emissions were detected later that day, and one was detected on 10 March.
Source: Washington Volcanic Ash Advisory Center (VAAC)
Based on satellite images, Mexico City MWO, and a webcam, the Washington VAAC reported that during 25 February-3 March multiple gas-and-ash plumes per day from Colima rose to altitudes of 5.2-7.6 km (17,000-25,000 ft) a.s.l. and drifted in multiple directions. Ash drifted as far as 370 km SE (on 28 February). New thermal anomalies were identified on 28 February and continued through 2 March.
Source: Washington Volcanic Ash Advisory Center (VAAC)
Based on satellite images, Mexico City MWO, METAR and Colima Tower notices, pilot observations, and a webcam, the Washington VAAC reported that during 18-24 February multiple gas-and-ash plumes per day from Colima rose to altitudes of 5.5-7.3 km (18,000-24,000 ft) a.s.l. and drifted in multiple directions. Ash drifted as far as 350 km SE (on 19 February).
In a 24 February bulletin, the Unidad Estatal de Protección Civil reported that the number and size of lava-block collapses at Colima remained low during the previous week. Lava flows showed no evidence of movement. Explosive activity was low to moderate and generated plumes that rose 2-3 km and drifted downwind. Ashfall in nearby areas was persistent. Residents were warned not go within 5 km of the volcano.
Sources: Unidad Estatal de Protección Civil de Colima; Washington Volcanic Ash Advisory Center (VAAC)
Based on satellite images, the Washington VAAC reported that on 11 February continued discrete emissions from Colima drifted NE and dissipated after 55 km. On 14 February a small eruption recorded by the webcam produced gas emissions with a low ash content that rose to an altitude of 4.9 km (16,000 ft) a.s.l. and drifted NNE.
In a 17 February bulletin, the Unidad Estatal de Protección Civil reported that Colima remained active, although there continued to be a slight decrease in the number and size of lava-block avalanches. Lava flows minimally advanced. Explosions continued but also decreased in intensity, producing ash plumes that rose 2-3 km above the crater. The lava dome had been partially destroyed, forming a carter about 140 m in diameter. Residents were warned not go within 5 km of the volcano.
Sources: Unidad Estatal de Protección Civil de Colima; Washington Volcanic Ash Advisory Center (VAAC)
Based on webcam views, Colima Tower, Mexico City MWO, and Colima Observatory notices, and satellite images, the Washington VAAC reported that on 4 February a small ash puff from Colima drifted E. Later that day an emission rose to an altitude of 7.3 km (24,000 ft) a.s.l. and drifted E, and two additional ash clouds drifted E. On 5 February multiple ash emissions, mostly diffuse, drifted E and NE. One ash plume rose to an altitude of 7.9 km (26,000 ft) a.s.l. and moved ENE.
In a 7 February bulletin, the Unidad Estatal de Protección Civil reported that Colima remained active, although there continued to be a slight decrease in the number and size of lava-block avalanches. Lava flows minimally advanced, and small landslides of lava blocks were observed. Explosions continued but also decreased in intensity. Residents were warned not go within 5 km of the volcano.
Sources: Unidad Estatal de Protección Civil de Colima; Washington Volcanic Ash Advisory Center (VAAC)
Based on webcam views and satellite images, the Washington VAAC reported that on 29 January a brief emission from Colima with low ash content drifted 30 km SW. The next day a few brief emissions rose from the crater and dissipated about 37 km SW. In a 2 February bulletin, the Unidad Estatal de Protección Civil reported that Colima remained active, although there was a slight decrease in the number and size of lava-block avalanches. Lava flows on the SW and WNW flanks minimally advanced, and small landslides of lava blocks were observed. Residents were warned not go within 5 km of the volcano.
Sources: Unidad Estatal de Protección Civil de Colima; Washington Post
Based on news articles, an explosion at 0713 on 21 January generated an ash plume that rose 4 km and drifted E. Ashfall was reported in Huescalpa (25 km NE), Tuxpan (25 km ENE), Zapotiltic (23 km NE), Vista Hermosa, Atenquique (20 km E), and Mazamitla (78 km NE). On 23 January authorities restricted access to the Parque Nacional Nevado de Colima citing increased activity during the previous days. The next day an ash plume rose 500 m and was followed by another ash plume that rose 700 m. Two ash plumes on 26 January rose as high as 1 km.
In a 24 January bulletin, the Unidad Estatal de Protección Civil reported that Colima remained active, although there was a slight decrease in the number and size of lava-block avalanches. Lava flows were active on the W and WNW flanks, and explosive activity was low to moderate. The recent explosions had partially destroyed the lava dome. Residents were warned not go within 5 km of the volcano.
Sources: Informador; Informador; Informador; Informador; Unidad Estatal de Protección Civil de Colima
Based on information from Colima Tower, the Washington VAAC reported that on 14 January an emission from Colima drifted E. The next day satellite images showed a diffuse ash plume drifting NNE. On 17 January two emissions drifted 20-30 km NNE, and a thermal anomaly was detected in satellite images. A news article stated that an ash plume rose 600 m, and then later that day (at 1800) an ash plume rose 2.5 km. Ashfall was reported in Tuxpan (25 km ENE). According to the VAAC, on 18 January the México City MWO noted that an ash plume rose to an altitude of 5.5 km (18,000 ft) a.s.l. and drifted over 10 km NNE; ash was not identified in satellite images. On 19 January an ash plume drifted almost 30 km NE.
Sources: Washington Volcanic Ash Advisory Center (VAAC); Informador
Based on news articles, an explosion from Colima at about 0900 on 3 January generated an ash plume that rose 3 km. Ash fell in the municipalities of Zapotlán El Grande (26 km NE), Gómez Farías (34 km NNE), Concepción de Buenos Aires (63 km NE), Manzanilla de la Paz (72 km NE), Toliman (31 km WNW), Tuxpan (25 km ENE), Zapotiltic (23 km NE), Tamazula de Gordian (42 km NE), Valle de Juárez (85 km NE), Mazamitla (78 km NE), and Tonila (150 km NE). An explosion on 8 January generated an ash plume that rose 2 km and caused ashfall in Tuxpan, Tonila, and Zapotiltic. Another explosion on 11 January generated an ash plume that rose 1 km and caused ashfall in Tuxpan. An ash plume rose 500 m on 12 January and drifted ENE.
Sources: Informador; Informador; Informador
Based on satellite image analyses and Colima University, the Washington VAAC reported that on 24 December a gas cloud from Colima contained small amounts of ash and drifted NE and E.
Source: Washington Volcanic Ash Advisory Center (VAAC)
Based on satellite image analyses, the Washington VAAC reported that on 30 November an ash puff from Colima drifted NE. Later that day a puff of likely gas and ash drifted E at an altitude below 4.9 km (16,000 ft) a.s.l.
Source: Washington Volcanic Ash Advisory Center (VAAC)
Based on a METAR notice and satellite image analyses, the Washington VAAC reported that on 21 November an ash plume from Colima rose to an altitude of 7 km (23,000 ft) a.s.l. and drifted ENE.
Source: Washington Volcanic Ash Advisory Center (VAAC)
Based on statements from the Mexico City Meteorological Watch Office, the Washington VAAC reported that on 15 May an ash emission from Colima rose to an altitude of 6.1 km (20,000 ft) a.s.l. Ash was not detected in satellite images. On 18 May a possible ash plume was observed in satellite images drifting almost 30 km W.
Source: Washington Volcanic Ash Advisory Center (VAAC)
Based on observations of satellite images, the Washington VAAC reported that on 19 March small diffuse puffs rose from Colima to an altitude of 4.6 km (15,000 ft) a.s.l., drifted E, and dissipated almost 30 km away. A diffuse ash plume drifted N on 22 March.
Source: Washington Volcanic Ash Advisory Center (VAAC)
Based on observations of satellite images, the Washington VAAC reported that on 12 March an ash plume from Colima drifted 25 km NNE and dissipated.
Source: Washington Volcanic Ash Advisory Center (VAAC)
Based on observations of satellite images, the Washington VAAC reported that on 6 March a small ash cloud from Colima drifted NE and dissipated.
Source: Washington Volcanic Ash Advisory Center (VAAC)
Based on observations of satellite images and information from the Mexico MWO, the Washington VAAC reported that on 28 February an ash plume from Colima drifted 15 km SE at altitudes up to 4.6 km (15,000 ft) a.s.l. On 1 March two emissions formed an ash plume that drifted over 35 km NNW. Three other plumes drifted NNW later that day.
Source: Washington Volcanic Ash Advisory Center (VAAC)
Based on observations of satellite images, the Washington VAAC reported that a small ash cloud from Colima drifted slowly E and then SE on 7 February; the slow drift was indicative of a low altitude. Another small puff of gas with low amounts of ash drifted SE.
Source: Washington Volcanic Ash Advisory Center (VAAC)
The Washington VAAC reported intermittent ash emissions from Colima on 21 January: an ash puff drifted S at an altitude of 4.9 km (16,000 ft) a.s.l., a second ash puff drifted SSW, and a third ash puff drifted S.
Source: Washington Volcanic Ash Advisory Center (VAAC)
The Washington VAAC reported that at 0730 on 17 November a possible ash emission from Colima produced a plume that drifted almost 20 km E.
Source: Washington Volcanic Ash Advisory Center (VAAC)
The Washington VAAC reported that between 2315 and 2345 on 9 November a bright thermal anomaly over Colima was detected in satellite images. A diffuse puff of gas and steam observed at 0115 on 10 November possibly contained ash.
Source: Washington Volcanic Ash Advisory Center (VAAC)
Based on analyses of satellite imagery, the Washington VAAC reported that on 29 January an ash plume from Colima drifted 55 km NE at an uncertain altitude. A thermal anomaly was also detected.
According to news articles, residents up to 20 km away reported a loud noise, shaking ground, and rattling windows at about 0400 on 29 January. Colima ejected incandescent material and an ash plume that rose 3 km. Ash fell in several communities.
Sources: El Economista; El Occidental; La Prensa (Mexico); Washington Volcanic Ash Advisory Center (VAAC)
According to news articles, a scientific advisory committee reported that a phreatic eruption from Colima on 6 January ejected tephra and an ash plume that rose 2 km above the crater. Ashfall was reported in Atenquique (20 km E). Visitors were evacuated from the national park.
Source: Noticieros Televisa
According to news articles from 11 and 12 January, although incandescent landslides from Colima's lava dome had increased during the last days of 2010 into early 2011, the activity was still considered to be within normal parameters. Landslides occurred on the W, S, and N flanks, producing "dust plumes" observed from multiple municipalities. The lava dome that began growing in February 2007 was about 60 m high and had a volume of 2.6 million cubic meters.
Sources: Noticieros Televisa; El Universal
Based on analyses of satellite imagery and information from the Mexico City MWO, the Washington VAAC reported that on 7 November an ash plume from Colima rose to an altitude of 6.7 km (22,000 ft) a.s.l. and drifted 19 km SW.
Source: Washington Volcanic Ash Advisory Center (VAAC)
Based on analysis of satellite imagery, the Washington VAAC reported that an ash cloud from Colima drifted W on 28 October.
Source: Washington Volcanic Ash Advisory Center (VAAC)
The government of the state of Colima reported that on 1 December a white plume from the Colima volcano rose 100 m above the crater and drifted E. On 2 December, incandescent tephra was ejected 50 m above the crater towards the SE. Later that day, a white plume rose 50 m and drifted SW.
Source: Gobierno del Estado de Colima
The government of the state of Colima reported that on 22 October a gray plume from Colima rose to an altitude of 4 km (13,100 ft) a.s.l. and drifted SW. The next day, white plumes drifted NE and N, one at an altitude of 4.2 km (13,800 ft) a.s.l.
Source: Gobierno del Estado de Colima
The government of the state of Colima reported that during 29 July-4 August white and sometimes gray plumes from Colima rose to altitudes of 4-4.3 km (13,100-14,100 ft) a.s.l. Some plumes drifted SW and W.
Source: Gobierno del Estado de Colima
The government of the state of Colima reported that during 21-25 May white and gray plumes from Colima rose to altitudes of 3.9-4.2 km (12,800-13,800 ft) a.s.l. and drifted E, SE, and S.
Source: Gobierno del Estado de Colima
During 8-10 and 12-13 April, white and gray plumes from Colima rose to altitudes of 3.9-5.2 km (12,800-17,100 ft) a.s.l. and occasionally drifted E, S, SW, and W.
Source: Gobierno del Estado de Colima
During 25-29 and 31 March, white and gray plumes from Colima rose to altitudes of 3.9-4.6 km (12,800-15,100 ft) a.s.l. and occasionally drifted SW, SE, E, and NE.
Source: Gobierno del Estado de Colima
During 25 February-3 March, white and gray plumes from Colima rose to altitudes of 3.9-4.5 km (12,800-14,800 ft) a.s.l.
Source: Gobierno del Estado de Colima
During 3-10 February, white and gray plumes from Colima rose to altitudes of 3.9-4.9 km (12,800-16,100 ft) a.s.l. On 4 and 6 February, incandescent material was ejected 50 m above the summit.
Source: Gobierno del Estado de Colima
On 2 January, incandescent material from Colima was propelled 100 m above the summit and a gray plume rose to an altitude of 4.1 km (13,500 ft) a.s.l. During 3-5 January, gray and white plumes rose to altitudes of 4-4.2 km (13,100-13,800 ft) a.s.l. The plumes drifted N, NE, E, and SE.
Source: Gobierno del Estado de Colima
During 9-16 December, gray and white plumes from Colima rose to altitudes of 3.9-4.5 km (12,800-14,800 ft) a.s.l. Plumes occasionally drifted SE and N. On 11 December, a gray plume rose to an altitude of 5.8 km (19,000 ft) a.s.l.
Source: Gobierno del Estado de Colima
During 3-8 December, gray plumes from Colima rose to altitudes of 4.2-4.6 km (13,800-15,100 ft) a.s.l. and drifted N and W; a gray plume rose to an altitude of 6.4 km (21,000 ft) a.s.l. on 4 December. White plumes were also observed and, during 4-8 December, rose to a maximum altitude of 4.2 km (13,800 ft) a.s.l. The white plumes drifted SW and SE.
Source: Gobierno del Estado de Colima
White plumes from Colima were observed rising to altitudes of 4.1-4.3 km (13,500-14,100 ft) a.s.l. during 30-31 October and 2 November. Gray plumes seen on 2 November rose to an altitude of 4.6 km (15,100 ft) a.s.l. Plumes drifted mainly SW and E.
Source: Gobierno del Estado de Colima
Multiple white plumes from Colima were observed rising to altitudes of 3.9-4.1 km (12,800-13,500 ft) a.s.l. during 22-28 October. Gray plumes were observed during 25-28 October and rose to altitudes of 3.9-4.5 km (12,800-14,800 ft) a.s.l. Plumes drifted mainly SW, W, and NW.
Source: Gobierno del Estado de Colima
Although visual observations were intermittent due to cloud cover during 13-18 August, gray and white plumes from Colima were observed and rose to altitudes of 4-4.7 km (13,100-15,400 ft) a.s.l. and drifted SW, W, and N.
Source: Gobierno del Estado de Colima
Although visual observations were occasionally limited due to cloud cover during 3-9 June, ash and steam plumes from Colima were spotted and rose to altitudes of 4-4.8 km (13,100-15,700 ft) a.s.l. Plumes drifted SW, S, SE, and E.
Source: Gobierno del Estado de Colima
Based on information from Mexico City MWO and observations of satellite imagery, the Washington VAAC reported that a puff of ash and gas drifted NW on 13 May.
Source: Washington Volcanic Ash Advisory Center (VAAC)
Multiple steam plumes from Colima were observed rising to altitudes of 3.9-4.6 km (12,800-15,100 ft) a.s.l. during 8-15 April. Gray plumes rose to altitudes of 4.5-4.9 km (15,000-16,100 ft) a.s.l. during 10-12 April. Plumes drifted mainly SW, NW, and W. On 14 April incandescent material was propelled about 50 m above the summit.
Source: Gobierno del Estado de Colima
During 1-2 April, ash plumes from Colima rose to altitudes of 4.2-6.4 km (13,800-21,000 ft) a.s.l. and drifted NW, W, and SW. Incandescent avalanches descended the SW flank. On 4 April, incandescent material was propelled 150 m above the summit. An ash plume rose to an altitude of 4.5 km (14,800 ft) a.s.l. Based on observations of satellite imagery, the Washington VAAC reported that a brief puff of ash drifted SE on 7 April.
Sources: Gobierno del Estado de Colima; Washington Volcanic Ash Advisory Center (VAAC)
Multiple steam plumes from Colima were observed rising to altitudes of 3.9-4.6 km (12,800-15,100 ft) a.s.l. during 12-18 March. Gray plumes rose to altitudes of 4-4.8 km (13,100-15,700 ft) a.s.l. on 14 and 18 March. Plumes drifted multiple directions.
Source: Gobierno del Estado de Colima
Steam and steam-and-ash plumes from Colima were observed rising to altitudes of 4-4.4 km (13,100-14,400 ft) a.s.l. during 14-19 February. Plumes drifted N, NE, and E.
Source: Gobierno del Estado de Colima
According to a news article, activity from Colima increased during 29-30 December. An ash plume was visible on 29 December. On 30 December, incandescent material was propelled from the summit and white and gray plumes rose to altitudes of 4-4.3 km (13,100-14,100 ft) a.s.l. and drifted SE, W, and NW. Authorities recommended that people avoid valleys surrounding the volcano.
Source: Notimex
Steam and steam-and-ash plumes from Colima were observed rising to altitudes of 4.3-4.7 km (14,100-15,400 ft) a.s.l. during 20-23 and25 December. Plumes drifted N on 21 December.
Source: Gobierno del Estado de Colima
Although visual observations were occasionally limited due to cloud cover, steam and steam-and-ash plumes from Colima were observed rising to altitudes of 4-4.4 km (13,100-14,400 ft) a.s.l. and drifting SW, N, NE, and E during 12-16 and 18 December.
Source: Gobierno del Estado de Colima
Based on reports from the Mexico City MWO, the Washington VAAC reported that an ash plume from Colima rose to an altitude of 7.3 km (24,000 ft) a.s.l. and drifted W on 26 November. Observations of satellite imagery showed a plume to the NNE. Observers reported that steam and steam-and-ash plumes rose to altitudes of 3.9-4.6 km (12,800-15,100 ft) a.s.l. and drifted N and SW on 26, 27, and 29 November and during 3-4 December.
Sources: Gobierno del Estado de Colima; Washington Volcanic Ash Advisory Center (VAAC)
During 31 October-1 November, vapor-and-ash plumes from Colima rose to an altitude of 4.5 km (14,800 ft) a.s.l. Based on reports from the Mexico City MWO, the Washington VAAC reported that an ash plume from Colima drifted N on 1 November.
Sources: Gobierno del Estado de Colima; Washington Volcanic Ash Advisory Center (VAAC)
During 19-23 September, steam and steam-and-ash plumes from Colima rose to altitudes of 4-4.9 km (13,100-16,100 ft) a.s.l. and drifted SW, W, and SE.
Source: Gobierno del Estado de Colima
Based on observations of satellite imagery, the Washington VAAC reported that diffuse ash plumes from Colima drifted SW and S on 31 May.
Source: Washington Volcanic Ash Advisory Center (VAAC)
Based on satellite imagery, the Washington VAAC reported that ash plumes from Colima drifted NW on 26 April. On 28 and 30 April, incandescent material was ejected 100 m above the summit.
Sources: Washington Volcanic Ash Advisory Center (VAAC); Gobierno del Estado de Colima
Multiple steam and gas-and-ash plumes were observed from Colima during 11-12 and 15-16 April. Based on satellite imagery and the Mexico City MWO, the Washington VAAC reported that on 12 April continuous ash-and-steam emissions from Colima produced an ash plume that rose to an altitude of 6.1 km (20,000 ft) a.s.l. and drifted W.
Sources: Washington Volcanic Ash Advisory Center (VAAC); Gobierno del Estado de Colima
During 21-27 March, incandescent material from Colima was expelled as high as 50-150 m above the summit. Steam and steam-and-ash plumes rose to altitudes of 4.3-4.9 km (14,100-16,100 ft) a.s.l. and drifted SW, NW, and N. Based on information from Mexico City MWO and satellite imagery, the Washington VAAC reported ash plumes to altitudes of 5.2 km (17,000 ft) a.s.l. that drifted NE during 23-24 March.
Sources: Washington Volcanic Ash Advisory Center (VAAC); Gobierno del Estado de Colima
Based on satellite imagery, the Washington VAAC reported that continuous ash-and-steam emissions from Colima produced a plume that drifted SE and W on 15 December.
Source: Washington Volcanic Ash Advisory Center (VAAC)
Based on reports from the Mexico City MWO and satellite imagery, the Washington VAAC reported that an ash plume from Colima on 30 November reached an altitude of 6.7 km (22,000 ft) a.s.l. and drifted SE and NE.
Source: Washington Volcanic Ash Advisory Center (VAAC)
The Washington VAAC reported that on 19 November a diffuse plume from Colima was visible on a web camera drifting W. Approximately 5 hours later, the Mexico City MWO reported an ash plume to an altitude of 5.5 km (18,000 ft) a.s.l. drifting SW.
Source: Washington Volcanic Ash Advisory Center (VAAC)
Based on reports from the Mexico City MWO and satellite imagery, the Washington VAAC reported that an eruption plume from Colima on 6 November reached an altitude of 6.1 km (20,000 ft) a.s.l. and drifted NE.
Source: Washington Volcanic Ash Advisory Center (VAAC)
Based on reports from the Mexico City MWO and satellite imagery, the Washington VAAC reported that an eruption plume from Colima on 29 October reached an altitude of 6.1 km (20,000 ft) a.s.l. and drifted S.
Source: Washington Volcanic Ash Advisory Center (VAAC)
Based on information from the Mexico City MWO, the Washington VAAC reported an ash emission from Colima on 8 July to an unknown height. Ash was not visible on satellite imagery.
Source: Washington Volcanic Ash Advisory Center (VAAC)
Based on information from the Mexico City MWO, the Colima Observatory, and satellite data, the Washington VAAC reported that there were several eruptions at Colima during 1-3 April. The highest rising resultant ash plume reached ~7.9 km (26,000 ft) a.s.l. after an eruption on 2 April at 1052.
Source: Washington Volcanic Ash Advisory Center (VAAC)
Based on information from the Mexico City MWO, the Washington VAAC reported that there were several emissions from Colima during 26-27 March. The highest rising plume reached 6.1 km (20,000 ft) a.s.l. on the 26th.
Source: Washington Volcanic Ash Advisory Center (VAAC)
Several small explosions occurred at Colima during 22-26 February. Based on information from the Mexico City MWO, the Washington VAAC reported that an explosion on 22 February produced an ash cloud to an estimated height of 9.1 km (30,000 ft) a.s.l. that drifted NE.
Sources: Washington Volcanic Ash Advisory Center (VAAC); Centro Universitario de Estudios Vulcanológicos (CUEV) - Universidad de Colima
During 4-7 February, small explosions occurred at Colima. The highest resultant ash plume reached ~8.5 km (28,000 ft) a.s.l. on 4 February.
Sources: Washington Volcanic Ash Advisory Center (VAAC); Centro Universitario de Estudios Vulcanológicos (CUEV) - Universidad de Colima
During 11-15 January, several small explosions at Colima produced ash plumes. The highest rising ash plume was produced by an explosion on 11 December and reached ~9.1 km (30,000 ft) a.s.l. The plume drifted ENE.
Sources: Washington Volcanic Ash Advisory Center (VAAC); Centro Universitario de Estudios Vulcanológicos (CUEV) - Universidad de Colima
During 4-9 January, several small explosions at Colima produced ash plumes. The highest rising ash plume was produced by an explosion on 9 January and reached ~6.7 km (22,000 ft) a.s.l. The plume drifted NE and SW.
Sources: Washington Volcanic Ash Advisory Center (VAAC); Centro Universitario de Estudios Vulcanológicos (CUEV) - Universidad de Colima
During 28 December to 2 January, several small explosions occurred at Colima, producing ash plumes that reached ~6.1-7.6 km (20,000-25,000 ft) a.s.l. on 2 January.
Sources: Washington Volcanic Ash Advisory Center (VAAC); Centro Universitario de Estudios Vulcanológicos (CUEV) - Universidad de Colima
During 21-27 December, several small explosions occurred at Colima, producing ash plumes that reached ~6.7 km (22,000 ft) a.s.l. on 26 December.
Sources: Washington Volcanic Ash Advisory Center (VAAC); Centro Universitario de Estudios Vulcanológicos (CUEV) - Universidad de Colima
During 12-19 December, several small explosions occurred at Colima, producing ash plumes that reached ~5.2 km (17,000 ft) a.s.l. on 15 December. Explosions on 12 December resulted in small amounts of ash deposited in areas SW of the volcano.
Sources: Washington Volcanic Ash Advisory Center (VAAC); Centro Universitario de Estudios Vulcanológicos (CUEV) - Universidad de Colima
Several small explosions occurred at Colima during 23-28 November, producing plumes that reached a maximum height of ~8.5 km (28,000 ft) a.s.l. on 24 November.
Sources: Washington Volcanic Ash Advisory Center (VAAC); Centro Universitario de Estudios Vulcanológicos (CUEV) - Universidad de Colima
Several small explosions occurred at Colima during 16-21 November that produced steam-and-ash clouds to low levels above the volcano.
Sources: Washington Volcanic Ash Advisory Center (VAAC); Centro Universitario de Estudios Vulcanológicos (CUEV) - Universidad de Colima
Several small explosions occurred at Colima during 9-10 November, producing plumes that rose to ~5.2 km (17,000 ft) a.s.l.
Sources: Washington Volcanic Ash Advisory Center (VAAC); Centro Universitario de Estudios Vulcanológicos (CUEV) - Universidad de Colima
Several small explosions occurred at Colima during 2-8 November, producing ash plumes that rose to a maximum height of ~7.6 km (25,000 ft) a.s.l. on 4 November.
Sources: Washington Volcanic Ash Advisory Center (VAAC); Centro Universitario de Estudios Vulcanológicos (CUEV) - Universidad de Colima
During 26-31 October, several small eruptions occurred at Colima, with ash plumes rising as high as ~6.1 km (20,000 ft) a.s.l. on 27 October.
Sources: Washington Volcanic Ash Advisory Center (VAAC); Centro Universitario de Estudios Vulcanológicos (CUEV) - Universidad de Colima
During 19-20 and 25 October, several small explosions occurred at Colima, with ash plumes rising as high as ~7.6 km (25,000 ft) a.s.l. on the 19th.
Sources: Washington Volcanic Ash Advisory Center (VAAC); Centro Universitario de Estudios Vulcanológicos (CUEV) - Universidad de Colima
During 5-11 October, several small explosions occurred at Colima. Based on information from the Mexico City MWO, the Washington VAAC reported that an ash plume rose to ~6.7 km (22,000 ft) a.s.l. on 11 October.
Sources: Washington Volcanic Ash Advisory Center (VAAC); Centro Universitario de Estudios Vulcanológicos (CUEV) - Universidad de Colima
During 28 September to 3 October, several small explosions occurred at Colima. Based on information from the Mexico City MWO, the Washington VAAC reported that a plume was emitted on 28 September that rose to a height of ~6.1 km (20,000 ft) a.s.l. and drifted NNW.
Sources: Washington Volcanic Ash Advisory Center (VAAC); Centro Universitario de Estudios Vulcanológicos (CUEV) - Universidad de Colima
During 22-27 September, several small explosions occurred at Colima. The largest explosion took place on 27 September at 0507 and produced a plume to a height of ~3.8 km above the volcano (or 25,100 ft a.s.l.). The plume drifted WSW, depositing small amounts of ash in the cities of Colima, Villa de Alvarez, and Comala more than 30 km from the volcano. Due to the threat of lahars forming on the volcano's flanks, Universidad de Colima advised avoiding the ravines of La Lumbre, San Antonio, Monte Grande (in Colima state), and La Arena (in Jalisco state).
Source: Centro Universitario de Estudios Vulcanológicos (CUEV) - Universidad de Colima
On 16 September at 1045 an explosion occurred at Colima. According to the Washington VAAC, the resultant ash plume rose to ~9.8 km (32,000 ft) a.s.l. The local civil defense agency stated in a news article that ash fell on towns NW of the volcano. Prior to the explosion, microseismicity was recorded for several days. Universidad de Colima reported that microseismicity often precedes considerable explosions. During 18-19 September, seven small explosions occurred.
Sources: Washington Volcanic Ash Advisory Center (VAAC); Centro Universitario de Estudios Vulcanológicos (CUEV) - Universidad de Colima; Associated Press
During 7-12 September, several small explosions occurred at Colima. Due to the threat of lahars forming on the volcano's flanks, Universidad de Colima advised avoiding the ravines of La Lumbre, San Antonio, Monte Grande (in Colima state), and La Arena (in Jalisco state).
Source: Centro Universitario de Estudios Vulcanológicos (CUEV) - Universidad de Colima
During 31 August to 6 September, several small explosions occurred at Colima. On 31 August during 1245-1330, a seismic signal associated with a lahar was recorded at the Monte Grande station. The lahar caused no damage. Due to the threat of lahars forming on the volcano's flanks, Universidad de Colima advised avoiding the ravines of La Lumbre, San Antonio, Monte Grande (in Colima state), and La Arena (in Jalisco state).
Source: Centro Universitario de Estudios Vulcanológicos (CUEV) - Universidad de Colima
During 24-29 August, several small explosions occurred at Colima. Due to the threat of lahars forming on the volcano's flanks, Universidad de Colima advised avoiding the ravines of La Lumbre, San Antonio, Monte Grande (in Colima state), and La Arena (in Jalisco state).
Source: Centro Universitario de Estudios Vulcanológicos (CUEV) - Universidad de Colima
During 17- 22 August, small explosions at Colima produced low-level ash plumes. The largest events occurred on 21 and 22 August, producing plumes that drifted W. Due to the threat of lahars forming on the volcano's flanks, Universidad de Colima advised avoiding the ravines of La Lumbre, San Antonio, Monte Grande (in Colima state), and La Arena (in Jalisco state).
Source: Centro Universitario de Estudios Vulcanológicos (CUEV) - Universidad de Colima
On 15 and 16 August, small explosions at Colima produced low-level ash plumes. Due to the threat of lahars forming on the volcano's flanks, Universidad de Colima advised avoiding the ravines of La Lumbre, San Antonio, Monte Grande (in Colima state), and La Arena (in Jalisco state).
Source: Centro Universitario de Estudios Vulcanológicos (CUEV) - Universidad de Colima
On 4 August the Washington VAAC reported that the Mexico City MWO observed a steam plume coming from Colima rising to 7.2 km (24,000 ft) a.s.l. in imagery from the Colima video camera. Due to the threat of lahars forming on the volcano's flanks, Universidad de Colima advised avoiding the ravines of La Lumbre, San Antonio, Monte Grande (in Colima state), and La Arena (in Jalisco state).
Sources: Washington Volcanic Ash Advisory Center (VAAC); Centro Universitario de Estudios Vulcanológicos (CUEV) - Universidad de Colima
During 29 July to 1 August, steam-and-ash emissions occurred from Colima. According to the Washington VAAC, the highest-rising emission reached 6.1 km (~20,000 ft) a.s.l. on 30 July. Due to the threat of lahars forming on the volcano's flanks, Universidad de Colima advised avoiding the ravines of La Lumbre, San Antonio, Monte Grande (in Colima state), and La Arena (in Jalisco state).
Sources: Washington Volcanic Ash Advisory Center (VAAC); Centro Universitario de Estudios Vulcanológicos (CUEV) - Universidad de Colima
On 21 and 23 July, small ash emissions and lahars occurred at Colima. On the 21st during 1750-1830 a lahar traveled SSE down the Monte Grande ravine. Emissions rose to a maximum height of 9.1 km (30,000 ft) a.s.l. on 27 July. Due to the threat of lahars forming on the volcano's flanks, Universidad de Colima advised avoiding the ravines of La Lumbre, San Antonio, Monte Grande (in Colima state), and La Arena (in Jalisco state).
Source: Centro Universitario de Estudios Vulcanológicos (CUEV) - Universidad de Colima
Several explosions occurred at Colima during 13-18 July, and small landslides traveled down the volcano's flanks during 15-18 July. Due to the threat of lahars forming on the volcano's flanks, Universidad de Colima advised avoiding the ravines of La Lumbre, San Antonio, Monte Grande (in Colima state), and La Arena (in Jalisco state).
Source: Centro Universitario de Estudios Vulcanológicos (CUEV) - Universidad de Colima
Several explosions occurred at Colima during 6-9 July and small landslides traveled down the volcano's flanks during 8-9 July. Due to the threat of lahars forming on the volcano's flanks, Universidad de Colima advised avoiding the ravines of La Lumbre, San Antonio, Monte Grande (in Colima state), and La Arena (in Jalisco state).
Source: Centro Universitario de Estudios Vulcanológicos (CUEV) - Universidad de Colima
Ash emission continued at Colima during 29 June to 5 July. On 30 June, lahars traveled SW down La Lumbre Ravine and SSE down Montegrande Ravine to a maximum length of ~10 km. The lahars did not reach populated areas. Due to heavy rain, and ash on the flanks of the volcano, Universidad de Colima advised avoiding the ravines of La Lumbre, San Antonio, Monte Grande (in Colima state), and La Arena (in Jalisco state). The Washington VAAC reported that the Colima video camera and satellite imagery confirmed that an explosive eruption occurred at Colima on 5 July at 1821. The Mexico City MWO reported that the resultant ash plume reached a height of ~9.1 km (~29,900 ft) a.s.l. and drifted NW. According to the Colima Volcano Observatory, pyroclastic flows accompanying the eruption traveled down Colima's E flank.
Sources: Washington Volcanic Ash Advisory Center (VAAC); Centro Universitario de Estudios Vulcanológicos (CUEV) - Universidad de Colima
Several explosions occurred at Colima 22-28 June, reached ~5.5 km (18,040 ft) a.s.l., and drifted W-NW.
Source: Centro Universitario de Estudios Vulcanológicos (CUEV) - Universidad de Colima
Several explosions occurred at Colima during June 15-21, reaching a maximum height of ~6.1 km (20,000 ft) a.s.l.
Sources: Washington Volcanic Ash Advisory Center (VAAC); Centro Universitario de Estudios Vulcanológicos (CUEV) - Universidad de Colima
On 6 June at 2305 an explosion from Colima produced an ash plume to a height of ~8.5 km (27,900 ft) a.s.l. The ash plume traveled SW at a speed of ~70 km/hour, and ash fell in and around the cities of Colima (~30 km away) and Villa de Alvarez. On 11 June Universidad de Colima reported that a small lava dome was visible in Colima's crater. According to news articles, nearly 50 people who were evacuated from near the volcano during the previous week returned to their homes on 13 June.
Sources: Washington Volcanic Ash Advisory Center (VAAC); Centro Universitario de Estudios Vulcanológicos (CUEV) - Universidad de Colima; Associated Press; Associated Press
Several explosions occurred at Colima during 1-7 June. On 1 June at 2350 and on 2 June at 0022 explosions produced plumes to heights of ~6.1 km (20,000 ft) a.s.l. The plumes drifted SSW, depositing ash in the towns of Colima and Villa de Alvarez. A large explosion on 5 June at 1420 produced pyroclastic flows, and generated an ash cloud to a height of ~8.9 km (29,200 ft) a.s.l. According to news reports, on 7 June officials in nearby Jalisco state announced a voluntary evacuation of the three villages nearest to the crater, and people in nearby towns were warned to be prepared to evacuate.
Sources: Washington Volcanic Ash Advisory Center (VAAC); Centro Universitario de Estudios Vulcanológicos (CUEV) - Universidad de Colima; Associated Press
The largest eruption at Colima in the past 20 years occurred on 30 May at 0326. Pyroclastic flows that accompanied the eruption traveled W. Satellite imagery showed a portion of an ash cloud produced during the eruption at a height of ~8.5 km (~27,900 ft) a.s.l. extending SE, and a lower portion of the cloud at ~5.4 km (~17,700 ft) a.s.l. extending NE. One hour and 48 minutes after the eruption, the higher cloud extended ~100 km SE, and the lower portion of the cloud extended ~80 km NE. Due to the heightened volcanic activity, the exclusion zone was increased from a 6.5-km radius to a 7.5-km radius and restrictions to access remained within a radius of 11.5 km from the volcano's summit. No evacuations were ordered. According to a news article, ashfall caused the closure of an airport in the city of Colima, ~30 km away.
Sources: Washington Volcanic Ash Advisory Center (VAAC); Centro Universitario de Estudios Vulcanológicos (CUEV) - Universidad de Colima; Los Angeles Times
The largest eruption at Colima since 1999 occurred on 23 May at 1910. The eruption produced a plume that rose to ~5.8 km above the volcano (~31,700 ft a.s.l.) and drifted W. Pyroclastic flows traveled 4-5 km, mainly down San Antonio (SSW) and Monte Grande (SSE) ravines. Ash plumes rising above the pyroclastic flow drifted E.
Sources: Washington Volcanic Ash Advisory Center (VAAC); Centro Universitario de Estudios Vulcanológicos (CUEV) - Universidad de Colima; Reuters; Associated Press
Explosions during 11-17 May generated pyroclastic flows down all flanks of the volcano on at least three occasions. Incandescence was seen on a video camera late on 15 May, followed by an ash eruption that rose to 7.6 km altitude (25,000 feet) and moved E.
Sources: Washington Volcanic Ash Advisory Center (VAAC); Centro Universitario de Estudios Vulcanológicos (CUEV) - Universidad de Colima
Several explosions occurred from Colima during 4-10 May, with local light ashfall. The Washington VAAC identified ash to a maximum altitude of 7.6 km a.s.l. (25,000 feet) on 10 May. Satellite imagery also indicated a thermal anomaly at the summit during this period.
Sources: Washington Volcanic Ash Advisory Center (VAAC); Centro Universitario de Estudios Vulcanológicos (CUEV) - Universidad de Colima
Several explosions occurred at Colima during 20-25 April. According to the Washington VAAC, an explosion on 20 April produced an ash plume to a height of ~6.1 km (~20,000 ft) a.s.l.
Sources: Centro Universitario de Estudios Vulcanológicos (CUEV) - Universidad de Colima; Washington Volcanic Ash Advisory Center (VAAC)
During 13-18 April there were several explosions at Colima. According to the Washington VAAC, resultant ash plumes rose to a maximum height of ~6.7 km (~22,000 ft) a.s.l. An explosion on 19 April at 2056 sent incandescent material down the volcano's flanks that did not exceed the established safety limits. On 20 April at 0705 a smaller explosion occurred. No evacuations were necessary.
Sources: Centro Universitario de Estudios Vulcanológicos (CUEV) - Universidad de Colima; Washington Volcanic Ash Advisory Center (VAAC)
During 6-11 April there were several explosions at Colima. According to the Washington VAAC, resultant ash plumes rose to a maximum height of ~9.1 km (~30,000 ft) a.s.l.
Sources: Centro Universitario de Estudios Vulcanológicos (CUEV) - Universidad de Colima; Washington Volcanic Ash Advisory Center (VAAC)
During 30 March to 4 April there were several explosions at Colima. According to the Washington VAAC, resultant ash plumes rose to a maximum height of ~6.7 km (~22,000 ft) a.s.l.
Sources: Centro Universitario de Estudios Vulcanológicos (CUEV) - Universidad de Colima; Washington Volcanic Ash Advisory Center (VAAC)
During 23-29 March there were several ash emissions from Colima. Resultant ash plumes rose to a maximum height of ~7.6 km (~24,900 ft) a.s.l.
Source: Washington Volcanic Ash Advisory Center (VAAC)
An eruption at Colima on 10 March at 0810 produced pyroclastic flows that traveled up to 3 km down the volcano's flanks in all directions. In addition, an E-drifting ash cloud was generated that rose to a height of ~2 km above the crater. Ash fell in and near the cities of Guzmán and Jalisco. On 13 March at 1528 a large explosion produced a pyroclastic flow down several ravines: El Muerto, Montegrande, San Antonio, and the eastern part of El Cordobán. According to the Mexico City MWO, an ash plume rose to ~5 km above the crater. Ash and rock fragments fell in the towns of Mazos and Jalisco, ~12.5 km NE of the volcano.
Sources: Centro Universitario de Estudios Vulcanológicos (CUEV) - Universidad de Colima; Washington Volcanic Ash Advisory Center (VAAC)
During 23-28 February, several small explosions at Colima produced ash plumes that rose to low levels; plumes drifted predominately W.
Source: Centro Universitario de Estudios Vulcanológicos (CUEV) - Universidad de Colima
During 16-21 February, several small explosions at Colima produced ash plumes that rose to low levels; plumes drifted predominately SE and W.
Source: Centro Universitario de Estudios Vulcanológicos (CUEV) - Universidad de Colima
During 9-15 February, several small explosions at Colima sent ash to low altitudes. An explosion on 12 February was accompanied by a pyroclastic flow that traveled ~2.5 km SE down the Montegrande and San Antonio ravines (See video of the event).
Source: Centro Universitario de Estudios Vulcanológicos (CUEV) - Universidad de Colima
During 26-31 January, several small ash explosions at Colima produced plumes that traveled NE. According to the Washington VAAC, the highest rising ash plume reached ~6.4 km a.s.l.
Sources: Centro Universitario de Estudios Vulcanológicos (CUEV) - Universidad de Colima; Washington Volcanic Ash Advisory Center (VAAC)
During 19-24 January, several explosions occurred daily at Colima. Ash plumes produced from these eruptions drifted predominately SE.
Source: Centro Universitario de Estudios Vulcanológicos (CUEV) - Universidad de Colima
According to the Washington VAAC, during 12-18 January small eruptions from Colima generated steam-and-ash plumes. These plumes rose as high as ~6.7 km a.s.l. and extended as far as ~50 km from the volcano.
Source: Washington Volcanic Ash Advisory Center (VAAC)
According to the Washington VAAC, 6 January a steam-and-ash plume was visible at Colima on satellite imagery. The plume rose to ~7 km a.s.l. and extended as far as ~38 km NW. On 9 January, two steam-and-ash plumes rose simultaneously from the volcano. One plume rose to ~7 km a.s.l. and extended ~30 km NE, while the other plume reached ~4.5 km a.s.l. and extended ~26 km W.
Source: Washington Volcanic Ash Advisory Center (VAAC)
According to the Washington VAAC, on 30 December an ash plume was visible at Colima on satellite imagery. The plume rose to ~7 km a.s.l. and extended as far as ~37 km E. Late on 30 December a second steam-and-ash plume rose to ~7 km a.s.l. and extended E. On 1 January an eruption produced a steam-and-ash plume that reached ~5.5 km a.s.l. and extended ~33 km N.
Source: Washington Volcanic Ash Advisory Center (VAAC)
During 15-18 December, explosions at Colima produced ash plumes that drifted predominately NE of the volcano.
Source: Centro Universitario de Estudios Vulcanológicos (CUEV) - Universidad de Colima
During 8-14 December, explosions continued at Colima. On 13 December plumes drifted NE.
Source: Centro Universitario de Estudios Vulcanológicos (CUEV) - Universidad de Colima
Small explosions continued to occur at Colima during 2-6 December. Ash plumes produced from explosions on 6 December drifted primarily NE.
Source: Centro Universitario de Estudios Vulcanológicos (CUEV) - Universidad de Colima
During 26-30 November, several small explosions occurred at Colima. Based on information from the Mexico City MWO, the Washington VAAC reported that a steam-and-ash emission occurred on 25 November. Satellite imagery showed the plume at a height of ~6 km a.s.l.
Sources: Centro Universitario de Estudios Vulcanológicos (CUEV) - Universidad de Colima; Washington Volcanic Ash Advisory Center (VAAC)
During 16-22 November, block-lava flows continued to travel down Colima's N, W, NW, and S flanks as they have since 30 September. The lava flow on the N flank is 2200 m long and approximately 330 m wide. The lava flow advancing on the NW flank is at least 600 m long by 200 m at its widest part. Several small explosions occurred daily.
Source: Centro Universitario de Estudios Vulcanológicos (CUEV) - Universidad de Colima
During 10-15 November, block-lava flows continued to travel down Colima's N, W, NW, and S flanks as they have since 30 September. Several explosions occurred daily during the report period. Block-and-ash flows spilling from the fronts of the advancing lava flows on the W flank remained within ~2 km of the summit.
According to the Washington VAAC, satellite imagery from 1615 on 10 November indicated a plume moving N from Colima to a height of ~5 km a.s.l. The plume, consisting mostly of steam and a little ash, was emitted around 1610; by 1745 it had drifted ~45 km N.
Sources: Centro Universitario de Estudios Vulcanológicos (CUEV) - Universidad de Colima; Washington Volcanic Ash Advisory Center (VAAC)
During 5-7 November, block-lava flows continued to travel down Colima's N, W, NW, and S flanks as they have since 30 September. Several explosions occurred daily. By 8 November, the block-lava flows on the N flank was about 2,200 m long and about 330 m wide reaching to the N wall of the caldera. On the WNW flank, block-lava reached about 600 m long and 200 m wide at its widest point. During the report period, block-and-ash flows spilling from the fronts of the advancing block-lava flows on the W flank reached ~2 km from the summit.
Source: Centro Universitario de Estudios Vulcanológicos (CUEV) - Universidad de Colima
During 27 October to 1 November, block-lava flows continued to travel down Colima's N, W, NW, and S flanks as they have since 30 September. Several explosions occurred daily. By 1 November, the block-lava flows on the N flank reached about 1,800 m long and about 200 m wide, and on the WNW flank block-lava reached about 600 m long and 200 m wide at its widest point. During the report period, block-and-ash flows spilling from the fronts of the advancing block-lava flows on the W flank reached ~2 km from the summit.
Source: Centro Universitario de Estudios Vulcanológicos (CUEV) - Universidad de Colima
During 22-26 October, block-lava flows continued to travel down Colima's N, NW, W, and S flanks as they have since 30 September. On the 26th, the block-lava flows on the N flank reached a length of ~1,800 m and a width of 200 m, and on the WNW flank the block-lava reached a length of ~600 m and a width of 200 m. On the 22nd, the volcano's gas output included 840 metric tons of sulfur dioxide. During the report period, block-and-ash flows spilling from the fronts of the advancing block-lava flows reached ~ 2 km from the summit.
Source: Centro Universitario de Estudios Vulcanológicos (CUEV) - Universidad de Colima
During 13-19 October, block-lava flows continued to travel down Colima's N, W, NW, and S flanks as they have since 30 September. Several explosions occurred daily. By 16 October, the block-lava flows on the N flank reached at least 1,500 m long and about 150 m wide, and on the WNW flank block-lava reached at least 600 m long and 200 m wide at its widest point. During the report period, block-and-ash flows spilling from the fronts of the advancing block-lava flows on the W flank reached ~2 km from the summit. Sulfur-dioxide flux reached a maximum value of about 880 tons on 15 October.
Source: Centro Universitario de Estudios Vulcanológicos (CUEV) - Universidad de Colima
During 6-11 October, block-lava flows continued to travel down Colima's N, NW, W, and S flanks as they have since 30 September. On 6 October, the block-lava flows on the N flank reached a length of ~600 m and a width of 150 m, and on the WNW flank the block-lava reached a length of ~250 m. About 32 explosions occurred that day, producing plumes to ~400 m above the volcano. On 11 October, a block-lava flow on the N flank reached a length of ~900 m and a width of ~150 m, and on the WNW flank the block-lava flow reached a length of ~300 m and a width of ~200 m. About 27 small explosions again produced plumes to a height of ~400 m above the volcano. During the report period, block-and-ash flows spilling from the fronts of the advancing block-lava flows reached ~ 2 km from the summit.
Source: Centro Universitario de Estudios Vulcanológicos (CUEV) - Universidad de Colima
A new growing lava dome was sighted in Colima's summit crater on 28 September, following three days of vigorous fumarolic emissions. Starting on 30 September, block-and-ash flows moved down the volcano's W, WNW, and N flanks. Blocks of lava began to travel down the volcano's N and WNW flanks around 1 October, reaching lengths of ~300 m on the N flanks and ~100 m on the WNW. On 5 October, block-and-ash flows continued to travel as far as 2 km, and about 30 small explosions produced plumes to a maximum height of 400 m above the volcano.
Source: Centro Universitario de Estudios Vulcanológicos (CUEV) - Universidad de Colima
Low-intensity volcanic activity continued at Colima through 27 September, with about two ash explosions occurring per day. The plumes produced from these explosions did not rise more than 2 km above the volcano and predominately drifted W.
Source: Centro Universitario de Estudios Vulcanológicos (CUEV) - Universidad de Colima
On 30 August, low-level activity continued at Colima with an average of less than three ash-containing explosions per day. The resultant plumes did not rise higher than 2 km above the crater and predominately drifted W.
Source: Centro Universitario de Estudios Vulcanológicos (CUEV) - Universidad de Colima
According to Universidad de Colima, low-level volcanic activity continued around 7-9 August at Colima with an average of less than three ash-containing explosions per day. Ash plumes produced from these explosions did not exceed heights of 3 km above the crater and mainly drifted W.
Sources: Washington Volcanic Ash Advisory Center (VAAC); Centro Universitario de Estudios Vulcanológicos (CUEV) - Universidad de Colima
According to Universidad de Colima, during 27 July to 2 August an average of three ash-containing emissions occurred at Colima daily. The emissions did not rise higher than 3 km above the crater and mainly drifted W. The Washington VAAC reported that ash plumes were visible on satellite imagery during several days.
Sources: Washington Volcanic Ash Advisory Center (VAAC); Centro Universitario de Estudios Vulcanológicos (CUEV) - Universidad de Colima
Low-level activity continued at Colima, with an average of three ash explosions occurring daily. The most significant events occurred on 7 and 11 July. The ash columns were all less than 2 km above the volcano (under ~6 km a.s.l.).
Source: Centro Universitario de Estudios Vulcanológicos (CUEV) - Universidad de Colima
On 29 June and 4 July low-level volcanic activity continued at Colima, with an average of three ash explosions occurring daily. The resultant ash plumes did not exceed heights of 2 km above the crater.
Source: Centro Universitario de Estudios Vulcanológicos (CUEV) - Universidad de Colima
On 21 June low-level activity continued at Colima, with an average of three ash explosions occurring daily. The resultant ash plumes did not exceed heights of 2 km above the crater.
Source: Centro Universitario de Estudios Vulcanológicos (CUEV) - Universidad de Colima
During late May low-level activity continued at Colima, with an average of two ash-containing explosions per day. The eruption clouds did not exceed 2 km above the volcano's crater and predominately drifted W.
Source: Centro Universitario de Estudios Vulcanológicos (CUEV) - Universidad de Colima
Universidad de Colima reported on 15 May that low-intensity activity continued at Colima, with an average of three ash-containing explosions daily during the previous few days. The plumes rose to less than 2 km above the volcano and drifted W, N, and E. Some explosions produced pyroclastic flows to distances less than 2 km. On 14 May at 1028 an explosion produced a plume to ~2 km above the volcano that drifted E. In addition, three small pyroclastic flows traveled down the volcano's W, N, and E flanks.
Sources: Washington Volcanic Ash Advisory Center (VAAC); Centro Universitario de Estudios Vulcanológicos (CUEV) - Universidad de Colima
Based on information from ground observers and the Mexico City MWO, the Washington VAAC reported that an ash emission from Colima on 14 April rose to ~5.5 km a.s.l. and extended less than 18.5 km E.
Source: Washington Volcanic Ash Advisory Center (VAAC)
Based on information from ground observers and the Mexico City MWO, the Washington VAAC reported that an ash emission from Colima on 12 April rose to ~4.9 a.s.l.
Source: Washington Volcanic Ash Advisory Center (VAAC)
Based on information from the Mexico City MWO, the Washington VAAC reported that there was an emission from Colima on 21 March. An ash plume was visible on satellite imagery at a height around 6 km a.s.l. extending S.
Source: Washington Volcanic Ash Advisory Center (VAAC)
Based on information from the Mexico City MWO, the Washington VAAC reported that an emission from Colima on 15 March at 2014 reached ~4.3 km a.s.l. No ash was visible on satellite imagery.
Source: Washington Volcanic Ash Advisory Center (VAAC)
According to the Universidad de Colima, during 17-20 February volcanic activity slightly decreased at Colima in comparison to the previous week. About three explosions occurred daily, producing ash columns to 2-3 km above the crater. Most of the columns drifted ENE and NE, depositing ash on the volcano's flanks. According to the Washington VAAC, during 24 February to 1 March several explosions produced plumes to ~3 km above the volcano.
Sources: Washington Volcanic Ash Advisory Center (VAAC); Centro Universitario de Estudios Vulcanológicos (CUEV) - Universidad de Colima
According to the Washington VAAC, during 17-22 February there were several steam-and-ash emissions from Colima, with the highest rising plumes reaching ~6 km a.s.l.
Source: Washington Volcanic Ash Advisory Center (VAAC)
The Universidad de Colima reported that as of 10 February about five explosions occurred at Colima daily, which was slightly more than during the previous few months. Ash columns rose 2-3 km above the crater and predominately drifted NE and ENE. A significant explosion on 9 February at 0958 produced a plume to ~3.6 km above the volcano that drifted NE. According to the Washington VAAC, during 12-17 February ash plumes were sometimes visible on satellite imagery at a maximum height of ~3 km above the crater.
Sources: Centro Universitario de Estudios Vulcanológicos (CUEV) - Universidad de Colima; Washington Volcanic Ash Advisory Center (VAAC)
Based on information from the Mexico City MWO, the Washington VAAC reported that a 4-minute-long emission from Colima on 6 February produced a plume to ~6 km a.s.l. that drifted NE. There were also several minor emissions during 5-6 February. An ash emission on 9 February reached ~7.6 km a.s.l. and drifted E (according to MWO) or NE (according to Washington VAAC satellite imagery).
Source: Washington Volcanic Ash Advisory Center (VAAC)
During January, an average of three explosions per day occurred at Colima. The resultant ash plumes rose 2-3 km above the crater and mostly drifted NE and ENE.
Source: Centro Universitario de Estudios Vulcanológicos (CUEV) - Universidad de Colima
Based on information from the Mexico City MWO, the Washington VAAC reported that an eruption at Colima on 30 December produced an ash plume to a height of ~10.4 km a.s.l. The plume drifted NE and a small area of ash was visible on satellite imagery.
Source: Washington Volcanic Ash Advisory Center (VAAC)
Ash clouds from eruptions at Colima on 19 December were visible on satellite imagery at a maximum height of ~8.5 km a.s.l., extending up to ~15 km E.
Sources: Washington Volcanic Ash Advisory Center (VAAC); Centro Universitario de Estudios Vulcanológicos (CUEV) - Universidad de Colima
As of 12 December there was an average of three explosions per day at Colima that rose 2-3 km above the crater. Most of the ash from these explosions drifted ENE. A significant explosion on 11 December at 0258 sent volcanic bombs down the NE and N flanks and deposited ash in the city of Ciudad Guzmán, 25 km to the NE. According to the Washington VAAC, ash from an explosion on 14 December was visible on satellite imagery at a height of ~6 km a.s.l.
Sources: Washington Volcanic Ash Advisory Center (VAAC); Centro Universitario de Estudios Vulcanológicos (CUEV) - Universidad de Colima
On 1 and 2 December, ash clouds from Colima were visible on satellite imagery at a maximum height of ~7 km a.s.l.
Source: Washington Volcanic Ash Advisory Center (VAAC)
On 1 and 2 December, ash clouds from Colima were visible on satellite imagery at a maximum height of ~7 km a.s.l.
Source: Washington Volcanic Ash Advisory Center (VAAC)
A subtle ash plume, visible in satellite imagery, was emitted from Colima on 18 November at 1900 and rose to ~5.5 km a.s.l.
Source: Washington Volcanic Ash Advisory Center (VAAC)
On 30 October two small eruptions occurred at Colima that consisted of mostly steam and some ash. The plumes rose to about 7.3 km a.s.l. and mainly drifted W.
Source: Washington Volcanic Ash Advisory Center (VAAC)
Based on information from the Mexico City MWO, the Washington VAAC reported that on 16 October at 1202 ash was emitted from Colima and rose to a height of ~6 km a.s.l. On 18 October an ash plume rose to ~7.3 km a.s.l. Neither plume was visible on satellite imagery.
Source: Washington Volcanic Ash Advisory Center (VAAC)
As of 10 October, volcanic activity at Colima consisted of an average of two explosions per day producing ash clouds that rose to ~2 km above the crater and drifted predominately W. On 7 October rain from Tropical Storm Olaf inundated the Colima area with 150 mm of rain in less than 2 hours. The heavy rain mixed with material on the volcano's S flank, producing a lahar down the Montegrande ravine. According to the Washington VAAC, on 9 and 10 October ash clouds were visible on satellite imagery rising to a maximum height of ~5 km above the volcano.
Sources: Washington Volcanic Ash Advisory Center (VAAC); Centro Universitario de Estudios Vulcanológicos (CUEV) - Universidad de Colima
Based on information from the Mexico City MWO, the Washington VAAC reported that on 6 September at 1026 a strong ash emission occurred at Colima. The resultant ash cloud rose to ~6.7 km a.s.l. and drifted N. Ash was not visible on satellite imagery. Another ash emission occurred on 8 September that was visible on the Colima video camera.
Source: Washington Volcanic Ash Advisory Center (VAAC)
According to the Universidad de Colima, an explosion at Colima on 28 August at 2352 produced an ash plume that rose to a height of ~3 km above the volcano's crater. The explosion was accompanied by pyroclastic flows that traveled 2 km down the S flank and volcanic blocks. Residents of the city of Colima, ~32 km from the volcano, heard the explosion and ash fell in the town of Grullo, ~60 km NW of the volcano. Seismic data revealed that this explosion was similar in size to one on 2 August.
Sources: Centro Universitario de Estudios Vulcanológicos (CUEV) - Universidad de Colima; Associated Press; Washington Volcanic Ash Advisory Center (VAAC)
Based on information from the Control Tower at Colima airport, the Washington VAAC reported that an emission from Colima on 3 August at 0739 produced a plume to ~7.6 km a.s.l. On 4 August at 0845 a small ash emission occurred that was visible on satellite imagery. The Mexico City MWO reported that the cloud rose to ~ 6 km a.s.l. and drifted W.
Source: Washington Volcanic Ash Advisory Center (VAAC)
On 17 July an explosion at Colima sent incandescent volcanic material to ~500 m above the volcano and produced a SW-drifting ash cloud to a height of ~ 3 km above the volcano. At least five pyroclastic flows traveled down the volcano's flanks to a maximum distance of ~2 km.
Source: Centro Universitario de Estudios Vulcanológicos (CUEV) - Universidad de Colima
Based on information from the Mexico City MWO, the Washington VAAC reported that an emission occurred at Colima on 11 July at 2045. Extensive meteorological cloud cover made detecting ash on satellite images difficult. An eruption began on 15 July at about 0914 that produced an ash cloud to a height of ~9.1 km a.s.l. A narrow ash plume was visible on satellite imagery.
Source: Washington Volcanic Ash Advisory Center (VAAC)
During June at Colima, incandescence was visible during some evenings. Tremor associated with emissions was relatively low and no significant deformation was detected. The 6.5-km-radius exclusion zone around Colima remained in effect, with other restrictions to access extending 11.5 km from the volcano's summit.
Source: Centro Universitario de Estudios Vulcanológicos (CUEV) - Universidad de Colima
Based on information from the México City MWO, the Washington VAAC reported an emission from Colima on 27 May at 2014. The resultant plume rose to ~6 km a.s.l. No ash was visible on satellite imagery.
Source: Washington Volcanic Ash Advisory Center (VAAC)
According to the Universidad de Colima, lava flows have not been seen at Colima since early March, contrary to reports of lava flows visible on 6 May. As of about 18 May activity at Colima consisted of about 25 small explosions per day, with some containing ash. Ash dispersal was limited to ~7 km from the summit.
Source: Centro Universitario de Estudios Vulcanológicos (CUEV) - Universidad de Colima
During 6-11 May, several ash emissions occurred at Colima. Based on information from the Mexico City MWO, the Washington VAAC reported that the largest eruption during the report period occurred on 6 May and produced an ash cloud to ~6 km a.s.l. In addition, lava flows traveled down the volcano's S flank.
Source: Washington Volcanic Ash Advisory Center (VAAC)
In the midst of an interval of ongoing tranquility, small explosive eruptions came from Colima on 2 May generating minor ash clouds visible on satellite imagery and local video monitoring. The ash clouds apparently rose no more than about 500 m above the crater.
Source: Centro Universitario de Estudios Vulcanológicos (CUEV) - Universidad de Colima
Universidad de Colima reported that lava effusion ceased at Colima by the end of February. In April incandescence was visible at the volcano's summit when sudden gas emissions occurred. Tremor remained at low levels and was usually associated with emissions. No significant deformation was recorded. The 6.5-km-radius exclusion zone around Colima remained in effect, with other restrictions to access extending 11.5 km from the volcano's summit.
Source: Centro Universitario de Estudios Vulcanológicos (CUEV) - Universidad de Colima
Universidad de Colima reported that on 13 January volcanism was at relatively low levels at Colima. Lava slowly flowed to the W and SW. Landslides from lava-flow fronts traveled 800-1,200 m W and SW. Incandescence was visible at the volcano's summit during the evenings. Seismicity associated with the landslides was recorded, although the number and size of the landslides diminished in comparison to the previous month. Deflation was recorded at the volcano. The 6.5-km-radius exclusion zone around Colima remained in effect, with other restrictions to access extending 11.5 km from the volcano's summit.
Source: Centro Universitario de Estudios Vulcanológicos (CUEV) - Universidad de Colima
Colima's web video camera showed an ash-and-steam plume rising to a height of ~5.5 km a.s.l. on 24 October at 0430. The plume drifted toward the N. Neither ash nor steam was visible on satellite imagery.
Source: US Air Force Weather Agency
Volcanic and seismic activity at Colima were at relatively low levels during 5-7 June. For about a week volcanic tremor was at low levels, no explosive events were detected, and incandescent lava avalanches traveled down the volcano's S, SW, and W flanks. No significant deformation was detected at the volcano, and SO2 emission rates and the number of avalanches decreased in comparison to the previous week. Lava was slowly emitted towards the W and SW. On 7 June, authorities lifted the preventative evacuation of communities on the volcano's SW and SE flanks. The 6.5-km-radius exclusion zone around Colima remained in effect, with other restrictions to access out to 11.5 km from the volcano's summit.
Source: Centro Universitario de Estudios Vulcanológicos (CUEV) - Universidad de Colima
During 28-31 May, volcanic tremor, small explosions, and lava avalanches continued to occur at Colima. On 29 May infrared images revealed that 70 landslides occurred in 11 hours and there were six emissions that included incandescent material. According to the Universidad de Colima, by 3 June activity was relatively low at Colima, similar to levels observed before 10 May. By this time activity consisted mainly of slow lava emission towards the W and SW and an average of 136 landslides per day was reported. By 3 June the level of tremor had remained the same for ~48 hours and no explosive events had occurred. During the report period, incandescent lava avalanches traveled down the volcano's S, SW, and W flanks and no significant deformation was detected at the volcano. Based on information from the Mexico City MWO, the Washington VAAC reported that a pilot observed ash between 2.7 and 4 km a.s.l. near Colima's summit on 2 June at 1318. No ash was visible on satellite imagery in clear conditions. Due to the decreased level of activity, authorities considered ending the preventative evacuation of residents in towns on the volcano's SW and SE flanks, but had not done so as of 3 June.
Sources: Washington Volcanic Ash Advisory Center (VAAC); Centro Universitario de Estudios Vulcanológicos (CUEV) - Universidad de Colima
According to the Universidad de Colima, as of 27 May strong volcanic tremor continued at Colima, and small explosions and lava avalanches occurred. Also, seismicity was recorded that was associated with landslides and degassing. Incandescent lava avalanches traveled down the SSE flank of the volcano, with sudden increases in incandescence visible for several hours. As of 24 May inflation was recorded at the volcano, but by 27 May no significant deformation was detected. The preventative evacuation of residents in towns on the volcano's SW and SE flanks remained in affect. Colima was at Alert Level 4 (5 is the highest).
Sources: Reuters; Centro Universitario de Estudios Vulcanológicos (CUEV) - Universidad de Colima
A strong increase in volcanic tremor at Colima caused the Scientific Committee on 18 May to evacuate hundreds of residents from several towns on the SW and SE flanks. Scientists also recorded changes in deformation, the chemistry of spring water near the volcano, and the composition of ejected rocks. In addition, heightened temperatures were recorded on infrared imagery. On 21 May there was an increase in the number of explosive-type earthquakes and a slight decrease in tremor earthquakes in comparison to the previous day. The 6.5-km-radius exclusion zone around Colima remained in effect, with other restrictions to access out to 11.5 km from the volcano's summit.
Sources: Centro Universitario de Estudios Vulcanológicos (CUEV) - Universidad de Colima; Associated Press
As of 7 May volcanism continued at Colima with incandescent lava avalanches travelling down the volcano's flanks and seismicity occurring that was indicative of small explosive events and landslides. Incandescent lava avalanches, generated from the fronts of block-lava flows, continued to travel 2-3 km down Colima's S, E, and W flanks and 730 m down the SW flank.
Source: Centro Universitario de Estudios Vulcanológicos (CUEV) - Universidad de Colima
As of 29 April volcanism continued at Colima with incandescent lava avalanches travelling down the volcano's flanks and seismicity occurring that was indicative of small explosive events and landslides. Incandescent lava avalanches, generated from the fronts of block-lava flows, continued to travel 2-3 km down Colima's S, E, and W flanks and 700 m down the SW flank.
Source: Centro Universitario de Estudios Vulcanológicos (CUEV) - Universidad de Colima
As of 6 April volcanism continued at Colima and more small explosion earthquakes were recorded than during the previous week. Incandescent lava avalanches, generated from the fronts of block-lava flows, continued to travel 2-3 km down Colima's S, SW, and W flanks, and sporadically down the E flank. In addition, block-lava flows extended 550 m down the SW flank and 2 km down the W flank.
Source: Centro Universitario de Estudios Vulcanológicos (CUEV) - Universidad de Colima
Universidad de Colima reported that as of 23 March volcanism continued at Colima and more small explosion earthquakes were recorded than during the previous week. Incandescent lava avalanches, generated from the fronts of block-lava flows, continued to travel 2-3 km down Colima's S, SW, and W flanks, and also sporadically traveled down the volcano's E flank. Block-lava flows extended 550 m down the SW flank and 2 km down the W flank. Based on information from the Mexico City MWO, the Washington VAAC reported that on 25 March at 1040 a steam-and-ash emission rose ~5-6 km a.s.l. and drifted to the E. The 6.5-km-radius exclusion zone around Colima remained in effect, with other restrictions to access out to 11.5 km from the volcano's summit.
Sources: Centro Universitario de Estudios Vulcanológicos (CUEV) - Universidad de Colima; Washington Volcanic Ash Advisory Center (VAAC)
During 6-13 March, avalanches of incandescent volcanic material continued to flow 2-3 km down Colima's S, SW, and W flanks. Most activity occurred on the S and W flanks, while activity slightly diminished on the SW flank. Block-lava flows extended 320 m down the SW flank and had an estimated volume of 720,000 m3. Block-lava flows reached a distance of 2 km down the W flank, and sporadic avalanches occurred on the E flank.
Source: Centro Universitario de Estudios Vulcanológicos (CUEV) - Universidad de Colima
As of 6 March activity at Colima was similar to the previous weeks. Avalanches of incandescent material continued to travel 2-3 km down the volcano's S, SW, and W flanks. Block lava continued to flow down the SW flank of the volcano, extending as far as 240 m from the summit. Lava was also visible travelling as far as 2 km down the volcano's W flank, and down the E flank. Based on information from the Mexico City MWO, the Washington VAAC reported that ash and steam emitted from Colima were seen on 8 March at 4.3-5.2 km a.s.l. The emission was too small to be visible on satellite imagery.
Sources: Washington Volcanic Ash Advisory Center (VAAC); Centro Universitario de Estudios Vulcanológicos (CUEV) - Universidad de Colima
During 27 February- 2 March volcanism at Colima was similar to the previous week. Avalanches of incandescent material continued to travel down the volcano's S, SW, and W flanks. They extended 2-3 km from the volcano's summit and were recorded seismically. Block lava continued to flow down the SW flank of the volcano, extending as far as 240 m from the summit. By 28 February the flow was 15 m high, 55 m wide, and had a volume of about 200,000 m3. Lava was also visible flowing as far as 2 km down the volcano's W flank, and down the E flank. The Washington VAAC received reports that an emission of steam-and-ash on 4 March at 1045 produced a volcanic cloud to a height of ~4.3 km a.s.l.
Sources: Washington Volcanic Ash Advisory Center (VAAC); Centro Universitario de Estudios Vulcanológicos (CUEV) - Universidad de Colima
During 19-24 February, avalanches of incandescent material continued to travel down the S, SW, and W flanks of Colima. They extended 2-3 km from the volcano's summit and were recorded in seismic data. Lava continued to flow down the SW flank of the volcano, extending as far as 200 m from the summit. Lava was also visible flowing down the volcano's W flank as far as 2 km from the summit. Avalanches are expected to occur from the lava-flow front travelling down the volcano's E flank. About 300 metric tons of SO2 were measured per day, which was lower than values measured in 1998 when the current eruptive episode began.
Source: Centro Universitario de Estudios Vulcanológicos (CUEV) - Universidad de Colima
During 13-18 February, seismicity was relatively low at Colima and was dominated by landslide signals. In addition, landslides continued to travel down the volcano's S, SW, and W flanks, extending up to 2-3 km from the volcano's summit. During reconnaissance flights over the volcano, lava flows were observed extending ~70 m down the SW flank. On 16 February lava was seen on the E flank; CENAPRED reported that landslides are expected to travel down this flank in the following days. The 6.5-km-radius exclusion zone remained in effect and there were restrictions to access within a radius of 11.5 km from the volcano's summit.
Source: Centro Universitario de Estudios Vulcanológicos (CUEV) - Universidad de Colima
During 6-11 February incandescent rockfalls continued to travel down Colima's S flank extending up to 2 km from the summit. In addition, very low magnitude earthquakes continued. Scientific Advisory Committee of Colima University personnel and the authorities of Colima State determined that the continuous inflation and numerous small earthquakes that have been recorded during the past 2 weeks could lead to the formation of lava flows and pyroclastic flows. On 5 February La Yerbabuena, the nearest village to the volcano (8 km away), was evacuated. According to news reports, on 6 February University of Colima staff flew over Colima and observed lava flows travelling down the volcano's S flank. On 9 February two pyroclastic flows occurred.
Sources: Centro Universitario de Estudios Vulcanológicos (CUEV) - Universidad de Colima; Reuters; Associated Press
The Universidad de Colima reported on 30 January that the growing lava dome at Colima could result in either a dome collapse in days or weeks that would send pyroclastic flows down the volcano's S flank, or explosions could destroy the lava dome and hurl volcanic fragments several kilometers. On 4 February at 1721 a landslide occurred off of the dome, sending material to less than 600 m from the volcano's summit to the S towards Cordobán ravine. Several incandescent landslides were seen traveling less than 1 km down the S and SSW flanks of the volcano. During a flight over the volcano, members of the Advisory Scientific Committee noticed that dome growth occurred towards the W. Seismicity was relatively low; numerous earthquakes with very low magnitudes occurred. The 6.5-km-radius exclusion zone remained in effect, in addition there were restrictions to access within a radius of 11.5-km from the volcano's summit. Residents were advised to be ready in case an increase in activity leads to the evacuation of towns around the volcano.
Sources: Centro Universitario de Estudios Vulcanológicos (CUEV) - Universidad de Colima; BBC News; Associated Press
Photographs of Colima taken on 13 January revealed that a new lava dome grew in the volcano's crater. The dome was approximately 170 m in diameter at the base and 46 m high.
Source: Centro Universitario de Estudios Vulcanológicos (CUEV) - Universidad de Colima
On 27 December at 1715 the Mexico City MWO issued a SIGMET for volcanic ash at Colima 4.3-5.2 km a.s.l. They reported that another ash emission on 29 December at 0810 produced an ash cloud to a height of ~5.5 km. No ash was visible in satellite imagery from either eruption.
Source: Washington Volcanic Ash Advisory Center (VAAC)
A flight over Colima on 5 December revealed that the spine on the lava dome, first observed on 31 October, was no longer visible. The 31 October dome in the inner crater had grown to an estimated volume of ~285,000 m3.
Source: Centro Universitario de Estudios Vulcanológicos (CUEV) - Universidad de Colima
Photographs of Colima taken on 3 November revealed that a spine had grown on the May 2001 lava dome. The light-colored spine was about 40 m tall, 40 meters wide at its base, and smooth with vertical walls. During early November seismicity was low, with about 10 earthquakes occurring per day. As of 7 November, significant changes in deformation were recorded.
Source: Centro Universitario de Estudios Vulcanológicos (CUEV) - Universidad de Colima
The Universidad de Colima reported on 4 November that significant deformation had been registered at Colima. Seismicity remained low and there was little visibility at the volcano.
Source: Centro Universitario de Estudios Vulcanológicos (CUEV) - Universidad de Colima
During an excursion to Colima on 17 March by personnel from the Universidad de Colima a new crater was observed that was assumed to have been formed during the 22 February 2001 eruption. The crater was ~190,000 m3 in volume, making it the largest crater to form at Colima since the 1960s. On 26 May scientists discovered that a new lava dome that was ~150,000 m3 in volume had formed in the crater. They also noted that fumarolic activity was stronger in May than in March and fumaroles were active around the new dome mainly to the N, NE, and E. The new lava dome was the first evidence of effusive volcanic activity since the November 1998-February 1999 effusive episode.
Source: Centro Universitario de Estudios Vulcanológicos (CUEV) - Universidad de Colima
The Volcanological Observatory of Colima University reported that a moderate explosion occurred at 0532 on 22 February. After reviewing video footage of the eruption, the observatory concluded that the ash cloud produced from the eruption rose ~2 km above the volcano at an average velocity of 200 meters/second (m/s). Incandescent ballistics were hurled up to 3 km away from the volcano at a rate of ~100 m/s and landed on the NE and SW flanks of the volcano, and to a lesser extent on the N flank. Large blocks, up to several meters in diameter, rolled ~400 m from the volcano's summit. The collapse of the eruptive column generated small pyroclastic flows that traveled towards the SW. Small amounts of ash fell in the towns of San Marco ~14 km SE of the volcano and Tonila ~13 km to the SSE. According to the observatory, the events were not sufficient to trigger an expansion of the zone of exclusion around the volcano, which remained at 6.5 km.
Source: Centro Universitario de Estudios Vulcanológicos (CUEV) - Universidad de Colima
The Volcanological Observatory of Colima University reported that during the week seismicity was at an average level and deformation was low. A small seismic swarm occurred during 0237-0640 on 16 November.
Source: Centro Universitario de Estudios Vulcanológicos (CUEV) - Universidad de Colima
The Volcanological Observatory of Colima University reported that small exhalations occurred at Colima at 1250 on 8 November, 1327 on 9 November, and at 1728 on 10 November. The Mexico City MWO reported that the 10 November exhalation produced an ash cloud that rose to 6 km a.s.l. and was blown to the ENE. The Washington VAAC reported that the ash cloud was not visible in GOES-8 imagery. According to the observatory, the events did not exceed the established safety limits so the zone of exclusion remained at 6.5 km around the volcano.
Sources: Washington Volcanic Ash Advisory Center (VAAC); Centro Universitario de Estudios Vulcanológicos (CUEV) - Universidad de Colima
Reports are organized chronologically and indexed below by Month/Year (Publication Volume:Number), and include a one-line summary. Click on the index link or scroll down to read the reports.
Eruption begins on 1 December; lava flows
On 1 December 1975, the volcano began erupting. The summit crater was filled with viscous lava, and two flows descended the E flanks. There were hot avalanches, and eruptions were frequently visible at night from locations 20 km away.
Information Contacts: S. De la Cruz-Reyna, Universidad Nacional Autonoma de México (UNAM).
Lava flows continue
By the end of December the E lava flow had descended the flank of the cone, reaching the vegetation and a ravine at the base. The flow advanced about 2,500 m in 60 days. On 28 January 1976 two new lava flows started to develop at the S and W sides of the dome [but see 1:6].
Information Contacts: S. De la Cruz-Reyna, Universidad Nacional Autonoma de México (UNAM).
Eruption decreases; E-flank lava flow slows
The eruption decreased during February and (presumably) March. The lava flows that were thought to be developing on the W side of the dome in late January did not develop at all. The lava flow on the E flank, ~ 2 km long, was moving very slowly. Other activity has almost stopped. De la Cruz last visited the volcano about 1 March 1976.
Information Contacts: S. De la Cruz-Reyna, Universidad Nacional Autonoma de México (UNAM).
Activity apparently ended
Servando De la Cruz has not visited the volcano recently, but reports that he has received indicate that activity has almost completely ceased.
Information Contacts: S. De la Cruz-Reyna, Universidad Nacional Autonoma de México (UNAM).
No reports of renewed activity
Servando De la Cruz did not visit the volcano in mid-May since the activity had already ceased. An observer located near the volcano will report any new activity directly to him.
Information Contacts: S. De la Cruz-Reyna, Universidad Nacional Autonoma de México (UNAM).
New lava dome in summit crater; activity since 1976 summarized
The following information is from visits to Colima during December 1977-January 1978, December 1979, and February 1981 by James Luhr and others.
Since the extrusion of more than 108 m3 of andesitic block lava between November 1975 and June 1976, activity has consisted of numerous brief ejections of ash and incandescent material, and several episodes of lava dome growth, all in the E part of the summit crater. A small steaming dome (~ 100 m in diameter and extending ~ 15 m above the crater rim) was observed in the E part of the summit crater during the December 1977-January 1978 observations. When Luhr and others returned in December 1979, this dome had disappeared and the E part of the crater had a relatively flat floor, only about 2 m below the crater rim, containing numerous explosion vents 1-5 m in diameter. By February 1981, a new lava dome had been extruded into the E part of the summit crater. A steep-walled vent ~ 50 m across occupied the center of the dome, which was ~ 150 m in diameter and reached a height of ~ 50 m above the crater rim. The geologists interpreted the dome's smooth reddish SE flank (in the direction of the principal 1975-76 lava flows) as more likely to have been caused by slumping than by tephra accumulation. The remainder of the dome was composed of block lava. No information is presently available on post-February activity.
Information Contacts: J. Luhr, Univ. of California, Berkeley.
Lava extrusion from summit dome; small glowing avalanches
Colima began to erupt during the first week of December. Very viscous lava emerged from two vents in the dome that has covered the summit crater since the late 1950's. Aerial observations revealed that lava extruded from a vent in the E half of the dome flowed down its S flank. Collapse at the end of this lava flow produced small glowing avalanches, visible 30 km away during the night, that moved ~ 2 km downslope to the base of the cone. Less voluminous lava extrusion occurred from a vent in the W half of the dome. Activity was continuing as of 20 January.
No felt earthquakes have been reported, nor were volcanic earthquakes detected during 4 days of monitoring with four portable seismographs near Colima. However, small tremors of unspecified origin were detected.
The present eruption is similar to that of November 1975-June 1976. The most recent dome growth occurred between visits by geologists in December 1979 and February 1981.
Information Contacts: S. De la Cruz Reyna and F. Medina, UNAM.
Lava extrusion continues; airborne plume sampling
"Colima was observed from the air for 3 hours around mid-day 20 February as part of the Research on Active Volcanic Emissions (RAVE) sampling mission. The volcano had an apparently active block lava flow descending from the summit down the S flank for several hundred meters. Below this level was active scree. The flow was gray, contrasting with the various browns of the earlier lava units. Heat waves emanated from the flow and rockfalls were rare, indicating a slow extrusion rate. The volcano had a significant gaseous plume that was sampled and measured by the RAVE Electra aircraft with a complete battery of atmospheric sampling gear. During the sampling, one short (30-second) burst of gaseous emission occurred, in which the emission rate approximately doubled."
Further Reference. Casadevall, T., Rose, W.I. Jr., Fuller, W., Hunt, W., Hart, M., Moyers, J., Woods, D., Chuan, R., and Friend, J., 1984, Sulfur dioxide and particles in quiescent volcanic plumes from Poás, Arenal, and Colima volcanoes, Costa Rica and México: JGR, v. 89, no. D6, p. 9633-9641.
Information Contacts: W. Rose, Jr., Michigan Tech. Univ.; T. Casadevall, USGS; W. Zoller, Univ. of Maryland; W. Fuller, NASA Langley Research Center.
Lava extrusion continues
The following report from James Luhr supplements the report from Mexican scientists in 07:01.
"The andesitic block lava that began to flow from the summit crater dome in early December was the first to descend Colima's S flank for hundreds of years. Geologists from the Univ. of California at Berkeley observed the flow from the S side of the volcano starting 18 January, about the time of the report in 7:1. The new lava was moving down a polished avalanche chute with a slope of about 36°. On 20 January, the flow had a simple tongue shape and was some 600 m long. By 3 March, the lava had reached 1 km length. Block-and-ash flows were common from the uppermost margins of the lobe with surprisingly few from the flow front. In several instances, sizeable (2,000 m2 ?) areas on the flow surface suddenly shifted downslope 5-10 m, accompanied by only small amounts of ash and steam. This may be a major process of downslope movement of the flow. The active scree deposit below the lava contained blocks several meters in diameter, grading into a new sand and conglomerate wedge flooding the upper reaches of the Barranca Playa de Montegrande.
"Since the early part of Colima's lava eruption of 1975-76, through several episodes of dome growth, the andesitic magma has become progressively more basic. The latest lava continues this trend."
Information Contacts: J. Luhr, Univ. of California, Berkeley.
Lava extrusion ended June 1982 but plume emission continues
A French team reached the N rim of the summit cone in early December. Storm damage to trails prevented them from reaching the S side of the cone, so they were unable to see the S flank lava flow produced by the eruption that began in December 1981. Only fumarolic activity was observed in the W part of the crater and on the N flank. Gas of essentially atmospheric composition was emitted at 500°C from the NE part of the cone and from a vent that had recently extruded a lava flow. Rockfalls occurred several times per day from the front of this flow and it may still have been advancing very slowly.
James Luhr and others visited Colima in mid-January and again in early February. The S flank lava flow appeared to have advanced very little since last observed by Luhr in March 1982. Residents of the area reported that incandescence had ended in June 1982. Plume emission continued in early 1983 at about the same intensity as a year earlier, but there were no episodic increases in intensity of plume emission as there had been in early 1982.
Information Contacts: J. Cheminée, IPG, Paris; J. Luhr, Univ. of California, Berkeley.
Vapor emission from fumarole field; SO2 flux estimated
"Colima was emitting a moderate-sized white plume when observed 25-28 April. Most of the plume came from the fumarole field on the NW side of the summit lava field. Temperatures were as high as 565°C in some instances. Preliminary estimates of SO2 flux suggest a rate of up to 100 t/d."
Information Contacts: R. Stoiber, L. Benton, C. Connor, D. Douglass, D. Shumway, and J. Swarts, Dartmouth College.
New fissures; fumaroles to 800°C; felt seismicity
"Dartmouth volcanologists visited Colima 26-27 November. Large linear fractures had opened on the NE flank of the volcano between the summit and Volcancito Cone, at an elevation of approximately 3,700 m (figure 1). These fractures strike N30-45°E and are as much as 15 m deep, 5 m wide, and 50-100 m long. New arcuate fractures of comparable size are concave downslope and head across the linear fractures. Fumarolic activity in an area of 100 m2 was intense with temperatures up to 800°C and several fumaroles hotter than 600°C. Fracturing and fumarolic activity persisted at higher elevations, but was concentrated below the summit. Hundreds of tremors were felt during a bivouac near the fumarole field on the night of 26 November. A small fissure was observed cutting across the summit of Volcancito roughly in line with those found at higher elevations. Temperatures in this fissure were 40°C. This is a marked change in activity since our group last visited Colima in April 1983, when fractures and fumarolic activity were not observed in this area. The 1983 fumaroles were located at higher elevations and were much cooler; highest temperature was 565°C."
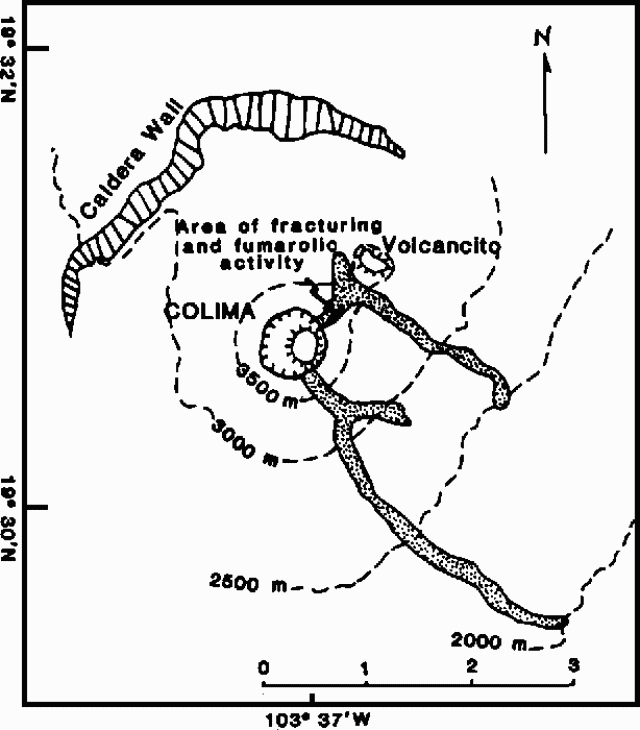 |
Figure 1. Location of the area of active fracturing and intense fumarolic activity on Colima. The 1975-76 lava flow is shaded. Base map modified from Luhr (1981). |
Information Contacts: C. Connor, B. Gemmell, and R. Stoiber, Dartmouth College.
Red glow seen in January, increased fumarolic activity
The following is from Claude Robin and John Murray. According to the inhabitants of San Marcos (14 km SE of the summit), a red summit glow was seen at night in early January for the first time since 1982, together with glowing 'sparks'. At the same time people at Colima town (30 km S of the summit) observed a dark ash plume during the day, instead of the usual white condensation plume. Earthquakes were felt at San Marcos during this period.
"Robin and Murray visited Colima (figure 2) 1-14 February. An 8-km levelling profile set up by Murray in December 1982 was reoccupied and extended to 10 km. Results showed a slight deflation since December 1982, with stations closest to the summit (~1.5 km distant) dropping 3.5 cm relative to the farthest stations (at 3 km from the summit), indicating a tilt of 24 µrad at this distance. This result was confirmed by three dry tilt stations 1.5-2 km from the summit, which gave deflationary tilts of 13-45 µrad. Neither earthquakes nor harmonic tremor were detected through the level instrument (normally a fairly sensitive indicator of seismic activity) during this period, although occasional quakes were felt at night in Ciudad Guzmán (27 km NE of the summit).
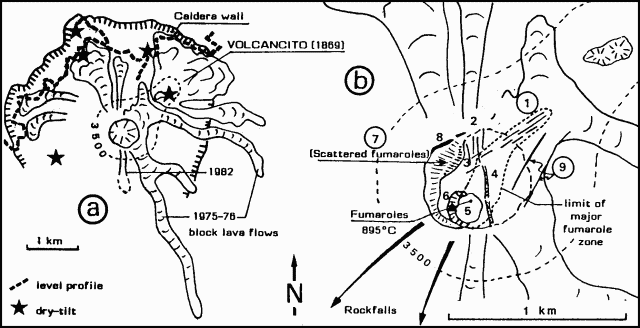 |
Figure 2. Sketch map of the summit of Colima (a) and an expanded view of the summit showing geologic features (b). Courtesy of C. Robin and J.B. Murray |
"Volcancito Cone (~1 km NE of the summit) was visited on 8 February, the summit was climbed for gas and sublimate collection on 11 February, and the volcano was overflown on 14 February. The fractures seen by Dartmouth College geologists in late November (figure 2, number 1) were still the site of fumarolic activity, at an altitude of 3,750 m (all altitudes by altimeter), but the fumarole on Volcancito had ceased to be active.
"The irregular terrain at the summit itself, corresponding to the surface of the andesitic dome, consisted of a narrow plateau at about 3,850 m. The northern slope had shallow N-S fractures 1-3 m across (figure 2, number 2) with sublimate deposits, but no active fumaroles. These fractures were cut by others (figure 2, number 3) trending towards Volcancito (approximately NE). A major N-S zone of weakness, 5-10 m across and very deep with strong fumarolic activity, divided the summit plateau in two (figure 2, number 4). According to volcanologists at the Instituto de Geofísica, Univ Nacional Autónoma de México (UNAM), this zone was already in existence before the 1982 eruption, though perhaps less marked.
"Many summit fumarole temperatures were measured at between 135 and 895°C. The high temperature was found inside a shallow 20-m pit on the SW edge of the summit plateau (figure 2, number 5) perhaps an explosion pit formed in January. A red glow was detectable inside fumaroles even in bright daylight and socks were singed.
"Rockfalls from the summit dome, indicating the continued rise of the central plug, occurred down the W and SW slopes at about 15-20-minute intervals, a rate similar to that noted in December 1982 and March-April 1983. Thirty to 40 m below the summit to the W and NW are the remains of the old crater rim (figure 2, number 8) with a flatter shelf containing scattered fumaroles on its inside edge (figure 2, number 7). On photos taken from the air, two fractures trending NE (figure 2, number 9) are visible crossing the 1975-76 flows SE of the summit, but without noticeable fumarolic activity. The lowest fumarole was found at an altitude of 3,600 m down the NE side of the summit cone and had a temperature of 46°C.
"From the above evidence it seems that the M 8 earthquake in September opened new fractures and accentuated previous ones on the volcano. This may have provoked some depressurization of the near-surface magma, increasing surface temperatures and fumarolic activity, and culminating in the minor ash eruptions of early January. The levelling and dry-tilt data suggest no buildup of magmatic pressure, and the decline in seismic activity since November also indicates that for the moment, there are no portents of a larger eruption such as those that followed the earthquakes of 1611 and 1806."
Information Contacts: C. Robin, Lab de Volcanologie, Clermont-Ferrand, France; J.B. Murray, Wheathampstead, UK.
Small plume with minor SO2
On 29 November, geologists observed the volcano from Nevado de Colima, an eroded cone 5 km to the N. A very small plume was emerging from the summit. COSPEC measurements suggested that SO2 was being emitted at a rate of perhaps 8 t/d.
Information Contacts: R. Stoiber, C. Connor, and other geologists, Dartmouth College.
Increased fumarolic activity; A-type events
The Univ of Colima (37 km S of the volcano) reported that a sulfur smell and increased fumarolic activity were noticeable on 2 March and twice during the next few weeks. A seismic station near the university detected a few small A-type earthquakes/day. The Instituto de Geofísica is installing a portable seismic station at the base of the volcano. A sulfur smell had not been reported for at least 10 years.
Information Contacts: S. de la Cruz-Reyna, UNAM.
Large avalanche from summit lava dome; small A-type events
On 2 July at about 1050 a large Merapi-type avalanche occurred from the S and SE base of the summit lava dome. Avalanche debris probably reached the base of the summit cone, but there were no reports that it continued into vegetated areas downslope. Residents of the area reported that the activity generated a cloud, but geologists could not confirm whether it was produced by a phreatic explosion or was fine-grained debris from the avalanche. A relatively large talus pile that had accumulated at the S and SE base of the dome was no longer present after the avalanche. The dome's post-avalanche profile appeared significantly flattened but precise determination of changes in dome morphology await analysis of before/after photos. Poor weather conditions prevented geologists from reaching the summit.
No increase in seismicity was observed on a permanent seismograph 30 km S of the volcano. A portable seismic station installed 10 km from the volcano (at La Yerba Buena) a few days after the avalanche detected only a few very small A-type events, 7 on 7 July, and only 1-2/day since then. S and P arrivals were only about 1 second apart, indicating a nearby source. No B-type events or tremor were recorded.
Information Contacts: S. de la Cruz-Reyna, UNAM.
Fumarolic activity; rock avalanches
A group from the Centro de Investigación en Ciencias Básicas (CICBAS), Universidad de Colima, visited the volcano on 24-25 May to test future sites for a local seismic network. Guillermo Castellanos and Raul López measured average temperatures of 118°C adjacent to the main fumaroles. Emissions were dense, light-gray, and toxic. Large rockfall avalanches similar to the one that originated at the base of Colima's lava dome on 2 July 1987 (12:07) have been occurring periodically. Thick sulfur deposits coated the areas around fumaroles and avalanche source areas. Contrary to some public reports, rumbling noises were not heard during the visit.
Information Contacts: G. Castellanos, R. López, G. Ornelas, J.C. Pérez, C.A. Ramírez, G. Reyes, and H. Tamez, CICBAS, Universidad de Colima.
1987 phreatic explosion and avalanche from summit dome
On 2 July 1987, residents of the S side of Colima observed a mushroom cloud 500-1,000 m high emerge from the central dome, accompanied by a loud explosion. Tons of volcanic material fell on the SE side of the cone. Municipal authorities requested assistance, and a group of security personnel and two geologists from Guadalajara were sent to investigate. Their report described the activity as a "phreatic explosion from the central dome and an avalanche... of volcanic material accumulated forming the dome" (Flores and others, 1987).
The same two geologists and another from the National Univ climbed the volcano on 20 April 1988. The dome, 250-300 m in diameter, had a large depression (100 m diameter, 50 m deep [but see 15:12]) on its SE side. Only fragmented older rocks were found on the dome and in the avalanche; there was no evidence of fresh glass.
Fumarolic activity from three sites on the dome is watched by telescope from Ciudad Guzmán, 20 km NE. Weekly reports are sent to the Geography Department at the Univ of Guadalajara, 132 km N of the volcano. Geologists from the Univ visit the volcano every two months if weather permits.
Reference. Flores, J., and others, 1987, Informes de las recientes observaciones practicadas en el Volcan Colima: Revista del Instituto de Geografia y Estadistica, Universidad de Guadalajara, México, v. 3, no. 2.
Information Contacts: Julian A. Flores Diaz, Instituto de Geografia y Estadistica, Univ de Guadalajara.
Bombs ejected; small ash clouds; new fumaroles
While working on a hazard map during October and November, geologists (A.L. Martín del Pozzo, C. Suarez Plascencia, R.M. Uribe, A.M. Soler, and G. Stoopes) observed that a section of the E part of the dome had caved in since their last visit at the end of January. A fumarole that had been seen since 1981 was not active in January, but its activity had resumed at an increased level by October and November, and there were two new vents that emitted vapor. On 13 November, the geologists noted three new bombs (1-, 3-, and 4-m-diameters) that had been ejected from the summit dome since January and fallen on the top of Volcancito, a parasitic cone 1 km NE of the summit. The bombs were porphyritic andesite with plagioclase, hornblende, and pyroxene phenocrysts of up to 5 mm. Univ of Guadalajara geologists climbed the volcano later in November and noted new fumarolic activity that had not been evident in April. From a highway 18-20 km E of the volcano on 22 December, Arizona State Univ geologists saw small explosions from the summit dome, producing puffs of steam and darker ash clouds, typical of recent activity at the volcano.
Information Contacts: Ana Lilian Martín del Pozzo, Instituto de Geofísica, UNAM, Ciudad Univ, Delegación Coyoacán; Julian A. Flores Diaz, Instituto de Geografía y Estadísticas, Univ de Guadalajara; Michael Sheridan and Gary Stoopes, Arizona State Univ, USA.
Increased fumarolic activity from summit dome
On 14 May, Julián Flores (geologist) and José Angel Cortés (alpinist) climbed to the summit to sample recent ejecta, and observe morphologic changes and current activity. The summit crater, 400 m in diameter, was filled with irregular blocks. On the N side of the summit area, a dome 200 m in diameter rose 40-60 m above the crater rim; the SW-W side was occupied by a platform with an irregular surface; and a depression 100-150 m in diameter extended 15-20 m below the lowest point on the crater's SE rim. The main fumarolic activity was from three areas, on the W, N, and E sides of the dome, and appeared to have increased since the last visit by Flores and Cortés on 20 April 1988. Vapor emission was brownish; the dark plume color has at times misled distant observers who have reported eruptions. The fumaroles were relatively dispersed, with gases emerging between blocks, depositing red, orange, yellow, and white sublimates.
The depression formed 2 July 1987 after a phreatic explosion and avalanche was deeper than during the previous visit to the summit in 1988. The area was warm, but no fumarolic activity was occurring. Samples from the bottom of the depression were collected for analysis. The remainder of the summit area was an irregular blocky surface with some small dispersed fumaroles. Winds that blow from the coast were eroding the SW flank, causing scoria and sand-sized debris to flow downslope.
Information Contacts: Julian A. Flores Diaz, Instituto de Geografía y Estadística, Univ de Guadalajara.
Summit morphology and seismicity described
When Julián Flores Díaz and José Angel Cortés visited Colima 13-14 and 25-26 May, the summit area consisted of a dome on the N side, a semicircular depression on the SE side, and an irregular platform (figure 3). Fumaroles were concentrated in three areas on the dome (figure 4). On 14 May, gas emission, dominated by SO2, had increased and the gas was light-brown in color, but it had substantially diminished by 25-26 May.
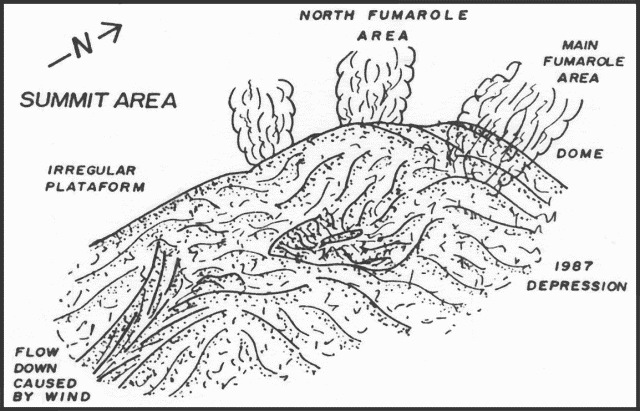 |
Figure 3. Sketch of Colima's summit, May 1989. Courtesy of J.F. Díaz. |
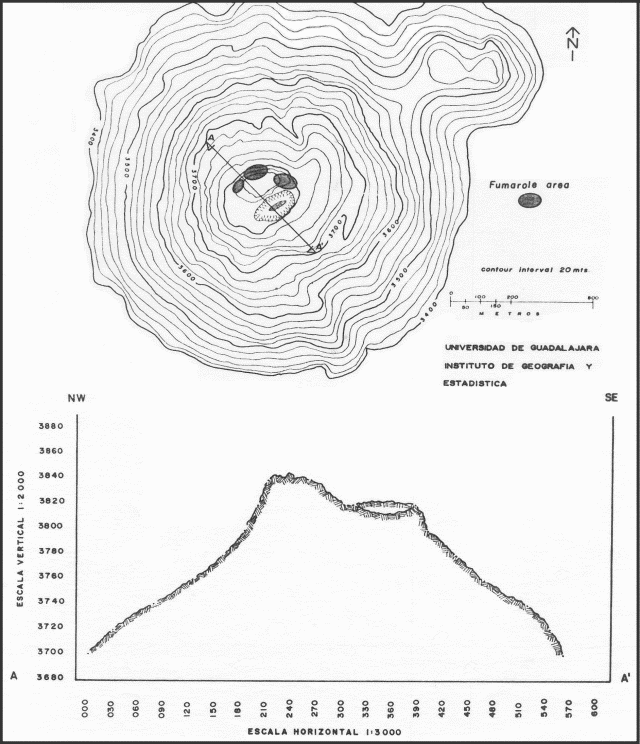 |
Figure 4. Map (top) and cross-section (bottom) of Colima's summit area, showing positions of the dome, fumarolic activity, and the summit depression. Courtesy of J.F. Díaz. |
The depression that formed 2 July [1987] after a phreatic explosion and avalanche from the summit was 100-150 in diameter and 30-40 m deep (from the high point in the middle of the summit area) [but see 15:12]. The area was warm but fumaroles observed during a November 1988 overflight had disappeared. Altered fragmented rocks and sand were present on the depression's floor. The remainder of the summit area, an irregular platform, was composed of blocks of many shapes and sizes. Warm gases containing SO2 were emitted, and blocks were altered and covered with sulfur. On the SW flank, a talus slope of scoria and sand had developed. Thermometric equipment was not available to the team.
A group from CICBAS, Universidad de Colima (Guillermo Castellanos, Carlos Ariel Ramírez-Vázquez, and Juan Reyes-Gómez) visited the volcano 23-25 May. Average temperatures adjacent to fumaroles were 167°C, a decrease from 216°C measured in May 1988. Emissions were dense, dark-gray in color, and had a pH of 2-3. New fractures were observed near the fumaroles. Rockfall avalanches, persisting for much of the past year, were last seen 14-15 April on the W flank (observed 20 km from the volcano). Three avalanche paths were visible, on the W, E, and N flanks.
Two digital high-gain 3-component seismographs and one analog single-component seismic station were installed near the volcano (figure 5). The seismographs collected data continuously for about 40 hours and recorded an average of 30 events/day. Preliminary analysis of the data by Reyes and Ramírez showed that most of the activity was tectonic with long separation between P- and S-wave arrivals. On 1, 14, and 22 June, the operators of the Red Sismologica Telemetrizada de Colima (a network that will consist of eight short-period, vertical seismograph stations; figure 6) installed three telemetric stations. Data are telemetered to CICBAS in the city of Colima. No deformation data are available, but changes in Colima's shape are visible and geodetic studies would be welcomed.
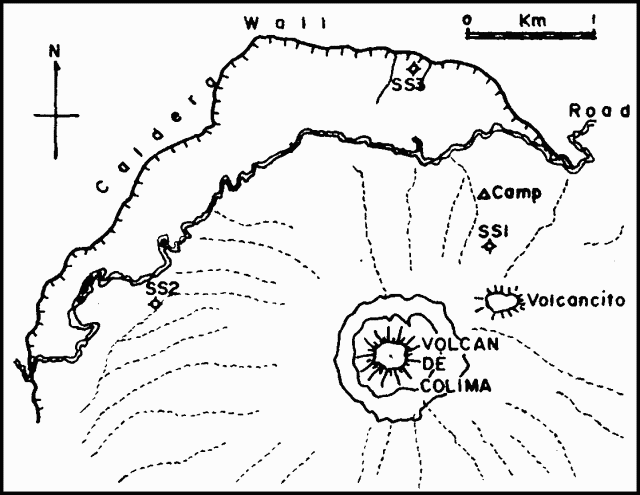 |
Figure 5. Location of digital high-gain 3-component seismographs (SS2, SS3) and an analog single-component (SS1) seismograph installed near Colima. Courtesy of G. Castellanos. |
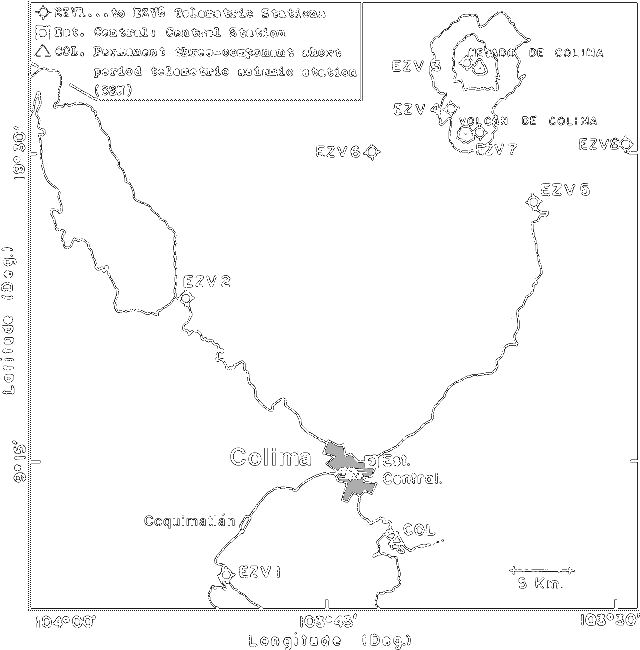 |
Figure 6. Distribution of instruments for the planned Colima Telemetric Seismological Network (RESCO). Courtesy of G. Castellanos. |
Information Contacts: Julián Flores-Díaz, Instituto de Geografía y Estadística, Univ de Guadalajara; Guillermo Castellanos, Gilberto Ornelas-Arciniega, C. Ariel Ramírez-Vázquez, G.A. Reyes-Dávila, and Hector Tamez, CICBAS, Universidad de Colima.
Summit dome fumaroles remain hot, but those in upper flank fractures cool considerably
"Geologists from Florida International University and the Universidad de Colima visited the central crater and dome complex on 3 and 7 March. Fumarole temperatures have decreased dramatically in fractures just below the summit dome. The maximum temperature recorded in upper NE flank fractures was 100°C, down from 895°C in December 1985. The plume was much smaller during the 1990 visit, and no new tephra was found in the summit area.
"Temperatures of three fumaroles on the summit lava dome were measured at 3-minute intervals for about 4 days (figure 7). Surface temperatures were monitored simultaneously. The three measured fumaroles, on the SW side of the dome, had the highest temperatures found.
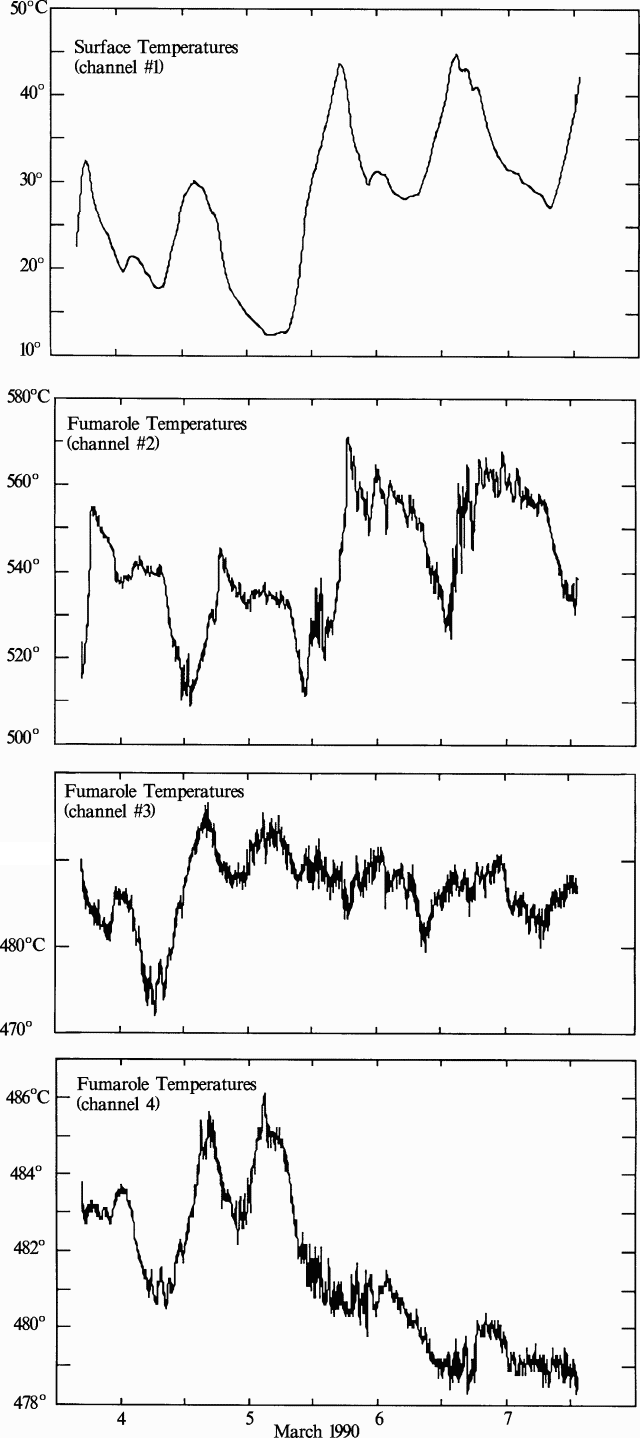 |
Figure 7. Temperature profiles at three fumaroles (channels 2-4) and surface temperatures (channel 1) on the SW side of Colima's summit lava dome, 3-7 March 1990. Note the differing temperature scales. Courtesy of C. Connor. |
"Two fumaroles (channels 3 and 4 on figure 7), located in the same fracture ~ 10 m apart, had a similar temperature range and showed a high degree of cross-correlation. The fracture trended about N70°E and extended for at least 200 m across the summit dome. Its maximum width was ~ 15 cm. The third fumarole (channel 2) was in a different fracture, oriented about E-W and about 6 m from the channel 4 fumarole. Channel 2 data were quite rhythmic, showing minimum temperatures each day about 1200, followed by maximums around 1830. This fumarole had a maximum temperature of 571°C on 5 March at 1827. One of 11 local earthquakes recorded (by CICBAS) during the sampling period occurred the same day at 1826. Channels 1 (surface temperature) and 2 retained relatively high temperatures after this event for the remainder of the sampling period, while channels 3 and 4 remained comparatively steady."
Information Contacts: C.B. Connor, Florida International University, Miami; J. Piza Espinosa, Universidad de Colima.
Fumarolic activity and SW flank rockfall avalanches; Seismic net expanded
A group from CICBAS (Universidad de Colima) and CONMAR (Oregon State Univ) visited the volcano 15-17 February. Since their last visit, in May 1989, rockfall avalanches have occurred preferentially on the SW flank. Fumarolic activity persisted throughout their visit, forming a dense gray cloud. Poor weather conditions limited additional observations.
The geologists emplaced geoceivers for satellite communication, to determine geodetic positions of sites near the volcano for installation of two new telemetering seismographs. On 15 December 1989, the CICBAS seismology group had installed the 4th telemetric station of the Red Sismológica Telemétrica de Colima, 7 km from the volcano (at la Yerbabuena, site EZV6 on figure 6).
Information Contacts: Guillermo Castellanos, Gilberto Ornelas-Arciniega, C. Ariel Ramírez-Vazquez, G.A. Reyes-Dávila, and Hector Tamez, CICBAS, Universidad de Colima.
Strong fumarolic activity; most local seismicity apparently tectonic
The following is a report from Ana Lillian Martín. "In 1981 when we first observed the dome morphology, it was made up of several-meter blocks divided by deep cracks in which some fumaroles were active. The 1981-82 lava flow breached the S rim and produced a thick, blocky, but short flow accompanied by small Merapi-type avalanches (roughly once every 15 minutes). Three years ago [on 2 July 1987], an explosion on the E part of the dome opened a 30 x 20 m crater (15 m deep) [but see larger estimated dimensions in 13:09 and 14:06] and produced a small black cloud (see 12:07 and 13:09). In 1988 and 1989, oversteepening on the dome generated small landslides on the volcano, mainly to the S and W. During 1990, the landslides seem to have increase slightly. Landsliding (arrows on figure 8) is marked by <10-m amphitheater-shaped scars on the dome and occurs more frequently on the S flank, where the slope steepens sharply. W-slope landslides entered tributaries of the Río Lumbre ('fire') but remained on the upper flanks. Irregular, changing dome topography included protrusions up to 20 m high, of which the one on the N side seems to be rising. Depressions are about 10 m deep, but only one (on the W side) contains fumaroles. The main fumarolic area was in the NE part of the crater, possibly on the crater-dome boundary, where rocks were covered by sulfur crystals from the fumaroles. In October, fumarolic activity was more widespread, probably related to rain. Spring-water monitoring (January-November) has shown no evidence that could suggest variations in activity."
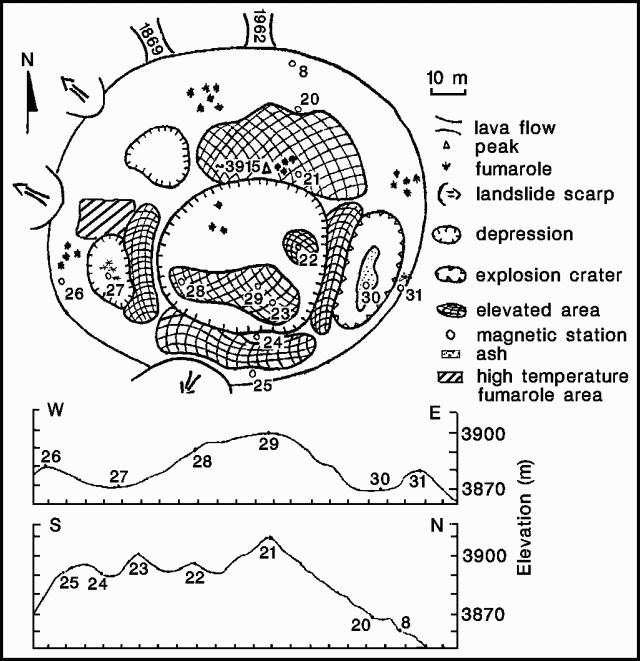 |
Figure 8. Sketch map, with E-W and N-S cross-sections, of Colima's summit crater in May 1990. Selected fumaroles (those with the most vigorous plumes) are shown. The area of high-temperature fumaroles measured by Connor and others is indicated by a shaded box in the W part of the crater. Courtesy of Ana Lillian Martín. |
The following is from Guillermo Castellanos. "On 1 December, a group from CICBAS, Universidad de Colima, and CTS Cinvestav Guadalajara, visited Colima to provide maintenance to EZV3, the 5th seismological station of the Red Sismológica Telemétrica del Estado de Colima (RESCO), put in service on 24 May 1989 by the Grupo de Sismología del CICBAS, Universidad de Colima. New, strong fumarolic activity has been observed since a couple of months ago. During the visit, emissions from the three main fumarole areas were intense, although it seems that the emissions are mainly water vapor. Reports of this activity from Ciudad Guzmán and Colima have been alarming the inhabitants of the region. Careful analysis of data recorded by RESCO has shown that the seismic activity is mainly of tectonic origin (figure 9). A detailed study of seismic activity in Colima as recorded by RESCO is in progress and the results will be reported in future communications. RESCO is a project partially supported by the Gobierno del Estado de Colima, DGICSA-SESIC-SEP, and CONACYT-MEXICO."
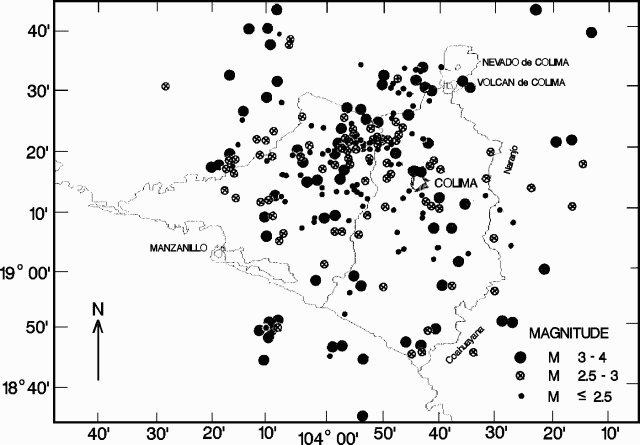 |
Figure 9. Seismicity near Colima volcano, recorded January-September 1990 by RESCO seismic stations. Courtesy of Guillermo Castellanos. |
The following is from Charles Connor. "FIU geologists and personnel from the Mexican Red Cross visited the summit dome on 16 and 18 December. Degassing rates were clearly greater than in March and May. Widespread fumarolic activity on the dome has resulted in sulfur deposition over a larger area than previously seen. Fumaroles also existed at lower elevations than we observed earlier this year. Temperatures of all these new fumaroles are low (65-155°C), suggesting that the change in fumarolic activity may be a seasonal effect rather than being associated with renewed magmatic activity. The highest-temperature fumaroles we observed are on the W side of the dome, in an area of ~400 m2, along NE-trending fractures. Several new fumaroles in this area had temperatures of >500°C, but none were hotter than 550°C, a temperature range similar to that observed in March and May. Temperatures in three fumaroles in this area were recorded at 2-minute intervals over a 42-hour period. The highest-temperature fumarole (figure 10, number 3) is located in a fracture ~10 cm wide. Cooler fumaroles are located 10 and 15 m peripheral to these fractures. These fumaroles had temperature variations of up to 55°C in 6 hours during the sampling period. In general, these lower-temperature fumaroles also had lower mass flows than nearby higher-temperature fumaroles.
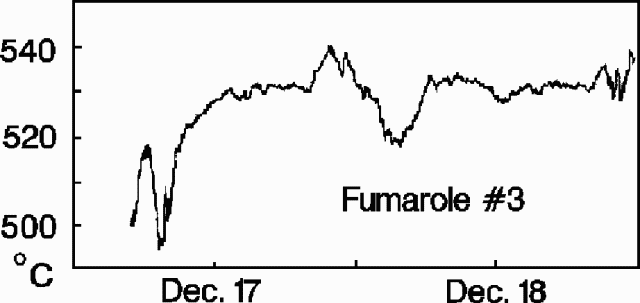 |
Figure 10. Temperature profile at a fumarole (number 3) on the W side of the summit dome at Colima, 16-18 December 1990. Courtesy of C. Connor. |
"Although there have been some changes at the summit dome since our last report in March, they appear to be seasonal and there is no indication of renewed magmatic activity at this time. Avalanche hazards associated with the volcano remain very high where the volcano is oversteepened and highly fractured, particularly on the S and NW faces of the dome. Low-temperature fumaroles are concentrated along many of these fractures.
Information Contacts: Ana Lillian Martín del Pozzo, Instituto de Geofísica, UNAM; Guillermo Castellanos, Gilberto Ornelas-Arciniega, C.A. Ramírez-Vázquez, G.A. Reyes-Dávila, and H. Tamez, CICBAS, Universidad de Colima; Zenón Jimenez and M.A. Arévalo, Instituto de Geofísica, UNAM, Circuito Exterior; C.B. Connor and Sammantha B. Lane, Florida International Univ, USA; Mitchell Ventura and Cruz Roja Mexicana, Delegación en Colima, Colima, México.
Earthquake swarm and increased gas emission
The following report is from the Centro de Investigación en Ciencias Básicas. "On 14 February at 0800, RESCO detected an increase in seismic activity, clearly associated with Colima volcano. From a baseline of a few tectonic events/day (high-frequency - A-type) to two events/hour of volcanic origin (low-frequency - B-type), seismic activity increased continuously [over the next several hours] until it reached five B-type events/hour. RESCO registered approximately 106 earthquakes between 1150 on 14 February and 1000 on 15 February. This activity diminished markedly after a M 3.5 earthquake at 1705 on 14 February.
"On 16 February, RESCO operators working at Nevado de Colima, the older summit 5 km N of the active cone, observed two rockfall avalanches on the W flank of the volcano, at 1245 and 1315, respectively. Fumarole emissions were dense and white in color, but approximately every 20 minutes, these emissions were accompanied by others with a strong dark gray color." No ashfalls were reported.
Information Contacts: Guillermo Castellanos, Gilberto Ornelas-Arciniega, C. Ariel Ramírez-Vázquez, G.A. Reyes-Dávila, Hector Tamez, and Francisco Núñez-Cornú, CICBAS, Universidad de Colima; A. Nava, Z. Jiménez, and S. de la Cruz-Reyna, UNAM; C. Connor, FIU, Miami.
Lava extrusion onto summit dome after increased seismicity and fumarolic activity; fish kill in nearby lakes
New lava was extruded onto the summit dome after several weeks of increased seismicity, fumarolic activity, and dome fracturing.
Increased seismicity, mid-late February. Seismicity increased briefly on 14 February and strong fumarolic activity was observed on 16 February. [RESCO instruments recorded] a new seismic swarm that began on 23 February at about 1800, producing about 150 recognizable events in the first 24 hours and an additional 180 events in the following 24 hours (figures 11 and 12). A- and B-type earthquakes were again detected, and frequent small- to medium-sized Merapi-like (but non-incandescent) avalanches moved down the volcano's flanks from the crumbling edges of the summit lava dome. A white to sometimes light gray plume rose from the dome to a maximum height of roughly 1,000 m. No ashfalls have been reported. Records from a portable seismograph on the caldera floor showed little correlation between earthquakes and the avalanches, which produced a signal of distinctly higher frequency. However, fairly large B-type events sometimes seemed to trigger avalanches. On 26 February, 21 avalanches were observed in 6 hours. A period of relative seismic quiescence between 1530 and 2000 on 25 February was followed by renewed seismicity that continued at a rate of about 130 events/day. Some of the earthquakes have been located at 1-3 km depth ~6 km NNW of the volcano. Seismicity began to decrease after 27 February, but the number of avalanches increased, reaching a maximum on 2 March.
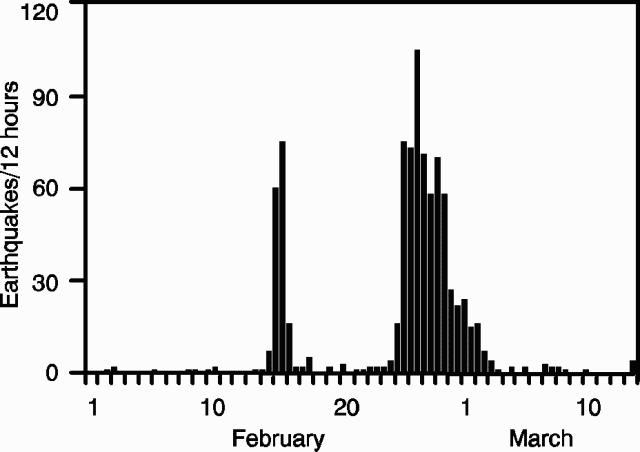 |
Figure 11. Number of seismic events recorded in 12-hour periods at RESCO reference station EZV6, about 8 km SW of Colima's summit, 1 February-13 March, 1991. |
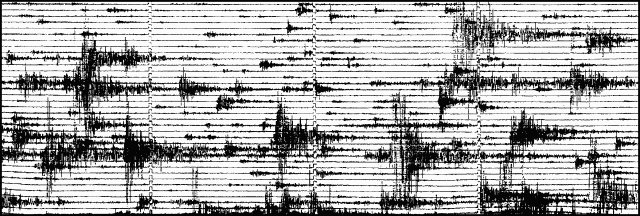 |
Figure 12. Section of a seismogram recorded on 25 February at RESCO station EZV7, on Colima's E flank. |
Dome deformation and thermal activity, late February. During a 26 February ascent by Mitchell Ventura F. and Charles Connor, heavy degassing was occurring from the summit dome, concentrated on its SE and W sides. The hottest fumaroles (500-600°C) had been on the dome's W side during the past year (15:02). Since previous fieldwork on 16 December, new radial fractures had developed, 10->100 m long, 1 cm-1.5 m wide, and sometimes open to 5 m depth or more. Low-temperature (<200°C) fumaroles were found along most of the fractures. Fracture density was greatest on the dome's N to NW flanks, above a recent avalanche scar. Many of those fractures were 1-1.5 m wide and had vertical throws of 1-2 m (always down on the downslope side). Rockfalls were continuous on the dome's W to NW flanks, including blocks to 10 m3. Light lithic tephra falls occurred on the dome at about 1320 and 1345, within 150 m of the most active degassing in its W-central part.
Lava extrusion, early March. New lava was first observed on the dome 1 March. When [Ventura and Connor returned to] the summit the next day, the new lobe, on the W-central part of the dome, was ~20 m across and 6.5 m high. New lava was visible only on its top 1.5 m; the lower 5 m consisted of a steep rubble slope of old dome material. The most easily observed W side of the new lobe had an aa-like texture and was not highly fractured. Plagioclase phenocrysts were visible in the dark, apparently andesitic, lava. Although several rockfalls occurred from the lobe's lower slopes during 15 minutes of observation, no incandescence or lava movement was evident. Vigorous degassing occurred from a surrounding moat about 5 m wide, and the area was strongly fractured, mostly radial to the new extrusion. However, overall degassing had declined substantially. At one site ~75 m NW of the new lobe, along a prominent radial fracture, the strong fumarolic activity of 26 February had completely stopped by 2 March. Nearly all of the summit dome's prominent spines had been removed by heavy avalanching since 26 February.
[Ana Lillian Martín del Pozzo and colleagues reported that] by 3 March, the new lobe was slightly taller. When next observed 2 days later, a narrow tongue of lava had emerged from a breach in the lobe's E base and had been channeled into the adjacent moat. The (southward-sloping) lobe was estimated at 15 m high and 50 m across on 6 March. After that date, degassing and seismicity decreased sharply.
By mid-March, [CICBAS reported that] the new lobe was of sufficient size to be visible from Colima city (~30 km SSW of the volcano). Fumarolic activity increased again about 10 March, but seismicity remained at a low level. Geodetic data (J. Murray) showed little deformation of the somma-type caldera surrounding the N side of the volcano.
Seismic net. On 5 March, RESCO installed a new telemetering seismic station on the volcano's NNW flank (at El Soma), bringing the total number of telemetering stations to five on the volcano and two others nearby (at Alcomun and Cerro Grande). The digital acquisition system was re-established on 9 March.
Changes to nearby lakes. An abrupt 30-cm drop in the level of a group of small lakes 10.5 km SW of the summit (figure 13) was reported on 7 March. The level change in the largest lake (~200 m in diameter) was followed by the death of most fish within a few hours. Water samples collected on 10 March showed [fairly] high concentrations of CO32- and HCO3 and very low (below detection limits) concentration of As. The dead and dying fish showed no evidence of disease and no chemical products or insecticides are used in the area. Geologists noted that "Although it is difficult to give a definite explanation of the origin of these phenomena, the events may be interpreted in terms of the sudden dissolution of important quantities of CO2 in the lake water. This may be caused by fracturing associated with the the recent increase in shallow seismic activity at Colima, allowing magmatic gases to reach the aquifer system. At the measured pH of the water (8.90), the dissolved CO2 is present as carbonate and bicarbonate." [But this drop in lake level was later attributed to normal withdrawal of irrigation water; see 16:04.]
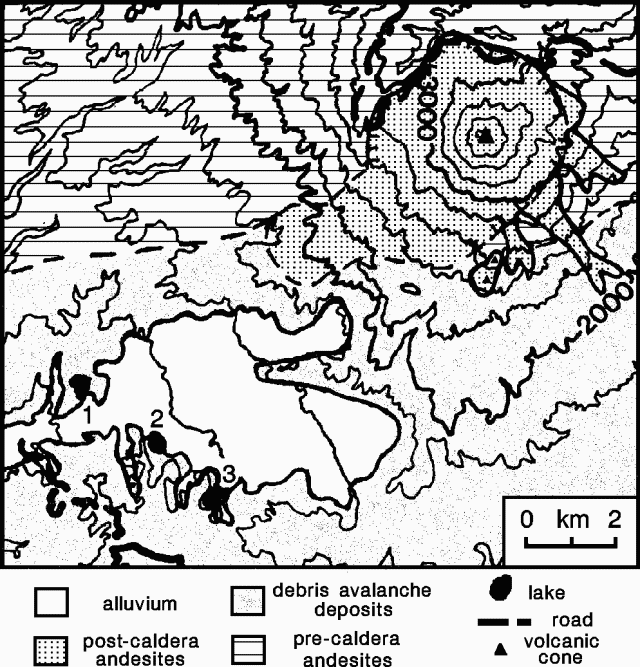 |
Figure 13. Sketch map of Colima and the area to the S and W. Contour interval, 200 m. A group of lakes SW of the volcano was affected by fish kills and declines in water level: 1 - La María; 2 - El Jabalí; 3 - La Escondida. After Luhr, J. and Prestegaard, K., 1988, Caldera formation at Volcán Colima, México, by a large Holocene volcanic debris avalanche: JVGR, v. 35, p. 335-348. |
Information Contacts: Gilberto Ornelas-Arciniega, Ariel Ramírez-Vázquez, Francisco Núñez-Cornú, Hector Tamez, Guillermo Castellanos, and G.A. Reyes-Dávila, CICBAS, Universidad de Colima; S. de la Cruz-Reyna, I. Yokoyama, A. Nava, Z. Jiménez, and M.A. Armienta Hernández, UNAM; Julián Flores, Instituto de Geografía y Estadística, Univ de Guadalajara; C.B. Connor, FIU, Miami; Ana Lillian Martín del Pozzo, A. Aguayo, and J. Panohaya, Instituto de Geofísica, UNAM; D. Barrera, Centro de Ciencias de la Tierra, Univ de Guadalajara; Juan N. Cumplido, Guadalajara, México, G. González, Univ Autónoma de Puebla.
Partial collapse of summit lava dome and crater rim, with associated avalanches and explosions
By mid-March, the new lobe was large enough to be visible from Colima city. Geologists visiting the summit on 27 March reported that the lava dome was 100 m across, 30-40 m high, and still growing. Some lava flowed into a small depression just NE of the nearly symmetrical dome. At the time of the visit, the dome margin was 3 m from the SW crater rim, and spawned about three avalanches/hour. Advance of the lava was shown by blocks falling from the dome front.
Other activity at the volcano had decreased significantly. Seismicity and the number of avalanches were reduced, and gas emission was low on the day of the visit. Civil authorities reduced the alert to the lowest level.
On 29-30 March, seismic stations closest to the volcano recorded sequences of a large earthquake followed at regular intervals (about 16 seconds) by smaller ones having the same wave form. The first and largest of the earthquakes was accompanied by enhanced fumarolic activity. Seismic activity declined to low levels (a few low-frequency earthquakes/day) until 12-13 April, when about 110 earthquakes were recorded daily, then returned to background levels. A new fumarolic area, SE of the dome, was observed from Colima city at about the time of the increased seismicity.
At 0400 on 16 April, avalanche activity began to increase from the 7-20 events/day recorded since the seismic crisis four days earlier. Three hours later, a RESCO team climbed the volcano to service a seismic station located atop the parasitic vent Volcancito, on the upper NE flank. During their ascent, the team heard avalanches and saw summit-area fumarolic activity, dark gray NW of the dome and white to its NE. Air reconnaissance at about 1000 did not reveal any conspicuous fissures or bulges, although strong fumarolic emissions at the SE edge of the active lobe and some local brush fires at timberline were observed.
At 1600, after some relatively large, shallow volcanic earthquakes, a portion of the dome collapsed during a protracted series of avalanches, accompanied by earthquakes and large dust clouds. Explosions were heard by the RESCO team working at Volcancito. Reddish dust and gas were emitted some time later, accompanied by explosions heard within 5 km of the volcano. Wind carried most of the dust to the SE. Incandescent blocks of lava began to move downslope at about 2200, and by the next morning it was evident that part of the dome had been carried down the SW flank, along with a segment (~20° of arc) of the crater rim. A large avalanche was recorded at 0805 on 17 April, apparently accompanied by emission of a large plume, although visibility from Colima city was poor. Records from the nearest stations had been saturated by avalanche signals until about 1900 on 16 April, and showed continuous avalanche activity into the next day. More distant stations did not detect volcanic earthquakes.
Press sources reported strong lava extrusion, accompanied by ash emission and at least 3 recorded earthquakes, at about 1932 on 17 April. Ash carried by 45 km/hour winds fell 13 km SE of the summit (at Tonila). Strong lava discharge resumed at 1945. As of 18 April, geologists reported that lava continued to emerge from a new fissure in the area of the dome and crater rim collapse, sending hot blocks downslope. Periodic explosions ejected plumes to about 1 km above the summit.
Authorities readied transportation for about 2,000 people in eight villages near the volcano, but most residents chose to remain and only two villages (Juan Barragán and San Marcos) had been evacuated as of 17 April [but this preliminary evacuation report from the press was incorrect; see 16:4-5]. Colima airport was closed because of dust produced by the activity.
Information Contacts: Francisco Núñez-Cornú, F.A. Nava, Gilberto Ornelas-Arciniega, Ariel Ramírez-Vázquez, G.A. Reyes-Dávila, Hector Tamez, Guillermo Castellanos, R. Saucedo, R. García, and Jorge Piza, CICBAS, Universidad de Colima; Z. Jiménez and S. de la Cruz-Reyna, UNAM; Julián Flores, Instituto de Geografía y Estadística, Univ de Guadalajara; Michael Sheridan, State Univ of New York, USA; C. Connor, FIU, Miami; Notimex broadcast service, México City; AP.
Lava advances down SW flank after partial collapse of summit dome; rock avalanches from flow margins
The following is from Ana Lillian Martín del Pozzo and colleagues.
The new summit-dome lobe grew from about 6 m high and 20 m in diameter on 2 March to 36 m high and 109 m across on 14 April, but geodetic measurements on 15 April showed a reduction in its diameter due to the beginning of its emplacement down the SW flank. Seismicity recorded by four portable seismographs increased dramatically beginning on 12 April, saturating records; avalanche signals and both A-and B-type events were detected. Most seismicity after 15 April was related to avalanching (see also seismic data from RESCO instruments reported in 16:03). During the morning of 16 April, avalanching from the dome occurred every 3-5 minutes, increasing to constant landsliding about noon. Large Merapi-type avalanches began around 1515, with maximum intensity between 1700 and 1800. During that time, three distinct plumes were visible: a white gas column, fine gray ash being carried E, and fine-grained material produced by the avalanches. Colima airport was closed because of ashfall, although <5 mm of ash were measured there. Data from four dry-tilt stations N and S of the summit showed <10 µrad of deformation for the period 14-23 April. Weekly spring-water monitoring showed no pH or temperature changes, although sulfate and boron contents varied, having increased before 16 April. Declines in the levels of nearby lakes appear to have been caused by normal withdrawal of irrigation water.
The following is from a Centro Internacional de Ciencias de la Tierra (CICT) team, including geologists and geophysicists from the Universidad de Colima, UNAM, Univ de Guadalajara, Arizona State, and Louisiana State Universities.
Avalanches generated voluminous dilute dust clouds, mainly produced by the crumbling of blocks falling from the dome and the receding crater rim, and by reactivation of previously deposited dust. The component of hot new magma apparently contributed to the seemingly fluidized character of the avalanches [and the resulting Merapi-type block-and-ash flows].
After the partial collapse of the summit-dome lobe, a block lava flow emerged from the SW part of the dome and began to move down the SW flank. The flow, 70 m long and 40 m wide on 18 April, was about 100 m wide and at least 1,150 m long by the morning of 26 April, with its 25-m-thick front at 2,680 m altitude. Dimensions were similar on 18 May, and the flow was widening at its top. Small avalanches occurred from the flow front, from the crater rim adjacent to the flow levees, and from the levees themselves, especially the E levee. Blocks reached about 2,300 m elevation (~4,000 m outward from the summit) during the largest avalanche associated with the 16 April collapse. Dust clouds extended beyond the range of the avalanche blocks, and three canyons of the volcano's main drainage system on the SW and S flanks were filled with avalanche-derived clastic material, mostly very fine powder. This material has not been compacted and has a volume on the order of 106 m3. A lahar warning has been issued for the coming rainy season, which usually begins in early June. Lava extruded from the SW part of the dome was pushing older dome material toward the W and NW. Unstable material was accumulating, and geologists noted that additional avalanches could be expected in those areas.
Winds in the area have dominantly blown toward the SE to NE recently, and some light ashfall has been reported from towns in that sector up to 30 km away. Seismic records showed events with small wave packages that at times seemed to correlate with explosive summit degassing activity, but their number and amplitude were decreasing as of late April.
Observations of the summit area revealed that the 2 July 1987 crater on the E side of the dome (Flores and others, 1987, and 12:07, 13:09, and 15:12) had a ring-like pattern of fumaroles around its rim. A pair of whitish plumes persistently issued from the N part of the zone of lava extrusion, where some incandescence has been observed. Plume heights during similar wind conditions ranged from a few tens of meters to 1,500 m. As of 18 May, the summit-dome lobe was growing toward the edge of the pre-existing W dome. Geologists noted that if activity continues at the same rate, a new block lava flow will begin to develop, probably on the W or NW side of the volcano, in the next 2-3 weeks.
Airborne COSPEC measurements that began 25 April showed SO2 emission rates on the order of 300 t/d, similar to those observed in 1982 by Casadevall and others (1984) and in 1985 by geologists from Dartmouth College. Geologists noted that these stable low levels were consistent with the absence of significant deep seismicity or harmonic tremor and support an interpretation that the present cycle of activity does not include the ascent of significant new magma or magmatic gases from depth.
Alert warnings have been issued and transportation made available for possible evacuation of towns in the risk area, which extends to 12 km on the SW flank. However, geologists noted that no evacuations have occurred, since the volume of rock avalanches was limited to a few hundred thousand m3 and seismicity has remained at relatively low levels, without harmonic tremor or low-frequency earthquakes.
The following, from J.B. Murray, describes ground deformation work 1-7 March.
"Ten kilometers of levelling lines, established in 1982, were measured 1-4 March, as were five of six dry-tilt stations. The 6th, on the W side of the cone, could not be measured, because repeated rock avalanches from the dome made it extremely hazardous to approach this side of the mountain.
"The levelling traverse was last occupied in March 1990, and results show that there have been no large changes since then. There was a slight subsidence of the stations nearest to the summit (just over 1 km from the dome), which have dropped 2.5 cm relative to the farthest stations, 3 km from the summit and outside the caldera. Within the precision of the method, the subsidence appears to be radial to the summit, or perhaps between the summit and the parasitic vent Volcancito (on the upper NE flank).
"The three dry-tilt stations within the caldera all showed tilts to the S over the past year. Those on the Playon (the caldera floor at the NW foot of the active cone) had small tilts of 9 and 15 µrad. The station on Volcancito has tilted 39 µrad, although this value is less reliable because the combination of benchmarks used was different than in 1990. The other two stations (at Nevado de Colima and Barranca La Arena), 6 km N and 9 km S of the summit, were vandalized or otherwise disturbed.
"At first sight these results appear reassuring, as one would expect more pronounced deformation if there were any major increase in magma supply that might be associated with a cataclysmic event. However, caution must be exercised, since (a) ground deformation prior to a major eruption has not been measured at Colima before, and is poorly known on this type of volcano, and (b) the levelling traverse and two of the three dry-tilt stations are N of the volcano where the ground rises toward Nevado de Colima, whereas most of the deformation could be occurring on the unbutressed S flank.
"Many large rock avalanches were seen on 1 March, but from 2 March, the rate declined somewhat. During the levelling 2-4 March, avalanches were noted at the overall rate of 3.2/hour down the N and W sides. From the same area, avalanches were noted at the hourly rate of 1.4 on 29 March-1 April 1990; 0.4 on 4-5 February 1986; and 1.5 on 3-7 December 1982. These figures underplay the 1991 activity, because the avalanches were much larger this year and continued for much longer."
References. Casadevall, T.J., Rose, W.I., Fuller, W., Hunt, W., Hart, M., Moyers, J., Woods, D., Chuan, R., and Friend, J., 1984, Sulfur dioxide and particles in quiescent volcanic plumes from Poás, Arenal, and Colima Volcanoes, Costa Rica and México: JGR, v. 89, no. D6, p. 9633-9641.
Flores, J., and others, 1987, Informes de las recientes observaciones practicadas en el Volcán Colima: Revista del Instituto de Geografía y Estadística, Universidad de Guadalajara, México, v. 3, no. 2.
Further Reference. Rodríguez-Elizarrías, S., Siebe, C., Komorowski, J.-C., Espindola, J., and Saucedo, R., 1991, Field observations of pristine block- and-ash-flow deposits emplaced April 16-17, 1991 at Volcán de Colima, Mexico: JVGR, v. 48, p. 399-412.
Information Contacts: Francisco Núñez-Cornú, F.A. Nava, Gilberto Ornelas-Arciniega, Ariel Ramírez-Vázquez, R. Saucedo, G.A. Reyes-Dávila, R. García, Guillermo Castellanos, and Hector Tamez, CICT, Universidad de Colima; S. de la Cruz-Reyna, Z. Jiménez, J.M. Espindola, and Sergio Rodríguez, UNAM; Julián Flores, Instituto de Geografía y Estadística, Univ de Guadalajara; Claus Siebe and J-C. Komorowski, Arizona State Univ, USA; S. Williams, Louisiana State Univ, USA.Ana Lillian Martín del Pozzo, J. Panohaya, F. Sánchez, R. Maciel, and A. Aguayo, Instituto de Geofísica, UNAM; D. Barrera, Centro de Ciencias de la Tierra, Univ de Guadalajara; G. González, Univ Autónoma de Puebla; J.B. Murray, Open Univ, UK.
Continued lava dome growth; increased avalanching follows earthquakes and tremor episodes
During the weeks preceding 5 June, volcanic seismicity recorded by RESCO remained at low levels, showing only a few avalanches/day. Poor visibility prevented daily visual observations from the city of Colima, but sporadic observations from sites near the volcano (Yerbabuena and La Joya) have shown strong fumarolic activity (mainly vapor and a small grayish plume) and continued growth of the dome extrusion.
On 6 June between about 0000 and 0200, a tremor episode was clearly recorded by station EZV7 (at Volcancito, ~1 km NE of the summit), but was barely detectable at other stations. Activity then returned to previous levels. A second tremor episode, much stronger and clearly recorded by several stations, occurred between about 1800 and 2100, after which seismicity again returned to relative quiet. The activity was interpreted as probably being of phreatic origin, given recent rainfall in the region. Witnesses about 13 km from the volcano (in the Tonila area) reported conspicuous incandescence at the crater.
A third seismic episode, on 8 June between about 2000 and 2200, consisted of four large, complex shallow earthquakes followed by almost monochromatic harmonic tremor. The caretaker at nearby La Joya reported hearing four explosions followed by strong sustained whistling. On 9 June, a few small closely-spaced B-type earthquakes seemed to mark the onset of another tremor episode, but it did not materialize and no further tremor activity had been recorded as of 13 June.
During the evening of 9 June, there was an increase in both the number and duration of avalanche events, which remained of small magnitude. Long-duration avalanches continued as of 13 June, but their numbers had decreased. Geophysicists noted that the increased number and duration of avalanches on 9 June was similar to that observed before the 16 April dome collapse. No deep seismicity, indicating stress at depth, has been detected, but the tremor, not previously observed, suggested changes in activity requiring careful monitoring.
Information Contacts: F. Alejandro Nava, Francisco Núñez-Cornú, Gilberto Ornelas-Arciniega, Ariel Ramírez-Vázquez, G.A. Reyes-Dávila, Hector Tamez, and R. García, CICT, Universidad de Colima; Z. Jiménez, I. Yokoyama, and S. de la Cruz-Reyna, UNAM.
Avalanching from summit dome; flank lava flow continues to advance; April tephra fall mapped
CICT personnel visited the N and W flanks of the upper cone (El Playón and Soma areas) on 15 June, to observe morphological changes on the N and NW sides of the summit lava dome, and check reports of incandescence seen 8 June from nearby Nevado de Colima. Despite rainy weather, it was evident that a landslide 200-300 m long had occurred from the N side of the dome. A high-frequency seismic signal, interpreted as continuous avalanches, began at 1306 on 15 June and continued for about 30 minutes on RESCO stations EZV7 (at Volcancito, ~1 km NE of the summit) and EZV4 (on the NW flank). At 1440, RESCO seismometers recorded a large avalanche that lasted about 20 minutes, and was similar to the seismicity associated with the partial dome collapse on 16 April. The geologists saw a large fumarole and big reddish and yellow-brown dust clouds at 1450, while small gray plumes emerged from the dome; similar activity had been observed by a CICT team on 16 April. Morphologic changes were evident to the SSW side of the dome, probably from the partial collapse on 15 June, and the dome had decreased in height. The lava flow, about 20 m thick, continued to advance (down the El Cordobán canyon), reaching 3 km length and 2,500 m altitude (figure 14). Weather had prevented aerial monitoring of the lava flow.
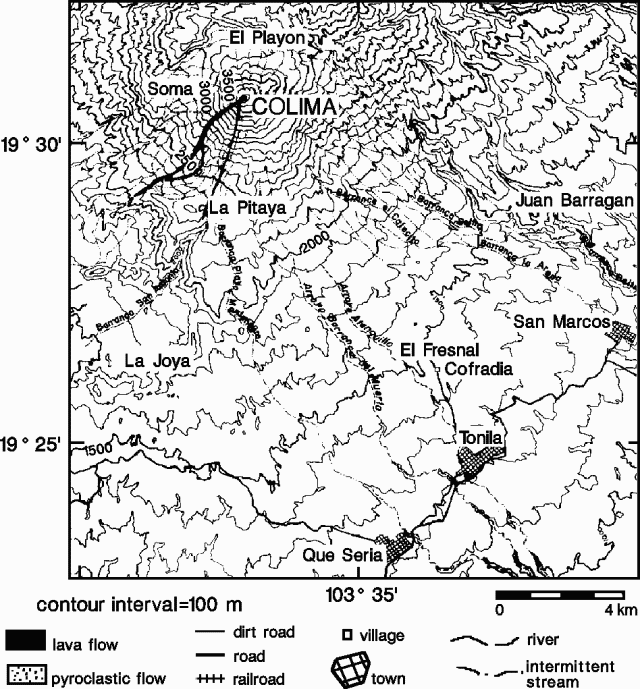 |
Figure 14. Topographic map of the Colima area, showing lava and pyroclastic-flow deposits on the SW flank. Courtesy of the Universidad de Colima. |
Mapping of 16-19 April airfall ash distribution showed that tephra volume was limited (figure 15). Unusual winds during the eruption carried ash to the SE. Small block-and-ash flows had been emplaced along the El Cordobán and Montegrande canyons; ashfall and block-and-ash flow deposits in the El Cordobán canyon area had been [significantly eroded] by the season's first rains.
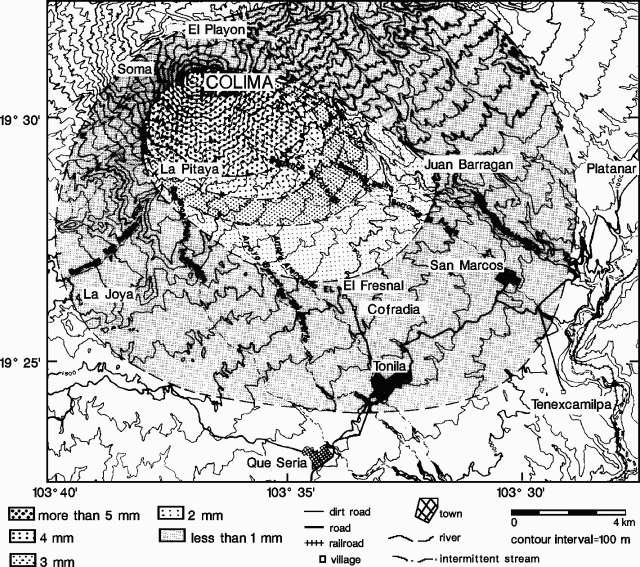 |
Figure 15. Isopach map showing ashfall from the 16-19 April activity at Colima. Courtesy of the Universidad de Colima. |
During the last two weeks in June, seismicity remained relatively constant, with no additional large avalanche episodes detected. There was no strong seismic evidence of impending changes in the eruption, but geologists recommended increased monitoring, including COSPEC analysis, to allow more complete evaluation of the activity.
Information Contacts: Francisco Núñez-Cornú, Julián Flores, F. Alejandro Nava, R. Saucedo, C. Valencia, Ariel Ramírez-Vázquez, G.A. Reyes-Dávila, R. García, and J. Hernández, CICT, Univ de; Z. Jiménez, S. de la Cruz-Reyna, and I. Yokoyama, UNAM; P. Lesage (France); D. Córdoba, UCM, Spain.
Block lava flow advances; new dome lobe; seismicity
Block lava continued to advance down the main cone's SW flank, generating small avalanches from the flow front and levees. Avalanches have also occurred from the summit area, similar to those that preceded the partial collapse of the newly extruded dome on 16 April. A new lobe was observed in the W part of the summit area on 28 July. Poor weather has severely limited observations of the summit, so the date of the new lobe's extrusion is not known.
On 3 August at about 0600, a NW-flank seismic station (EZV4) recorded the beginning of signals that formed a distinctive wave package with a periodicity of about 15-20 seconds. By 5 August at 1200, the amplitude of these signals had nearly doubled and the periodicity had dropped to 10 seconds. The next day at about 0100, seismicity decreased to nearly background levels, but at 0900 sustained harmonic tremor was registered by EZV4 and other nearby stations (EZV3, 5, and 6); heavy rain during the second week in July had damaged the seismic station about 1 km NE of the summit (EZV7, at Volcancito), and poor weather has prevented it from being re-established. Harmonic tremor continued until 8 August at about 0600. During the increased seismicity, the plume was vigorous and a dense white color.
Information Contacts: Francisco Núñez-Cornú, Julián Flores, F. Alejandro Nava, R. Saucedo, G.A. Reyes-Dávila, Ariel Ramírez-Vázquez, J. Hernández, A. Cortés, and Hector Tamez, CICT, Universidad de Colima; Z. Jiménez and S. de la Cruz-Reyna, UNAM.
Fumarole temperatures increase
"Five high-temperature fumaroles on the SW rim of the summit lava dome have been monitored continuously since May. These fumaroles are ~75 m W of the site of the March-May lava extrusion and occur along fractures radial to the dome. Temperatures were measured at 20-minute intervals and radio-telemetered to the Science Center in the city of Colima. Temperatures at two of the fumaroles have increased at a steady rate between May and August (figure 16). Mean late-August temperatures were 506 and 386°C, increases of 66 and 43°C, respectively, since May. Mean temperatures in three other fumaroles have changed <10°C during the same period. Throughout the sampling period, all fumaroles exhibited marked diurnal temperature variation, on the order of 30-80°C/day. The rainy season, which began in mid-June and has continued through August, has had little effect on fumarole temperatures other than occasional low readings during rainstorms."
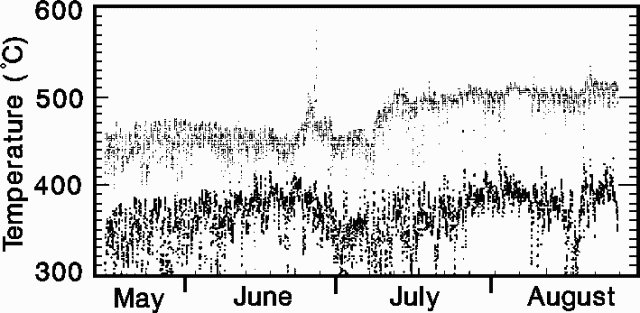 |
Figure 16. May-August 1991 temperatures at two fumaroles on the SW rim of Colima's summit lava dome, about 75 m W of the site of March-May lava extrusion. Measurements, at 20-minute intervals, were radio-telemetered to the Science Center, city of Colima. Courtesy of C. Connor. |
Information Contacts: C. Connor, FIU, Miami.
Landslides and thermal activity
The rainy season limited summit observations in August and September, often cloaking the volcano in clouds, and severely damaging the unpaved access road. By October, however, aerial reconnaissance and distant ground observations indicated changes to summit morphology. Some landslides had apparently occurred along the 1975 flow levees on the main cone's SE flank, and weak steam clouds rose from points along the 1975 lava. The SSW flank was occupied by the March-April 1991 lava flow, which stopped after descending to 2,600 m altitude. The flow is about 100-125 m wide and reaches a maximum thickness of 25 m, with a central depression about 10 m deep. [Deposits produced after the partial collapse of the summit lava dome on 16 April were eroded during the rainy season, leaving new ravines 5-15 m deep. See follow-up report in BGVN 17:06.]
Fumarolic activity has been irregular, appearing strong on some days, weaker on others. Fumaroles were concentrated in the area of the 1991 lava flow outlet and on the NE part of the summit dome. Weak fumaroles were also visible on zones of expansion on the main dome.
Information Contacts: J. Flores, J. Hernández, R. Saucedo, A. Cortés, C. Valencia, and R. García, CICT, Universidad de Colima; Z. Jiménez, Instituto de Geofísica, UNAM.
B-type earthquakes and avalanche events
August seismicity included 79 B-type events with recorded amplitudes exceeding 15 mm. A few moderate Merapi-type avalanches were seismically recorded, but weather conditions prevented visual observations. The longest series of avalanches lasted 1.5 hours on 20 August, 30 minutes on 28 August, and 2 hours on 30 August. Total seismic activity and the number of Merapi-type avalanches decreased significantly in September, but rose in October, with seismicity returning to near August levels.
Seismic monitoring was somewhat impaired by lightning damage and lack of sunlight to charge the instruments' solar batteries. All of the RESCO stations were repaired by 24 August with the support of a Ministry of Defense helicopter. Additional lightning damage was repaired by 26 October, and all RESCO stations were operative as of early December.
Information Contacts: A. Nava, F.J. Núñez-Cornú, G. Reyes, J. Flores, R. Saucedo, H. Tamez, J. Hernández, A. Cortés, C. Valencia, and R. García-Arthur, CICT, Universidad de Colima; Z. Jiménez and S. de la Cruz-Reyna, UNAM
Earthquake swarm and landslides, but fumarole temperatures remain steady
Colima remained quiet from November through January. In mid-January, the top of the cone was snow-covered. The snow later melted and some small landslides were observed.
A team from FIU and Earthwatch visited the summit dome on 28 January. No changes were evident since their previous visit in September 1991. Degassing remained widespread on the dome but was distinctly less vigorous than during active lava extrusion in May. Snow was as much as 2 m deep in some places near the summit, but was absent in fumarolic areas. Four small rockslides occurred on the N flank of the dome during three days of observations, a much lower rate than in May but similar to that of September. Temperatures at four fumaroles were continuously recorded between 1 November and 28 January. Mean temperatures remained between 475 and 535°C. Temperatures were quite steady (except for diurnal variations) and were not affected by unseasonably heavy January precipitation.
Geologists with the CICT reported that six low-magnitude seismic events were recorded during the last three days of February, some only by the Soma station 700 m NW of the cone. No earthquakes were detected 1-3 March, but on 4 March, the Soma station recorded 42 shocks, 17 of which were also recorded by the Yerbabuena station, 7.5 km SW of the summit. No seismicity was evident at more distant stations. Some landslide events were detected at the Soma station, suggesting that they occurred on the NW flank. Seismic activity increased during the first 12 hours of 5 March, when the Soma station registered 39 earthquakes, of higher amplitude than the day before; 24 events were detected at the Yerbabuena station during the same 12-hour period. Geologists observed few morphological changes on the cone's N and NE flanks, although there was some evidence of landslides, probably caused by heavy rain and snow in January. From the W side of the cone, 12 landslides were noted on 5 March between 1145 and 1508; five lasted 3-4 minutes. A gorge near the summit had been recently eroded by the landslides. Although the seismicity and landslides were similar to the activity that preceded the dome extrusion beginning in March 1991, activity had declined to near background by 10 March.
Information Contacts: Ignacio Galindo, Centro Internacional de Ciencias de la Tierra (with participation of CICT and RESCO staff), Universidad de Colima; S. de la Cruz-Reyna, UNAM; C. Connor and J. West-Thomas, FIU, Miami.
Rockfalls and thermal activity; large lahar deposit described
The following . . . covers activity between 10 April and 30 June 1992, and describes the 25 June 1991 lahar deposits.
Seismicity and rockfall activity. After a brief seismic crisis 4-10 March, activity at Colima remained near background levels. Starting 10 April, seismicity became more frequent. Nine B-type earthquakes were detected by the Red Sismológica de Colima (RESCO) and up to 60 events were recorded 10-20 May at the SW-flank Yerbabuena station (figure 17). Subsequent seismic activity remained near background, with only four B-type earthquakes recorded by RESCO 20-31 May, and three between 1 and 20 June. Seismic activity increased slightly 21-30 June, when 22 B-type earthquakes were recorded and the number of associated seismically detected rockfalls reached 55. Other rockfalls were also noted, probably associated with small diurnal changes in the volcano's hydrothermally altered summit region, which might be related to changes in rock temperature and surface water content. Extraordinary out-of-season precipitation in January, related to the El Niño/Southern Oscillation event of 1991-92, exceeded 700% of the monthly mean of the past 30 years and must have saturated the volcano's upper porous regions.
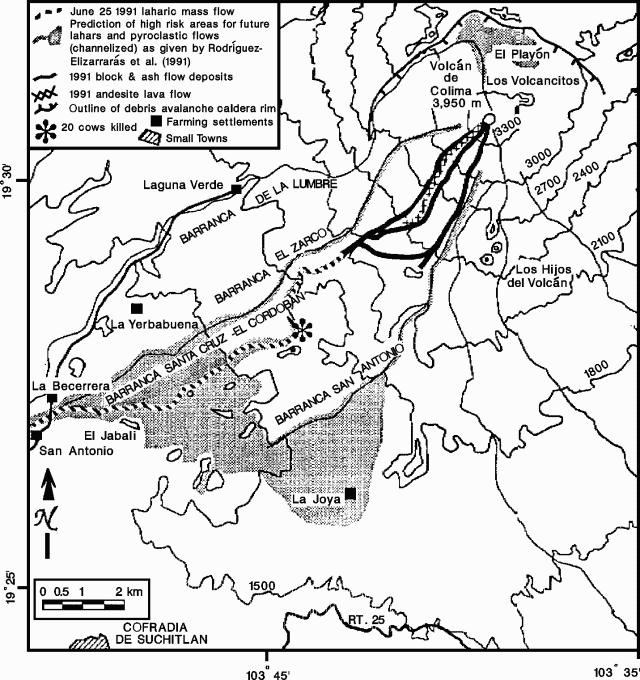 |
Figure 17. Sketch map of the summit area and SW flank of Colima, showing major canyons and recent volcanic deposits. Modified from Rodríguez-Elizarrarás, and others, 1991. |
Current thermal activity. Fumarolic activity has been steady, with an impressive white plume that can rise several hundred meters above the summit before dissipating. This represents the systematic release of meteoric water accumulated in the upper part of the volcano, not an increase in the magmatic component of the fumarolic activity. Further avalanching of the most precarious hydrothermally altered regions of the summit area is expected during the rainy season, which has just started.
25 June 1991 lahar deposit. Block-and-ash flows emplaced about 1 x 10⁶ m3 of loose pyroclastic debris in the upper Barranca El Cordobán during collapse of the crater dome and rim on 16-17 April 1991, just before the 1991 lava flow began to move down the SW flank (figure 17) (Rodríguez-Elizarrarás and others, 1991). Despite heavy rains in May-September 1991, geologists from the CICT reported that most of the pyroclastic deposits had been washed away without producing sizeable mudflows (Rodríguez-Elizarrarás, and others, 1991). Nevertheless, on 28 March 1992, S. de la Cruz-Reyna and CICT geologists observed a significant laharic mass-flow deposit near El Jabalí, which was studied 5-7 June by J.-C. Komorowski and CICT geologists. A more thorough field and laboratory investigation of this deposit is in progress.
The lahar reached the settlements of La Becerrera and San Antonio, ~12 km SW of the summit (figure 17). Unequivocal non-reworked lahar material was seen at 1,280 m elevation, ~500 m above the confluence of the barrancas El Zarco and El Cordobán. The total thickness was 2 m with a channel width of 30 m. Deposits from this lahar have been identified up to ~1,900 m above sea level, at the bottom of a 20-30-m vertical lava wall in the barranca El Cordobán. The barranca's slope flattens drastically after the lava wall, so deposition probably began below this point. The most distant block-and-ash flow deposits in this barranca reached down to 2,100 m elevation. Upstream, the barranca was significantly eroded by water and debris from a maximum elevation of 2,600 m. Although there is no clear evidence of lahar deposits at San Antonio and La Becerrera, one person reported that the water crossing on the San Antonio-Laguna Verde road was obstructed for two days by lahar material, until machines cleared the debris. Such occurrences are frequent in the rainy season, because several large barrancas draining the upper slopes join there to form a channel 30 m wide.
We estimate the total lahar path at 9.9 km. Based on several measurements at different sites, the lahar deposit averages 25 m wide and 2 m thick. Maximum width was 38 m and maximum thickness 2.9 m at 1,640 m elevation (star on figure 17). Volume was estimated at approximately 0.5 x 10⁶ m3, or about 50% of the material estimated to have been emplaced by the 16-17 April 1991 pyroclastic activity. Field evidence and testimony (see below) unequivocally show that all of the lahar deposit was emplaced during one event. April 1992 field studies of barrancas at higher altitude revealed tremendous erosion since April 1991, leaving ravines incised deeply (to 15 m) into the pre-1991 pyroclastic deposits. A significant volume of loose 1991 debris remains on the mountain, ready to be incorporated into lahars during the rainy season.
Preliminary field investigations showed that the lahar deposit is characterized by a very flat surface, with suspended lava blocks to 1-2 m in maximum dimension protruding through the surface, and abundant pumiceous clasts from eroded 1913 deposits. The deposit is massive, non-stratified, non-graded, poorly sorted, and matrix supported. Its typical massive lowermost zone (0.6 m thick), locally well-sorted, has a concentration of blocks (to 0.5 m size) and wood fragments at the base, a prominent clast-supported medial zone (0.7 m thick) with imbricated sub-rounded boulders (to 0.3 m), and an uppermost massive unit (0.8 m) with a tendency toward reverse grading of lithic cobbles, supported in a sandy matrix. The deposit is typically semi-indurated. Inter-unit contacts are sharply defined in several places, most likely reflecting shear between rheologically different portions of the mass flow. Given the large suspended blocks, the very flat surface, the constant thickness over 9 km of travel distance, the presence of marginal levees, and overturned logs that came to rest vertically, the mass flow clearly had a significant yield strength. However, it must have been relatively swift, as it was able to flow around topographic barriers in the channel, and in some places to leave an elevated deposit on the outside wall when it rounded a sharp curve.
Few people witnessed the lahar. The best testimony came from a farmer (Ramón Aguirre Valencia) who went to Barranca El Cordobán on 26 June 1991 to check his cattle. At 1,600 m altitude, the barranca was filled by a gravel- and boulder-rich deposit with a flat surface. Rocks on the surface were coated with a thin layer of light-colored fine ash. Of the 20 cows killed by the lahar, several could be seen, with horns, heads, and feet protruding from the deposit. Numerous tree trunks several meters long and as much as 30 cm in diameter were also on the lahar's surface. Heavy rains had occurred the previous day, and the lahar apparently began to form after about 2 hours of heavy precipitation, accompanied by loud thunder. The nearest meteorological station (Cofradía de Suchitlán), about 12 km from the lahar's most likely source area, recorded 50 mm of rain on 25 June. By 3 July, a ravine had developed in the new lahar that was as deep (4.6 m) but not as wide as the present channel, which now spans 10.6 m of the 38-m-wide deposit. Five kilometers downstream, the lahar overran and destroyed a 2-m-high stone wall at El Jabalí and clogged the existing channel, but 2 km farther downslope, residents of La Becerrera noticed nothing unusual. Larger sediment flows reported at La Becerrera in January may have been related to breaching of a small earthen dam.
Warnings of future lahar flows and the hazards within Barranca El Cordobán were reiterated to authorities in 1992, as abundant loose material remains from the 1991 eruption and recently exposed 1913 pyroclastic units. The El Jabalí basin is filled with old mass-flow deposits that have traveled down several steep, deeply incised barrancas. On 12 June, CICT organized a meeting that included civil protection authorities to discuss these hazards.
Reference. Rodríguez-Elizarrarás, C., Siebe, C., Komorowski, J.-C., Espindola, J.M., and Saucedo, R., 1991, Field observations of pristine block-and-ash flow deposits emplaced April 16-17, 1991 at Volcán de Colima, México: Journal of Volcanology and Geothermal Research, v. 48, no. 3/4, p. 399-412.
Information Contacts: Carlos Navarro, Abel Cortés, I. Galindo, José J. Hernández, and Ricardo Saucedo, CICT, Universidad de Colima; Jean-Christophe Komorowski and Claus Siebe, Instituto de Geofísica, UNAM.
New 1992 lahar deposit identified, activity declines from last August
The following report . . . describes rockfall activity and seismicity between between 1 February and 31 July 1993, the summit area in March 1992 and February 1993, and a 1992 lahar deposit. Frequency of seismic activity, rockfalls, and fumarolic activity are relatively lower than in August 1992. The dome area remains hazardous for all visitors without protective clothing, gas masks, and radio contact.
Seismicity and rockfall activity. High-frequency, low-amplitude seismicity, not clearly distinguished from background levels, was detected from 23 February to 30 March. The signals began intermittently but became constant 28 February-3 March 1993. Twenty-three B-type volcanic earthquakes were recorded during that time period, apparently independent of the high- frequency signals. There were 32 observed rockfalls during this period that were not detected by seismometers.
From April to 31 July 1993, seismic activity was relatively low as 70 B-type events were recorded with no seismically detected rockfalls. Most observed rockfalls were probably associated with small diurnal changes in the hydrothermally altered summit area, which might be related to changes in rock temperature and surface water content. Rockfalls were observed most frequently in April (41), the driest month, followed by May (23), June (15), and July (13).
Observations of the active dome and the summit area. On 8 March 1992, Komorowski, Siebe, and Rodríguez spent 4 hours on and around the active lava dome, where conditions were hot and required gas masks despite the local wind and low air temperature at 3,800 m elevation. Some areas of the lava dome were still too hot to remain on for more than a few seconds. The dome was locally unstable, consisting of a chaotic pile of 2-5 m scoriaceous blocks and dense black lava. Several extrusive "crease structures" (Anderson and Fink, 1992), curviplanar walls of lava, extended from the central valley, resembling the petals of an open flower. The dome had a central depression ~50 m in diameter and 10-20 m deep, which presumably developed after partial deflation between April and December 1991. Dense, scoriaceous lava spines 5 m high rimming the N side of the depression have been present since December 1991. The highest elevation on the dome, excluding the spines, was 3,900 m on 1 December 1991.
A fracture network was identified in the W and NW summit region at about 3,860 m elevation (according to three altimeter readings; 3,810 m on the topographic map). Fractures up to 20 m long trending N75°W to N15°W extended up to the active dome. A normal fault striking N34°W was also observed. Weak fumarolic emissions and sulfur encrustations were seen in the widest (1-2 m), deepest (1 m), and most active fractures. A relatively flat plateau surrounding the active dome on the SW, W, and NW was composed of highly unstable lava and pyroclastic units that have been deeply altered hydrothermally. A 10-m-wide and 1-m-deep circular depression in loose hydrothermally altered material was also seen to the WNW of the active dome at 3,810 m (according to the map). In several areas, ~10-cm-wide fractures had developed and defined highly unstable vertical cliffs several hundred meters above the caldera moat. No rockfalls were observed during this visit, and there were no tremors felt or rumbling sound heard.
Another visit to the summit area and active lava dome was made on 4 February 1993 by Cortés, Navarro, and Komorowski. Variable atmospheric conditions sometimes made it necessary to wear gas masks. The gas plume was very dense in the early morning and filled most of the N and NE Playón area (caldera moat), ~600 m below the summit area. The dome rock was warm in places, and the 1975-76 and 1991 lava flows had weak fumarolic activity, confirming the continued presence of a thermal anomaly. Fumarolic emissions were vigorous but generally unchanged in the area N and NE of the active dome, especially just N of the 1987 phreatic pit.
On 12 February 1993, Navarro and Komorowski made a 35-minute helicopter flight over the summit. No major changes were evident compared with the last overflight by geologists on 20 March 1992. Intense fumarolic emissions were continuing in the pre-1991 lava dome area, N of the present dome. Gas output and plume color were highly variable in this zone. The 1991 lava dome was still weakly degassing, with a grayish to light-brown plume from the central depression. Erosion of unstable, highly altered lava and pyroclastics continued on the SW, N, and W upper summit. Rockfalls and small collapses have been common in this area since the major sequential collapse on 16-17 April 1991 that led to the emplacement of mixed juvenile and accessory pyroclastic flows to the S.
New 1992 lahar deposit identified. Fieldwork in April-May 1993 by Cortés and Navarro revealed the presence of an important lahar deposit in the Montegrande drainage at 1,520-1,900 m elevation, about 7 km S of the summit (figure 18). The lahar traveled 3.6 km to within 4 km NW of the town Quesería (population ~7,735). Above 1,570 m elevation the deposit varies in thickness from 2-4 m and consists of 3-4 sub-units (1.2-1.4 m thick) of semi-consolidated coarse sand to pebble-sized material, separated by thin layers (35 mm) of finer sand. The width of the deposit ranges from 4-7 m. The largest sub-angular boulders (2-3 m) protrude through the flat surface of the deposit and are supported by the finer matrix. In its most distal parts (1,570-1,520 m elevation), the deposit consists of at least three debris fans 60-185 m wide and 50-100 m long. Two farmers who own fields near the lahar deposit indicated that the mass flow occurred after five days of continuous rain in January 1992. About 2 hectares (5 acres) of pasture land and several fruit trees were covered by the lahar deposit, and several bee hives were buried in the river channel.
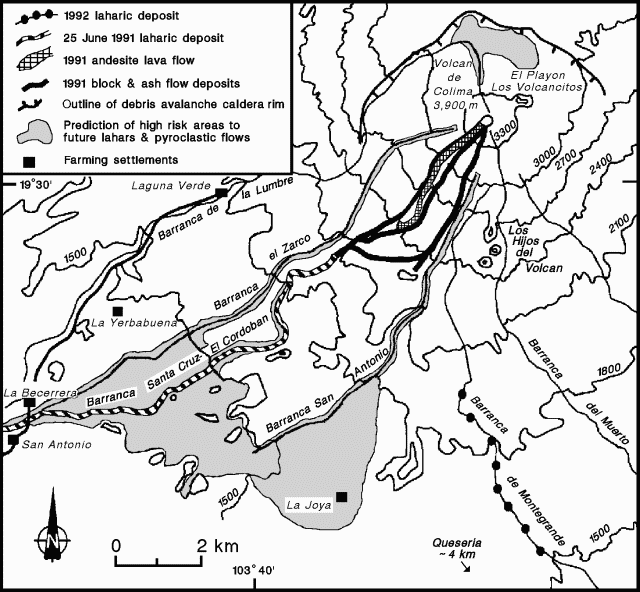 |
Figure 18. Topographic map of the summit area and SW flank of Colima, showing major valleys, recent volcanic deposits, and areas predicted to be at high-risk from future lahars and pyroclastic flows. Modified from Rodríguez-Elizarrarás and others, 1991. |
Based on the fact that the lahar mass-flow deposit is only seen from 1,520-1,900 m elevation (although higher deposits may have been eroded), and given the mean thickness of 3 m and mean channel width of 7 m, the estimated volume of the deposit is 75,600 m3. The volume in the distal debris fans is estimated at about 74,000 m3, giving a total estimated volume of 149,000 m3 compared to the 495,000 m3 of the 25 June 1991 El Cordobán lahar deposit (16:04).
Older lahar deposits have filled the Montegrande drainage and can be observed in the canyon walls. High-voltage electricity towers that bring power to Guadalajara from the Pacific coast have been built on some older lahar deposits in the river channel. Warnings for future lahar flows were given to the authorities of the Colima State Civil Protection, the National Electric Company, and the population of the Quesería area for the June-September 1992 rainy season.
References. Anderson, S.W., and Fink, J.H., 1992, Crease structures: indicators of emplacement rates and surface stress regimes of lava flows: Geological Society of America Bulletin, v. 104, p. 615-625.
Rodríguez-Elizarrarás, S., Siebe, C., Komorowski, J-C., Espíndola, J.M., and Saucedo, R., 1991, Field observations of pristine block-and ash-flow deposits emplaced April 16-17, 1991 at Volcán de Colima, México: Journal of Volcanology and Geothermal Research, v. 48-3/4, p. 399-412.
Information Contacts: Carlos Navarro, Abel Cortés, Ignacio Galindo, Ricardo Saucedo, Justo Orozco, and Gabriel Reyes, CUICT, Universidad de Colima; Jean-Christophe Komorowski, Claus Siebe, and Sergio Rodríguez, Instituto de Geofísica, UNAM.
SO2 flux measurements
On 22 January, ultraviolet correlation spectrometer (COSPEC) measurements taken by Fisher, Williams, Siebe, Delgado Granados, [and Komorowski] from an aircraft yielded 260 ± 80 metric tons/day (t/d) SO2. For comparison, during the interval 24-30 April 1991 twice-daily measurements averaged 300-600 t/d (Williams, 1991). On 23 January, members of the same team ascended to the summit and reported "diffuse degassing of not very acidic gases and a measured temperature of 360°C in the innermost part of the dome."
Ignacio Galindo reported that SO2 flux estimates are expected to continue on a monthly basis at Colima. Measurements will be made with their COSPEC instrument and personnel from a plane provided by the Civil Protection Authorities.
Reference. Williams, Stanley N., 1991, 1991 (February-June) eruption of Colima volcano, Mexico [abs.]: Geological Society of America Abstracts with programs, v. 23, no. 5, p. A-396.
Information Contacts: Tobias P. Fisher and Stanley N. Williams, Arizona State Univ, USA; Claus Siebe and Hugo Delgado Granados, Instituto de Geofisíca, UNAM; J-C. Komorowski, IPGP Observatoires Volcanologiques, France; Ignacio Galindo, CUICT, Universidad de Colima.
Fresh lava on the active dome; no subsidence in the past year
Clouds hampered observations during a climb to the summit on 2 March. Fresh, dark, unaltered lava on the active dome (figure 19) was hot, particularly along cracks. [J.B. Murray clarifies that this visual description was meant to emphasize the contrast between the newer dome rocks, which remained hot, and older highly altered rocks elsewhere. There was no evidence on 2 March to suggest that new lava had extruded since 1992.] The well-defined dome, ~100 m across and 15 m above the general level of the summit, had a depression on the W side. Fumarolic activity was concentrated in a pit on the E edge of the summit.
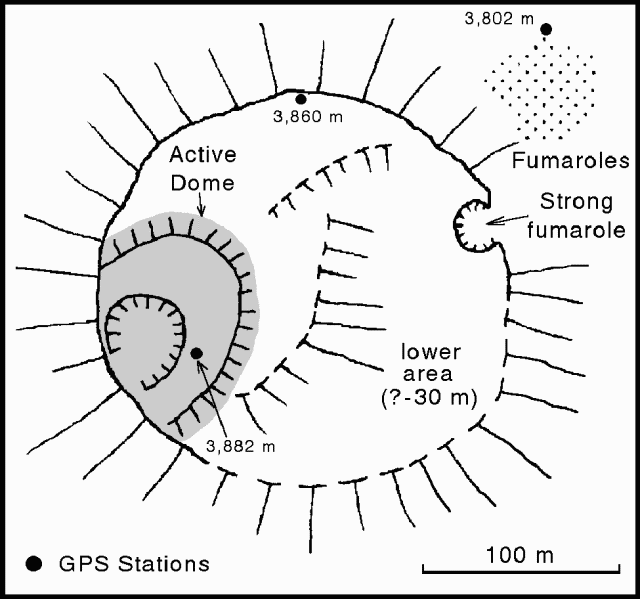 |
Figure 19. Sketch map of the summit area of Colima, 2 March 1994, showing the active dome, fumarole locations, and elevations of GPS stations. Courtesy of J. Murray and B. van Wyk de Vries. |
Only one rockfall was observed every 6 hours, compared to an average of one every 47 minutes recorded by John Murray during visits between 1982 and 1993. The low rockfall activity has coincided with an apparent change in the deformation regime. Preliminary analysis of 26 February-4 March 1994 ground deformation data, compared to the February 1993 survey, revealed no definite subsidence (unlike previous years), little movement, and no vertical changes >1 cm. Some stations have subsided while others have risen during this period.
Three GPS stations were established in the summit area: 1) at 3,802 m near the lowest fumarole on the NE side, 2) at 3,860 m near the N edge of the summit plateau, and 3) on the active dome. The station on the active dome was close to the summit, presently one of 4-5 lava spires protruding from the top of the dome at a measured elevation of 3,882 m (19.512°N, 103.617°W). These elevations are relative to the stations on the leveling traverse only; the nearest benchmarks of the national network are >20 km away. Elevations of the leveling stations were estimated by interpolation relative to the contours on 1:50,000 maps, and are consistent with accurately leveled heights to ± 3.4 m standard deviation. The summit height on the map is between 3,820 and 3,840 m. Although this implies an increase of >40 m since the aerial survey in 1975, the accuracy of the map is unknown.
Information Contacts: J. Murray and B. van Wyk de Vries, Open Univ; Mitchell Ventura and Julian H. Reynoso, Colima Fire Service, Colima, México.
Three earthquake swarms culminate in a strong phreatic explosion
A new episode of seismic activity developed on 4 July as a swarm of relatively deep (15-20 km depth) seismo-tectonic earthquakes lasted eight hours. Some of these events were large enough to be detected by all seismic stations of the Red Sismologica Telemetrica del Estado de Colima (RESCO) network, even those as far as 60 km away. Another swarm of shallower earthquakes occurred on 12-14 July.
A third swarm on 17 July was accompanied by small avalanches resulting from crumbling of the summit dome. Seismic activity continued to increase moderately until 21 July, when both seismic and avalanche activity suddenly increased at about 1800, culminating in a strong phreatic explosion that partially destroyed the 1991 lobe, producing a stronger avalanche and light non-juvenile ashfall on towns SW of the volcano. The explosion was detected by all RESCO stations and apparently damaged the uppermost station, located 1 km NE of the summit. It was also felt and heard in some villages more than 15 km away. Based on observations during an overflight on 25 July, it was estimated that about 3,000 m3 of material was ejected from the crater. Most of the material fell on the S flank at Barrancas El Cordobán and Zarco, far from any populated areas.
Seismicity decreased after the explosion and remained low at least through 27 July, interrupted only by minor rock avalanches. Civil Protection authorities were alerted after the explosive event, and some towns in the area of maximum risk were immediately evacuated.
A COSPEC flight on 16 July revealed a significant drop in SO2 output, from 260 ± 80 metric tons/day (t/d) on 22 January, to almost undetectable levels. On 25 July a new series of COSPEC measurements was made by CUICT-Universidad de Colima scientists from a Piper PA-32 airplane. Between 0825 and 1015 under a cloudless sky, the plume was traversed 10 times at an altitude of 3,300-3,600 m. The airplane executed a descending spiral within this altitude range. The global positioning system of the airplane computed the wind speed independently for each traverse, although wind speed was nearly constant. These measurements were used to make individual SO2-flux calculations. The SO2 flux on 25 July varied from 171 to 327 t/d, with a mean value of 256 t/d. A "puff" recorded on one traverse had a value of 458 t/d; this was not used as part of the average calculations. The preliminary interpretation is that SO2 concentration averages around 300 t/d.
Information Contacts: G. Reyes and A. Ramirez-Vazquez, Centro de Investigacion en Ciencias Basicas (RESCO-CICBAS), Universidad de Colima; I. Galindo, C. Navarro, A. Cortes, A. Gonzalez, and J.C. Gavilanes, CUICT Universidad de Colima; S. De la Cruz-Reyna and Z. Jimenez, Instituto de Geofísica, UNAM; B. Marquez and C. Suarez, Departamento de Geografia, Univ de Guadalajara.
Additional details about 21 July explosion; recent deposits described
Increased seismicity in July 1994 culminated in a phreatic explosion on 21 July, destroying the 1991 lobe and producing avalanches and ashfall. The following report, from the geology group of the CUICT at the Universidad de Colima, provides additional details about this activity based on observations from La Yerbabuena village (8 km SW of Colima).
Rock avalanches occurred during the two days prior to the explosion at 2020 on 21 July. At La Yerbabuena it was possible to hear about 15 rock avalanches between 2230 and 2330 on 19 July, each lasting for 2-3 minutes. The day before the explosion, 11 rock avalanches with durations of 1-3 minutes were heard within 3.5 hours, but rain and fog hindered observations. On 21 July, two eyewitnesses, located 10 km (rancho El Jabalí) and 8.5 km (rancho La Joya) SSW of the volcano, respectively (figure 20), observed 30 minutes of incandescent rock avalanches down the SW flank just prior to the explosion. Following these avalanches there was a 15-second-long sharp hissing sound, a reddish glow at the summit, and then the explosion. A dark mushroom-shaped column rose above the summit and remained for about 15 minutes before dissipating. The explosion was heard within a radius of 20-35 km S of the volcano (figure 20). Rock avalanches continued throughout the rest of the night.
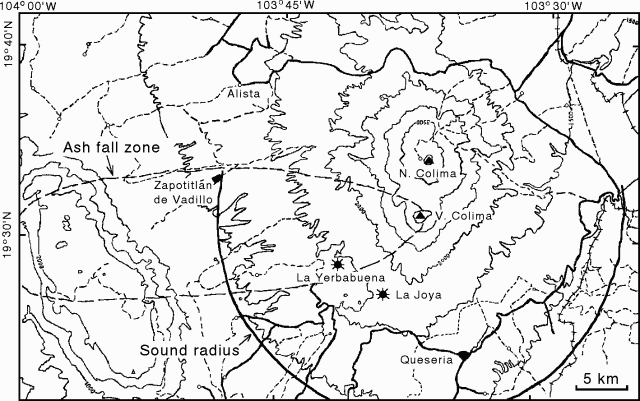 |
Figure 20. Map of the area around Colima volcano showing the limit of ashfall (dashed line) from the 21 July 1994 phreatic explosion, and the radius within which the explosion was heard (heavy line). Courtesy of Geology group at CUICT. |
Light ashfall began 30 minutes after the explosion and lasted for 90 minutes. An accumulation of 36.6 g of ash was measured during the first hour within a 1 m2 area at La Yerbabuena. Observations of the ash that night using a binocular microscope revealed no juvenile glass. Winds with velocities of 7.5-11.8 m/s at 3,500 m altitude transported ash as far as 35 km W, forming a deposit2 (figure 20). The ashfall caused no adverse effects to people or vegetation because of rainfall during the next few days.
Block-and-ash flows left deposits in the upper part of El Cordobán valley that stopped at 2,700 and 2,325 m elevation in two branches of the valley. Because of these deposits, civil protection authorities were notified of the possibility of lahars farther down the valleys during the current rainy season, similar to those that occurred following the 1991 eruption. Six days after deposition, temperatures at 20 cm depth in pristine block-and-ash-flow deposits were 116-282°C; some blocks yeilded temperatures of 120°C. Gas pipe structures were identified where hot vapor was escaping and forming conical features on the surface of the deposit. The block-and-ash-flow deposits had an average thickness of ~4 m and an estimated total volume of 450,000 m3 (in both branches). A massive ash-cloud surge deposit found on both sides of the El Cordobán valley was 1-2 cm thick and 50-70 m wide; brushwood and small trees were inclined in the direction of the flow, and maguey plants close to the valley rim were scorched. The ash-cloud surge extended ~500 m beyond the block-and-ash flow, and covered surrounding vegetation with 1-3 cm of ash.
A new lahar deposit was discovered at 1,650 m elevation in the Cordobán Valley. It was 80 cm thick and had enlarged the width of the channel by 1.7 m. Two eyewitnesses confirmed that at 1700 on 25 August, following three hours of rainfall, a lahar descended with the sound of rolling rocks. The lahar traveled ~10 km downslope, and covered part of a road at about 1,250 m elevation.
COSPEC flights made on 25 July and 6 August revealed an SO2 flux of 270 metric tons/day, close to the baseline value of 300 tons/day. Seismicity recorded at the Red Sísmica de Colima (RESCO) was low for the first 48 hours after the 21 July explosion, but then increased above the level recorded in the 72 hours before the explosion. A few minor explosions were also detected seismically.
Information Contacts: C. Navarro, A. Cortés, R. Saucedo, J-C. Gavilanes, J. Orozco, A. González, and I. Galindo (Director), CUICT-Universidad de Colima; G. Reyes and A. Ramírez, Centro de Investigación en Ciencias Básicas (RESCO-CICBAS), Universidad de Colima.
Summit temperatures, gas measurements, and July 1994 explosion crater description
Scientists from the geologic group of CUICT (Centro Universitario de Investigaciones en Ciencias de la Tierra), RESCO (Red Sismologica Telemetrica de Colima), and the Colima Volcano Observatory at the University of Colima visited the summit on 4 and 15 February 1995.
During a previous ascent on 20 May 1994, temperature measurements of fumaroles were taken at 21 locations in two areas, E and NE of the summit; values were in the 274-304°C range. A gas sampling experiment (SO2 and CO2) used an aspirating pump (Matheson-Kitagawa toxic gas detector system) with 100-ml precision detector tubes and 1-5 minute collection times. SO2 values of 200 ppm were measured at both sites; CO2was 0.2 and 0.3%, respectively. Low temperatures (<60°C) at the gas sampling sites were required. A second ascent later in 1994 was not undertaken because of increased seismicity following a phreatic explosion in July.
During February 1995, the group visited the same points as in May 1994, as well as the bottom of the July 1994 crater. On 4 February, fumarole temperatures measured at 17 locations in the E summit area averaged 372°C, with a high value of 504°C. Temperatures in the NE sector averaged 398°C. Gas sampling (HF, HCl, SO2, and CO2) was again conducted at almost the same sites. Values in the E and NE sectors, respectively, were as follows for each gas: HF, 17.4 and 78.3 ppm; HCl, 8.0 and 63.3 ppm; SO2, 180 and 460 ppm; CO2, 0.25 and 0.85%. On 15 February, temperatures taken inside the E rim of the July 1994 crater averaged 230°C. A survey showed the crater to have a rim diameter of 135 m, a depth of 40 m, a floor diameter of 37 m, and an internal slope of 30° on the E side (figure 21).
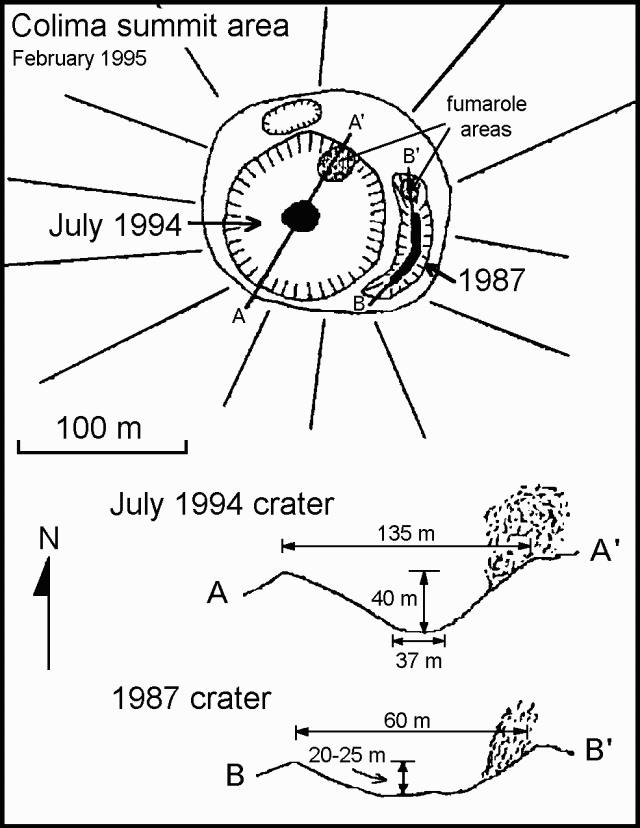 |
Figure 21. Sketch map and topographic profiles of the summit of Colima, February 1995. Courtesy of Andrea Csillag Tirelli, Universidad de Colima. |
A flight was made during clear weather on 11 February with a correlation spectrometer (COSPEC) to measure the SO2 flux. Ten traverses at 3,050 m altitude were made between two navigational benchmarks using the aircraft global positioning system (GPS), assuming that the traverses were perpendicular to the plume axis. Wind speed and direction was computed using GPS at two points beneath the plume as well as before and after the traverses above the summit. Wind direction was 289° with an average velocity of 10.9 m/s. The SO2 flux was determined to be 386 ± 160 metric tons/day, and was calculated according to instructions provided by S. Williams during a June 1994 workshop at UNAM in México City.
Information Contacts: Carlos Navarro, Juan-José Ramirez, Abel Cortes, and Juan-Carlos Gavilanes, Colima Volcano Observatory and CUICT, Universidad de Colima; Andrea Csillag Tirelli, RESCO-CICBAS, Universidad de Colima.
SO2 flux comparisons, fumarole temperatures, and impact crater measurements
The following report concerns the SO2 flux in the last half of 1994 and early 1995, and field measurements of fumarole temperatures along with the sizes of impact craters and the projectiles that formed them during the 21 July 1994 ballistic shower.
COSPEC SO2 measurements. . . . on 18 March 1995, our group, consisting of J-J. Ramirez Ruiz, J-C. Gavilanes, A. Cortes, C. Navarro Ochoa, and J-C. Komorowski, flew seven transects at 2,590 m altitude, below the plume, in cloudless weather. The roughly 8-km-long traverses always began and ended over the same navigational benchmarks, which were found using the aircraft's global positioning system (GPS). The speed and direction of the wind was computed at the beginning and end of each traverse. Before the first, and after the last transect we flew at the elevation of the plume (3,352 m) and along the plume's long axis to take wind velocity measurements at varying distances from the summit. Wind speed averaged 4.9 m/s at a bearing of 330°. The SO2 flux calculated as detailed in Casadevall and others (1994), was 69 ± 32 metric tons/day (t/d) with a range of 50-100 t/d.
These values were confirmed by vehicle-based terrestrial measurements of SO2, carried out two hours after the flight. The vehicle traversed below the plume at an elevation of ~1,000 m along the Colima-Guadalajara highway, 16 km E of the volcano summit. Five 13-km-long transects were made perpendicular to the plume direction. For these measurements we arrived at the relevant average wind speed of 3.5 m/s based on observations at the Volcancito meteorological station (located 1 km NE of the volcano at 3,550 m elevation). The resulting SO2 flux measurements gave an average value of 92 ± 24 t/d with a range of 68-111. These mobile terrestrial measurements, the first reported for Colima, were in good agreement with the above-stated airborne ones.
A summary of some Colima SO2 flux measurements appears in table 1. The 29 November flux is previously unreported CUICT data. The 11 February 1995 flux was corrected by CUICT scientists from the 386 ± 160 t/d reported in BGVN 20:02. The lowest measured SO2fluxes at Colima are for the 1986 period,
Table 1. Colima SO2 flux values in the second half of 1994 and early 1995. Sulfur dioxide was "almost undetectable" on 16 July prior to the 21 July 1994 eruption. Courtesy of CUICT.
| Date | SO2 flux (t/d) |
| 25 Jul 1994 | 256 |
| 25 Jul (puff) | 458 |
| 23 Nov 1994 | 79 |
| 29 Nov 1994 | 109 |
| 11 Feb 1995 | 77 ± 32 |
| 18 Mar 1995 | 69 ± 32 |
Field Observations. On 24 March 1995 our group (listed above) and R. Saucedo climbed to the summit for the monthly fumarole temperature monitoring and for visual observations of the 21 July 1994 explosion crater (figures 22 and 23). We spent about two hours at the summit, including an hour within the July 1994 crater. During our summit visit no earthquakes were felt and no rockfalls were heard or seen from the upper parts of the edifice. In contrast, during fieldwork around the volcano before and after the summit visit (14-27 March), we saw several rockfalls and associated dust clouds, including some viewed from as far as ~20 km away (Comala). The falls came mainly from the region S and W of the upper summit, oversteepened areas with high hydrothermal alteration.
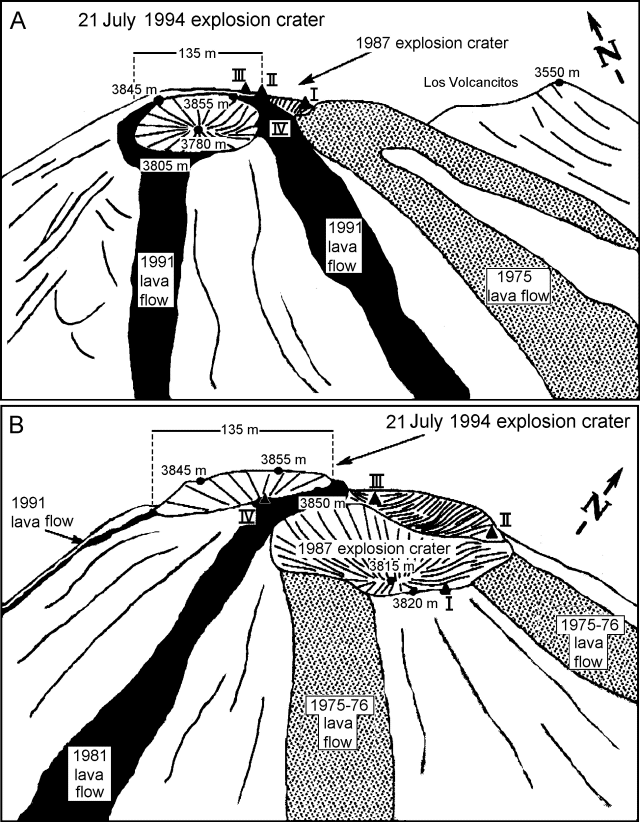 |
Figure 22. Sketch of the present Colima summit area with main topographic and geologic features and location of stable monitored fumarole areas. Elevations obtained from hand-held altimeter readings are relative, but appear comparable to those given by Murray and van Wyk de Vries in 1994 based on GPS and leveling data (BGVN 19:03). Redrawn after photos taken by Abel Cortes, CUICT, on 8 April 1995. |
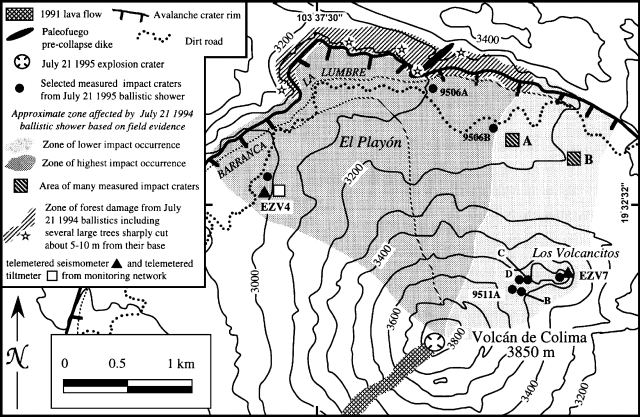 |
Figure 23. Map of the Colima area, showing part of the flat to gently sloping Playon area, situated between the active cone of Volcan de Fuego and the older Paleofuego volcano caldera wall. The map shows the area affected by the 21 July 1994 ballistic shower. Many of the impact craters measured were located in Areas A and B (each of these areas is 100 x 100 m in size). Courtesy of CUIT and J-C. Komorowski. |
Fumarolic emissions seemed unchanged overall and temperatures were similar to February 1995. Fumaroles remained vigorous N and NE of the July 1994 explosion crater, especially just N of the 1987 explosion crater. The E-rim fumarole (Connor's area, shown as fumarole I, figure 22) had an average temperature of 381.5°C and a maximum of 503.2°C. Gas masks were needed to work in some areas, including the N-NE strong fumarolic emission zone (areas I, II, and III on figure 22), the 1987 explosion crater, and inside and on the SE rim of the July 1994 crater.
The NE fumarole was the most vigorous of the summit areas (fumarole II, figure 22; same area labeled as "strong fumarole" by Murray and van Wyk de Vries in their summit sketch map in BGVN 19:03) with an average temperature of 359.2°C and a maximum of 420.2°C.
Overall, the main stable fumarole areas have shown the following temperature ranges over the last few months of monitoring by Colima CUICT scientists: fumarole I (167-504°C), fumarole II (312-490°C), fumarole III (306-488°C), and fumarole IV (210-265°C).
The summit appeared morphologically similar to when last visited on 4 and 15 February 1995 (BGVN 20:02). An area of meter-sized blocks with a peculiar jigsaw-fit pattern, repeatedly monitored for new movements within the crater, also showed no changes. The crater walls consisted of a chaotic pile of rubble blocks typically decimeters in size, and locally oxidized to reddish and yellowish colors.
A general impression was that numerous zones of yellowish sulfur had precipitated since February on the inner walls of the July 1994 crater. Sulfur crusts formed streaks extending primarily from the interior of the 21 July explosion crater, trending towards the NE and E sides of the rim and coinciding with a fracture/dike system (oriented N76E and inclined 12°E within the crater wall). Several fumaroles were located part way up the slope inside the crater, however, this crater displayed strikingly little fumarolic activity (during the dry season) compared to the area N of the 1987 explosion crater.
The majority of impact craters seen in the El Playon area and on the narrow pass between Colima volcano and Los Volcancitos were produced by blocks of dense gray vitreous fresh-looking lava identical to that found in small, 10-m2 patches on the explosion crater's walls. Thus, the explosion exhumed pre-1991 dome lavas. The degree of alteration and stratigraphic position of the dome lavas indicated they were not the result of a minor post-explosion extrusive event. In addition, we interpreted the July 1994 explosion, which took place in the rainy season, to have occurred at the buried base of the 1991 dome and its roots. The eruption probably occurred as a result of accumulation of magmatic and hydrothermally derived gases.
Five days prior to the 21 July 1994 eruption, the SO2 flux had reached so low as to be "almost undetectable" but on 25 July it rose to a mean of 256 t/d with a puff to 458 t/d (BGVN 19:06, and table 1). This behavior suggested temporary plugging of the conduit prior to the explosion and sudden release of gases. Despite the declining SO2 flux and the lack of an obvious body of cooling lava at the summit, the possibility of additional sudden explosions with ballistic showers cannot be ruled out. Although detailed seismic data are seldom readily available immediately before a climb, such background should be carefully considered before ascending toward either the summit or the El Playon area. Indeed, scientists from Colima reported having left the Playon area on 21 July 1994 at about 1600; the explosion and associated ballistic shower occurred four hours later. The explosion sprayed El Playon with volcanic bombs leaving numerous, 1-3-m-wide impact craters there (figure 23). The northward trend and narrow spatial distribution of the impact craters suggested a laterally directed explosion.
Months after the ballistic shower, we, together with Andrea Tirelli, inspected impact craters and in some cases, relict bombs. The diameters and depths of most to all impact craters, and in some cases the sizes of relict bomb blocks were measured (summarized in table 2, but data for 35 separate craters are available from the authors). The largest measured impact crater, 9511C, had a major axis of over 5 m.
Table 2. Summary of crater depth, diameter, and relict bomb size from the 21 July 1994 ballistic shower. More complete data (35 impact craters) available upon request. Courtesy of CUIT and J-C. Komorowski.
| Zone/Craters | Range of diam. for max. axis (m) | Depth Range (m) | Relict blocks max. axis (m) |
| Area A (6 craters) | 0.7-5.0 | 0.1-1.1 | -- |
| Area B (23 craters) | 0.5-5.0 (mean, 1.45) (sigma, 1.08) | 0.1-1.1 (mean, 0.3) (sigma, 0.24) | 0.3-0.9 (mean, 0.48) (sigma, 0.16) |
| 9511C | 5.3 | 0.7 | 0.5 ± 0.11; n = 12; range, 0.36-0.75 m |
At location 9506A (figure 23), an impact crater was found with a diameter of 2.9 m and a depth of 1 m. A relict block from the shattered bomb (a fresh, gray, dense, vitreous porphyry) measured up to 1.5 m.
At location 9506B another 1-m-deep crater measured 3 m in diameter. The associated bomb was totally shattered in a myriad of small, angular, 10-20 cm pieces (again composed of gray porphyry); bomb fragments extended over a distance of 5 m from the crater. The presence of the largest diameter craters (>5 m) at distances of 0.5 and 1.5 km suggests that either the explosion was not a single event or that over the area of damage, distance was not the only factor controlling the distribution of crater sizes.
Larger bomb fragments occurred in the crater. Other bomb rock types included reddish, hydrothermally altered, dense lava typical of older dome fragments from the summit area. Pine trees were also damaged; many were cut off at mid-height by mobile blocks (figure 23).
References. Casadevall, T.J., Doukas, M.P., Neal, C.A., McGimsey, R.G, and Gardner, C.A., 1994, Emission rates of sulfur dioxide and carbon dioxide from Redoubt Volcano, Alaska during the 1989-1990 eruptions: Journal of Volcanology and Geothermal Research, v. 62, p. 519-530.
Information Contacts: (in alphabetical order for the Colima Group)Abel Cortes Cortes, Juan Carlos Gavilanes, Carlos Navarro Ochoa, Justo Orozco, Juan Jose Ramirez Ruiz, Ricardo Saucedo Giron, Colima Volcano Observatory and CUICT, Universidad de Colima; Jean-Christophe Komorowski, Institut de Physique du Globe de Paris, France; Andrea Csillag Tirelli, RESCO-CICBAS visiting geologist, Univ. de Colima.
Measurements of SO2 flux, fumarole temperatures, and a lahar channel
The following report concerns Colima's SO2 flux between 1 April and 31 July 1995, its summit fumarole geochemistry, and a topographic profile of a barranca (steep-walled canyon).
SO2 measurements. Using a Cessna Skyhawk aircraft chartered by the Colima Civil Protection Authorities, a COSPEC survey was made on 30 March 1995. The wind speed and direction were computed for each of the six traverses by a global positioning system (GPS). At an altitude of 3,200 m, the average wind speed was 8.6 ± 1.1 m/s. The corresponding average SO2 flux estimate was 491 ± 104 metric tons/day (t/d).
On 5 July five vehicle-based terrestrial COSPEC transects were made along the Colima-Guadalajara highway, ~19.4 km NE of the summit. The average elevation of the transects was 1,300 m; the transects were oriented perpendicular to the direction of the plume axis. The average SO2 flux was 214 ± 91 t/d. The wind speed, measured at the Guadalajara City International Airport, averaged 7.62 m/s.
A third aerial COSPEC measurement was done on 11 July at an altitude of 3,050 m, ~3.5 km SW of the summit. GPS calculated wind speed averaged 9.26 m/s. The average SO2 flux for the six transects was 159 ± 78.5 t/d.
Field observations. On 28 July, the Colima Volcano Observatory group and J-C. Komorowski measured summit fumarole temperatures for the same three areas reported earlier; in summary the new temperatures had maximum values that were 14 and 43°C lower and 68°C higher than those reported in previous months (Areas I, II, and III, respectively).
Specifically on 28 July, in Area I, E of the summit, the six hottest fumaroles averaged 409°C and had a maximum value of 490°C. Area II, NE of the summit, contained two fumaroles with temperatures of 415 and 447°C. Area III, N of the summit, contained four fumaroles with an average 485°C; the maximum value reached 556°C.
An experimental gas analysis was conducted on an isolated 60°C fumarole (the same one reported in BGVN 20:02). The sampled gases and their concentrations were as follows: SO2, 20 ppm (1 minute sample time); HCl, 3 ppm (1 minute), HF, none detected (5 minutes); and CO2, 1,100 ppm (15 minutes).
An increase in the number of low-temperature fumaroles was seen in the 1987 explosion crater (E part of the summit). Some members of the group noted possible offset in the NE sector of the summit, a displacement identified by ~10-cm-long striations on the base of some big bread-crust blocks.
A topographic profile was measured perpendicular to the Cordoban barranca at the 1,620-m elevation and ~6.5 km SW of the summit, in order to study lahar deposits. Major lahars have been funneled down this barranca since 1991. During the rainy season, lahars have threatened the village of Becerrera (6.1 km downstream). This profile furnished evidence of 5-12 cm of deposition in the barranca during 4-18 July 1995.
Information Contacts: Juan J. Ramirez Ruiz, Carlos Navarro Ochoa, Abel Cortes Cortes, Juan Carlos Gavilanes Ruiz, and Ricardo Saucedo Giron, Colima Volcano Observatory, Univerisidad de Colima.
Minor rockfalls; measurements of SO2 flux and fumarole temperatures
The following report summarizes geochemical monitoring from mid-1995 through early 1996. All measurements were carried out by the Colima Volcano Observatory group and visiting colleagues. Measurements included SO2 fluxes, as well as fumarole temperatures, gas condensate chemistry, and S-flank hot spring temperature and pH readings.
COSPEC SO2 measurements. Five COSPEC surveys between 25 August 1995 and 3 January 1996 measured SO2 values of <200 metric tons/day (table 3). The aircraft used were provided by the Mexican Navy (on three surveys) and the Colima Civil Protection authorities (on two surveys).
Table 3. Summary of COSPEC SO2 measurements at Colima, 25 August 1995-1 January 1996. Courtesy of Colima Volcano Observatory.
| Date | SO2 avg. (tons/day) | Wind speed (m/s) | Altitude (m) | Number of transects |
| 25 Aug 1995 | 197 ± 73 | 11.3 ± 1.6 | 3,048 | 5 |
| 10 Oct 1995 | 52 ± 19 | 3.1 ± 1.1 | 2,286 | 7 |
| 23 Nov 1995 | 166 ± 87 | 9.0 ± 2.5 | -- | 7 |
| 29 Nov 1995 | 43 ± 16 | 18.3 ± 1.3 | 3,658 | 9 |
| 03 Jan 1996 | 50 ± 13 | 6.2 ± 2.5 | 3,190 | 7 |
Summit fumaroles. On 1, 8, 13, and 27 December 1995, and 4, 21, and 26 January 1996, observatory scientists measured summit fumarole temperatures (figure 24) for the same three areas measured in July 1995 (BGVN 20:06 and 20:07). The new temperatures had maximum values at least 50°C lower (Area I), 25°C lower (Area II), and 80°C higher (area III) than those obtained in July 1995. The temperatures at each fumarole showed variable oscillations over the two months of observation (table 4).
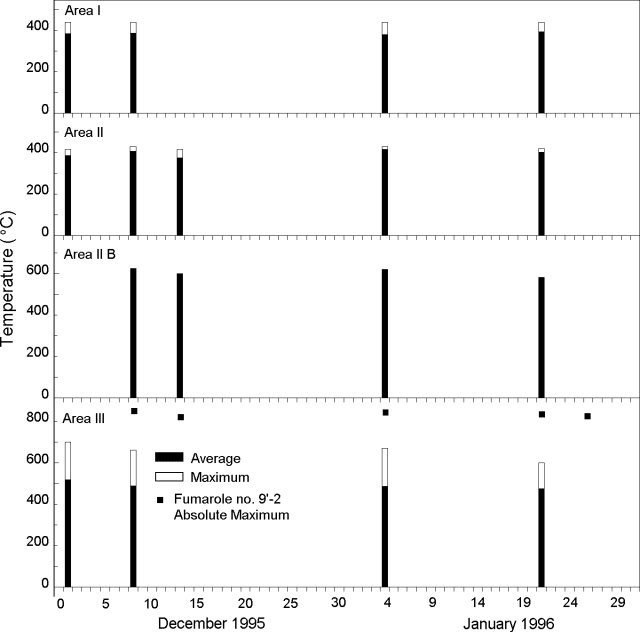 |
Figure 24. Average and maximum fumarole temperatures at Colima, December 1995-January 1996. Courtesy of the Colima Volcano Observatory. |
Table 4. Summary of fumarole temperatures (°C) at Colima, December 1995-January 1996. Courtesy of Colima Volcano Observatory.
| Area | Fumarole | 01 Dec 1995 | 08 Dec 1995 | 13 Dec 1995 | 17 Dec 1995 | 04 Jan 1996 | 21 Jan 1996 | 26 Jan 1996 |
| I | 1 | 365 | 382 | -- | 354 | 366 | 411 | -- |
| I | 2 | 422 | 427 | -- | 405 | 409 | 409 | -- |
| I | 3 | 442 | 437 | -- | 409 | 439 | 440 | -- |
| I | 4 | 430 | 428 | -- | 417 | 412 | 408 | -- |
| I | 5 | 281 | 265 | -- | -- | 255 | 268 | -- |
| II | 6 | 388 | 434 | 387 | -- | 428 | 386 | -- |
| II | 7 | 420 | 427 | 421 | -- | 426 | 420 | -- |
| II | 8 | 385 | 397 | 330 | -- | -- | -- | -- |
| II | 9 | 380 | 384 | 377 | -- | 401 | 397 | -- |
| II-B | 9' | -- | 628 | 610 | -- | 623 | 592 | -- |
| III | 9'-2 | -- | 856 | 825 | -- | 855 | 846 | 844 |
| III | 10 | 365 | 370 | -- | -- | 357 | 371 | -- |
| III | 11 | 370 | 386 | -- | -- | 413 | 402 | -- |
| III | 12 | 608 | 548 | -- | -- | 534 | 546 | -- |
| III | 13 | 700 | 670 | -- | -- | 684 | 636 | -- |
| III | 14 | 552 | 471 | -- | -- | 475 | 503 | -- |
During ascents on 1 and 8 December, extremely good visibility facilitated access to the dome area. This led to the discovery of high-temperature fumaroles never before measured by the Colima group. Fumaroles 12 and 13 in Area III were discovered on 1 December. It was not possible to establish the age of these fumaroles. Their high temperatures strongly influenced the average and maximum values for their area. However, this is not a proof of an overall increase in the temperature of the system. Fumarole 9' was found on 8 December at a "new" near-summit area called II-B, located roughly midway between areas II and III. The same day, J.C. Gavilanes discovered an incandescent fumarole (9'-2) in Area III. A reddish incandescence was visible ~30 cm below the surface inside its degassing hole. During the 13 December ascent, E. Tello took three gas samples from fumarole 8 in Area II. By 21 January this fumarole had disappeared.
On 26 January, another ascent allowed Yuri Taran to collect gas condensates from fumaroles 9 and 9'-2, with the following results: a) fumarole 9; temperature, 382°C; Cl, 6,730 ppm; F, 760 ppm; SO4, 5,400 ppm; B, 46 ppm; b) fumarole 9'-2; temperature, 738°C; Cl, 8,540 ppm; F, 620 ppm; SO4, 2,300 ppm; B, 12 ppm. These high-temperature condensates may indicate a proximal magma body.
Other observations. A rockfall from the summit area was noted by biologist D. Wroe while conducting research on the ecology of cats on Colima. He reported that on the night of 26 December he was awakened by dogs barking and this was immediately followed by a major rock avalanche.
Mr. Gonzáles-Dueñas, owner of the restaurant El Jacal de San Antonio (~10 km S of the volcano) witnessed about 10 rockfalls from the summit toward the S and SW during the first days of January 1996. This was confirmed by abundant whitish-yellowish dust covering the paths taken by the rockfalls. On 10 February, Saucedo and Komorowski witnessed one rockfall accompanied by a dust cloud that moved S; they also noted a whitish-yellowish dust along the rockfall's path.
Seven springs within 10 km of the summit on the S and SW flank had pH values of 5.9-6.9 and temperatures of 11-32°C. The highest temperature (30-32°C) and a high pH (6.2-6.8) was found at the San Antonio spring (7 km SSW of the summit). Only the San Antonio spring had been measured previously.
Information Contacts: Juan Carlos Gavilanes Ruiz, Carlos Navarro Ochoa, Abel Cortés Cortés, Ricardo Sauced Girón, Juan José Ramírez Ruiz, Eliseo Alatorre Chávez, and Vyacheslav Zobin, Colima Volcano Observatory, Universidad de Colima, Ave. 25 de Julio 965, Colima 28045, Colima, México; Jean-Christophe Komorowski, Institut de Physique du Globe de Paris, Observatoires Volcanologiques, 4 Place Jussieu, Boite 89, 75252 Paris, Cedex 05, France; Enrique Tello, Gerencia de Geotermia de la Comisión Federal de Electricidad, Morelia, Michoacán, México; Yuri Taran, Instituto de Geofísica, UNAM, Ciudad Universitaria, 04510 México D.F., México; Andrew M. Burton and Duggins Wroe, OCEAN, 22 de Diciembre no.1, Col. M.A. Chamacho, Naucalpan 53910, México; Michael Sheridan, Geology Department, State University of New York, Buffalo, NY 14260, USA; Marina Belousova, Alexander Belousov, and Volodya Churikov, Institute of Volcanic Geology and Geochemistry, Piip 9, Petropavlovsk-Kamchatsky, 683006, Russia; Milton A. Garcés, Alaska Volcano Observatory, Geophysical Institute, University of Alaska, Fairbanks, AK 99775-7320, USA.
Explosion on 6 July follows seven months of seismic unrest
After seven months of seismic unrest (small swarms, with durations lasting some few hours to as much as 90 hours), at 1858 on 6 July an explosion at the summit dome was similar in behavior and about half of the magnitude of an explosion in 1994.
A microbarograph 8 km SW of the summit at La Yerbabuena failed to register the explosion's shock wave, and the events were not noticed by residents of that settlement or La Becerrera (12 km SW of the summit), nor were these effects noticed by rangers at Rancho El Jabali (12 km SSW of the summit). Residents did report light rain and a bit of thunder and lightning at 1900, which may have helped conceal, or have been confused with, the sound of the explosion.
Seen through a microscope, plant leaves contained ash residue left after rainfall: mineral particles and hydrothermally altered rock fragments under 0.5 mm in diameter, often of light cream color, and similar to those collected at Yerbabuena after the 1994 explosion.
Melchor Ursua of the Civil Defense reported that at 1900 residents of Tonila (13.5 km SE of the summit) observed a small black mushroom cloud rise above the summit accompanied by the sound of thunder or explosion. At 2300 that day from La Yerbabuena, observers Navarro, Breton, and Santaana saw fumarolic gases blown around the W face of the volcano, but in the faint moonlight he failed to discern any glow or ash from the crater.
The last seismic crisis started around 2200 on 2 July 1998 and ended at 1858 on 6 July: a vigorous swarm of earthquakes, which according to Gabriel Reyes comprised ~1,000 events a day for the last 3 days. One event with coda magnitude (Mc) 3.5-4.0 gained registry at all network stations including those near the coast at Tecoman and Armeria; it was interpreted as related to the above-discussed explosion. The seismic quiet afterwards consisted of zero events in a pattern reminiscent of 1994 when quiet prevailed for about 12 hours.
Noteworthy swarms during 1997 occurred on 20 March, 16, 21, and 30 June, 28 November, and 5 December. Compared to the 1997 swarms, this one (2-6 July 1998) was the largest and most energetic.
During the latest swarm the volcano was only visible from 0800 to 1000. After 160 mm of rain had fallen at La Yerbabuena, a lahar swept downslope between 1400 and 1800 on 2 July, blocking passage across the Becerrera River valley 12.5 km SW of the summit.
During 1900-2000 on 7 July, the seismic station closest to the W flank (SOMA, 1.7 km NW from the summit) registered strong, continuous mass wasting and later, during 2200-2300, a relatively strong volcanic event. Seismic quiet returned later, but vigorous fumarolic emissions were blown W. An update on 28 October noted that for a few weeks after the explosion the volcano displayed unrest, including about 23 seismic swarms, each enduring for 2 to 6-8 hours. All the seismic information was provided by the Colima seismic network (RESCO). The last swarm occurred on 25 October and prevailed for 13 hours.
Information Contacts: Carlos Navarro Ochoa, Colima Volcano Observatory, Universidad de Colima, Ave. 25 de Julio 965, Colima 28045, Colima, México.
Lava dome begins erupting, fills crater, and spills out
Rapid lava effusion began from Colima's summit lava dome in late November. The 1998 lava extrusion, the first since 1991, followed months of seismic unrest and a subsequent explosion at the summit on 6 July, leading to local evacuations.
The night of 19 November was marked by strong seismicity and a large number of rockfalls (lasting 2-4 minutes) down the summit's W, SW, and S sectors. Although a previous helicopter flight could not confirm the prescence of new lava, at 0730 on 20 November geologists saw that the crater formed by explosions in 1994 contained a fresh, nearly black circular lava dome with a rough, wrinkled surface. At that time, based on the 1994 crater's dimensions (135 m in diameter and 50 m deep), the dome was approximately 30 x 50 x 15 m in size. Fumaroles were noted along the dome's margins. Other fumaroles in the area of the N-NW summit continued to emit a high output of gases. By 1800 on 20 November both seismicity and rockfalls had dropped to low levels.
Surprisingly rapid dome growth took place that night, and a 0730 flight on 21 November disclosed that the 1994 crater (~3.8 x 10⁵ m3 in volume) was then full and new lava spilled out the S side. Up to this point Colima's eruption appeared quite similar to the 1991 lava extrusion episode, but the new lava erupted at a considerably higher rate. In 1991 it took about 16 days to form a dome of comparable size.
Information Contacts: Carlos Navarro Ochoa, Colima Volcano Observatory, Universidad de Colima, Ave. 25 de Julio 965, Colima 28045, Colima, México.
Lava flows and block-and-ash flows down flanks from growing lava dome
The eruption at Colima began by 20 November 1998 following 17 days of continuous seismic unrest and deformation of the summit cone. Gabriel Reyes, Juan José Ramírez, and Yuri Taran noted that fumarolic gases monitored during previous years may have also shown precursory variations in chemical composition and temperature. New fractures in the summit region were observed on repeated occasions by Abel Cortes and J.C. Gavilanes during ascents on 27 November 1997, 18 March 1998, and 5 May 1998. Between 1614 and 1800 on 17 November, Carlos Navarro and Cortes visited La Yerbabuena, a town on the SW flank 9 km from the summit crater, where they heard more than 10 episodes of rumbling noise coming from the volcano. Cloudy weather did not allow direct observation of the volcano, but based on previous experience they interpreted the noises to be the result of small rockslides.
During the morning of 18 November the settlement of La Yerbabuena (~180 inhabitants) was evacuated voluntarily and in orderly fashion with the assistance of the Colima Observatory Information Group and the local civil protection and military authorities. During that day residents also evacuated the settlement of Juan Barragan (120 people) 10 km SE of the summit.
The first helicopter overflight took place between 0800 and 1000 on 19 November but cloudy weather obscured large parts of the summit area. Observers did note a vigorous fumarolic plume blowing W. That night the Red Sismológica Telemétrica del Estado de Colima (RESCO) reported strong seismic activity and harmonic tremor over periods lasting for 6 minutes. They also registered increased rockfall signals.
At 0700 on 21 November the new lava dome had almost entirely filled the 1994 crater (BGVN 23:10; figure 25). At 1130 that morning, lava started spilling out of the summit crater area producing block-and-ash flows to rush down the S slopes at 3- to 5-minute intervals. The block-and-ash flows were mostly emplaced within the eastern branch of Barranca El Cordobán. The most voluminous flows reached the 2,400 m contour, a distance of more than 4 km from the crater.
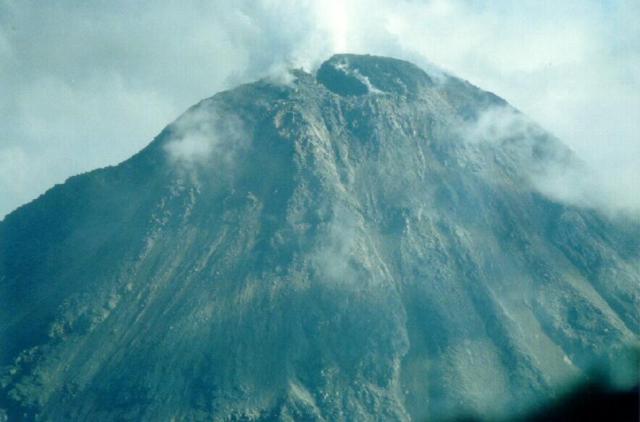 |
Figure 25. Photograph of Colima taken from the SW at 0930 on 21 November 1998. By this time the new dome has entirely filled the 1994 crater and was about to spill out onto the S face (on the right-central portion of the photo). Courtesy of J.C. Gavilanes, Universidad de Colima. |
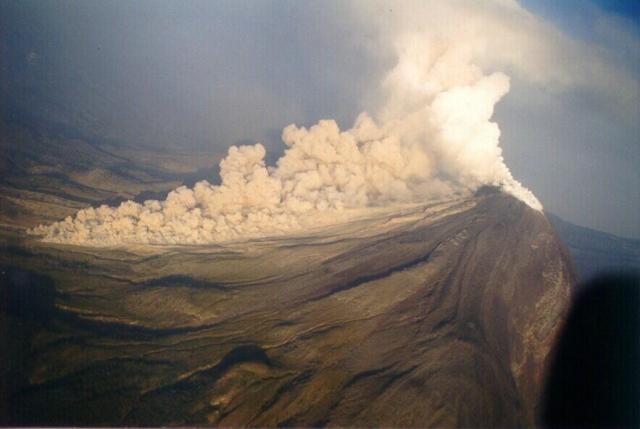 |
Figure 26. An oblique, wide-angle aerial photo taken with the camera somewhat tilted (note horizon in upper corner) showing a pyroclastic event at 0830 on 22 November 1998. The event left a series of block-and-ash flows reaching a maximum distance of 4.5 km W of the summit. Courtesy of Abel Cortés, Colima Volcano Observatory, Universidad de Colima. |
Another flight on 21 November revealed that the lava flow had advanced ~150 m downslope, and had a width of 100 m and a thickness of ~20 m. The lava flow continued advancing such that on 22 November it was 170 m long; on 23 November, 270 m; and on 24 November, 370 m. Block-and-ash flows emplaced during the morning of 25 November in the central branch of Barranca El Cordobán reached 1,900 m elevation. Observers and photographs revealed two additional lava flows as seen from both Rancho El Jabalí (10 km SW of the summit) during the night of 25 November and from Cofradia de Suchitlan (15 km SW) during the night of 26 November; these flows also descended the SW flank and headed towards two drainages (the W branch of Barranca El Cordobán and the S branch of Barranca La Lumbre).
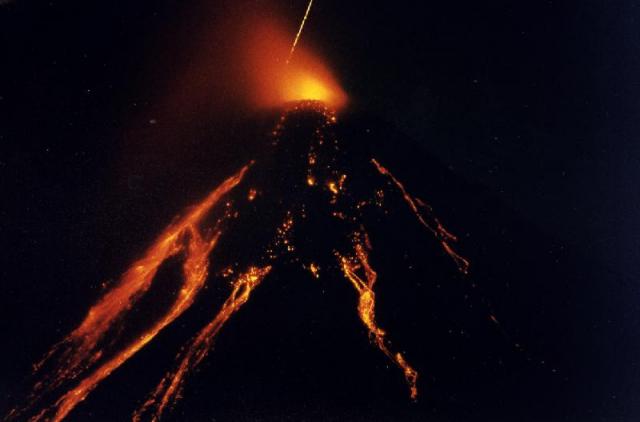 |
Figure 27. Time-lapse photograph (30 minutes) of Colima taken from a point near Suchitlan (15 km SW) around 2300 on 26 November 1998. Courtesy of Claus Siebe, UNAM. |
On 28 November, S. Rodríguez, J.M. Espíndola, and C. Siebe observed the advance of the westernmost lava flow from a 3,100-m-elevation vantage point. Most of the time the flow's front and margins relinquished large blocks (up to 10 m across) producing strong rumbling noises. Small block-and-ash flows moved quietly compared with the rockfalls from the lava flow. Still, it was possible to collect samples of the lava flow.
Viewed in thin section the new lava contained, in decreasing abundance, phenocrysts of zoned plagioclase, hypersthene, pleochroic resorbed brown hornblende, and subordinate magnetite in a microcrystalline to glassy matrix. Chemical analysis indicated that the new lava is very similar in composition to previous eruptions (table 5).
Table 5. Chemistry of freshly erupted Colima lava sampled on 28 November 1998. Courtesy of S. Rodríguez, J.M. Espíndola, and C. Siebe; analysis made by Rufino Lozano, Laboratorio de Fluorescencia de Rayos X at Instituto de Geología, UNAM.
| Element | Analysis |
| SiO2 | 59.14% |
| TiO2 | 0.66% |
| Al2O3 | 17.54% |
| Fe2O3 | 1.86% |
| FeO | 3.91% |
| MnO | 0.11% |
| MgO | 3.71% |
| CaO | 6.64% |
| Na2O | 3.99% |
| K2O | 1.31% |
| P2O5 | 0.16% |
| LOI | -0.02% |
| Total | 99.01% |
| Rb | 20 ppm |
| Sr | 549 ppm |
| Ba | 530 ppm |
| Y | 19 ppm |
| Zr | 148 ppm |
| Nb | 4 ppm |
| V | 110 ppm |
| Cr | 123 ppm |
| Co | 20 ppm |
| Ni | 32 ppm |
| Cu | 92 ppm |
| Zn | 68 ppm |
| Th | less than 2 ppm |
| Pb | 7 ppm |
On 2 December the three lava flows on the SSW flanks had reached these estimated lengths: 1,000 m (more westerly flow), 1,200 m (central flow), and 900 m (SE flow). Good views of these flows were obtained during an overflight the next day (figure 28). Around this time, it seemed most probable that the ongoing eruption would remain mostly effusive and not exceed the magnitude of eruptions witnessed here during past decades. Accordingly, inhabitants of La Yerbabuena were allowed to return to their homes on 1 December.
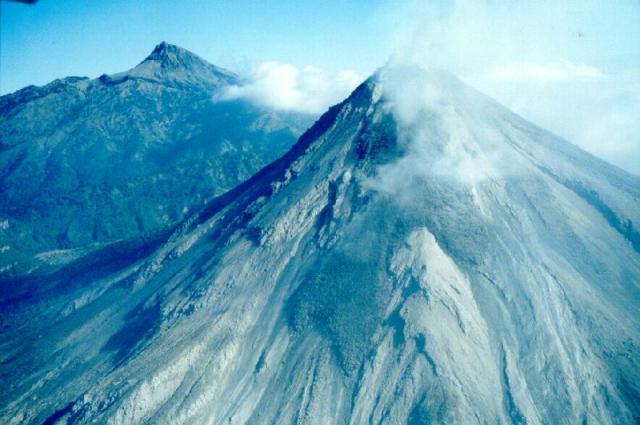 |
Figure 28. The state of lava flow advance on Colima at 0850 on 3 December 1998. Photograph taken from the SW by Juan Carlos Gavilanes. Courtesy of J.C. Gavilanes, Universidad de Colima. |
Fine ash produced thus far during the eruption consisted mostly of non-juvenile material related to rockfalls and small block-and-ash flows. Two stations, one located at Rancho El Jabalí (10 km SW of the summit) and the other at La Becerrera (12 km SW of the summit), registered maximum ashfalls on 23 and 26 November, respectively; both with daily loads of around 50 g/m2. The wind mostly dispersed this ash towards the SW and W.
COSPEC measurements carried out by Gavilanes and Cortes since 30 October 1998 showed a marked increase in SO2 flux (table 6). The highest discharge, measured on 26 November, yielded an estimate of more than 16,000 metric tons/day.
Table 6. COSPEC measurements for SO2 fluxes at Colima volcano at stated dates in 1998. Fluxes are in metric tons/day and were rounded to three significant figures. Measurements on 11 February, 14 April, 2 May, and 25 May were below the detection limit. Extrusion began on 20 November. Courtesy of Juan Carlos Gavilanes and Abel Cortes, Universidad de Colima and Colima Volcano Observatory.
| Date | Average | Maximum | Minimum | Uncertainty (±) | Avg. wind velocity (m/s) |
| 30 Oct 1998 | 408 | 437 | 365 | 36 | 6.01 |
| 14 Nov 1998 | 390 | 484 | 307 | 89 | 8.93 |
| 18 Nov 1998 | 1,610 | 2,270 | 905 | 685 | 7.20 |
| 21 Nov 1998 | 1,400 | 567 | 325 | 121 | 3.93 |
| 22 Nov 1998 | 850 | 1,110 | 647 | 229 | 1.30 |
| 24 Nov 1998 | 4,670 | 5,260 | 4,320 | 467 | 7.72 |
| 25 Nov 1998 | 8,210 | 9,250 | 7,260 | 994 | 7.29 |
| 26 Nov 1998 | 16,420 | 20,360 | 10,120 | 5,120 | 13.5 |
| 27 Nov 1998 | 10,670 | 13,150 | 7,930 | 2,610 | 15.2 |
| 28 Nov 1998 | 4,790 | 5,600 | 3,890 | 853 | 3.20 |
| 30 Nov 1998 | 2,330 | 2,500 | 2,070 | 216 | 5.81 |
| 03 Dec 1998 | 1,890 | 2,500 | 1,520 | 490 | 3.73 |
Information Contacts: Juan Carlos Gavilanes, Carlos Navarro, Abel Cortés, Alicia Cuevas, and Esther Ceballos, Universidad de Colima; Claus Siebe, Juan Manuel Espíndola, Instituto de Geofísica, UNAM; Sergio Rodríguez-Elizarrarás, Instituto de Geología, UNAM.
Lava continues descending the S flank during December 1998
This report is based primarily on official releases mainly covering December 1998. On 1 December three lava lobes existed, and the longest (central) about 800 m long and 350 m wide. Loose material traveled downslope 4.5 km. Monitored parameters indicated that the volcano was relatively stable, suggesting that neighboring communities were not at risk. On 1 December, the evacuation order was rescinded for the SW- flank community of Yerbabuena, 9 km from the summit. However, scientists reported increased activity on 9 December, when the longest flow reached 1.2 km from the summit. Summit winds changed at that time and began blowing ash away from villages.
By 10 December the central lobe had extended to ~1.7 km in length, and the E lobe reached a distance of ~1.3 km from the summit. In accord with these advances, the number of incandescent blocks escaping both near the summit and at the lava fronts increased. Figure 29 shows the three lava lobes on 11 December.
A press release on 14 December stated that during the previous 72 hours the volcano had generally remained at low intensity. The width of the central lava flow width remained at 350 m but in the following days the front crept forward to reach the following lengths: on 14 December; ~1.8 km; on 16 December, ~1.9 km; and on 4 January, ~2.9 km. The shorter, E lobe on 14-15 December had remained at ~1.35 km from the summit; on 16 December it reached 1.40 km. Blocks continued to break off and feed small avalanches but they remained within a 4.5-km radius.
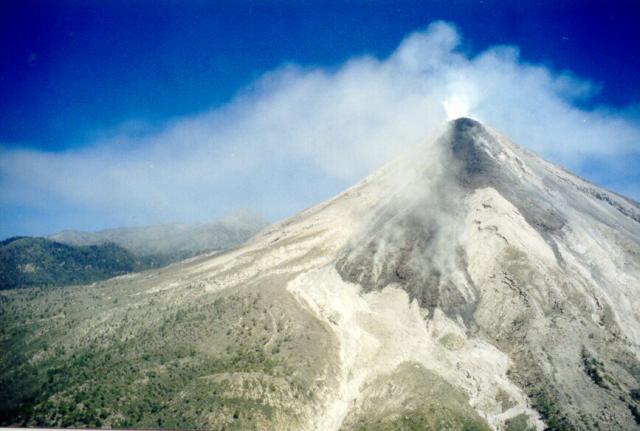 |
Figure 29. Fresh block lava flowing down Colima's upper slopes as seen from the air off the SW side on 11 December 1998. Volcan de Colima appears in the right foreground; the peak of Nevado de Colima can be seen in the left-central part of the photo obscured by haze. Lava flows followed incisions of the Cordoban drainage (barrancas). From left to right these headwaters comprise the Western, Central, and Eastern Cordoban. Photograph by Juan Carlos Gavilanes, Colima Volcano Observatory. |
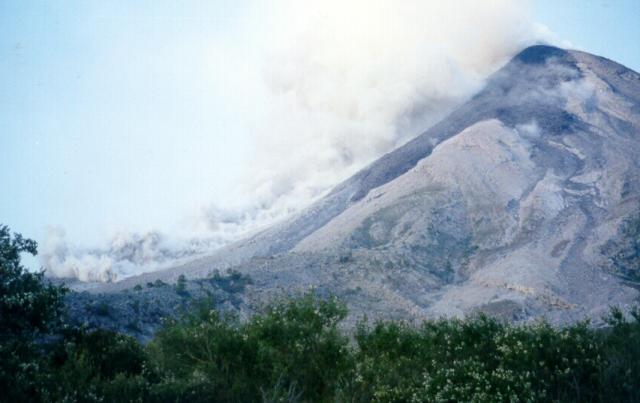 |
Figure 30. A block-and-ash flow seen at Colima on 11 December 1998 descending from the dome on the W side of Barranca Cordoban and beside one of the new lava flows. View is from a point at 2,150 m, 4.25 km S of the dome. Photograph by Juan Carlos Gavilanes, Colima Volcano Observatory. |
SO2 monitoring. A COSPEC flight on 31 December 1998 made five transects below the plume that resulted in an SO2 flux estimate of 4,930 ± 1,040 metric tons/day. An important component of a flux estimate comes from the wind velocity measurement, in this case computed by GPS. The average value was 4.7 m/s.
Satellite views. Peter Mouginis-Mark and over 10 other collaborators, colleagues, and co-workers have created a website displaying processed GOES 8 and GOES 10 satellite images of potential hot spots. Colima is one of eleven selected sites; each site gets imaged by a GOES satellite an average of once every 15 minutes.
Information Contacts: Mauricio Breton Gonzalez; Carlos Navarro Ochoa, and Juan Carlos Gavilanes, Colima Volcano Observatory, Universidad de Colima, Ave. 25 de Julio 965, Colima 28045, Colima, México; Peter Mouginis-Mark, GOES Hotspot Monitoring System, Hawaii Institute of Geophysics and Planetology, University of Hawaii, 2525 Correa Road, Honolulu, Hawaii 96822 (URL: http://modis.higp.hawaii.edu/).
Lava lobes continue to advance, explosion on 10 February ejects ash and ballistic blocks
Volcano Colima's three active block-lava lobes continued to slowly advance during January and February. The series of updates on the eruption written by Mauricio Bretón and issued through official channels on 5 and 19 January and 2 February indicated comparative quiet in terms of visible activity, monitored parameters, and the number and size of rockfalls. The updates now appear on the University of Colima Volcano Observatory website, where seismic data has also recently been plotted. Table 7 presents basic data for the lava lobes on 8 January.
Table 7. Some dimensions of advancing block lavas at Colima on 8 January 1999. Courtesy of Juan Carlos Gavilanes, Abel Cortes, and Carlos Navarro Ochoa.
| Drainage | Location of the front (m, elevation) | Length (m) | Maximum width (m) | Maximum thickness (m) |
| Western Cordoban | 2,400 | 2,800 | 250 | 20-30 |
| Central Cordoban | 2,390 | 3,100 | 250 | 20-30 |
| Eastern Cordoban | 2,560 | 2,500 | 250 | 20-30 |
A 7 February visit to the western and central fronts, in the headwaters of the Rio Cordoban, indicated that at ~2,180 m elevation these lobe fronts were only separated by a few meters of uncovered ground (figure 31). The visitors, included Mauricio Bretón, James Luhr, Carlos Navarro, and their guide Norberto Mendez from La Yerbabuena village. Although not visited, the flow front of the eastern lobe stood at 2,280 m elevation and continued to advance slowly, 5 m per day. The lava flow fronts were ~30 m high. Assuming an average thickness for the 1998-99 block lavas of 15 m, Navarro estimated the total erupted lava volume as 33 x 106 m3.
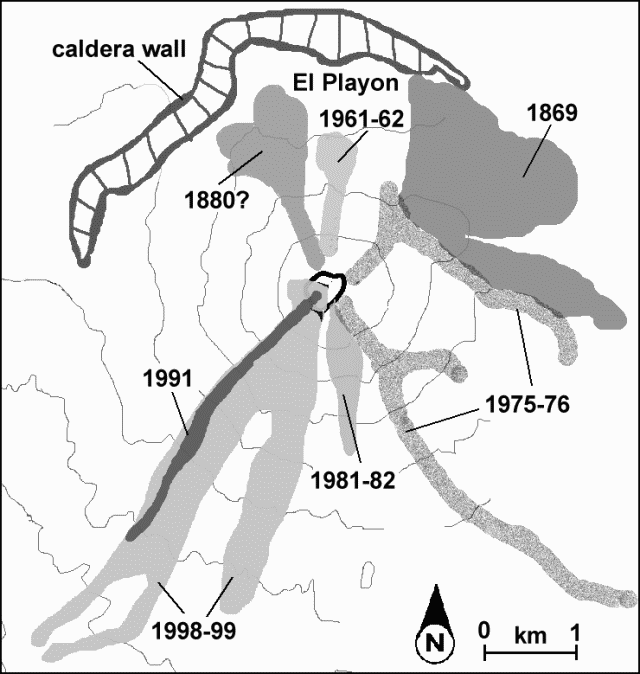 |
Figure 31. Sketch map of Volcan de Colima and vicinity showing block lava flows as late as 7 February 1999. The volcano is also locally known as "Fuego" and "Volcan de Fuego de Colima." Courtesy of Carlos Navarro. |
At 0900 on 8 February, Luhr and Navarro took photographs of the summit crater during a military helicopter flight (figures 32 and 33). They also saw a newly formed fissure cutting through the NE flank of the now deflated November 1998 dome. This fissure had nearly vertical walls that stood 5-10 m high and were encrusted with sulfur. Observers on the flight witnessed a small explosion that ejected gas with minor ash (figure 33). The plume rose within 20 seconds to an altitude of 1 km over the summit. The explosion was also recorded seismically, expressed as a low-frequency event.
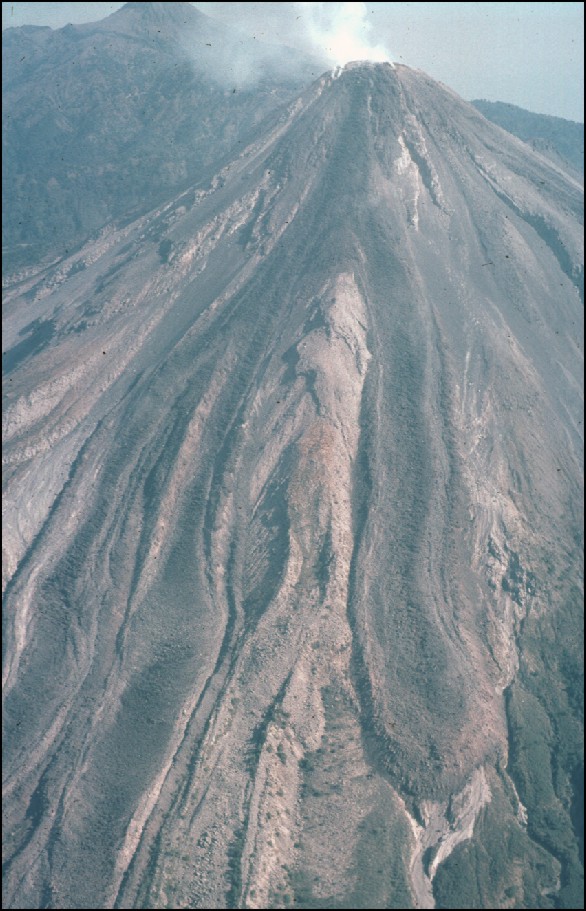 |
Figure 32. NNE-looking helicopter view of Colima volcano on 8 February 1999 showing the three active lava lobes bifurcating, two on the left (SW flank), and one breaking to the right (S flank) passing around a local high. Note that some of the prominent bounding levees surrounding the lava flows are actually from older lava flows. The 1991 lava flow has been completely covered by the new lava (see figure 31). Block and ash flows had also passed down these drainages both prior to and during lava emplacement. Photo courtesy of James Luhr. |
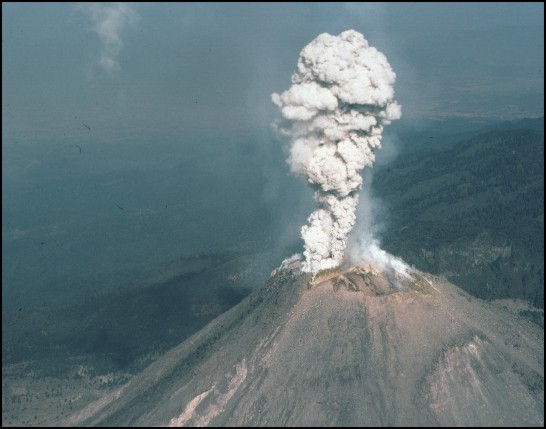 |
Figure 33. During the helicopter flight a small explosion took place at 1004 on 8 February; this shows the plume of gas and minor ash after it rose for ~5 seconds. Courtesy of James Luhr. |
At 0152 on 10 February a loud explosion ejected material from the E part of the November 1998 dome and parts of the adjacent summit weakened by hydrothermal alteration over the past 20 years. Strong seismicity was detected for less than an hour before the explosion, according to Gabriel Reyes of the Colima Seismic Network (RESCO). The 10 February explosion produced low-frequency signals allegedly 2.5 times larger than those associated with an explosion in July 1994, which destroyed the dome. Civil protection agencies reported that some residents were abruptly awakened by the explosion noise in the cities of Colima (32 km SSE of the volcano) and Guzman (25 km NE).
Another perspective on this explosion was provided by two members of the Jalisco State civil protection group who were sleeping in an observatory building at ~4,050 m elevation on Nevado de Colima, which forms the high point of the Colima volcanic complex, 5.8 km N of the active Volcan de Colima ("Fuego"). From the afternoon of 9 February these observers watched as vigorous fumaroles sent abundant gases above the volcano's summit. Then, at 1900 that day the fumarole's output decreased abruptly, seemingly halting until around the time of explosion about seven hours later. Less than 2 minutes after the explosion a column rose to 3-4 km forming a mushroom-shaped cloud. At the same time, incandescent blocks traveled down the N slope and others flew in high parabolic arcs 3.5-4 km from the vent. Some blocks started small forest fires in an area known as El Playón, between the N foot of the active cone and the caldera's northern rim (figure 31). Block-and-ash flows descended the San Antonio and Monte Grande river valleys and extended up to 3 km from the summit.
In the course of fieldwork, Luhr and Navarro had spent the night of 9-10 February at a small cabin on the N side of Nevado de Colima, 9 km N of the active volcano (the Jalisco State civil protection hut); they too were abruptly awakened by the explosion. Outside the cabin they saw a large column of ash and vapor illuminated in a rose color as it ascended rapidly behind Nevado de Colima's summit. The illuminated effect continued for up to 25 minutes with gradually decreasing intensity. Two dark plumes of ash bifurcated near the summit, obscuring the stars on this moonless and cloudless night. One of the plumes moved E and NE, droppin ash over the settlements including Tonila, San Marcos, La Cofradia, and Los Mazos. The other plume moved NW. Ashfall at the summit of Nevado de Colima lasted less than 3 hours. About 5 g of sample was collected. The ash consisted of fine angular fragments of plagioclase, pyroxenes, and occasional brown hornblende, and was interpreted to be non-juvenile, a result of explosive pulverization of the dome andesite. Some 3 hours after the explosion, Navarro observed brightly incandescent blocks descend the active cone into the NW part of El Playón, some of which started small forest fires.
Later, at about 1100 on 10 February from a point 5.8 km N of the volcano, Luhr and Navarro saw a gas column with minor ash rising 2.3 km above the volcano's summit and heard a sound like a jet turbine for up to 20 minutes. The sound reminded them of crater-generated noises heard when they visited the lava front on 7 February. Residents of La Yerbabuena had also heard similar sounds some days before these observers, as well as sporadic explosions that continued through 12 February. On clear nights around this time, observers saw incandescence coming from the crater.
On 11 February Gabriel Reyes of RESCO and Francisco Nuños Cornú and Carlos Suarez of the University of Guadalajara installed a 3-component seismic station in the Playón area. At distances up to 3-4 km from the summit they found numerous impact craters on the road. Fragmental blocks of 80-90 cm size formed craters up to 2 m in diameter; the craters' circular outlines suggested that the ballistic blocks descended nearly vertically. According to Suarez, ~80% of the sampled blocks consisted of fresh dome material, likely from the November 1998 dome.
Information Contacts: Carlos Navarro Ochoa, Mauricio Bretón González, Juan Carlos Gavilanes, and Abel Cortes, Colima Volcano Observatory, Universidad de Colima, Ave. 25 de Julio 965, Colima 28045, Colima, México (URL: https://portal.ucol.mx/cueiv/); James Luhr, Smithsonian Institution, NMNH Department of Mineral Sciences, Washington, DC 20560-0119 USA; Gabriel Reyes, Universidad de Colima, Red Sismológica Telemétrica del Edo. de Colima (RESCO), Centro Univ. de Inv. En Ciencias Básicas, Ave. 25 de Julio, 965 Villa San Sebastián, Apdo. Postal 2-1694, Colima México; Francisco Nuñez-Cornú and Carlos Suarez-Plascencia, University of Guadalajara, Av. Universidad 203, Del Ixtapa, Puerto Vallarta, Jal., México.
Details of the 10 February explosion and fires lit by volcanic bombs
The unusually large 10 February explosion was followed by collateral reports by (a) F. Núñez-Cornú, G. Réyes-Davila, and C. Suárez-Plascenia and (b) John B. Murray. In addition, this summary of the interval 26 February to 16 March benefitted from press releases from the Colima Volcano Observatory. These three sources are discussed in separate sections below.
Geophysical signature of the 10 February explosion. F. Núñez-Cornú, G. Réyes-Davila, and C. Suárez-Plascencia provided the following report.
"On 10 February at 0145 an explosive event occurred at Colima's summit dome; this generated a shock wave that broke windows and opened gates in the small town of Juan Barragan, 8.75 km SE of the summit. The sonic wave was also heard in the towns of Tonila, Quesería, San Marcos, Atenquique, El Fresnito, Ejido de Atenquique, and up to 28 km NE of the volcano at Ciudad Guzman.
"This was the biggest explosion reported for the volcano in the last 80 years; the resulting exhalation emitted both ash and lava blocks (bombs made up of both fresh and altered components). A substantial amount of incandescent tephra fell and started fires on both the volcano's upper slopes and on Nevado de Colima's S slopes; most of the fires were extinguished by snow and rain storms during the subsequent 48 hours.
"As summarized in table 8, a seismic event took place hours before the explosion, at 2231 of 9 February; it was followed by other volcanic and tremor signals at about 0100; some of these precursory events saturated the amplitude response of analog instruments at stations EZV4 (Somma) and EZV7 (Volcancito). Four additional large, post-eruptive seismic events also occurred. These strong events were observed clearly at farther stations EZV3 (Nevado, 5.8 km from the summit), and EZV2 (Cerro Grande, 25 km from the summit)."
Table 8. Noteworthy seismic events around the time of the 10 February 1999 explosion at two Colima seismic stations (EZV3 and EZV2); the earliest reading (on the top line) took place the night before the explosion. See text for station locations. Courtesy of F. Nunez-Cornu, G. Reyes-Davila, and C. Suarez-Plascencia.
| Date | Time | EZV3 coda (sec) | EZV3 amp max (mm) | EZV2 coda (sec) | EZV2 amp max (mm) |
| 10 Feb 1999 | 2231 | 175 | saturated | 120 | 8 |
| 10 Feb 1999 | 0157 | -- | saturated | 300 | saturated |
| 10 Feb 1999 | 0359 | 160 | 16 | 65 | 3 |
| 10 Feb 1999 | 0552 | 110 | saturated | 25 | 2 |
| 10 Feb 1999 | 0730 | 140 | 30 | 70 | 3 |
| 10 Feb 1999 | 1318 | 140 | 34 | 75 | 3 |
"Currently the Jalisco civil defense operates an observational base called Nevado located 900 m NW from the summit of Nevado de Colima.
"Since the end of November 1998, three seismic instruments (MarsLite with LE3d (1 Hz) sensors) were deployed to complement the RESCO network at the volcano. To improve spatial resolution the authors moved one of these instruments to El Playon on 11 February. On the way to El Playon we observed fires on the southern slopes of Nevado out to a maximum distance of 4.5 km from the volcano's summit.
"On the road at a spot 2.9 km NE of the summit and at 3,120 m elevation we found several impact craters. The first one contained an andesite block with dimensions of 0.37 x 0.44 x 0.43 m. Several small impacts occurred nearby. We found another impact pit near the road, 100 m away from the first site but at similar distance and direction from the summit. This pit measured 1.94 x 0.70 m on the surface and had a depth of 0.60 m. It contained a partially buried andesite block (identified as R3) that measured 0.60 x 0.41 x 0.70 m. The block's temperature was 40°C. The pit sat in a spot surrounded by 10- to 15-m-tall trees; their lack of visible damage suggested a near vertical angle of impact, which we estimated as 80-85°.
"At 70 m away from block R3 we found a volcanic bomb that struck the middle of the road. The bomb consisted of hydrothermally altered volcanic breccia (identified as R4, figure 34), which had shattered on the road over an area 1.73 x 1.64 m; the bomb failed to excavate a crater.
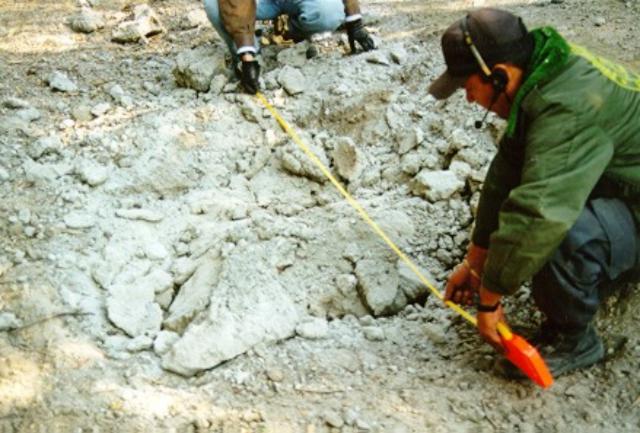 |
Figure 34. Impact crater R4, created by Colima's 10 February 1999 explosion. Courtesy of F. Nunez-Cornu, G. Reyes-Davila, and C. Suarez-Plascencia. |
"In traveling across El Playon we observed dozens of impacts, but elected to stay the minimum time possible in order to reduce exposure to hazards. Most of the bombs seen and sampled consisted of either andesite resembling the new dome or hydrothermally altered andesite, perhaps from the 1987 crater wall. When visiting the same area on 26 February, we found the small and medium impact craters difficult to identify; most of the impacts below trees were covered by newly fallen leaves."
Leveling survey and field examination of the 10 February bombs. On 28 February, John B. Murray, assisted by members of the Colima fire department (Mitchell Ventura, Filiberto de la Mora, and Juan Carlos Martinez) measured two branches of a N-flank leveling traverse last surveyed in January 1997. The first branch, which was 740 m long, left the Playon vehicle track and followed the path up Volcancito passing through stations Porte de Colima (1.3 km from the volcano's summit) and Albergue (1.9 km from the summit). The movement measured since 1997 showed subsidence at stations nearest the volcano totaling 13 mm for the entire section. This was nearly double the subsidence measured during 1995-97, an interval without any lava emission. There was also 13 mm of subsidence seen during 1990-92, an interval which included lava emission (in 1991).
The second branch of the leveling traverse began at Albergue station and ended at Voltaire station, a spot 2.3 km from the summit. Compared to 1997, the Albergue station had subsided just over 8 mm relative to the Voltaire station. Little significant change occurred here during 1995-97 (1 mm rise) and 1990-92 (0.4 mm rise). During a 15-year interval (1982-97) these two stations subsided a total of only 6 mm, and thus looks like a small though significant change in movement. Most of the change (5.6 mm) was measured between two stations 160 m apart at a distance of 2 km from the summit. The possibility of a small error cannot be ruled out, although the movement does follow the same sense throughout this section of the leveling traverse.
The total subsidence between the farthest (2.3 km) and the nearest (1.3 km) station to the summit was 22 mm. This is rather larger than during the 1991 crisis, when the subsidence between the same two stations was 13 mm. Viewing this movement as deflation of a magma chamber (Murray, 1993), this may simply be a reflection of the rather larger output of the volcano in 1998-99 compared to 1991. However, equally tenable is the hypothesis that the movement is due to volcano spreading, or even to Colima's slow slipping down the southern flanks of the larger Nevado volcano, on whose southern slopes Colima is situated. Increases in the rate of subsidence were also observed following the Mexican earthquake of 1985, as well as during the 1991 crisis described above. Although the subsidence during 1997-99 is greater than previously measured, there is nothing in the measurements to suggest that the volcano is building up to a bigger eruption, or to distinguish between the Mogi deflation or downslope slipping models.
The distribution of volcanic bombs from the 10 February explosion was noted at sites along the leveling traverse. Table 9 lists the estimated average distance between impact craters at the various sites where measurements were made. Murray and co-worker identified fragments that varied in size between 10 and 70 cm in diameter, there being no noticeable trend in size between bombs found in the region 1.3 to 2.8 km from the summit. The largest bomb crater found had taken away one third of the road on the north edge of the 1869 lava flow near station Hector, a spot 2.1 km from the summit. This crater was at least 2 m in diameter. However, the numbers of impacts per unit area decreased as distance from the volcano increased.
There is also some evidence of directed blast in table 9, there being distinctly higher concentrations of bombs NNE of the volcano (station Esteban) than at similar distances NE (station C15). Bombs appeared to be of two distinct types: 1) solid, dark, fresh-looking andesitic rocks with high density and no sign of vesiculation, and 2) crumbly, light-colored, altered, vesicular, pumice-like ejecta with low density (guessed at around 1,000 kg/m3) There did not appear to be any predominance of one type or the other with distance from the volcano.
Table 9. Average spacing of N-flank bomb strikes that were found after Colima's 10 February 1999 explosion. Courtesy of John B. Murray.
| Site | Distance from summit | Distance between impacts |
| Volcancito foot | 1.4 km | 3 m |
| Playon (Campsite) | 1.7 km | 5 m |
| Playon (Esteban station) | 2.0 km | 45 m |
| 1869 flow edge (Fire Station) | 2.1 km | 20 m |
| Caldera Wall (C15 station) | 2.1 km | 45 m |
A bomb found near the campsite, 1.75 km from the summit, left evidence of its trajectory as it had smashed a 10 cm branch of a tree just before landing. The bomb itself was of solid andesite, and had fractured into several pieces on landing, but it appeared to have had an original diameter of about 40 cm. It had made an impact crater ~1 m in diameter and 50 cm deep. Using the level as a horizontal marker, three measurements of the angle between the broken branch and the crater bottom gave 44 ± 3° from the horizontal.
Six fire sites were inspected and described; usually these were associated with a bomb, but not always. At first, these fire sites went unnoticed because they chiefly consumed low-growing vegetation, and in no case was a completely burned tree to be found. The view towards the volcano from the Playon was unaffected, as green bushes and trees were seen as usual.
For example, at fire site 3, located 2 km NNE of the summit (N side of road, just past bend near station Esteban) we found an isolated pumice bomb 20 cm across, but without burnt vegetation in contact. However, the bomb ignited grass clumps 2 and 3.5 m away; none of the grass between the bomb and the clumps had been affected.
Most fire sites were close to bombs, usually burning on the side away from the volcano. However, most were not in direct contact with the bomb in question, but centered around dry vegetation, particularly tall grass clumps, succulents, small bushes, and (occasionally) trees. The grass and succulents were not dead, but had fresh green shoots sprouting from the top. Presumably because of the high water content, only the dry, dead leaves at the base of the succulents were burned, but there were large areas where succulents were affected in this way, the adjacent vegetation being quite unaffected. There was often no obvious associated bomb in the vicinity. Similarly with grass clumps, there would be gaps of 2 or 3 m between burned clumps, from which the fire had apparently spread radially for a short distance before going out, with no sign of burning of the dry, low grass cover in between. However, not all bombs in the same area had the same effect. In some cases, the only sign of burning was directly beneath the bomb itself, where the grass was singed black but still fairly intact. Yet in places nearby, the landscape had clearly been very slowly burned over an extensive area 10 to 30 m wide, and in one case discussed below, it was still burning.
Murray goes on to comment: "The odd characteristics of these fire sites suggests the possibility of an abnormal ignition mechanism. It seems that ignition depended in many cases not on the proximity to the source of heat (bombs) but rather on the characteristics of the ignited vegetation. It was as if in certain (sometimes quite extensive) areas those low-growing plants below a certain water content, or containing appropriate oils would ignite, and the rest would not. This implies a very high air temperature close to the ground over areas in some cases tens of meters across. The most obvious source of these high temperatures would seem to be hot gas, usually emanating from bombs but not always so. Where associated with bombs, the isolated fire sites would always be on the side facing away from the summit. In other words, there is evidence that extensive degassing took place from bombs upon impact; and that there might also have been some local associated ground-hugging nuees of a weak and intermittent type."
Explosion on 28 February 1999. Murray also noted that "At 1715 on 28 February, while examining the distant bombs and impact craters 2.8 km NE of the summit on the forest road outside the caldera, we heard a distant, faint rushing sound coming from the summit, resembling a large rockfall or an aircraft. On looking up, a large whitish-grey convective cloud, like a cumulus cloud, could be seen rising from the summit and blowing in our direction. It had clearly started some time previously and was already stretching some distance towards us. A heavy rain of ash began nine minutes later, at 1724, ceasing at ~1731. The ashfall, which was sampled, sounded like large raindrops hitting the leaves in the nearby forest but on spreading out a sheet of paper on the ground, only sand-sized ash particles could be seen accumulating on it. At the end of the shower, there was one particle every centimeter approximately, the largest particle being ~ 2 mm across, and the smallest just under 0.5 mm. From the sound of the particles falling in the trees round about, it sounded as if much larger particles were involved in the shower, but none of these fell on the spread-out paper."
Official press releases. A 26 February update by the Colima Volcano Observatory stated that chemical analysis of Colima's water and ash had indicated insignificant risk to human health. At this time the established security limit was set at 10-10.5 km from the summit. Evacuated settlements included Yerbabuena, Causenta, Atenguillo, El Fresnal, La Cofradía, Juan Barragán, El Agostadero, Los Machos, El Alpizahue, El Saucillo, and El Borbollón. The local populations were advised to avoid a long list of drainages, as well as to hand-carry important documents, and to advise authorities of those requiring help in order to secure transport in case of more extensive evacuations. Meanwhile, during the previous 24 hours the monitored parameters indicated relative quiet, suggesting possible voluntary return to evacuated areas at noon on 2 March if these conditions persisted. The 5 March update noted degassing events during the previous 24 hours, the majority of these around 1400 on 5 March. The 16 March update mentioned the recent occurrence of both degassing and minor ash emissions.
Reference. Murray, J.B., 1993, Ground deformation at Colima Volcano, Mexico, 1982 to 1991: Geofisica Internacional, v. 32, no. 4, p. 659-669.
Information Contacts: F. Nunez-Cornu1,4, G. Reyes-Davila2, and C. Suarez-Plascencia3,4; 1) Laboratoria Sismologia, University of Guadelajara, Guadelajara, Mexico; 2) RESCO, University of Colima, Colima, Mexico; 3) Department of Geology, University of Guadelajara, Guadelajara, Mexico; 4) U. Est. Proteccion Civil Jalisco; Colima Volcano Observatory, Universidad de Colima, Av. Gonzalo de Sandoval 444, Colima, Colima 28045, Mexico (URL: https://portal.ucol.mx/cueiv/); J.B. Murray, Department of Earth Sciences, The Open University, Milton Keynes MK7 6AA, England.
Variable SO2 fluxes; 10 May explosion ascends to about 10 km altitude
A large explosion on 10 May was followed by intermittent explosions during 14-26 May. Variations in SO2 flux and morphological changes to the summit crater preceded the explosions.
SO2 flux data collected during 3 December 1998-15 May 1999 (table 10) showed that daily SO2-flux averages ranged between ~1,300 and 4,900 metric tons per day (t/d). In contrast, six days before the 10 May explosion researchers measured an anomalously low SO2 flux averaging ~350 t/d. Five days after the explosion a similarly low SO2 flux prevailed.
Table 10. Colima volcano's SO2 flux (in metric tons per day) from COSPEC measurements, 3 December 1998-15 May 1999. Data obtained by Colima Volcano Observatory staff members including J.C. Gavilanes and A. Cortés, with the collaboration of UNAM staff member Yuri Taran. In addition, on 3 and 22 February, the data were obtained by UNAM staff member Hugo Delgado. Courtesy of Juan Carlos Gavilanes, Colima Volcano Observatory.
| Date | Avg. | Max | Min | Uncert. (±) | Avg. wind velocity (m/s) | Traverse method |
| 03 Dec 1998 | 1,890 | 2,500 | 1,510 | 489 | 3.73 | Airborne |
| 07 Dec 1998 | 3,390 | 4,540 | 2,950 | 798 | 10.8 | Airborne |
| 09 Dec 1998 | 5,360 | 6,710 | 4,350 | 1,180 | 7.81 | Airborne |
| 11 Dec 1998 | 2,280 | 3,670 | 2,210 | 728 | 8.00 | Airborne |
| 31 Dec 1998 | 4,930 | 5,780 | 3,690 | 1,043 | 4.73 | Airborne |
| 03 Feb 1999 | 4,530 | 5,290 | 3,206 | 1,043 | 7.71 | Airborne |
| 14 Feb 1999 | 2,377 | 2,610 | 2,030 | 293 | 10.3 | Airborne |
| 17 Feb 1999 | 1,256 | 1,657 | 853 | 402 | 8.50 | Airborne |
| 20 Feb 1999 | 1,710 | 2,410 | 948 | 732 | 5.01 | Airborne |
| 22 Feb 1999 | 2,319 | -- | -- | 350 | -- | Airborne |
| 04 Mar 1999 | 4,764 | 5,408 | 4,087 | 661 | 15.1 | Airborne |
| 11 Mar 1999 | 2,760 | 3,642 | 2,184 | 729 | 15.2 | Airborne |
| 26 Mar 1999 | 1,432 | 2,030 | 943 | 543 | 8.6 | Ground |
| 31 Mar 1999 | 1,214 | 1,520 | 917 | 301 | 10.0 | Ground |
| 14 Apr 1999 | 1,044 | 1,406 | 674 | 366 | 7.7 | Ground |
| 04 May 1999 | 352 | 377 | 326 | 25 | 10.2 | Ground |
| 15 May 1999 | 406 | 483 | 361 | 61 | 5.1 | Airborne |
Shortly after the 10 February outburst (BGVN 24:02), views into the established summit crater disclosed that it held a small, centrally located inner crater, as well as some other small craters on its W side. All these small craters were attributed to explosions, such as those on 10 February, some others on 18 February, or other intense degassing events around that time. In the weeks after 10 February observers also saw concentric cracks becoming conspicuous in the summit area. Between 14 February and 11 March the summit crater became increasingly deep and fractured; however, despite these changes, the 1987 explosion crater still remained relatively intact on the dome's E side. Subsequent activity then declined until 10 May.
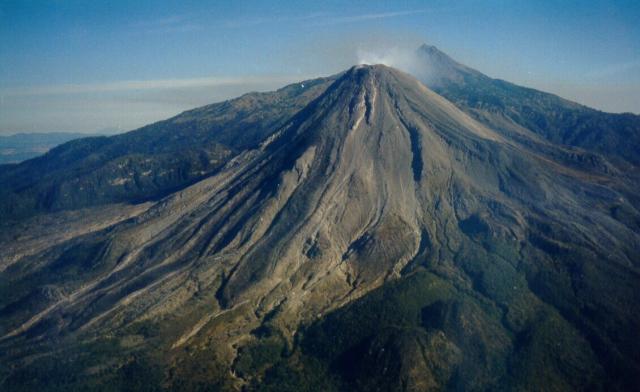 |
Figure 35. Broad overview of Colima's SW face on the exceptionally clear day of 11 March 1999. The photo captures recently erupted lava flows and their bounding levees. Courtesy of Juan Carlos Gavilanes, Colima Volcano Observatory, University of Colima. |
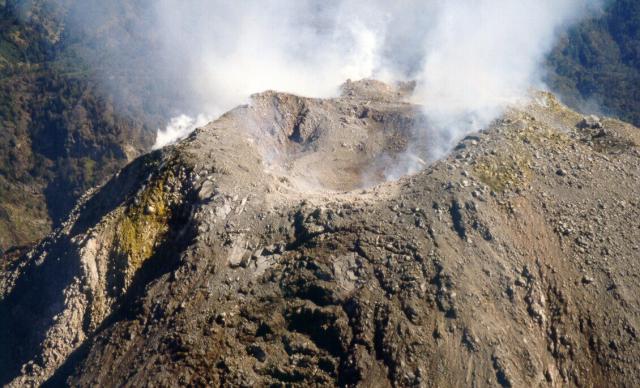 |
Figure 36. Oblique aerial view of Colima's summit crater as photographed on 11 March 1999. The viewer is looking at the mountain's SW side. Note the crescentic crack sets and fractures on the outer face and the lumpy, multiply cratered landscape within the summit crater. Courtesy of Juan Carlos Gavilanes, Colima Volcano Observatory, University of Colima. |
10 May explosion. At 1353 on 10 May an explosion was felt and heard in the city of Colima, 32 km SSE of the summit. At least 2 hours before the explosion, seismologist Gabriel Reyes (Red Sismológica Telemétrica del Edo. de Colima (RESCO), University of Colima) informed civil protection authorities about the increasing possibility of an explosive event within hours based on local seismicity. As a result, the civil protection officials provided warnings via telephone and radio to village leaders in La Yerbabuena and Juan Barragan. In the latter village, Jalisco civil protection officials initiated an evacuation of ~90 inhabitants. Meanwhile, at Yerbabuena (~192 inhabitants), the political representative of the village, Mr. Jesus Mendez, told residents to stay alert. Civil protection authorities of Colima recommended maximum alert without evacuation.
At the time of the eruption Observatory and RESCO staff were in their city of Colima offices. The accompanying photo (figure 37) was made ~45 seconds after they heard their windows rattle. Later, when the mushroom cloud appeared to cease rising, Carlos Navarro used a clinometer to estimate that its top reached ~6.5 km above the summit, an altitude of over 10 km.
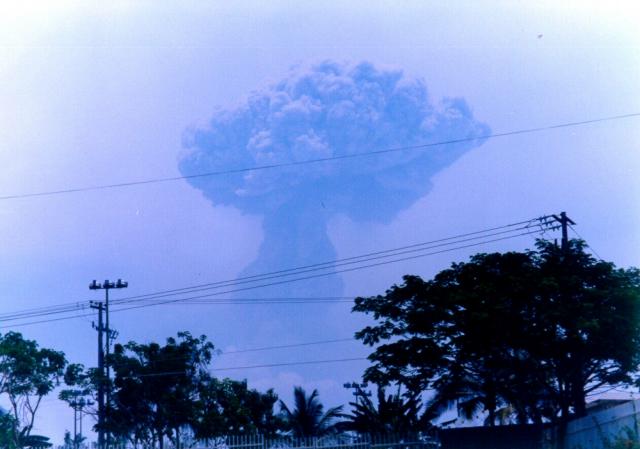 |
Figure 37. A photo of Colima's 10 May explosion, which produced a rapidly rising mushroom-shaped column. The photo was taken from the city of Colima (~ 32 km SSE of the volcano's summit) shortly after the explosion was first heard (see text). Courtesy of Juan Carlos Gavilanes, Colima Volcano Observatory, University of Colima. |
Eyewitnesses in La Yerbabuena (8 km SW of the summit) and Civil Protection authorities reported that the explosion was accompanied by small pyroclastic flows. The two largest pyroclastic flow mainly descended the SW flank where they entered into the Barrancas La Lumbre and Cordoban drainages. In a manner and scope very similar to the 10 February explosion, ballistic ejecta landed up to 4.5 km from the summit dome and caused local forest fires. Between 1930 and 2210 that day observers saw at least two much smaller exhalations of steam and ash without audible explosion noises. Authorities evacuated several villages.
14-26 May explosions. Two ash-bearing explosions took place on 14 May: one rose ~2.2 km above the summit; the other, ~1 km above the crater. In a 24-hour period around 17 May, there were about 20 explosive or degassing events, with ash falling on the edifice and incandescence coming from the summit dome. According to the Washington Volcanic Ash Advisory Center, by about 0800 that day the plume had reached 5 km altitude. Moreover, they described the plume as ~6 km wide, extending laterally for ~10 km, and traveling SW at 28 km/hour.
An Observatory press release on 19 May 1999 noted a 24-hour decrease in both the strength and the frequency of outbursts; however, at 0846 that morning an explosive eruption took place. On 24-25 May a large relative increase in seismicity occurred, including signals suggestive of degassing and explosions, but these decreased by 26 May.
Information Contacts: Colima Volcano Observatory, University of Colima, Ave. 25 de Julio 965, Colima 28045 México (URL: https://portal.ucol.mx/cueiv/); Washington Volcanic Ash Advisory Center (VAAC), NOAA/NESDIS Satellite Analysis Branch, Room 401, 5200 Auth Road, Camp Springs, MD 20746, USA (URL: http://www.ospo.noaa.gov/Products/atmosphere/vaac/); Gabriel Reyes, Red Sismológica Telemétrica del Edo. de Colima (RESCO), Centro Univ. de Inv. En Ciencias Básicas, Universidad de Colima, Ave. 25 de Julio, 965 Villa San Sebastián, Apdo. Postal 2-1694, Colima, México.
Diminished activity during much of June; a large explosion on 17 July
Details about another large explosion on 17 July that sent a plume to over 10 km altitude will be reported in a future issue. Prior to that, during the month of June, degassing and explosions continued. The highest level of activity in 13 days was recorded on 1 June, but by 4 June activity had dropped to the lowest level in a month and it remained low through the end of June. Accordingly, during June explosions and degassing events became less frequent, shorter in duration, and of lower intensity. On 5 July one of two explosions sent an ash column to ~2,500 m and produced ashfall 10-20 km W of the summit.
A 3 June aerial inspection verified that no new summit crater has been formed, but did record a recent increase in the size of the crater formed during the 10 February and 10 May explosions. The crater diameter is now 180-200 m, with the deepest sector measuring 70 m.
Early in June authorities continued the evacuation of La Yerbabuena, in the state of Colima, and Juan Barragán, Los Machos, El Borbollón, and Durazno, in the state of Jalisco. The Observatory recommended controlled access to areas within 8.5 km of the summit and alert to persons within 11.5 km. People in other high-risk areas were told to be prepared to evacuate. By 10 June, however, reduced activity enabled authorities to relax restrictions. They trimmed the evacuated zone to within 6.5 km of the summit and maintained immediate response capacity to 8.5 km (including the villages of La Yerbabuena, Juan Barragán, El Agostadero, Los Machos, Borbollón, and El Durazno). Radio alert was maintained to a 11.5 km radius of the summit (encompassing the settlements of Causentla, Cofradía de Tonila, Atenguillo, Saucillo, El Fresnal, El Embudo). Authorities allowed residents to return to evacuated communities in both Colima and Jalisco. On 2 July, due to recent rain and the potential for lahars, authorities recommended avoiding the bed of the Cordobán river.
Information Contacts: Colima Volcano Observatory, University of Colima, Ave. 25 de Julio 965, Colima 28045 México (URL: https://portal.ucol.mx/cueiv/).
Explosion on 17 July produces 11-km plume and pyroclastic flows
Another large explosion from Colima on 17 July sent a plume to over 10 km altitude. The official press bulletins (Boletín Del Comité Científico Asesor) during June and July consistently warned of the possibility of another large eruptive event. Seismicity, which had been high during 24-25 June, dropped during the subsequent 2 days, but the number of explosions remained similar. On 2 July instruments registered a slight increase in earthquakes, but the reports on 5, 9, and 16 July noted their numbers had generally dropped and remained near low or minimum values and that other monitored parameters lacked significant changes. As previously mentioned (BGVN 24:06), two degasing events took place on 5 July, one sending an ash-bearing column to 2.5 km above the summit with associated ash fall extending 10-20 km to the W; still, as late as 16 July abnormal numbers or intensities of such events were not seen. A swarm of small high-frequency earthquakes began 11-13 hours prior to the explosion. In the interval just prior to that, seismic quiet had prevailed for 11 hours.
The large 17 July explosion took place at 1241. Measurements with a hand-held clinometer 20 minutes after the explosion determined that cloud top then reached ~11 km altitude. Some near-source ash falls were incandescent, principally on the E flanks, and cooler ash fell over the W-SW sector. Pyroclastic flows had 4-4.5 km runout distances. Farther down the La Lumbre valley, the scorched, discolored leaves of plants continued for 5-5.5 km (straight-line distances from the summit to the limit of singeing, reaching ~3.5 km from the Rancho de Pedro Virgen). In the W sector, singed and scorched leaves were also seen over a 3.3 km radius from the crater. The explosion crater, which remained 70-80 m deep, grew in diameter by a few tens of meters, leaving it 220-230 m across. After the event, the crater's interior walls showed a strong inclination (flaring) on sides to the NW, N, NE, and SSW.
Regions affected by ashfall lay within about 30 km of the volcano. Ash landing 13 km from the summit reached 3-5 mm thick. At the city of Colima (~30 km distant), residents noted only traces of accumulated ash. Colima residents heard the explosive discharge loudly; they also felt low vibrations in the ground and watched window glass shake. The 17 July explosion was ranked as more powerful than the previous two large explosions (10 February and 6 May 1999) , on the basis the intensity of the sound, the size of ground vibrations, plume height, the volume of material expelled, and the amount of ash fall produced.
Evacuations followed from nearby settlements. For example, in the state of Colima one hour after the explosion many people evacuated the town of La Yerbabuena (population, ~195 people). This was the fourth time in eight months that authorities called for evacuations. Some families refused to leave, electing instead to sign waivers and remain. In the state of Jalisco evacuations were called for the settlements Juan Barragán, Los Macho, and El Agostadero. Ash fall 25 km distant affected the residents of the village of Zapotitlán de Vadillo in the state of Jalisco. Observatory bulletins around this time discussed potential hazards and hazard mitigation strategies. By 19 July other measured parameters returned to low levels and evacuees returned.
At 0830-0845 on 18 July, material dislodged on the SW flank along the track of the 1998-99 lava flows. This left a ~500-m-long, coffee-colored scar near the 3,200- to 3,300-m elevation. What some reports called block-and-ash flows and others called pyroclastic flows traveled ~2 km and entered the majority of drainages along Colima's S sector (including those of the Montegrande, San Antonio, three arms of the Cordoban, and part of the La Lumbre). Heavy rains fell and around 1300-1400 observers at the 2,200-m segment of the Montegrande river witnessed and photographed the pyroclastic deposit as it remobilized to generate a hot lahar. Later inspection revealed that lahars had traveled about 4 km down the Montegrande, San Antonio, and Cordoban rivers.
For the week ending on 23 July 1999, Colima remained at low seismic levels except for an explosive eruption at 0745 on 21 July. On 23 July some six degassing events were registered. In discussing the previous 24 hours, the 30 July bulletin noted high seismicity and minor ash fall. The threat of lahars led authorities to caution citizens to avoid vulnerable towns in affected drainages. These drainages included La Lumbre, El Cordobán, San Antonio, and Monte Grande in Colima; and the drainages El Muerto, La Tuna, Santa Ana, El Cafecito, La Arena, and Beltrán-Durazno in Jalisco. A later bulletin warned citizens to take steps before the occurrence of lahars, specifically aiming these recommendations to residents of La Yerbabuena, La Becerrera, and Rancho El Jabalí.
Information Contacts: Colima Volcano Observatory, University of Colima, Ave. 25 de Julio 965, Colima 28045 México (URL: https://portal.ucol.mx/cueiv/).
Low seismicity August 1999-May 2000; frequent explosions and evacuations
The following summarizes activity at Colima during the period from August 1999 to May 2000. As previously mentioned (BGVN 24:08), outbursts occurred on 5 and 17 July 1999. However, in the months that followed, August 1999 through May 2000, little activity occurred on Colima. Microearthquakes, sporadic eruptions and lahars were the most common events during these months.
During August through December 1999 Colima maintained low levels of seismicity, with few explosions or mudflows. Due to heavy precipitation on 2 September a lahar traveled under the Cordoban bridge without causing damage. Residents of Yerbabuena, La Becerrera, and Rancho El Jabali were told to avoid activities on the S-flank stream beds of the Cordoban, La Lumbre, San Antonio, and Montegrande rivers.
Landslides and lahars on the S and SW flanks during 5-6 September were quickly dispersed into La Lumbre and Cordoban drainages due to intense rains. Other monitored parameters showed no significant changes. During the week of 10 September seismicity remained low, with no degassing events or important explosions noted.
On 6 October at about 0120, residents from the village La Yerbabuena (8 km SW of the summit) reported a very short and light ashfall. The ashfall lasted only a few minutes, and prior to the fall residents reportedly heard "jet" sounds coming from the crater. Before the described events, the telemetered seismic network alerted the civil protection authorities, who then notified nearby villages of the activity. At 1700 on 12 October there were ground reports of an eruption that sent an ash cloud ~6 km.
During the first two weeks of November Colima ejected steam-and-ash an average of once per day. The estimated height of the columns varied from 200 to 1,000 m above the summit. Neither ballistic ejecta nor pyroclastic flows were observed. On 17 December seismicity remained stable, but some fumarolic and explosive emissions took place.
Beginning in January and continuing through May, ash explosions and steam emissions became frequent. Seismicity on 18 March remained low, yet Colima continued to produce fumes and explosions that were considered to be a high risk to the surrounding population. The evacuation of populations within a radius of 6.5-8.5 km from the summit was maintained by the State Systems of Civil Protection and the Mexican Army. After some explosions on 25 May these evacuations were again enforced.
Information Contacts: Colima Volcano Observatory, University of Colima, Ave. 25 de Julio 965, Colima 28045 México (URL: https://portal.ucol.mx/cueiv/).
Correction to last report; a strong dome explosion on 22 February 2001
This report primarily covers an explosion that occurred on 22 February 2001. Colima was previously discussed in BGVN 25:06 in a summary of reports by the University of Colima's Volcano Observatory covering the interval from August 1999-May 2000. That report contained several mistakes worth noting here. First, at that time residents were not evacuated but rather were advised to avoid entering closer than a radius of 6.5 km. Second, the 11.5 km radius serves to alert residents of settlements like Yerbabuena (at 8 km radial distance) and La Becerrara (12 km) in cases of heightened activity when evacuations are called for. Such evacuations did not occur in the stated interval. Those corrections addressed, its also worth noting that citizens continued to be cautioned to avoid drainages for fear of lahars. Occasional volcanic outbursts continued, as noted in an early August 2000 observatory report. Authorities remained concerned about the possibility of strong outbursts like those seen on 10 February and 17 July 1999 (BGVN 24:01, 24:02, 24:06, and 24:08). An observatory report on 22 September 2000 noted a slight decline in activity seen in monitored parameters during the previous week. A volcanic ash advisory on 11 November 2000 reported ash to ~6 km altitude, although this could not be confirmed by GOES-8 satellite imagery.
22 February 2001: Visual and video observations. On 22 February at 0532 a strong explosion took place at Colima's intracrater dome. Based on images from video cameras at both the infrared and visible wavelengths, the explosive column expanded laterally at ~100 m/s and rose with mean velocity of ~200 m/s to attain an altitude ~3 km above the summit. The ash cloud, which on the videos appeared as a broad and conspicuous zone above the summit, proceeded to travel to the ENE and produced ashfall at a distance of ~25 km from the volcano in Tuxpan, Jalisco. Small pyroclastic flows formed in the SW sector and descended to the 3,000 m contour interval.
Inside of Colima's 250-m-diameter summit crater the explosion left a new crater ~150 m in diameter and ~30 m deep. The largest ejected blocks measured greater than 5 m in diameter and fell ~300-400 m below the crater. Principally in the volcano's NE sector, observers found rock fragments up to 1.5 km from the vent that created impact craters up to 2 m in diameter. The rock fragments consisted of fresh andesite, dome material presumably emplaced during the 1998-1999 eruption.
Seismic and tilt observations. Figure 38 shows the epicenters and hypocenters of 33 earthquakes located during February 2001. The figure shows events at depths ranging from the summit crater to 5 km below sea level. Fifteen earthquakes (M 1.9-3.9) were recorded during the 9-hour interval prior to the 22 February explosion. These events are shown on figure 38 as points surrounded by open circles.
 |
Figure 38. A map and E-W cross section for Colima plotting seismic data acquired during February 2001 (i.e., epicenters (above) and hypocenters (below)). On the map, VC is Volcán de Colima; NC is Nevado de Colima; the volcano complex's relief is shown by contours at 3,000 m, 3,500 m, and 4,000 m. The two seismic stations nearest Colima's summit are shown as triangles (designated EZV4 and EZV3); the inclinometer station (Aguila, AGL), as a cross; and the video station (Nevado, NVD), a diamond. Courtesy of V. Zobin. |
Figure 39 shows the variations in seismic energy release during February as recorded by station EZV4. The increase in seismicity starting 48 hours before the 22 February explosion is clearly seen. The seismic signal labeled "explosion" on 22 February was much larger than any others seen in the same month.
 |
Figure 39. Seismicity recorded by Colima seismic station EZV4 (~ 2 km NW of the summit) during February 2001; the data illustrate the comparatively large signal obtained from the 22 February explosion. The data were recorded every 2 minutes. Courtesy of G. Reyes. |
The 22 February explosion accompanied sharp deflation. Tilt at inclinometer station Aguila (AGL, figure 38) was measured in both tangential and radial components. At this station, inclinometers underwent large sudden and non-reversing offsets due to the 22 February explosion. Specifically in the radial direction the offset was ~10 µrad and in the tangential direction, ~32 µrad. For comparison, at other times during February, diurnal variation at this station was on the order of 2 to 3 µrad. Ignoring the large 22 February displacement, the overall offsets seen for the bulk of February amounted to less than ~8 µrad. These comparisons underscore the size of station AGL's non-reversing offsets on 22 Februrary.
Information Contacts: Observatorio Vulcanológico de la Universidad de Colima, Colima, Col., 28045, México (URL: https://portal.ucol.mx/cueiv/).
Surficial fractures preceded a light-colored dome emplaced aseismically
This report describes two visits to the rim of Colima's main crater (17 March and 26 May 2001) and summarizes collateral data collected around that time. On the earlier visit, observers found an enlarged main crater, they noted the disappearance of an older (1994) crater, and they photographed a recent crater with a sulfur-encrusted, warped, and fractured floor. By the time of the later visit, an unusual new dome had appeared, composed of more fragmentary and lighter color clasts than typical for Colima's lava domes. Effusive activity was previously seen during November 1998-February 1999.
Crater rim observations. On 17 March 2001, Nick Varley and Juan Carlos Gavilanes ascended to Colima's crater rim (figures 40 and 41). It was the first visit there since January 1999. Circumnavigating the main crater, they prepared a map of the current crater and environs (figure 40). The main crater was 230-260 m in diameter, 15-40 m deep, and ~1.4 x 10⁶ m3 in volume. Its diameter had grown two-fold larger than it was before the 1998-99 eruption, reaching its largest size since the early 1960s.
 |
Figure 40. A sketch map of Colima's crater zone showing the main summit crater geometry after the 1998-99 eruption, and the dome seen on 26 May 2001. The small triangles on the crater rim indicate GPS-surveyed points (way points obtained using various receivers on 17 March and 26 May 2001); values at the map margins are UTM coordinates. The photograph shown in figure 41 was shot from the vantage point indicated by the bold rectangle on the main crater's eastern rim. Historical lava flows traveled down the volcano along routes indicated by small arrows. Fumaroles Fa and Fb indicate areas with temperatures over 850°C and over 800°C during December 1995 and May 1998, respectively. The locations of the craters formed during the 1994 and 1987 explosions were based on an August 1996 survey by A. Cortés, J.C. Gavilanes, and J. Ramos. The current map was prepared by J.C. Gavilanes, N. Varley, A. Rivera, and J. Heredia. |
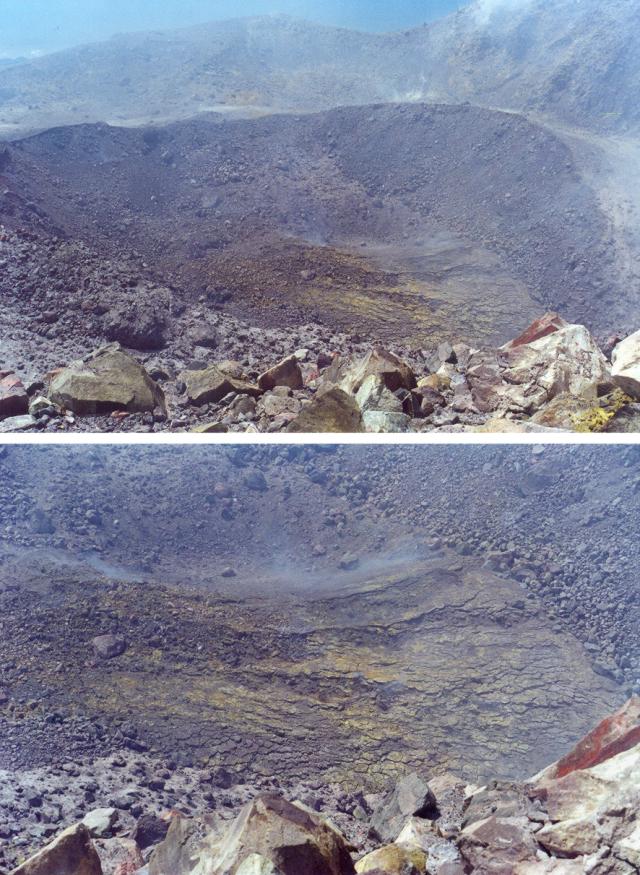 |
Figure 41. Pre-extrusion views of Colima's up-warped crater floor as seen from the point on the main crater rim indicated on the map (figure 40) on 17 March 2001. The upper photo provides an overview shot of the 22 February 2001 crater; the lower photo is zoomed in on the deformed crater floor. The crater floor displays both fractures and buckling of sufficient intensity to create a visibly undulatory surface. The color version of the photos shows bright yellow sulfur incrustations over extensive portions of the up-warped crater floor. Photo and caption provided courtesy of J.C. Gavilanes. |
On their 17 March visit Varley and Gavilanes found a smaller crater located inside the main crater's N sector (figure 40). This inner crater was assumed to be formed by the 22 February 2001 explosion. The inner crater was then estimated to be 127 m in diameter, 15 m deep, and ~0.2 x 10⁶ m3 in volume. In the NE sector of the inner crater they observed an inflated, buckled, and fractured surface (figure 41). They inferred that this inflated surface stemmed from an intrusion initiated sometime after the 22 February explosion.
Figure 42 records the scene Varley and Gavilanes found when they ascended to the crater rim on 26 May 2001. Close to the inflated surface observed on 17 March they found a new lava dome. It stood ~115 m across its base, ~57 m across its top, ~30 m high, and was ~0.15 x 10⁶ m3 in volume. The two observers also noted that in comparison to conditions witnessed during the previous crater ascent, new and stronger fumarolic zones surrounded the new dome, mainly to its N, NE, and E (figure 40).
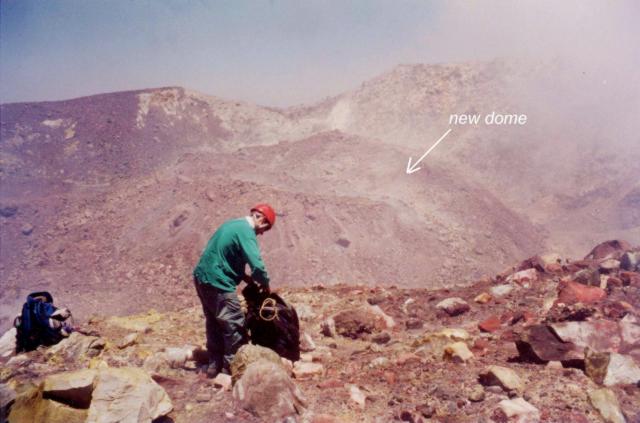 |
Figure 42. A photo of the new dome shot from the Colima's E crater rim on 26 May 2001. The photo of the new dome was taken from the vantage point indicated by the rectangle on figure 40, ~ 135 m from the center of the dome. Courtesy of J.C. Gavilanes. |
Collateral observations. Later review of seismic, deformation, and GOES radiation data (figure 43) showed that dome extrusion may have started on 8 May, a day with distinct increases in both thermal radiation and tilt. No increase in seismic activity was observed; the proposed explanation for this is that the lava was plastic enough to avoid the shear fracturing of surrounding structures. Assuming that the extrusion started on 8 May 2001, the resulting growth rate (for 8-26 May, 19 days) was ~0.1 m3 s-1. Fieldwork in the crater's vicinity took place over a 3-hour interval and included gas sampling. Only a small rockfall was heard.
 |
Figure 43. Plots of four monitored parameters at Colima acquired during April-May 2001. The common time axis allows the comparison of seismic (RSAM) data (A), remotely sensed radiance (B), and tilt (C and D). The tilt data (C and D) were recorded at a station 1.02 km E of the dome. The arrow indicates the inferred date when the dome began extruding. Seismic data represent the cumulative amplitude of reduced seismic energy (RSAM) measured at station EZV4, 1.7 km from the crater. Seismicity remained relatively quiet (see text). The radiance plot (B) was made using mid-infrared (3.9 mm) data. This plot presents infrared volcanic radiance acquired by NOAA's geostationary GOES-8 satellite. The radiance values shown depict the hottest pixel within the 500 x 500 pixel box that lies centered on Colima. These data were made available by the Institute of Geophysics & Planetology of the University of Hawaii. The figure was compiled by V. M. Zobin using data processed by the University of Hawaii, and data collected and processed by T. Dominguez, C. Navarro, and H. Santiago. |
The new dome appeared anomalous in certain ways. It was not composed of large dark-colored blocks (as observed for the effusive events that occurred during the last 40 years), but instead consisted mainly of smaller-sized blocks with a light-gray color. The new dome could be an example of endogenous dome growth, where no new molten material reaches the surface.
On 1 May 2001 the measured SO2 flux was 200 t/d, and on March 16 it was 145 t/d. These are only slightly higher than mean values recorded during the calm period of 1997, which were less than 100 t/d.
Information Contacts: Observatorio Vulcanológico de la Universidad de Colima, Colima, Col., 28045, México; Facultad de Ciencias de la Universidad de Colima, Colima, Col., 28045, México (URL: http://www.ucol.mx/).
Lava dome extrusion in May and October 2001
An explosive eruption on 10 February 1999 (BGVN 24:01) marked the end of the block-lava emission that started on 20 November 1998 (BGVN 23:11). Other explosive events followed on 10 February, 10 May, 17 and 29 July 1999, and on 22 February 2001. Seismic precursors occurred just before the explosions and were of small magnitude, making it difficult to warn civil defense authorities.
A new dome appeared in May 2001 (BGVN 26:05). During August, a reconnaissance flight was carried out by Suárez-Plascencia and Núñez-Cornú, who observed in the main crater a steep-sided mound (scoria cone) and an inner crater. Fumarolic activity occurred in small explosion pits on the top and the walls of the scoria cone.
Figure 44 shows that seismicity continued at a low level through early October. On 1 October, small discrete earthquakes, called "pulgas" (fleas), began to appear at a rate of one or more per hour. Not seen since November 1998, these pulgas were previously associated with magmatic extrusions. Seismicity increased until 14 October, and then underwent several cycles of increase and decrease, again reaching previous low levels by the end of the month. During these dates, no visual observations of the crater were possible due to continuous cloud cover.
 |
Figure 44. Histogram of seismic events at Colima during October 2001. Explosions are indicated by stars. Courtesy of Centro de Sismologia y Volcanología de Occidente. |
On the morning of 31 October from Bravo Nectar (Nevado Base, 900 m NW of summit of Nevado de Colima), members of Protección Civil Jalisco observed a "needle" or spine over the main crater rim. Jalisco authorities who carried out a flight to observe changes in the crater discovered a new dome with a spiny surface that had grown over the 22 February explosion crater (figure 45). New explosion pits were observed on the scoria cone. Later photos show the evolution of the two features seen on 4 August. First, on 31 October the scoria cone contained new explosion pits. Second, the inner crater became the site of a new dome. This dome contained a conspicuous spine (figure 45). Compared to the 120-m-radius crater, the spine had a radius of ~20 m and was ~60 m high. This implies the spine's volume was ~75,000 m3.
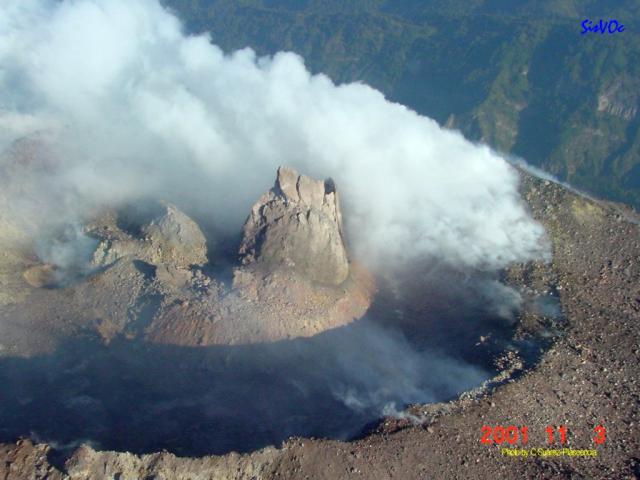 |
Figure 45. At Colima on 3 November this new lava dome and spine was observed on the N side of the crater. The light-colored spine was about 40 m tall, 40 m wide at its base, and smooth with near-vertical walls. Courtesy of Centro de Sismologia y Volcanología de Occidente. |
Other photos taken on 10 November revealed a cracking of the dome's spiny crown as a result of a widening of the dome, maybe due to a very low input of plastic material. These facts suggest that extrusion of this new structure began in early October and continued with a high growth rate, reaching a maximum on 14 October. The spiny extrusion probably occurred around this day and was accompanied by small explosions. Seismicity decreased beginning on 18 October, which suggests a corresponding decrease in the extrusion rate. By 4 November seismicity reached background levels, perhaps implying aseismic dome growth. This could be due to a decrease in the extrusion rate or to the cooling of the dome, which began to act as a cork, a behavior that implies a more hazardous scenario.
This extrusion may herald a new, more dangerous stage in the eruptive process of the volcano, analogous with a Pelean dome. It may portend more energetic explosions, larger pyroclastic flows, dome collapse events, and substantial lahars. These observations suggest that at the moment there are two active vents inside the crater, as in the 1991 episode (Núñez-Cornú and Sanchez, 1998); one vent is on the N side and the other is on the W side. The spine grew in the N vent, while the W vent featured small explosions throwing ashes and scoria.
Information Contacts: F. Núñez-Cornú and C. Suárez-Plascencia, Centro de Sismologia y Volcanologia, Centro Universitario de la Costa, Av. Universidad 203, Del. Ixtapa, Puerto Vallarta, Jalisco, Mexico; G. Reyes-Dávila, RESCO, Univ. de Colima, Apartado Postal 2-1694, 28000 Colima, Mexico.
Growth of the lava dome at the end of 2001 spawning new lava flows
A new lava flow began on 14 February 2002 on the SW flank of the central crater of Volcán de Colima (figure 46). On 22 February 2002, the flow was 200 m long and had a volume of ~720,000 m3. The rate of magma extrusion at the surface was ~0.9 m3/s. The lava flow emerged from the summit lava dome after the dome had filled the crater in early February (figure 47). Starting on the evening of 4 February, frequent incandescent avalanches descended along the SW, S, and W slopes and into the ravines of La Lumbre, El Zarco, Cordoban and San Antonio and preceded the lava flows. The number and intensity of the rockfalls increased rapidly (figure 48). Rocks traveled as far as 1-3 km from the crater. Pyroclastic flows reached 1-2 km in length on 9 February; they descended the S and SW flanks.
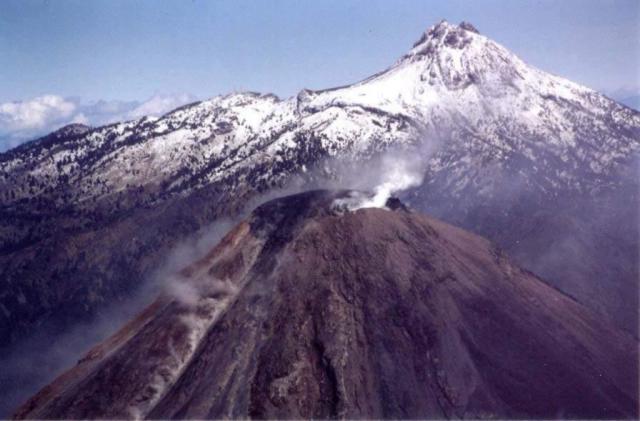 |
Figure 46. A N-looking aerial photo taken on 14 February 2002 shows the upper slopes of Volcan de Colima (foreground) and the snow-covered cone of Nevado de Colima (background). Colima's lava dome appears as a dark mass filling the crater and bulging upwards; a dense plume of white steam hangs over the eastern summit. Elongate plumes emerge from lava flows and avalanches coming off the dome and descending radially oriented chutes (left center). This photo was taken by M. Breton. Courtesy of Observatorio Vulcanológico de la Universidad de Colima. |
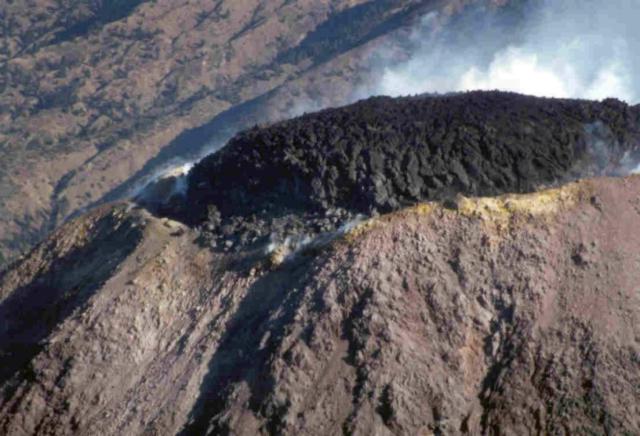 |
Figure 47. A photo of Volcan de Colima taken on 5 February showing the lava dome filling and capping the summit. Lava flows began about 9 days later (see previous figure). The photographer was M. Breton. Courtesy of Observatorio Vulcanológico de la Universidad de Colima. |
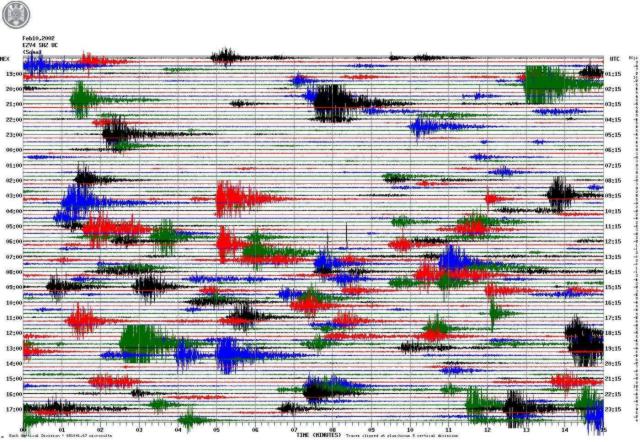 |
Figure 48. A seismogram recorded at station Soma (EZV4), which is located 1.7 km NW from the Colima crater. The sporadic, impulsive events shown on this record of 10 February 2002 were produced by rockfalls and pyroclastic flows. Courtesy of Red Sismológico RESCO, Observatorio Vulcanológico de la Universidad de Colima. |
With the beginning of intensive rockfalls in early February, the authorities of Colima State evacuated the nearest village, La Yerbabuena, which is located 8 km S of the crater. About 200 persons evacuated during 5-11 February. During the remainder of February and into March, landslides and incandescent avalanches continued to travel down the S, SW and W flanks, extending 2-3 km from the summit. Dark block lava was also seen, flowing down the E, W, and SW flanks and extending as far as 2 km from the summit.
The lava dome began to grow slowly at the beginning of May 2001 (BGVN 26:05). At the end of October, a spine-type extrusion, 60 m high, formed on the N part of the dome (BGVN 26:10). It was destroyed one month later. Around that time, the situation changed as the lava extrusion rate increased from 0.05 to 1.0 m3/s and lava began to fill the crater. The rate of magma extrusion increased sharply in October 2001 (figure 49), and by the end of January 2002, the total volume of the dome was estimated as 1,450,000 m3. The increased rate of dome growth occurred during a period of very low seismicity accompanied by a continuous deformation of the volcano's surface. This deformation was interpreted as inflation that could reflect the injection of new magma at depth.
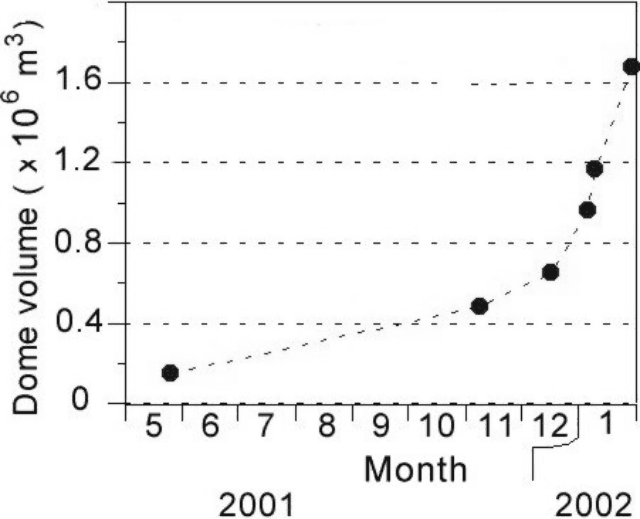 |
Figure 49. The history of Colima dome growth in 2001-2002. The volumes were estimated from air photos. Courtesy of Observatorio Vulcanológico de la Universidad de Colima. |
Information Contacts: Observatorio Vulcanológico de la Universidad de Colima, Universidad de Colima, Ave. 25 de Julio 965, Colima 28045, Colima, México.
New lava flows; change in deformation during 15-20 May 2002 prompts evacuation
New lava flows began on 14 February 2002 on the SW flank of the central crater of Colima. The lava flows were produced by the dome that had filled the crater through early February (BGVN 27:02). Figures 50 and 51 show the dome at the end of May 2002. Two main groups of lava flows were formed; the first was a flow with a maximum length of 1,400 m, and the second included two small branches with maximum lengths of 500 m (table 11). The total volume of lava reached 3,435,000 m3. Emplacement of the lava flows was accompanied by numerous incandescent rockfalls on the SW, S, and W slopes of the volcano along the ravines of La Lumbre, El Zarco, Cordoban, and San Antonio beginning on the evening of 4 February. The first pyroclastic flows of 1-2 km length were recorded on 9 February on the S and SW flanks, prior to the onset of the new lava flows. The number and intensity of the rockfalls and pyroclastic flows increased rapidly and from 15 February were recorded at a level of 200-300 per day through April (figure 52). Rockfalls reached a distance of 1-3 km from the crater.
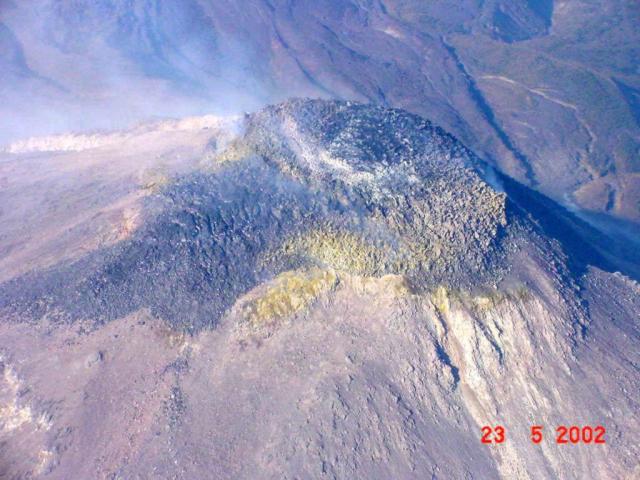 |
Figure 50. A S-looking view of the summit of Colima taken on 23 May 2002 showing the emerging dome dominating the summit area. Lava flows appeared to emerge from the dome. Courtesy of Secretaria de Comunicaciones y Transportes del estado de Colima. |
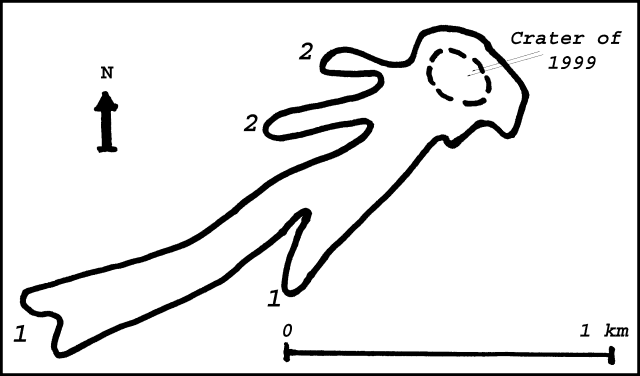 |
Figure 51. A sketch of the new lava flows on the W and SW slope of Colima at the end of May 2002. Courtesy of Observatorio Vulcanológico de la Universidad de Colima. |
Table 11. Characteristics of the 2002 lava flows 1 and 2 of Colima (see figure 2). "--" indicates that the information was not reported. Courtesy of Observatorio Vulcanológico de la Universidad de Colima.
| Date | Flow 1 Length | Flow 1 Volume | Flow 1 Effusion rate | Flow 2 Length | Flow 2 Volume | Flow 2 Effusion rate |
| 22 Feb 2002 | 200 m | 720,000 m3 | 6-9 m3/s | -- | -- | -- |
| 22 Mar 2002 | 550 m | 1,650,000 m3 | 0.6 m3/s | -- | -- | -- |
| 26 Apr 2002 | 1,000 m | 1,785,000 m3 | 0.07 m3/s | 50 m | 98,000 m3 | -- |
| 30 May 2002 | 1,400 m | 2,310,000 m3 | 0.2 m3/s | 500 m | 1,125,000 m3 | 0.3 m3/s |
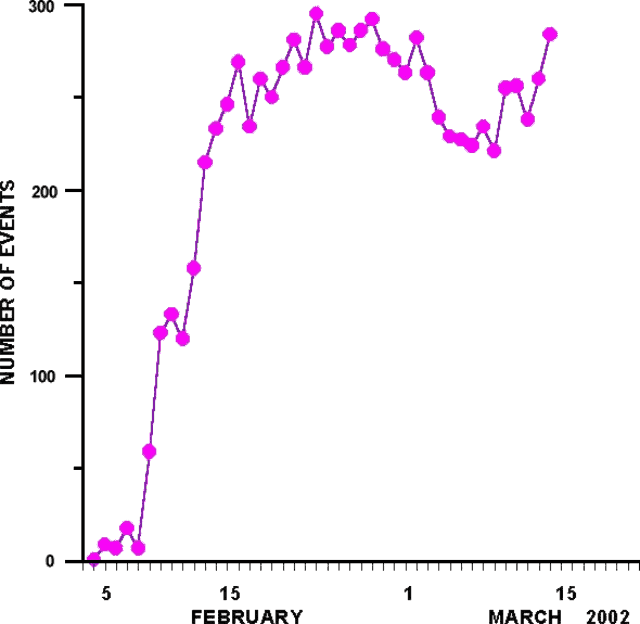 |
Figure 52. Daily variations of the number of rockfalls and pyroclastic flows recorded by seismic station Soma at a distance of 1.7 km from the crater of Colima. Courtesy of Observatorio Vulcanológico de la Universidad de Colima. |
The Washington VAAC reported that ash and steam were observed on 8 March extending E from Colima at 4.3-5.2 km altitude. The emission was too small to be visible on satellite imagery, although a faint hotspot was seen in shortwave imagery. On 25 March at 1040 a steam-and-ash emission rose to ~5-6 km altitude and drifted E.
On 25 March volcanic tremor began to occur during 1- to 3-hour intervals, and since 8 April tremor was observed daily for intervals from a few minutes to 10 hours. Degassing occurred starting on 25 April as very low-magnitude explosions. In many cases, the intervals of volcanic tremor were accompanied by an explosive event. The numerous but very small-amplitude tremor and explosive events occurred simultaneously and accompanied continuous records of rockfalls and pyroclastic flows.
Deformation of the volcanic edifice that was observed by an inclinometer network showed a sharp change in behavior on 15 May. On 20 May deformation became stable. A preventive evacuation of the village of La Yerbabuena occurred during 18 May-4 June. The 6.5-km-radius zone of exclusion around Colima remained in effect, with other restricted access continuing out to a radius of 11.5 km.
Information Contacts: Observatorio Vulcanológico de la Universidad de Colima, Ave. 25 de Julio 965, Colima 28045, Colima, México; Washington Volcanic Ash Advisory Center (VAAC), NOAA/NESDIS Satellite Analysis Branch, Room 401, 5200 Auth Road, Camp Springs, MD 20746, USA (URL: http://www.ospo.noaa.gov/Products/atmosphere/vaac/).
Perilous summit visits during 2001 and 2002
The following report documents several climbs to the summit of Volcán de Colima, carried out in order to accurately measure the size of the growing lava dome, measure fumarole temperatures, and sample gases when possible. Strict safety precautions were followed and climbs were only undertaken during periods of low seismicity. Time is local (calibrated to RESCO seismographic clock). Coordinates and most calculations were obtained by GPS navigator (accuracies of 3-6 m indicated by the instrument) and GARMIN software.
Between 19 August 2001 and 29 June 2002, Nick Varley, Juan Carlos Gavilanes-Ruiz, Mitchell Ventura-Fishgold, Philippa Swannell, and Ruri Ursúa-Calvario performed four ascents to the growing dome, obtaining fresh lava samples, as well as ballistic-projectile samples ejected by the pre-extrusion explosion that occurred on 22 February 2001 (table 12). The lava sample of 18 February 2002 was obtained by Carlos Navarro-Ochoa (a block from a rockfall at the active lava front).
Table 12. The authors took fresh lava samples at Colima at these specified dates and locations. Latitude and longitude are given in degrees, minutes, and decimal minutes. Courtesy Universidad de Colima and Instituto de Geofísica.
| Date | Sample | Sampling site | Coordinates |
| 22 Feb 2001 | 1 | El Playon, 1.72 km to the NE of the crater (ballistic projectile). | 19°31.607'N, 103°36.645'W |
| 19 Aug 2001 | 2 | Growing dome (1 meter from a glowing fumarole at 808°C). | 19°30.773'N, 103°37.013'W |
| 26 Nov 2001 | 3 | Growing dome (andesitic spine). | 19°30.747'N, 103°36.983'W |
| 18 Feb 2002 | A | W face, ~1.2 km below the lava flow's active front. | [location unknown?] |
| 22 Feb 2002 | 4 | Growing dome (see figure 57). | 19°30.788'N, 103°37.021'W |
| 29 Jun 2002 | 5 | Growing dome SE part. | 19°30.755'N, 103°36.904'W |
During each ascent GPS and geometric measurements were taken in order to calculate the volume of the dome and the current rate of extrusion. Figures 53 and 54 show the preliminary calculations of these variations. The samples collected during the ascents were analyzed by Juan Carlos Mora-Chaparro.
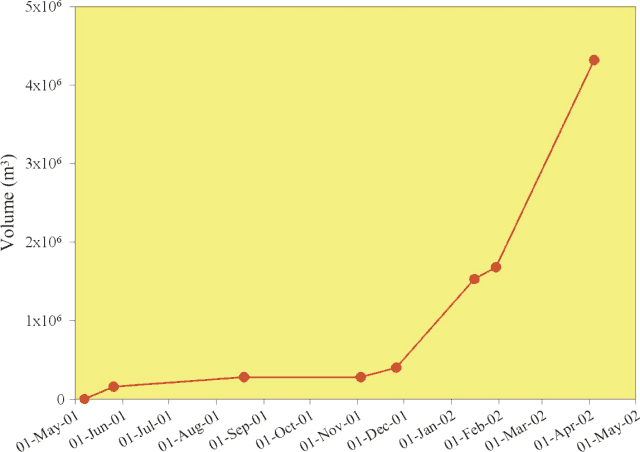 |
Figure 53. Increase in volume of lava dome and flows measured at Colima during May 2001-April 2002. Courtesy Universidad de Colima and Instituto de Geofísica. |
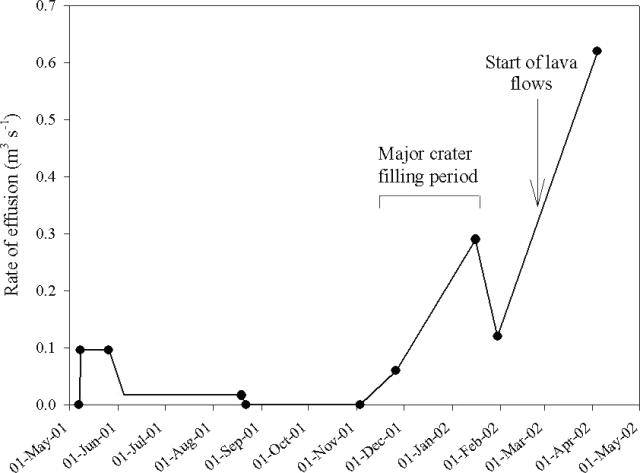 |
Figure 54. Variation in effusion rates seen at Colima from May 2001 to April 2002. Courtesy Universidad de Colima and Instituto de Geofísica. |
Ascent to the crater, 19 August 2001. On this occasion Varley and Gavilanes descended into the crater and circumnavigated the dome discovered on 26 May 2001. The volume of the dome had increased by ~77% since then, and a new lobe had appeared. The GPS tracks recorded around the dome revealed a maximum distance of 103 m in its N-S axis, and a maximum of 122 m in the E-W axis. A zone of incandescent fumaroles (with temperatures up to 877°C) was found on the NE slope of the dome and on the adjacent crater floor (figure 55). This high-temperature zone was located in the same position as the high-temperature group of fumaroles that existed above the previous dome and was monitored between 1995 and 1998. This suggests that the location of the main conduit has not changed since then. During the nearly 4-hour-long stay (0950-1400) on the crater rim and inside the crater, only two small rockfalls were heard.
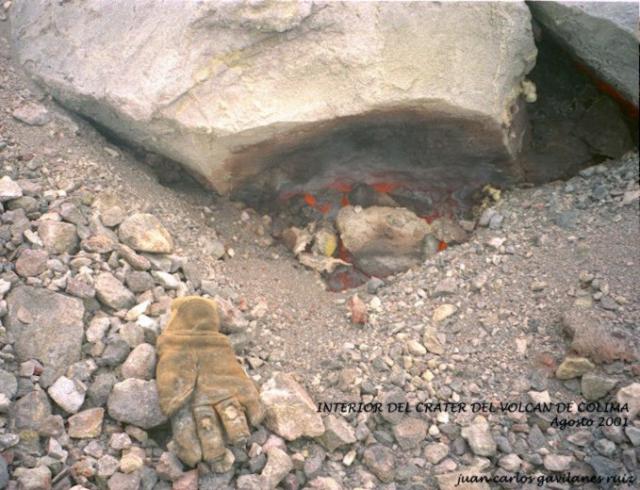 |
Figure 55. Incandescent fumarole on the E flank of the growing dome inside the major crater on 19 August 2001. A lava sample was obtained 1 m to the left. Photo taken by J.C. Gavilanes-Ruiz. Courtesy Universidad de Colima and Instituto de Geofísica. |
Samples of high-temperature fumarolic gases were taken during this ascent. Unlike previous samples from Colima, they were relatively uncontaminated by atmospheric air. The results of the analyses are shown in table 13. The temperature ranges recorded in the N crater-floor field and in the N and NE crater-rim field are shown in table 14.
Table 13. Volume of gases of high-temperature fumarolic gas collected on 19 August 2001 at Colima. R/Ra represents the isotopic ratio of helium normalized to the atmospheric ratio. (Gas volumes are in mol%). Courtesy Universidad de Colima and Instituto de Geofísica.
| H2O | H2 | CO2 | CO | Stot | HCl | HF | N2 | CH4 | He | R/Ra | He/Ne |
| 95.22 | 0.75 | 0.99 | 0.006 | 2.04 | 0.42 | 0.010 | 0.39 | 0 | 0.0001 | 6.2 | 48 |
Table 14. Temperature ranges of fumarole fields at Colima during 19 August 2001-26 November 2002. Courtesy Universidad de Colima and Instituto de Geofísica.
| Date | Fumarole field | Temperature range |
| 19 Aug 2001 | N and NE rim | 122-330°C |
| 26 Nov 2001 | N and NE rim | 100-295°C |
| 22 Feb 2002 | N and NE rim | 128-221°C |
| 29 Jun 2002 | N and NE rim | 162-272°C |
| 19 Aug 2001 | NE crater-floor | 590-877°C |
| 26 Nov 2002 | South side of the dome | 80-140°C |
Ascent to the crater and to the base of the active dome, 26 Nov 2001. During this excursion Varley and Ventura descended into the crater and measured temperatures of the new fumarole field on the S border of the growing dome (figure 56). Meanwhile, Gavilanes and Ursúa measured the fields located on the N and NE borders of the main crater and performed GPS measurements. Gas condensates were sampled from the NE fumarole field. Rock samples were taken from the andesitic spine (figure 57) first observed almost one month previously by personnel of Proteccion Civil of the State of Jalisco. The spine was located in the same area where the maximum temperatures were found on 19 August 2001. The mean frequency of rockfalls from the active dome caused by the lava effusion was once every 5 minutes, with larger events occurring approximately once every 30 minutes. Ranges of fumarole temperatures measured on the S side of the dome and in the NE field are shown in table 14.
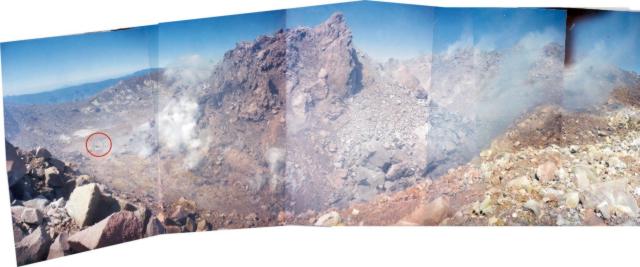 |
Figure 56. Composite photos giving a wide-angle view of the growing dome and collapsing spine from the E border of the main crater on 26 November 2001. The circle (left) locates Nick Varley and Mitch Ventura who were measuring fumarole temperatures in the S sector of the main crater. GPS data indicated that by this day the dome measured 98 m along its N-S axis. Photo taken by J.C. Gavilanes-Ruiz. Courtesy Universidad de Colima and Instituto de Geofísica. |
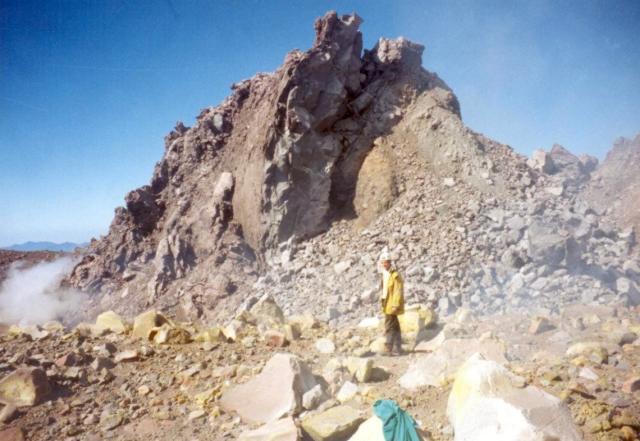 |
Figure 57. Photo taken on 26 November 2001 showing Ruri Ursúa standing on the E inner border of the main crater of Colima. The highest part of the growing dome can be seen in the background, the andesitic spine in the center of the photo (~ 10 m high in the visible part). Photo taken by J.C. Gavilanes-Ruiz. Courtesy Universidad de Colima and Instituto de Geofísica. |
Ascent to the dome, 22 Feb 2002. During this ascent several light ashfall-producing, small explosive events were observed (figure 58). One event expelled several bombs (up to 20 cm in diameter) to a height of ~20 m above the dome. The explosions appeared to originate from the central to W side of the dome. Small rockfalls were occurring approximately once every 15 to 20 minutes on the E side of the dome. Due to the potential of rockfalls, a temperature was only obtained from the fumarole field to the N. There had been an increase in the size of this field, which was located outside of the crater, high on the N flank. The temperature range is shown in table 14.
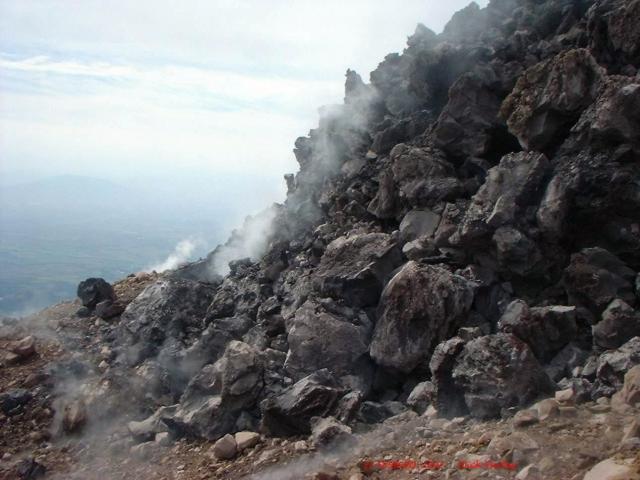 |
Figure 58. The ~10 m-high E border of the growing dome at Colima on 22 February 2002. The area covered by the outermost blocks is the remaining ~ 20 m-wide part of the 1987 crater. Photo taken by Nick Varley. Courtesy Universidad de Colima and Instituto de Geofísica. |
Ascent to the lava flow's front, 7 June 2002. On this ascent Varley and Gavilanes, climbing the S flank of the volcano, reached a point (19°30.218N, 103°37.392W) located at the same elevation (3,090 m) and approximately 75 m to the E of the front of the active lava flow emplaced on the upper part of the Cordobán Central ravine. The maximum length of the Cordobán Central 2002 lava flow was estimated to be 1,290 m on 7 June 2002. During this 6-hour-long ascent, the average frequency of rockfalls originating from both the lava flow front and the active dome was on the order of one rockfall every 10 minutes. No pyroclastic flows were observed.
Ascent to El Volcancito. On 11 June 2001 Juan Carlos Gavilanes and Alejandro Elizalde ascended to the dome formed in 1869-1872 called El Volcancito in order to repair the meteorological station (19°30.996 N, 103°36.511 W). El Volcancito is located on Colima's E summit (1,010 m horizontal distance, and N62°E of the center of the active dome of Volcán de Colima at 19°30.746 N, 103°37.020 W). Only one rockfall was observed on the E face while the team was 1,750 m from the dome, during the period from 1200-1545. In comparison to the 22 February 2001 observations performed from the same distance, no substantial changes in the size of the dome were apparent from El Volcancito (figure 59).
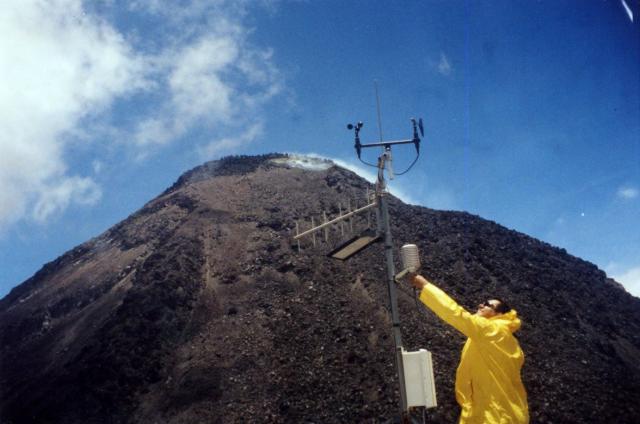 |
Figure 59. Alejandro Elizalde repairing the meteorological station located on El Volcancito dome. Volcancito sits ~1 km NE of Volcán de Colima's active summit dome, which can be seen capping the summit in the background. Photo taken by J.C. Gavilanes-Ruiz. Courtesy Universidad de Colima and Instituto de Geofísica. |
Ascent to the dome, 29 June 2002. Varley and Gavilanes remained on the N (figure 60), NE, and E borders of the active dome during 1147-1540. On the NE and N borders they measured angular heights and distances between the crater's lip and the upper part of the new dome borders. Only a small volume of lava blocks was observed to have fallen outside of the crater rim on the N border, extending only 4 m. No rockfalls were observed. The team tried to reach the center of the dome, but the complicated array of big scoriaceous and fragile new lava blocks, with abundant 3-to 7-m-deep void spaces between them (figure 61), impeded movement. They measured temperatures at the N fumarole field (table 14) and obtained a condensate gas sample. They also saw and/or heard several short-lived and high-pressure emissions of volcanic gas (table 15).
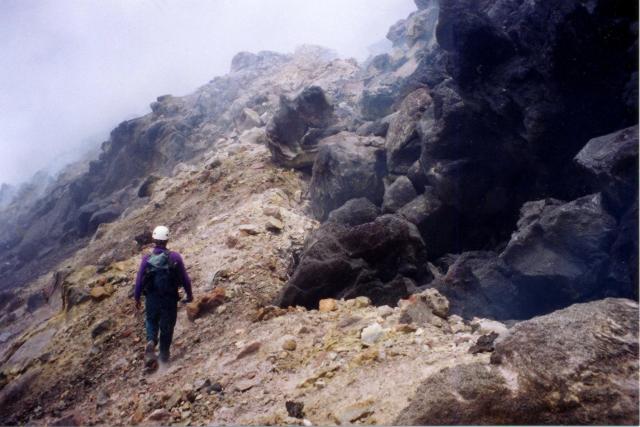 |
Figure 60. Photo on 29 June 2002 showing Nick Varley walking adjacent to the crater's N rim. The dark blocks of lava (on the right) represent loose debris that has fallen from the active dome. Photo taken by J.C. Gavilanes-Ruiz. Courtesy Universidad de Colima and Instituto de Geofísica. |
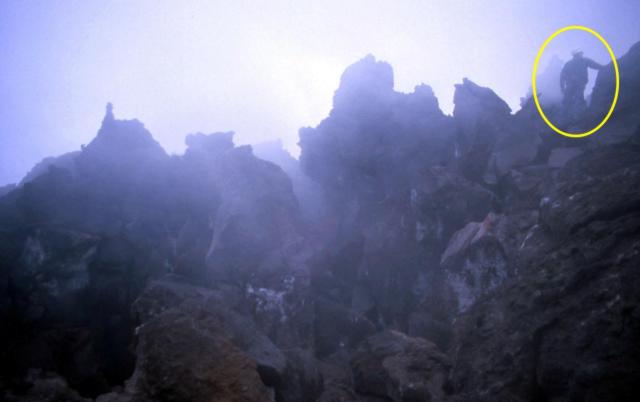 |
Figure 61. Photo on 29 June 2002 showing J.C. Gavilanes-Ruiz (enclosed by the circle) walking on the NE border of the active dome. Photo taken by Nick Varley. Courtesy Universidad de Colima and Instituto de Geofísica. |
Table 15. High-pressure emissions of volcanic gas at Colima on 29 June 2002. Courtesy Universidad de Colima and Instituto de Geofísica.
| Date | Time | Observations |
| 29 June 2002 | 1252 | Observed and heard at 40 m (white/bluish gas discharges ~30 m high) |
| 29 June 2002 | 1420 | Observed and heard at 50 m (white/bluish gas discharges ~30 m high) |
| 29 June 2002 | 1520 | Heard at 250 m |
| 29 June 2002 | 1603 | Heard at 250 m |
| 29 June 2002 | 1857 | Heard at 1,800 m |
Petrographical and chemical analyses were conducted on recent rock samples from Volcán de Colima at the Instituto de Geofísica, UNAM. The results were compared with similar analyses reported by Mora et al. (2002) from the 1998, 1999, and 2001 samples (table 16).
Table 16. Chemical composition of Colima lava. Numbers in parentheses correspond to the sample numbers in table 12. Fe2O3t = Fe total (except 1913). References: 1Mora et al. (2002), 2Luhr and Carmichael (1982). New data courtesy Universidad de Colima and Instituto de Geofísica.
| Sample/wt. % | 1818 | 1818 | 18182 | 19132 | 19981 | 19981 | 19991 | 19991 | 20001 | 2001 (1) | 2001 (2) | 2001 (3) | 2002 (A) | 2002 (4) | 2002 (5) |
| SiO2 | 58.71 | 57.70 | 58.52 | 57.57 | 60.44 | 61.00 | 60.59 | 59.83 | 60.77 | 59.53 | 59.81 | 59.60 | 60.67 | 59.10 | 59.70 |
| TiO2 | 0.66 | 0.79 | 0.83 | 0.79 | 0.62 | 0.55 | 0.64 | 0.63 | 0.61 | 0.63 | 0.64 | 0.64 | 0.61 | 0.64 | 0.64 |
| Al2O3 | 17.88 | 17.71 | 17.53 | 17.42 | 18.10 | 18.06 | 18.29 | 18.83 | 18.08 | 16.84 | 17.14 | 16.90 | 17.23 | 17.01 | 17.32 |
| Fe2O3t | 6.25 | 6.78 | 6.89 | 2.64 | 5.28 | 4.91 | 5.09 | 5.99 | 5.85 | 6.14 | 6.08 | 6.31 | 5.83 | 6.20 | 6.07 |
| FeO | -- | -- | -- | 3.74 | -- | -- | -- | -- | -- | -- | -- | -- | -- | -- | -- |
| MnO | 0.11 | 0.12 | 0.12 | 0.12 | 0.10 | 0.09 | 0.08 | 0.11 | 0.11 | 0.11 | 0.11 | 0.11 | 0.11 | 0.11 | 0.11 |
| MgO | 3.82 | 4.26 | 3.77 | 4.14 | 3.22 | 3.42 | 3.07 | 3.70 | 2.54 | 4.13 | 3.96 | 4.60 | 2.91 | 4.35 | 3.99 |
| CaO | 6.54 | 6.96 | 7.11 | 7.02 | 6.04 | 5.88 | 6.56 | 6.33 | 6.16 | 6.18 | 6.23 | 6.22 | 5.76 | 6.26 | 6.13 |
| Na2O | 4.50 | 4.49 | 4.46 | 4.40 | 4.69 | 4.56 | 4.53 | 4.68 | 4.47 | 4.53 | 4.56 | 4.43 | 4.72 | 4.51 | 4.59 |
| K2O | 1.22 | 1.32 | 1.23 | 1.16 | 1.35 | 1.37 | 1.12 | 1.31 | 1.28 | 1.30 | 1.27 | 1.29 | 1.36 | 1.29 | 1.38 |
| P2O5 | 0.19 | 0.24 | 0.20 | 0.19 | 0.13 | 0.12 | 0.18 | 0.20 | 0.13 | 0.20 | 0.20 | 0.19 | 0.23 | 0.19 | 0.19 |
| LOI | 0.19 | -0.03 | -- | 0.49 | 0.34 | 0.36 | 0.12 | 0.16 | 0.41 | -0.25 | -0.24 | -0.12 | -0.04 | 0.04 | 0.02 |
| Total | 100.07 | 100.34 | 101.66 | 99.68 | 100.31 | 100.32 | 100.27 | 100.77 | 100.91 | 99.34 | 99.76 | 100.17 | 99.39 | 99.70 | 100.14 |
Chemical analyses indicated that the new rocks registered a slight decrease in SiO2 and Al2O3 contents, and a slight increase in MgO with respect to the 1998 samples. Trace elements registered a decrease of Ba, and increases of Cu, Cr, and Ni (table 16).
Chemical analyses of rocks from 1818 to 2002 eruptions (Luhr, J.F. and Carmichael, I.S.E., 1982; Mora et al. 2002), show maximum variations of ~4 wt.% SiO2 (57 to 61 wt.%), and ~1.6 wt.% MgO (3.0 to 4.6 wt.%). The most mafic compositions were recorded in the products of the largest explosive eruptions (1818 and 1913). Notable disequilibrium textures observed in phenocrysts, as well as the shift to less evolved compositions in the new dome (2002 samples) with respect to the 1998 eruptive products may indicate an input of magma from a deeper chamber or an injection of new magma into the more shallow magma chamber. Therefore, we think that these detailed petrographic and chemical studies of the more recent eruptive products may provide valuable information for the monitoring of this volcano.
References. Luhr, J.F., and Carmichael, I.S.E., 1982, The Colima Volcanic Complex, Mexico: Part III, Ash and scoria-fall deposits from the upper slopes of Volcán Colima: Contrib. Mineral. Petrol., v. 80, p. 262-275.
Mora, J.C., Macías, J.L., Saucedo, R., Orlando A., Manetti, P., and Vaselli, O., 2002, Petrology of the 1998-2000 products of Volcán de Colima, Mexico: Accepted in the Special Issue of the Journal of Volcanology and Geothermal Research "Volcán de Colima, México, and its Activity in 1997-2000" (in press).
Information Contacts: N. Varley, J. C. Gavilanes-Ruiz, Facultad de Ciencias and Centro Universitario de Investigaciones en Ciencias del Ambiente, Universidad de Colima; J.C. Mora, J.L. Macias, R. Castro, R. Arias, Instituto de Geofísica, UNAM.
New lava flows emitted during February through at least December 2002
New lava flows began at Colima on 14 February 2002 (BGVN 27:05). The lavas traveled from the central crater proceeding down the SW flank until May (areas 1 and 2 on figure 62). During June-December 2002, three small lava flows developed (areas 3-5 on figure 62). The latter three flows were first noted on 21 June; the mean rate of lava emission was very low, ~0.1 m3/s. Flow 3 stopped on 12 July; flows 4 and 5 continued their activity into at least mid-December. Pulses of higher lava emission occurred during the eruption of flows 4 and 5 (19 July and 10 November 2002, respectively).
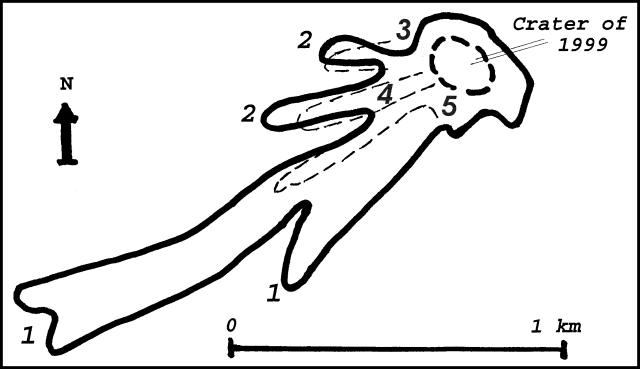 |
Figure 62. Sketch of the February-December 2002 lava flows (1-5) on Colima's SW flanks. Three new lava flows (3-5) are shown by dashed lines. Courtesy of Observatorio Vulcanológico de la Universidad de Colima. |
Seismicity varied significantly during January-December 2002 (figure 63). June-December pulses in emission and lava-flow velocity were associated with numerous rockfalls and elevated seismicity. Periods of elevated seismicity and lava emission took place on 14 February (pulse I), 21 June (II), 19 July (III), and 10 November (IV).
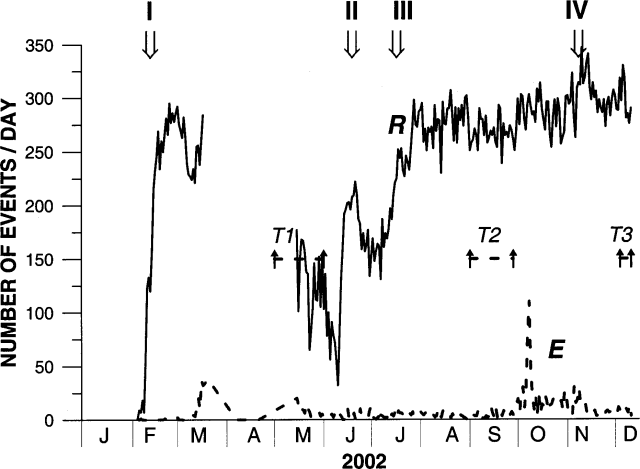 |
Figure 63. Colima's inferred daily number of rockfalls and pyroclastic flows (upper curves, labeled R) and small explosions (lower curve, dashed and labeled E). Both these estimates were based on seismic data received 1.7 km from the crater (at station Soma). Strong seismic noise occurred during 18 March to 14 May, preventing accurate rockfall estimation. Arrows with Roman numerals (I-IV) identify pulses in seismicity and lava emission. Intervals labeled T1-T3 indicate periods when tremor continued 12 to 24 hours per day. Courtesy of Observatorio Vulcanológico de la Universidad de Colima. |
With the appearance of lava flows on 21 June, the number of rockfalls sharply increased, and then stabilized at 250-300 per day after the July pulse (lava pulse III). The June-December stage of the eruption was accompanied by numerous small gas explosions and periods of low-amplitude volcanic tremor. Tremor episodes lasting 12-24 hours/day are marked as T2 and T3 on figure 63. These tremor episodes were not associated with observable changes in volcanic activity.
Information Contacts: Observatorio Vulcanológico de la Universidad de Colima, Colima, Col., 28045, México.
Year-long eruption ended in late February 2003 after eight lava flows
Effusive activity that began at Colima on 14 February 2002 (BGVN 27:05 and 27:11) had stopped by the end of February 2003. Eight lava flows were emitted during this eruption (figure 64). The total volume of effusive material was calculated to be ~8.3 x 10⁶ m3. That number includes the lava dome (2 x 10⁶ m3) and lava flows (4.3 x 10⁶ m3), in addition to pyroclastic-flow and rockfalls deposits (2 x 10⁶ m3). A plot showing the daily number of rockfalls reflects the level of activity over the course of the eruption (figure 65).
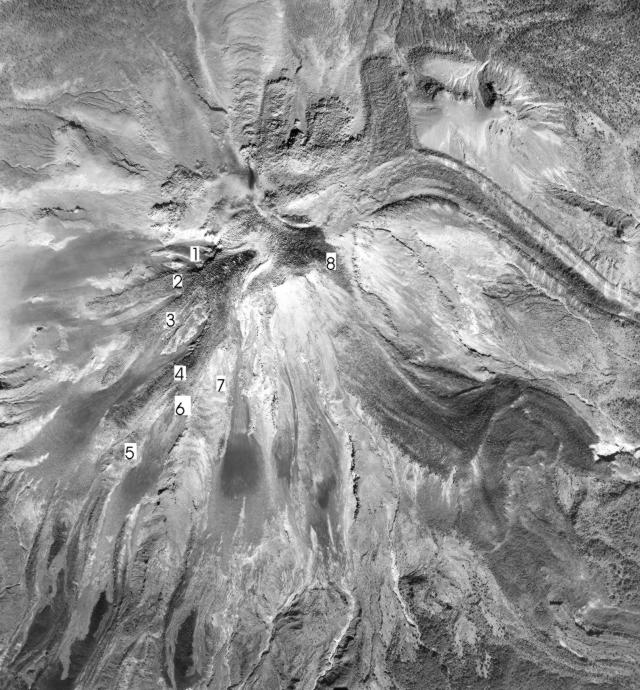 |
Figure 64. Aerial photo of Colima taken from an airplane on 23 January 2003. Numbers mark the eight new lava flows emplaced during the February 2002-February 2003 eruption. Courtesy of Instituto Nacional de Estadística Geografía e Informática (INEGI). |
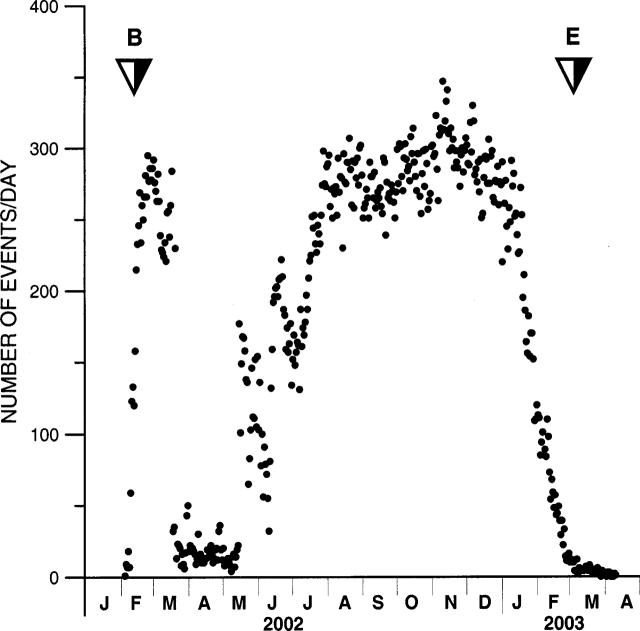 |
Figure 65. Daily variations in the number of rockfalls during the 2002-2003 effusive eruption at Colima volcano. The beginning (B) and the end (E) of effusive activity are shown by arrows. Courtesy of Observatorio Vulcanológico de la Universidad de Colima. |
Weak gas explosions occurred in March 2003. As of April there were still observations of night glow at the summit, degassing, and 10-20 daily seismic events. However, no deformation had been noted.
Information Contacts: Observatorio Vulcanológico de la Universidad de Colima, Colima, Col., 28045, México (URL: https://portal.ucol.mx/cueiv/).
Small explosions produced, including two on 17 July; absence of lava flows
Explosive activity at Colima continued in May and July 2003. A small explosive eruption reported at 1024 on 2 May 2003 produced an ash cloud visible on satellite imagery and monitoring cameras, but rising to no more than 500 m above the crater. The Mexico City Meteorological Watch Office stated that the plume moved SW of the summit at 5-10 knots (9-18 km/hour). The Washington VAAC described the plume as very small.
Nick Varley pointed out on 18 May that the GVP / USGS Weekly Volcanic Activity Report for 7-13 May 2003 incorrectly reported lava flows at Colima. He noted that "No lava has been produced since the beginning of March [2003]. The current activity comprises small explosions, on average some 25 per day, some containing ash. The dispersal of the ash is limited to approximately 7 km from the summit."
More significant explosions were reported on 17 July 2003. The first, at 0527, threw incandescent material 500 m high and an ash column to ~3 km height that blew SW . Small forest fires caused by the incandescent material 2.5-4 km SW of the crater suggested that the explosion was also directed to this sector. An explosion at 1400 on 17 July, produced an ash-laden cloud 1,000 m high, again dispersing SW. The seismic energy released by the 0527 explosion was reported to be less than half that released in the 1999 explosions.
Information Contacts: Observatorio Vulcanologico de la Universidad de Colima, Colima, Col., 28045, México (URL: https://portal.ucol.mx/cueiv/); Nick Varley, Facultad de Ciencias, Universidad de Colima Av. 25 de Julio 965, Col. San Sebastian Apdo. postal 25, Colima, CP 28045, México.
Explosions in July and August generate pyroclastic flows and create a new summit crater
In February 2003 lava emission at Colima ceased, ending an earlier eruptive stage (BGVN 28:06); after the termination of lava emission a new eruptive stage began. A series of small explosions during March-June was followed by the explosion on 17 July 2003 (BGVN 28:07), the first of three large explosions in July and August. The 17 July explosion sent blocks up to 500 m and an ash column higher than 3,000 m. The explosion was accompanied by five pyroclastic flows with runout distances up to 2 km on the W-SW slopes of the volcano (figure 66).
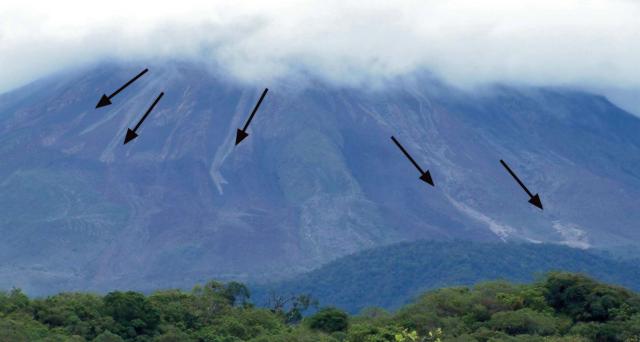 |
Figure 66. Photo of the WSW flank of Colima showing the paths of pyroclastic flows that followed the 17 July 2003 explosion. Arrows mark five of the pyroclastic-flow deposits. Courtesy of Colima Volcano Observatory. |
The second large explosion was recorded on 2 August at 1541. The Washington VAAC reported a plume to ~7.6 km altitude. The third large explosion occurred on 28 August at 2352 and produced an ash column at least 3 km high with ashfall up to 60 km W-NW of the volcano. The explosion was accompanied by pyroclastic flows out to 2.5 km, covering the majority of the volcano's flanks; the total deposit volume was about 244,000 m3.
As a result of this explosion sequence, a new crater 200 m across and 30 m deep formed at the summit (figure 67). About 2 x 10⁶ m3 of the material of the former lava dome was ejected as volcanic bombs and projectiles out to distances of ~1.0-2.5 km. The seismic energy released during these three large explosions was lower than during the 1999 explosions (BGVN 24:01).
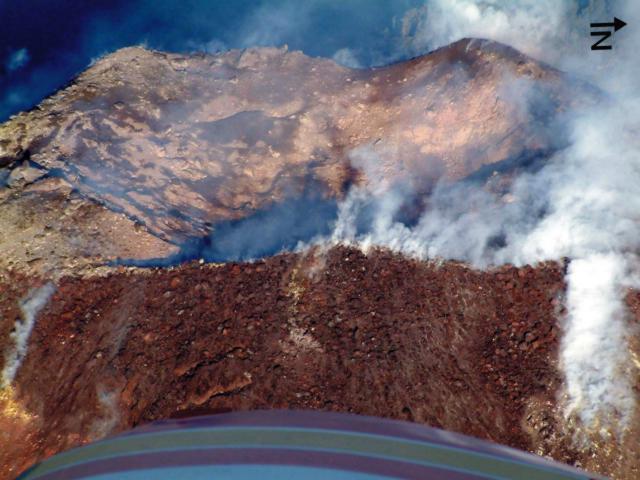 |
Figure 67. A view of Colima's new crater on 30 August 2003, a result of an explosive sequence that began on 17 July 2003. The airplane wing can be seen in the foreground. Courtesy of Colima Volcano Observatory. |
Information Contacts: Observatorio Vulcanológico de la Universidad de Colima, Colima, Col., 28045, México (URL: https://portal.ucol.mx/cueiv/).
Multiple daily ash emissions during September-December
As previously reported (BGVN 28:08) a new crater formed at the summit following large explosions in July and August 2003. Smaller ash-bearing eruptions continued during September-December 2003.
On 6 September a strong ash emission resulted in an ash cloud that rose to ~6.7 km and drifted N. Ash was not visible on satellite imagery, but a second ash emission on 8 September was visible on the Colima video camera. Into early October, volcanic activity consisted of an average of two explosions per day, producing ash clouds that rose ~2 km above the crater and drifted predominately W. Tropical storm Olaf inundated the Colima area on 7 October, dropping 150 mm of rain in less than 2 hours. The heavy rain mixed with material on the S flank, producing a lahar down the Montegrande ravine. On 9 and 10 October ash clouds were visible on satellite imagery rising to a maximum of ~5 km above the volcano.
On 16 October ash rose to a height of ~6 km; a second plume followed on 18 October, rising to ~7.3 km. Neither plume was visible on satellite imagery. Two small eruptions consisting mainly of steam and some ash on 30 October rose to ~7.3 km altitude and mainly drifted W.
A subtle ash plume, visible in satellite imagery, was emitted on 18 November and rose to ~5.5 km altitude. On 1 and 2 December, ash clouds were visible on satellite imagery at a maximum altitude of ~7 km. As of 12 December, the volcano continued with an average of three explosions a day, usually to 2 to 3 km above the crater. The majority of these explosions have produced ash that drifted toward the ENE. The most significant of these early December explosions occurred early on 11 December, when materials descended the SE, NE, and N flanks, and ashfall was reported in the town of Guzman (25 km NE of Colima volcano).
Information Contacts: Observatorio Vulcanológico de la Universidad de Colima, Colima, Col., 28045, México (URL: https://portal.ucol.mx/cueiv/); Washington Volcanic Ash Advisory Center (VAAC), Satellite Analysis Branch (SAB), NOAA/NESDIS E/SP23, NOAA Science Center Room 401, 5200 Auth Road, Camp Springs, MD 20746, USA (URL: http://www.ospo.noaa.gov/Products/atmosphere/vaac/).
Small explosions reamed out the former dome but left surrounding center intact
A March 2004 observatory report noted that one year of explosive activity had passed, an interval that began in February 2003 after the termination of lava emission (BGVN 28:06). During March-May 2003 there was an increase in the number of small explosions. During the year, seismometers recorded ~ 1,500 small explosions (figure 68). After that, the frequency of explosions became stable, with 3-5 daily explosions (figures 69 and 70). Four relatively significant explosions occurred during 2003 on 17 July, on 2 and 28 August (BGVN 28:08), and on 15 November, although there was no change in the daily number of events.
 |
Figure 68. Daily variations in the number of small explosions recorded by the seismic network Red Sismica de Colima (RESCO) of Colima University from January 2003 to February 2004. The termination of the effusive stage is shown by the open arrow; four significant explosions are shown by filled arrows. Courtesy of Colima Volcano Observatory. |
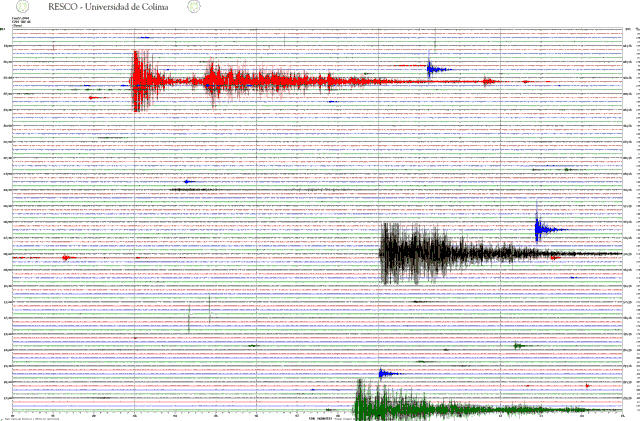 |
Figure 69. A typical daily seismogram with the records of small explosions (27 February 2004). RESCO seismic station Soma, at a distance of about 1.7 km from the crater. Courtesy of Colima Volcano Observatory. |
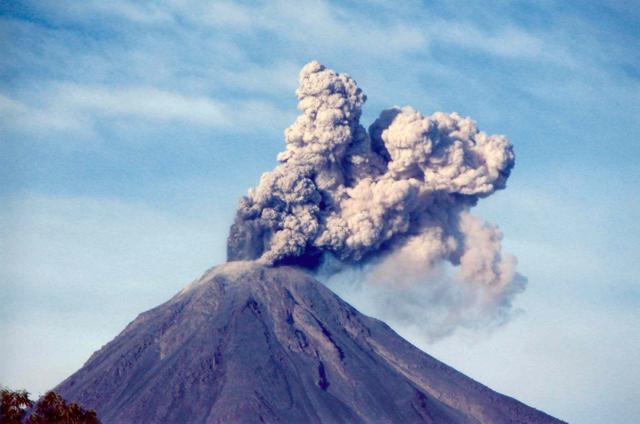 |
Figure 70. A typical view of a small explosion at Colima. Photo was taken on 1 February 2004. Courtesy of Colima Volcano Observatory. |
The sequence of explosions destroyed the former lava dome. Although the depth of the crater floor increased slightly as a result, the crater's dimensions changed little (figure 71).
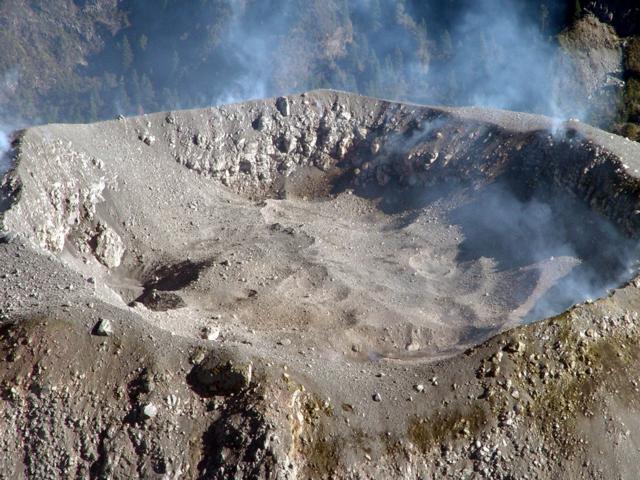 |
Figure 71. A view of Colima's crater floor from the S, taken on 27 February 2004. Courtesy of Colima Volcano Observatory. |
A later observatory report also noted that a significant explosion took place at 1228 on 12 June 2004. During preceding days, the volcano continued to show low-intensity activity, with an average of under three ash explosions per day. The heights of the columns did not exceed 2,000 m above the crater; they blew mainly to the W.
The exclusionary zone for both States adjoining Colima volcano remained 6.5 km from the summit. Also, the alert radius covered distances of up to 11.5 km from the summit, in order to include residents of Causentla, Cofradia de Tonila, Atenguillo, El Saucillo, El Fresnal, and El Embudo. Warnings to avoid lingering were also applied to the valleys of La Lumbre, El Cordobán, San Antonio and Monte Grande, El Muerto, La Tuna, Santa Ana, El Cafecito, La Arena, and Beltrán-Duranzno.
The Washington Volcanic Ash Advisory Center (VAAC) for aviation safety issued many reports ("Volcanic Ash Advisories") for Colima during 2003 and 2004, including over 30 during 2004. The bulk of the 2004 reports came out in February, March, April, and as recently as 14 May; no reports were issued since then to the late June date of this Bulletin. A sampling of the 2004 VAAC reports and associated graphics indicated several plumes to over 6 km altitude had been seen via satellite.
Information Contacts: Observatorio Vulcanológico de la Universidad de Colima, Colima, Col., 28045, México; Washington Volcanic Ash Advisory Center (VAAC), NOAA-NESDES, Satellite Analysis Branch, 5200 Auth Road, Camp Springs, Maryland 20746 USA.
Block-lava escapes starting in September 2004 getting well down N flank by October
New emissions of block-lava flows began on 30 September 2004 after 19 months of intermittent explosive activity. During February 2002-February 2003 the lava dome extruded effusively, but it was destroyed by the July-August 2003 explosions (BGVN 28:06 and 29:05). Thus, beginning in September 2003 the upper crater lacked a visible dome.
The new lava effusions that began on 30 September took place without either premonitory swarms of volcano-tectonic earthquakes or significant deformation of the volcanic edifice. A 6-hour episode of volcanic tremors was observed on 20 September (figures 72 and 73).
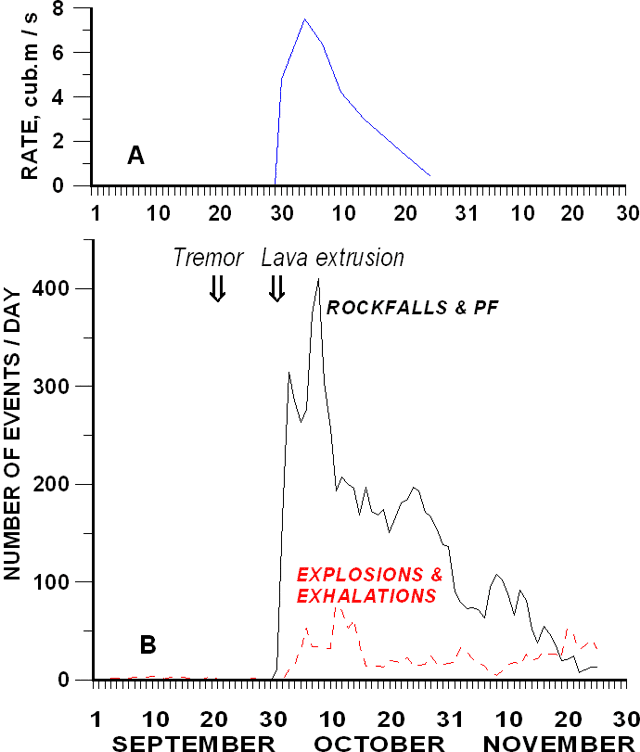 |
Figure 72. Plots of Colima activity during September-November 2004: (A) Lava emission rate; and (B) Number of earthquakes produced by rockfalls and pyroclastic flows (PF) (heavy line) and by explosions and exhalations (dashed line). Arrows show the tremor episode and the start of the eruption. Courtesy of Colima Volcano Observatory. |
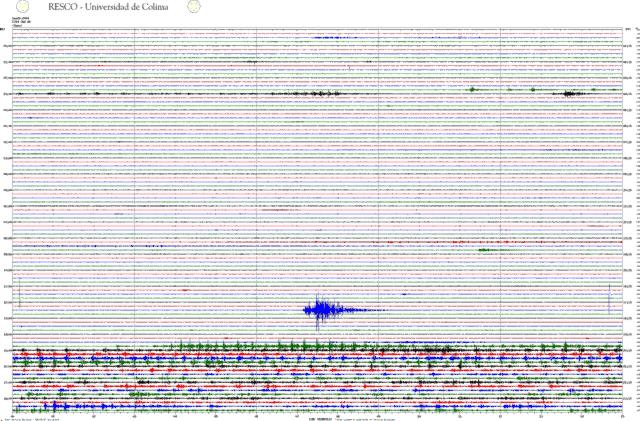 |
Figure 73. Seismic record showing the start of the tremor episode (towards the bottom) as registered at station EZV4 situated at a distance of 1.4 km from the crater. Courtesy of Colima Volcano Observatory. |
On 28 September, intensive fumarolic activity began in the crater, forming a 500-m-high column of white gas. An overflight that day permitted observation of a new lava extrusion that practically filled the crater. An intensive swarm of seismic events produced by rockfalls and pyroclastic flows began at about 0600 on 30 September. The seismic events indicated the overflow of lava from the crater and heralded the formation of two andesitic block-lava flows. These flows began to develop along Colima's N and WNW slopes.
During October and November, lava emission continued at a decreasing rate (figure 72). The lava emissions were effusive and accompanied by frequent small explosions and exhalations. Numerous block-and-ash flows extended ~ 4.5 km from the summit (figure 74). Seismic intensity closely tracked with variations in the lava emission rate.
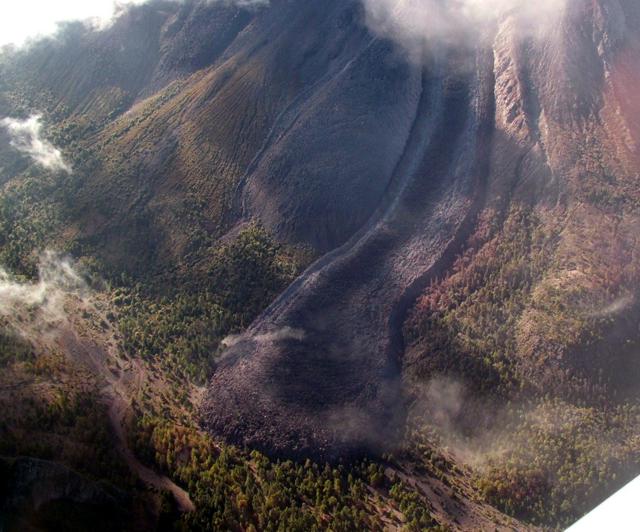 |
Figure 74. An oblique aerial photo showing a new lobe of blocky lava emplaced on Colima's N flank. Photo was taken on 27 October 2004. Courtesy of Colima Volcano Observatory. |
By 1 December, the two lava flows stretched ~ 2,400 m long and ~ 300 m wide on the N flanks, and ~ 600 m long and 200 m wide on the WNW flanks (figure 14). The total volume of erupted material including lava and pyroclastic-flow deposits was ~ 8.3 x 10⁶ m3.
Information Contacts: Observatorio Vulcanológico de la Universidad de Colima, Colima, Col., 28045, México.
Lava flows up to 2.4 km long; March 2005 explosions; collapse on summit
The recent extrusion of block-lava that began on 30 September 2004 continued through November 2004. Lava flows formed on the N and WNW flanks, with the respective dimensions ~ 2,400 m long by ~ 300 m wide, and ~ 600 m long by ~ 200 m wide. The total volume of erupted material, including lava and pyroclastic flows, was about 8.3 x 10⁶ m3 (BGVN 30:01). The termination of lava effusion was followed by intermittent explosive activity represented mainly by small gas-and-ash Vulcanian explosions. Their number gradually decreased during December 2004-March 2005 (figure 75).
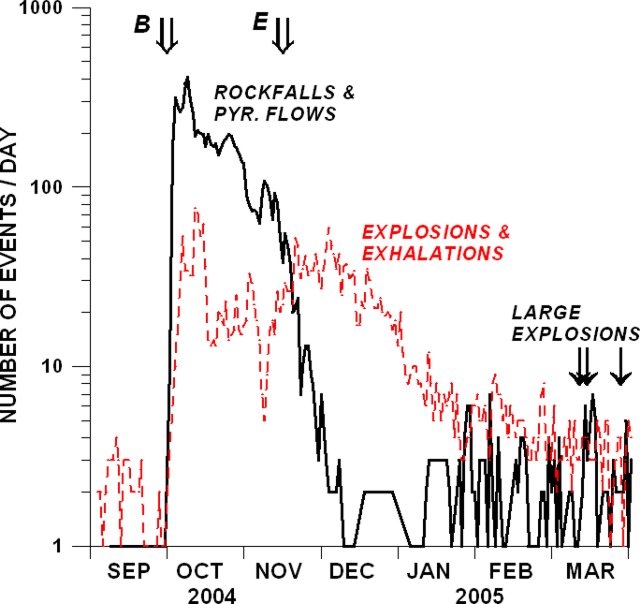 |
Figure 75. Eruptive activity of at Colima during September 2004-March 2005. The variations in the number of earthquakes produced by rockfalls and pyroclastic flows (heavy line) and by explosions and exhalations (dashed line) are shown. Double arrows show the beginning (B) and the end (E) of lava extrusion; three single arrows indicate the explosions of 10, 13, and 26 March. Courtesy of Colima Volcano Observatory. |
Three relatively large explosions occurred in March (on the 10th, the 13th, and the 26th). Those of 10 and 13 March formed eruptive columns with heights of ~ 5 km above the crater and were accompanied by pyroclastic flows down the S flank. The lengths of associated pyroclastic flows did not exceed 2.8 km. The largest explosion to take place on 13 March generated fallout that included lapilli with a diameter of up to 2 cm. Ash fell at a distance of 12.5 km to the NE of the volcano (in the village of Los Mazos, Jalisco).
Scientists made E-W topographic profiles on 12 October 2004 and 18 March 2005 (figure 76). The profiles crossed an area on the summit's S flank. They disclosed that during this intervening interval there had been a collapse over an area of ~ 2,500 m2.
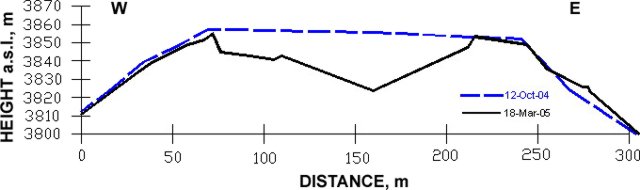 |
Figure 76. Two topographic profiles across the summit of Colima from the S flank made on 12 October 2004 and 18 March 2005. Courtesy of Colima Volcano Observatory. |
Information Contacts: Observatorio Vulcanológico de la Universidad de Colima, Colima, Col., 28045, México (URL: https://portal.ucol.mx/cueiv/).
Explosions through June 2005, with repeated dome growth and destruction
Small to moderate explosive eruptions have been common at Colima since 1999, some blasting material as high as 11 km altitude and at times sending pyroclastic flows to 5 km runout distances. Between these explosive eruptions, andesitic lava from the main intracrater vent sometimes formed small, short-lived lava domes. The feeder lavas, cryptodomes, and occasional domes were blasted out during subsequent eruptions. A table of significant eruptive events at Colima during July 1999 to June 2005 (Luhr and others, in press) produced this tally for the number of days where plumes went over 2 km above the summit (~6 km altitude): in the latter half of 1999, three days; 2000, one day; 2001, four days; 2002, four days; 2003, 15 days; 2004, ~ 24 days; and in the first half of 2005, 31 days. Eruptions discussed in aviation reports from the Washington Volcanic Ash Advisory Center (VAAC) became a significant source of data starting in 2003, and formed the basis of many entries in the subsequent years.
Extrusions during September-November 2004 formed a new lava dome in the active crater, and two lava flows descended from that crater along the N and WNW flanks (BGVN 30:01). After lava effusion ceased, intermittent explosions and exhalations followed. In the same pattern mentioned above, the dome was later destroyed by Vulcanian-style explosions that produced eruption plumes and in some cases, pyroclastic flows (BGVN 30:03).
The number of seismic events decreased during December 2004-February 2005 (figure 77), and with some important exceptions, remained under 10 events per day until as late as the end of June 2005. During this reporting interval, April-June 2005, intermittent explosions continued (figure 77). Explosions that generated pyroclastic flows were known to have continued through at least 5 July.
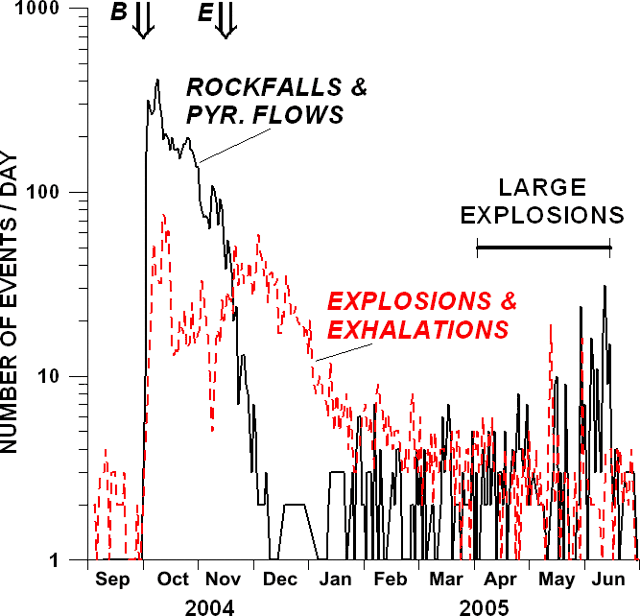 |
Figure 77. The number of daily earthquakes ascribed to rockfalls and pyroclastic flows (heavy line) and to explosions and exhalations (dashed line) at Colima during September 2004-June 2005. Double arrows show the beginning (B) and the end (E) of the lava extrusion in late 2004. A label indicates the period when occasional large explosions took place (an interval that began on 10 March and continued through June 2005). Courtesy of Colima Volcano Observatory. |
Comparatively large explosions began to occur starting 10 March 2005 (BGVN 30:03). The largest, accompanied by pyroclastic flows, were particularly vigorous from 24 May to 5 June. As in March 2004 the explosions consisted of Vulcanian-style gas-and-ash explosions. Some of the April-June explosions issued material that reached as high as ~ 10 km altitude, and pyroclastic flow runout distances reached up to ~ 5.1 km, an increase over those in March 2004 (when maximum runout distances only reached ~ 2.8 km).
When photographed on 25 May 2005 the dome and unconsolidated material filled much of the crater, although the intracrater area was anything but flat (figure 78). By comparison, a photo of the crater taken on 16 June 2005, following many large Vulcanian explosions, shows its upper portion to be essentially empty (figure 79).
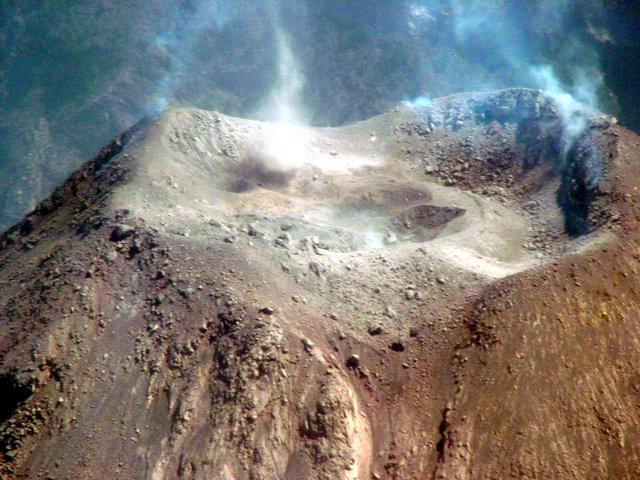 |
Figure 78. At Colima on 25 May 2005 the crater contained considerable dome and unconsolidated material, filling it to near the rim. Several weeks later, after further explosions had driven considerable material out, the upper crater was left with substantial open space (see next photo). Courtesy of Colima Volcano Observatory. |
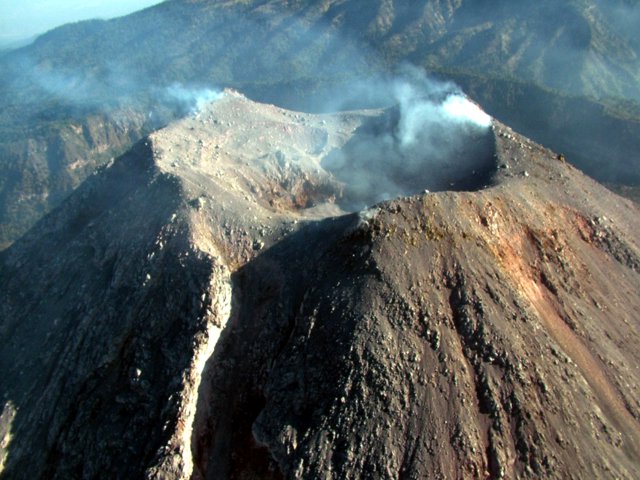 |
Figure 79. Photo of Colima's crater after the comparatively large explosions that began in March 2005. This photo was taken on 16 June looking from the S. Eruptions had removed much of the crater fill and a small dome from the upper crater. Small impact craters pocked the crater floor. An erosion channel had developed across crater's S rim, presumably due to the passage of pyroclastic flows associated with the recent explosions. The notch in the rim has been prominent since 2004 and has emptied and perhaps grown considerably since the photo taken 25 May 2005. Despite the changes seen in this photo, the explosions had left the crater walls intact and without evidence of fractures. Courtesy of Colima Volcano Observatory. |
The March-June explosive sequence removed the 2004 lava dome, and left a crater ~ 260 m across and ~ 30 m deep (figure 79). No significant deformation of the volcanic edifice was recorded before or during the large explosions (table 17). After the explosion of 5 June, residents were evacuated from Juan Barragán, a small village ~ 10 km SE of the summit. Smaller explosions at Colima typically take place at the rate of several per day.
Table 17. Main characteristics of the largest explosions seen at Colima during May-June 2005. Column heights and ash cloud velocities came from remote-sensing data and reports furnished by the Washington VAAC. The highest velocity, 15 m/s, corresponds to 54 km/hour. Courtesy of Colima Volcano Observatory.
| Date | Time (UTC) | Altitude of the column | Direction and average horizontal velocity of plume | Length of plume | Length of pyroclastic flows |
| 24 May 2005 | 0009 | 9.7 km | W (7.7 m/s) | 204 km | 3.5 km |
| 30 May 2005 | 0826 | 8.5 km | SE (15 m/s) | 102 km | 4 km |
| 02 Jun 2005 | 0449 | 6 km | S (5.1 m/s) | 74 km | 4.5 km |
| 05 Jun 2005 | 1920 | 7.6 km | W-SE (7.7 m/s) | 222 km | 5.1 km |
Reference. Luhr, J., Navarro-Ochoa, C., and Savov, I., (in press), Petrology and mineralogy of lava and ash erupted from Volcán Colima, México, during 1999-2005: Special Volume on the Colima Volcano, from the University of Guadalajara (edited by Francisco Nuñez-Cornú).
Information Contacts: Observatorio Vulcanológico de la Universidad de Colima, Colima, Col., 28045, México; Washington Volcanic Ash Advisory Center (VAAC), NOAA-NESDES, Satellite Analysis Branch, 5200 Auth Road, Camp Springs, MD 20746, USA.
Continued ash emission, including some high level ash plumes, since June 2005
Eruptive activity has continued at Colima from July 2005 through February 2006. Explosions that generated ash plumes were common during this period.
The Colima Volcano Observatory reported that ash emission continued at Colima during 29 June 2005 to 5 July 2005 and several plumes rose to 9-10 km altitude. On 30 June, lahars traveled SW down La Lumbre Ravine and SSE down Montegrande Ravine to a maximum length of ~ 10 km. The lahars did not reach populated areas. Due to the presence of new ash on the flanks of the volcano, seasonal heavy rains, and the subsequent threat of lahars forming, Universidad de Colima advised avoiding the ravines of La Lumbre, San Antonio, Monte Grande (in Colima state), and La Arena (in Jalisco state) throughout this interval.
The Washington VAAC reported that the Colima video camera and satellite imagery confirmed an explosive eruption on 5 July at 1821 (figure 80). The Mexico City Meteorological Watch Office (MWO) reported that the resultant ash plume reached an altitude of ~ 9.1 km and drifted NW. Pyroclastic flows accompanying the eruption traveled down the E flank.
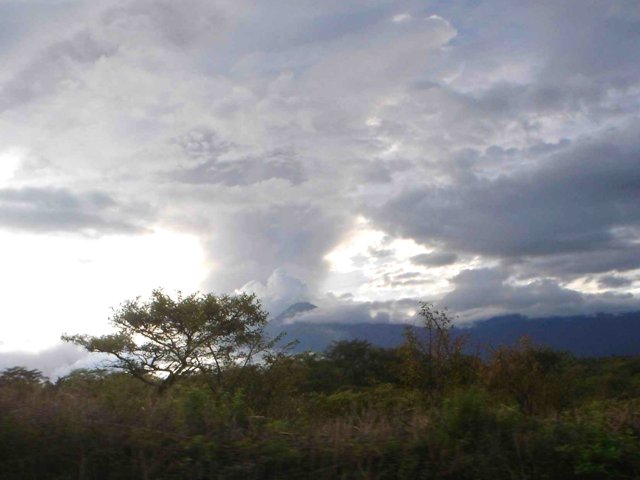 |
Figure 80. A photo of the explosive eruption on Colima on 5 July 2005 taken from the E. Courtesy of CVO. |
Several explosions continued during 6-19 July, and small landslides traveled down the volcano's flanks during 8-9 July and 15-18 July. On 21 and 23 July, small ash emissions and lahars occurred. On the 21st during 1750-1830 a lahar traveled SSE down the Monte Grande ravine. Emissions rose to a maximum altitude of 9.1 km on 27 July. During 29 July to 1 August, steam-and-ash emissions occurred at Colima. According to the Washington VAAC, the highest-rising emission reached 6.1 km altitude on 30 July.
On 4 August the Washington VAAC reported that the Mexico City MWO observed a steam plume rising to 7.2 km altitude in imagery seen on the Colima video camera. During15-31 August, small explosions produced low-level ash plumes. The largest events, on 21 and 22 August, produced plumes that drifted W. On 31 August a 45-minute seismic signal associated with a lahar was recorded at the Monte Grande station. The lahar caused no damage.
Throughout the month of September, several small explosions occurred at Colima. On 16 September at 1045 an explosion sent an ash plume to ~ 9.8 km altitude. The local civil defense agency stated in a news report that ash fell on towns NW of the volcano. Prior to the explosion, microseismicity was recorded for several days. Universidad de Colima reported that microseismicity often precedes significant explosions. On 27 September at 0507 an explosion produced a plume to a altitude of ~ 7.6 km altitude. The plume drifted WSW, depositing small amounts of ash in the cities of Colima, Villa de álvarez, and Comala. On 28 September another explosion sent an ash plume to an altitude of ~ 6.1 km altitude and drifted NNW.
Small explosions continued to occur from October through the end of February 2006 (the end of this report), and produced visible ash plumes. Several small explosions during 16-21 November 2005 produced steam-and-ash clouds to low levels above the volcano. Explosions on 12 December 2005 resulted in small amounts of ash deposited in areas SW of the volcano.
Information Contacts: Observatorio Vulcanológico de la Universidad de Colima, Colima, Col., 28045, México (URL: https://portal.ucol.mx/cueiv/); Washington Volcanic Ash Advisory Center (VAAC), Satellite Analysis Branch (SAB), NOAA/NESDIS E/SP23, NOAA Science Center Room 401, 5200 Auth Rd, Camp Springs, MD 20746, USA (URL: http://www.ospo.noaa.gov/Products/atmosphere/vaac/).
Small eruptions continue with dome growth and plumes
Eruptive activity between July 2005 and February 2006 included ash plumes up to 10 km in altitude, lahars to a length of about 10 km, pyroclastic flows, and landslides (BGVN 31:03). Periodic eruptions have continued through at least 1 November 2007, with resulting ash or ash-and-steam plumes, some of which reached an altitude of 6.1 km (6.7 km on 30 November 2006). Some plumes have been detected by satellite imagery.
During 21-27 March and 22-30 April 2007, incandescent material from Colima reached as high as 50-150 m above the summit. Information for this report was provided by the Washington Volcanic Ash Advisory Center (VAAC), based on the Mexico City Meteorological Watch Office (MWO), the Volcanological Observatory of Colima University, and satellite imagery.
In July and November 2006 and August 2007, State government officials warned that the threat of eruptions at Colima continued and that overflights without scientific or civil defense objectives were restricted. The officials also warned population to stay out of ravines near the volcano during the rainy season for fear of lahars.
According to the State government of Colima, on 16-17 November 2006, ashfall was reported in villages near the volcano, including Cuauhtémoc and Colima.
According to Vyacheslav Zobin, the period from October 2005 to January 2007 was characterized by small steam-and-ash Vulcanian explosions (figure 81). Beginning in January 2007, the small explosions increased in number, but decreased in both their energy and the total ash fraction. Zobin explained that this change marked the beginning of a new episode of lava dome growth in the crater (figure 82), first observed on 9 February 2007. Dome growth continued (figure 83) with a low mean effusion rate of about 0.01-0.03 m3/s during February-October 2007 and reached a volume of about 60,000-80,000 m3.
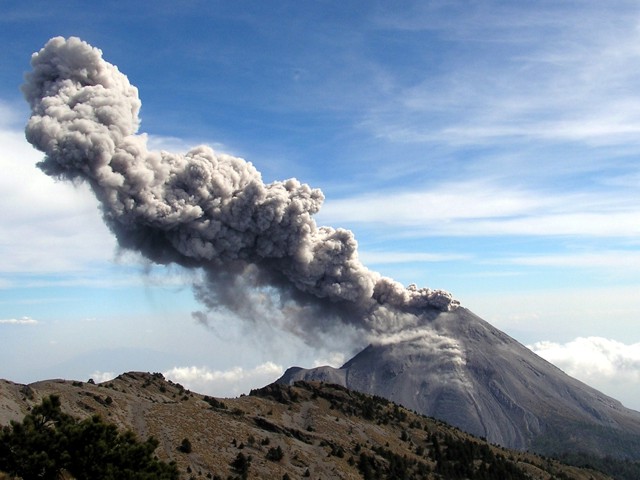 |
Figure 81. Photograph showing a typical Vulcanian explosion at Colima, 10 March 2007. Courtesy of Colima Volcano Observatory. |
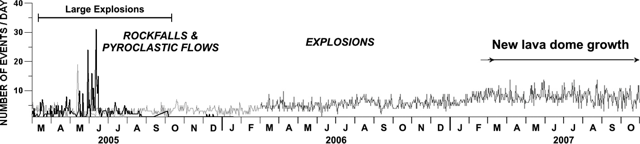 |
Figure 82. Number of seismic events per day at Colima during March 2006 to October 2007. A heavier line during 2005 indicates events caused by rockfalls and pyroclastic flows; the lighter line represents explosion earthquakes. Episodes of large explosions and lava doem growth are also noted. Courtesy of Colima Volcano Observatory. |
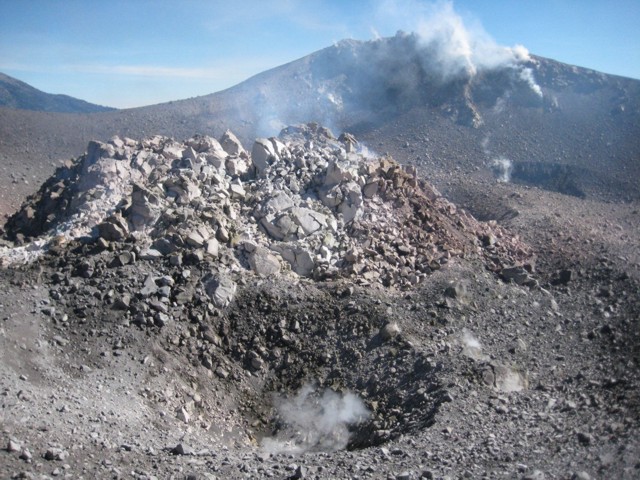 |
Figure 83. Photograph of a new lava dome in the crater at Colima, October 2007. Courtesy of Jeff Johnson, New Mexico Institute of Mining & Technology. |
Information Contacts: Vyacheslav Zobin, Observatorio Vulcanologico, Universidad de Colima, Av. Gonzalo Sandoval 444, Colima, Col. 28045, Mexico; Observatorio Vulcanológico de la Universidad de Colima, Colima, Col., 28045, México (URL: https://portal.ucol.mx/cueiv/); Washington Volcanic Ash Advisory Center (VAAC), Satellite Analysis Branch (SAB), NOAA/NESDIS E/SP23, NOAA Science Center Room 401, 5200 Auth Rd, Camp Springs, MD 20746, USA (URL: http://www.ospo.noaa.gov/Products/atmosphere/vaac/).
By 8 March 2008, the last year's dome growth filled ~30% of the crater
A new episode of lava dome growth in the crater was first observed on 1 February 2007 (figure 84). Dome growth continued during February-September, changing its volume from 15,000 m3 to 110,000 m3, with a low mean-effusion rate of about 0.0045 m3/s (figure 85).
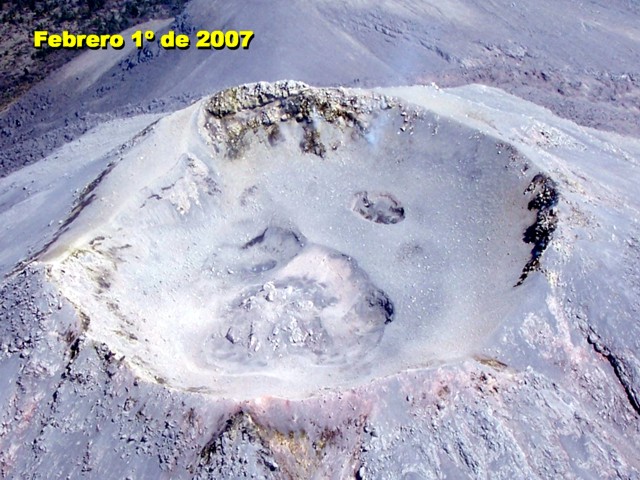 |
Figure 84. Photo of the dome at Colima looking NE, taken on 1 February 2007 by Jalisco Civil Protection. Courtesy of Jalisco Civil Protection and Colima Volcano Observatory. |
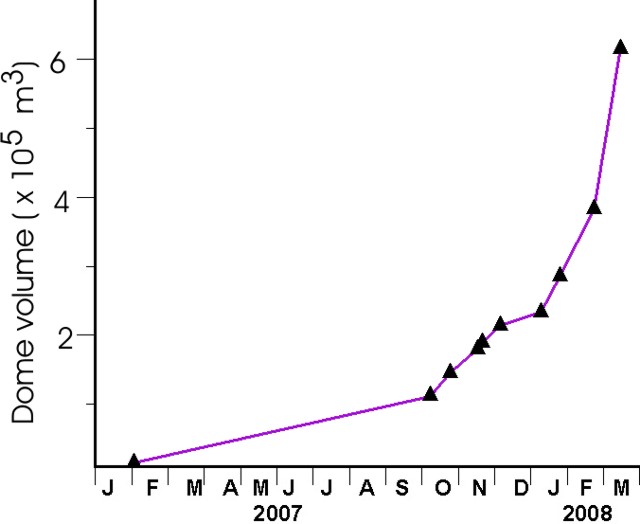 |
Figure 85. A plot portraying the dome growth rate at Colima during February 2007-8 March 2008. The data point in early February 2007 had a volume of 115,000 m3. Courtesy of Colima Volcano Observatory. |
During October 2007, Colima's effusion rate began to increase significantly (up to 0.033 m3/s) and on 8 March 2008 the dome's volume reached about 600,000 m3, filling ~ 30% of the crater (figure 86). This dome growth was accompanied by 3-5 small explosions daily.
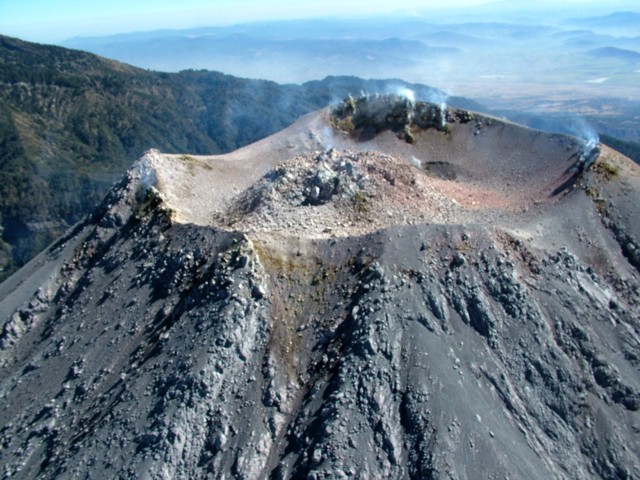 |
Figure 86. Photo of Colima's dome looking NE, taken on 8 March 2008 by Colima Volcano Observatory. Courtesy of Jalisco Civil Protection and Colima Volcano Observatory. |
Information Contacts: Observatorio Vulcanológico de la Universidad de Colima, Colima, Col., 28045, México (URL: https://portal.ucol.mx/cueiv/).
New dome growth during 2007 to November 2008
A new episode of lava dome growth in the crater was first observed on 1 February 2007 (BGVN 33:04). During its initial stage (February-September 2007), the mean effusion rate was about 0.004 m3/s. The rate of effusion increased significantly in October 2007, up to 0.033 m3/s.
New observations during overflights on 1 August and 8 November 2008 showed a significant increase in the dome volume (figure 87), reaching ~ 1,200,000 m3. The effusion rate during August-November 2008 increased up to 0.05 m3/s. By late November, the dome filled more than 50% of the crater and could be easily seen above the crater rim (figure 88). This dome growth has been accompanied by 5-10 small explosions daily without significant variations during two years of activity (figure 89).
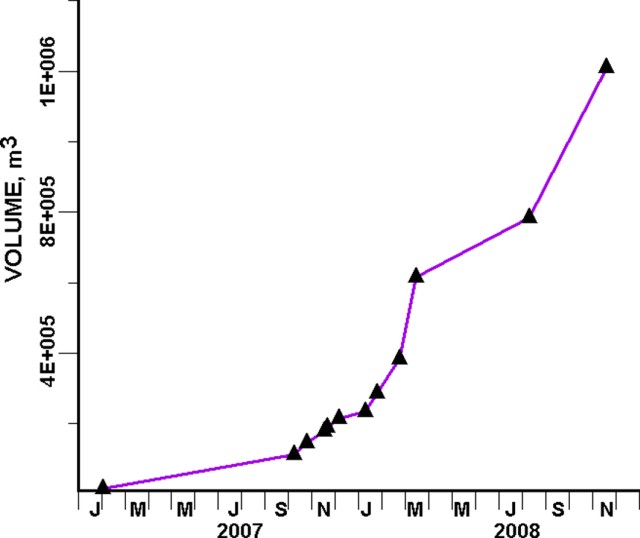 |
Figure 87. Cumulative volume of dome material extruded at Colima during January 2007-early November 2008. Courtesy of Colima Volcano Observatory. |
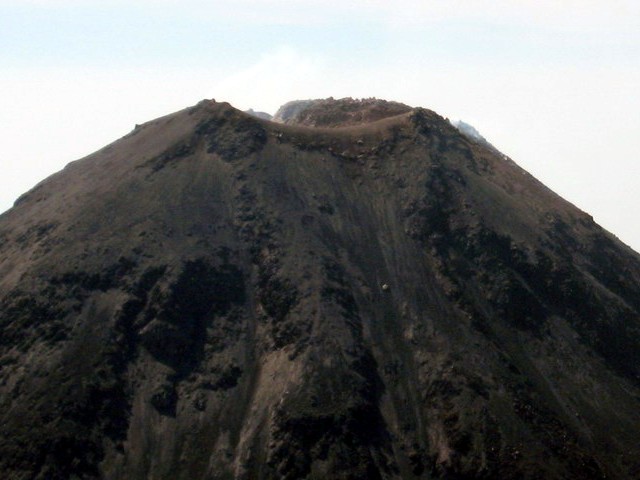 |
Figure 88. Photo of the dome taken on 21 November 2008 from the top of Nevado de Colima (6 km N of Volcán de Colima). Courtesy of Colima Volcano Observatory. |
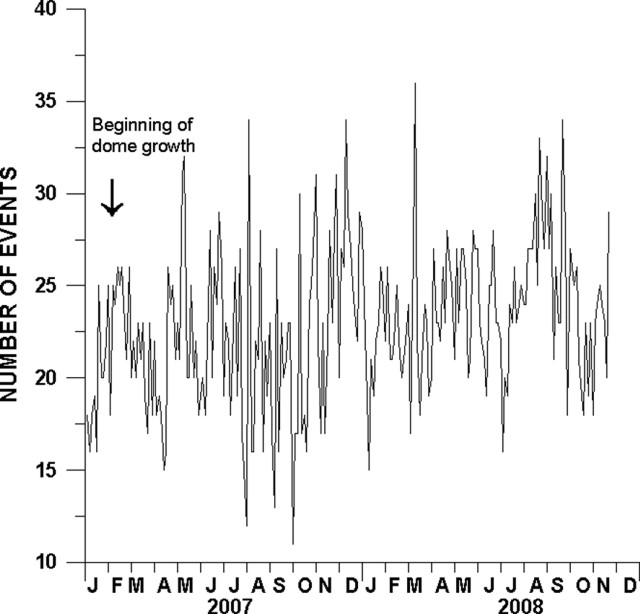 |
Figure 89. Variations in the number of small explosions (3-day sums) recorded by a seismic station situated at 1.6 km from the crater. Courtesy of Colima Volcano Observatory. |
Information Contacts: Observatorio Vulcanológico de la Universidad de Colima, Colima, Col., 28045, México (URL: https://portal.ucol.mx/cueiv/).
Persisting lava dome growth into at least mid-2009
Our most recent reports on Colima (BGVN 33:04 and 33:10) discussed new dome growth between February 2007 and November 2008. This report provides an update on the dome growth through May 2009.
According to a report from the Colima Observatory, the slow growth of Colima's new lava dome continued (figure 90). By March 2009, the volume was about 1,400,000 m3, roughly 80% of the total crater volume. Since the beginning of October 2007 the mean effusion rate has been ~ 0.03 m3/s. During the last two years, dome growth has been accompanied by 5-10 small explosions daily without significant variations (figure 91).
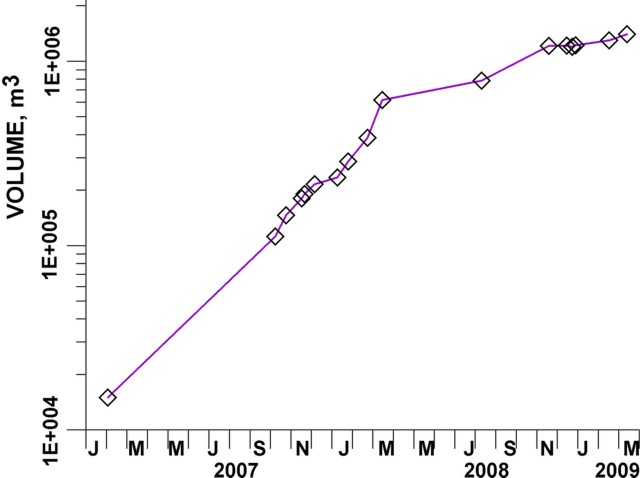 |
Figure 90. Dome volume versus time at Colima during January 2007 to March 2009. Courtesy of Colima Volcano Observatory. |
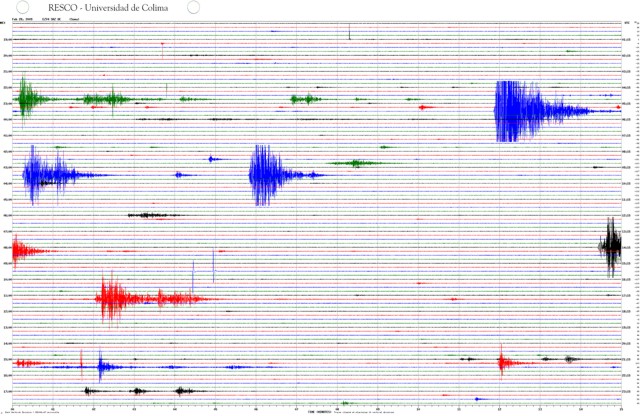 |
Figure 91. A typical daily seismogram at Colima, showing small explosions during 1800 hours on 28 February to 1800 hours on 29 February 2009. Recorded at station EZV4, located 1.7 km from the crater; vertical lines are 1-minute intervals. Courtesy of Colima Volcano Observatory. |
To improve monitoring of the dome growth and any lava flows, pyroclastic flows, and explosive columns, the video station Nevado has been upgraded with two additional video cameras. These cameras allow digital images of the crater and the whole volcanic edifice of Colima to be taken every 4 seconds (figure 92). The station is situated at ~ 4,000 m elevation, below the summit of Nevado de Colima and 5.8 km N of the Volcán de Colima crater.
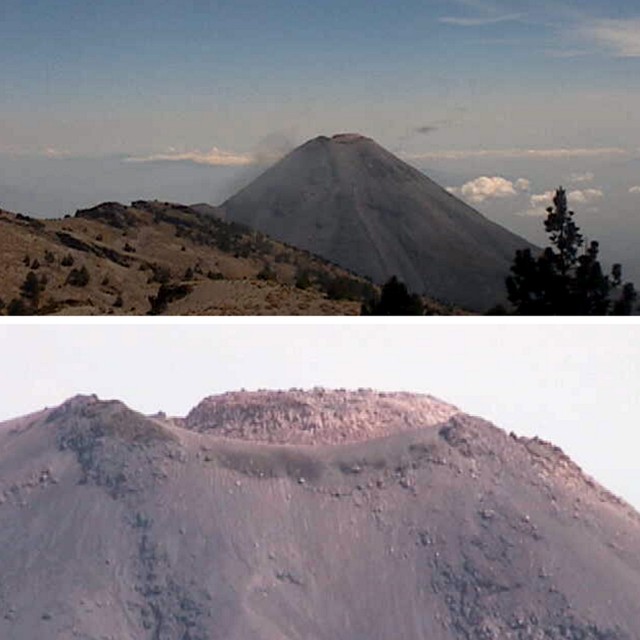 |
Figure 92. Photos of Colima showing the edifice (top) and close-up of the crater (bottom). View is from the Nevado video station on 25 March 2009. Courtesy of Colima Volcano Observatory. |
Table 18 contains a condensation of reports on Colima ash plumes and selected eruptions during 4 January 2006 though 25 May 2009.
Table 18. Ash plumes from Colima seen between 4 January 2006 and May 2009. The plume altitudes (height above mean sea level) are approximate and indicate the highest plume during the specified period. Incandescent ejections are meters above the summit. Data from the Washington Volcanic Ash Advisory Center, Universidad de Colima, Gobierno del Estado de Colima, and news articles.
| Date | Max plume altitude (km) | Plume drift direction | Remarks |
| 04 Jan-09 Jan 2006 | 6.7 | NE, SW | -- |
| 11 Jan-15 Jan 2006 | 9.1 | ENE | -- |
| 04 Feb-07 Feb 2006 | 8.5 | -- | -- |
| 22 Feb-26 Feb 2006 | 9.1 | NE | -- |
| 26 Mar-27 Mar 2006 | 6.1 | -- | -- |
| 01 Apr-03 Apr 2006 | 7.9 | -- | -- |
| 08 Jul 2006 | -- | -- | Ash emission to unknown height. |
| 29 Oct 2006 | 6.1 | S | -- |
| 06 Nov 2006 | 6.1 | NE | -- |
| 19 Nov 2006 | 5.5 | W, SW | -- |
| 30 Nov 2006 | 6.7 | SE, NE | -- |
| 15 Dec 2006 | -- | SE, W | Continuous ash-and-steam emissions. |
| 21 Mar-27 Mar 2007 | 5.2 | NE | Incandescent material to 50-150 m. |
| 11 Apr-16 Apr 2007 | 6.1 | W | Multiple, sometimes continuous ash-and-steam emissions. |
| 26 Apr 2007 | -- | NW | -- |
| 28 and 30 Apr 2007 | -- | -- | Incandescent material to 100 m. |
| 31 May 2007 | -- | S, SW | -- |
| 19 Sep-23 Sep 2007 | 4-4.9 | Various | -- |
| 31 Oct-01 Nov 2007 | 4.5 | N | -- |
| 26 Nov-29 Nov 2007 | 7.3 | W, NNE | Multiple steam and steam-and-ash plumes to 3.9-4.6 km. |
| 03 Dec-04 Dec 2007 | -- | -- | Multiple steam and steam-and-ash plumes to 3.9-4.6 km. |
| 12 Dec-18 Dec 2007 | 4-4.4 | Various | Multiple plumes. |
| 20 Dec-25 Dec 2007 | 4.3-4.7 | -- | -- |
| 29 Dec-30 Dec 2007 | 4-4.3 | Various | Incandescent material ejected. |
| 14 Feb-19 Feb 2008 | 4.4 | Various | -- |
| 12 Mar-18 Mar 2008 | 3.9-4.8 | Various | -- |
| 01 Apr-07 Apr 2008 | 4.2-6.4 | Various | Multiple plumes; incandescent material ejected 150 m; incandescent avalanches. |
| 08 Apr-15 Apr 2008 | 4.5-4.9 | Various | Multiple plumes; incandescent material ejected 50 m. |
| 13 May 2008 | -- | NW | -- |
| 03 Jun-09 Jun 2008 | 4-4.8 | Various | -- |
| 13 Aug-18 Aug 2008 | 4-4.7 | Various | Multiple plumes. |
| 22 Oct-28 Oct 2008 | 3.9-4.5 | Various | Multiple plumes. |
| 30 Oct-31 Oct 2008 | 4.1-4.3 | -- | White plumes. |
| 02 Nov 2008 | 4.6 | SW, E | Gray plumes. |
| 03 Dec-08 Dec 2008 | 6.4 | -- | Gray plumes and white plumes. |
| 09 Dec-16 Dec 2008 | 3.9-5.8 | SE, N | -- |
| 02 Jan 2009 | 4.1 | -- | Incandescent material ejected 100 m. |
| 03 Jan-05 Jan 2009 | 4-4.2 | Various | Multiple gray and white plumes. |
| 03 Feb-10 Feb 2009 | 3.9-4.9 | -- | Multiple gray and white plumes; incandescent material ejected 50 m. |
| 25 Feb-03 Mar 2009 | 3.9-4.5 | -- | Multiple gray and white plumes. |
| 25 Mar-31 Mar 2009 | 3.9-4.6 | Various | Multiple gray and white plumes. |
| 08 Apr-13 Apr 2009 | 3.9-5.2 | Various | Multiple gray and white plumes. |
| 21 May-25 May 2009 | 3.9-4.2 | E, SE, S | Multiple gray and white plumes. |
Information Contacts: Observatorio Vulcanológico de la Universidad de Colima, Colima, Col., 28045, México (URL: https://portal.ucol.mx/cueiv/); Washington Volcanic Ash Advisory Center (VAAC), Satellite Analysis Branch (SAB), NOAA/NESDIS E/SP23, NOAA Science Center Room 401, 5200 Auth Rd, Camp Springs, MD 20746, USA (URL: http://www.ospo.noaa.gov/Products/atmosphere/vaac/); Gobierno del Estado de Colima (URL: http://www.colima-estado.gob.mx/2006/index.php).
Dome sheds debris beyond the crater both to the S and from a new lobe to the W
The current lava dome in Colima's crater, first observed around early February 2007 (BGVN 32:10 and 33:04), continued slow growth through March 2010, as reported by Vyacheslav Zobin of the Observatorio Vulcanológico de la Universidad de Colima. As previously noted (BGVN 33:04), in March 2009 the dome had a volume of ~ 1,400,000 m3, about 80% of the total crater volume. The mean effusion rate had stood at ~ 0.03 m3/s in October 2007 (BGVN 34:04). The growth rate slowed further during 2009 and through March 2010 to ~ 0.02 m3/s.
In fall 2009, the new dome growth reached the western rim of the crater. Claus Siebe (UNAM) sent us a photo taken during an overflight on 7 February 2010, showing the lava dome (figure 93). As expected, based on the lack of barrier on the dome's W side, rockfalls became prominent in February 2010 (figure 94).
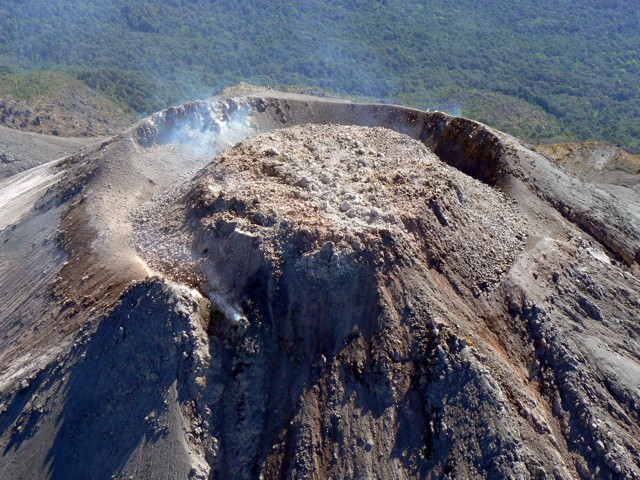 |
Figure 93. Aerial photo of Colima's lava dome taken looking from W to E at 1030 on 7 February 2010. Courtesy of Claus Siebe. |
 |
Figure 94. Variations in the daily number of small explosions and rockfalls at Colima during 2009 and 2010, obtained from seismic station EZV4, 1.7 km from the crater. Note the increase in the number of rockfalls starting in January-February 2010. Courtesy of Observatorio Vulcanológico de la Universidad de Colima. |
The rockfalls began after heavy rains and the emergence of a small new lobe of lava in the W sector. That lobe had perched on the dome's margin, traversed across the buried crater rim, and began descent down the outer flank (figures 95 and 96). Figure 96 shows the new western lobe in an aerial view. That lobe was ~ 50 m long by March 2010.
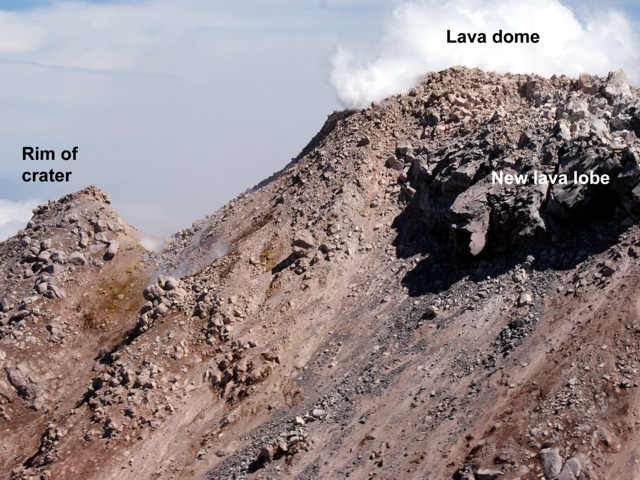 |
Figure 95. A 24 February 2010 photo showing lava dome and new lava lobe at Colima. Courtesy of Civil Protection of Jalisco state. |
 |
Figure 96. View of dome on 29 March 2010 showing Colima's western lobe (left) and the overspilling of the crater to the S (right). Courtesy of Faculty of Science, Colima University. |
Ash plumes rising to ~ 4 km altitude were observed during 24 July-4 August, 22 October, and 1-2 December 2009. On 2 December incandescent tephra was also ejected 50 m above crater to the SE. Seismic data indicated that small explosions continued through April 2010 (figure 94).
Information Contacts: Vyacheslav Zobin, Observatorio Vulcanológico de la Universidad de Colima, Colima, Col., 28045, México (URL: https://portal.ucol.mx/cueiv/); Claus Siebe, Instituto de Geofísica UNAM, Ciudad Universitaria, Delegación Coyoacán, C.P. México D.F 04510 (URL: http://www.geofisica.unam.mx/); Gobierno del Estado de Colima (URL: http://www.colima-estado.gob.mx/seguridad/indvolcan.php).
Dome growth continues in 2010-2011; eroding, ~55-m-long lobe
The Observatorio Vulcanologico de la Universidad de Colima (Colima Volcanological Observatory) reported that during 2010-2011, lava extrusion at Colima continued at the dome that was first recognized in February 2007. The slow growth of a small lobe of lava within the W sector of the crater of the volcano commenced during February 2010 (BGVN 35:05), and this process continued through March 2011. The rate of growth of this lobe was ~0.1 m3/s, and was accompanied by numerous rockfalls and small explosions (figures 97 and 98). Explosions often remained in the range of 3 to 15 per day during January 2009 through March 2011. As previously noted (BGVN 35:05), rockfalls suddenly became very common in February 2010. The rockfalls reached a maximum of over 60 per day, and through March 2011 they remained in the range of 15 to 42 per day (figure 97).
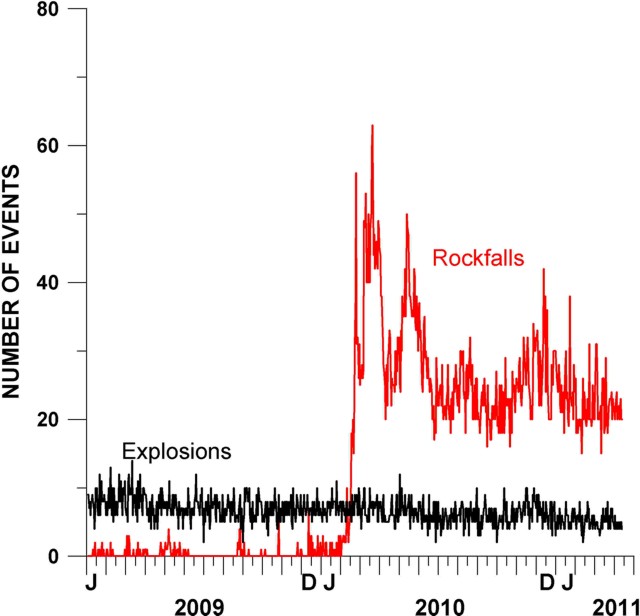 |
Figure 97. Variations in the daily number of small explosions and rockfalls at Colima during the year of 2009 through March 2011 based on the observations of the seismic network RESCO (seismic station EZV4, 1.7 km from Colima's crater). Courtesy of Colima Volcano Observatory. |
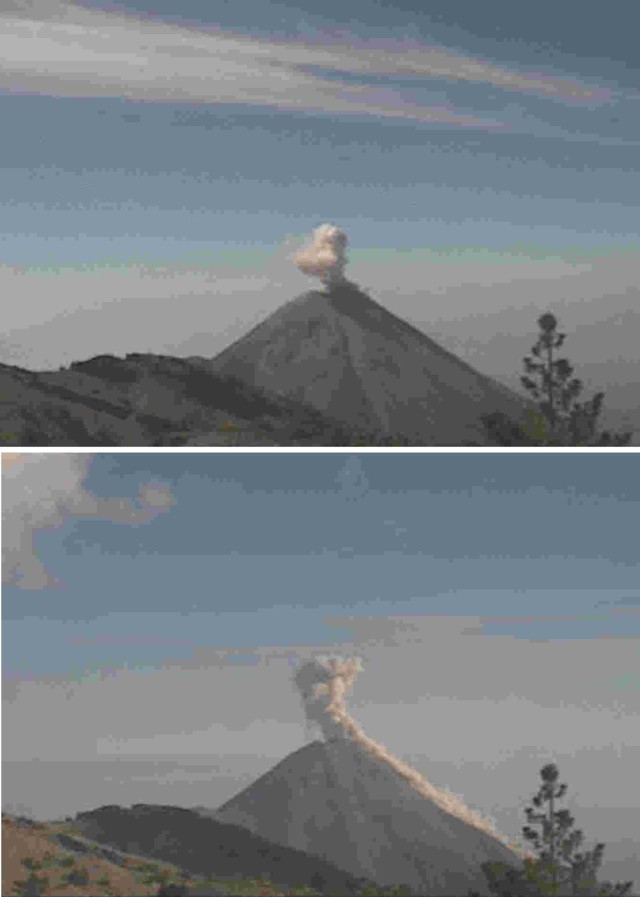 |
Figure 98. Low-resolution images characterizing behavior at Colima during the year 2010 into March 2011, where small explosions at the summit dome were soon followed by rockfalls. Both photos taken by the web camera at station Nevado, located at elevation 4 km on the neighboring peak (Nevado de Colima) 6 km N of the active dome and crater. Courtesy of Colima Volcano Observatory. |
The active lobe's width was ~10-15 m; its length was ~50-60 m. Loss of material from the lobe's distal end generated frequent rockfalls. According to a report from the Observatory, " . . . extrusive activity of the volcano has changed from endogenic [i.e., intrusion within the dome], observed during 2007-2009, to exogenic [i.e., extrusion to the dome's surface or margin] with the development of the new lava lobe." Figure 99 illustrates this change in the eruptive process (endogenic in the upper frame, switching to exogenic).
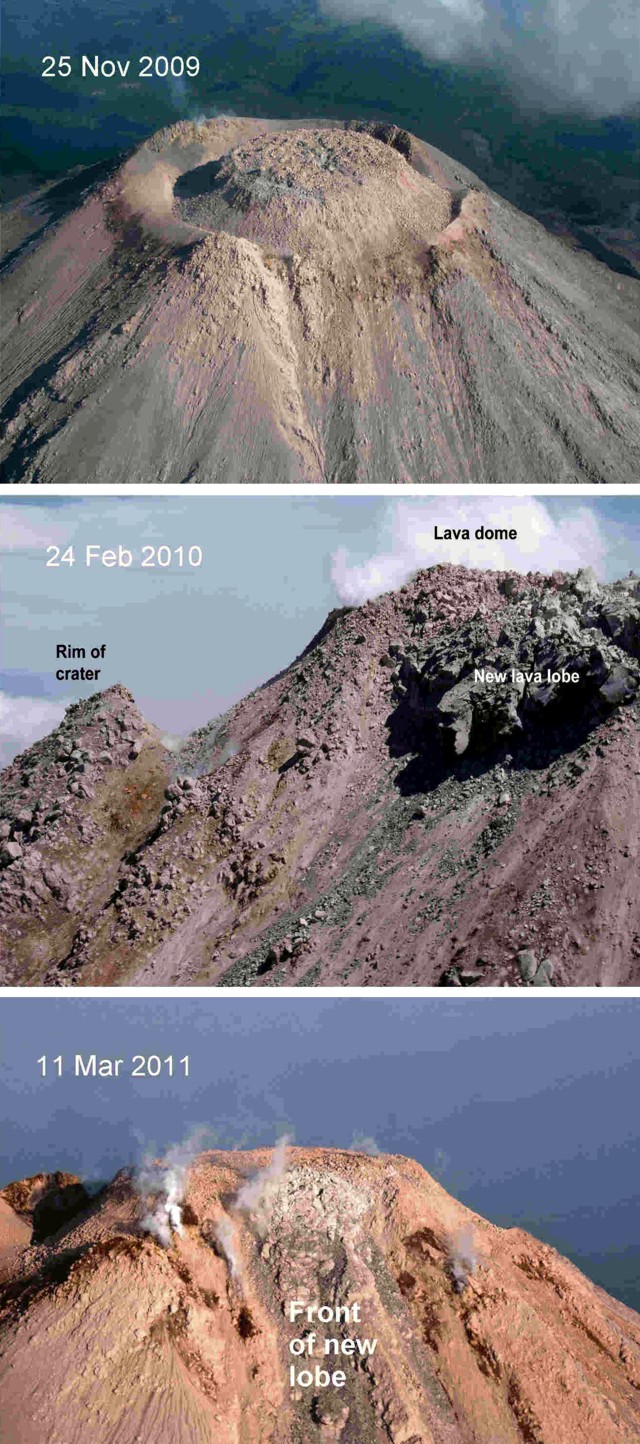 |
Figure 99. Photos of the Colima's crater zone taken (top to bottom) on 25 November 2009, 24 February 2010, and 11 March 2011. All three are views from the volcano's W side. The photos document a new lava lobe (24 February 2010) and its development to 11 March 2011. Courtesy of Civil Protection of the State of Jalisco. |
Satellite image, January 2011. A natural-color satellite image of Colima was acquired 22 January 2011 (figure 100). The perspective of the image (straight down) flattens the appearance of the classic steep-sided stratovolcano, according to the image's NASA Earth Observatory analysts. Similarly, they noted that the image's relatively low resolution (10 m per pixel) falsely gives a smooth appearance to what are actually very rough-surfaced block lava flows.
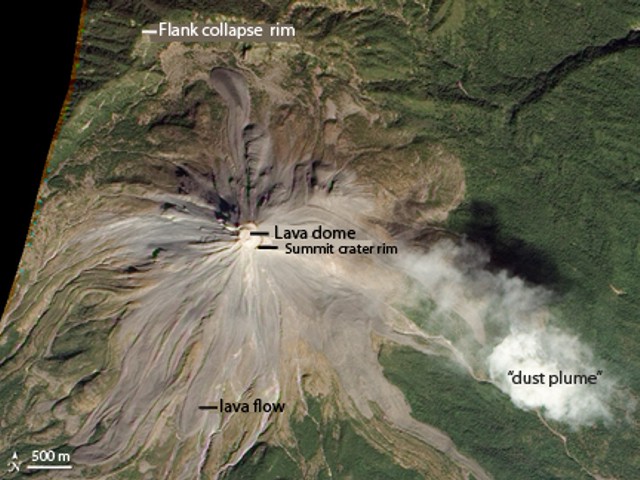 |
Figure 100. This natural-color satellite image of Colima was acquired on 22 January 2011 by the Advanced Land Imager (ALI) on Earth Observing-1 (EO-1). N is to the top. The region titled 'flank-collapse rim' represents the topographic margin of an ancient collapse (see text). Courtesy of NASA Earth Observatory. |
The image in figure 100 shows evidence of four types of volcanic activity: lava dome growth, explosive eruptions, flank collapse, and lava flows. The active lava dome nearly fills Colima's summit crater. The top of the dome is higher than the crater rim, and material occasionally tumbles down the volcano's W and S slopes. A light colored plume, probably dust from rockfalls off the dome, extends to the E (right) of the summit. Colima's summit crater developed during a 1913 explosive eruption that removed 100 m off the summit.
To the N of Colima's summit is a rim ('flank-collapse rim') of a 5-km-wide caldera, formed about 4,300 years ago in a massive flank collapse, similar to the 18 May 1980 eruption of Mount St. Helens. Modern Colima volcano rises near the center of this caldera. Recent lava flows (erupted since 1961), cover the upper slopes of the volcano. Older lava flows (erupted in the 1800s and earlier) are covered in green vegetation.
MODVOLC. The MODVOLC satellite thermal alerts system showed thermal alerts of 4 pixels at 0845 UTC on 29 December 2010 and 2 pixels at 0520 UTC on 20 January 2011, confirming recent hot material at and near the dome. Press reports also noted incandescent lava flows. The alerts mentioned above were the only significant ones measured since 2005, when major explosions occurred (BGVN 30:06 and 31:03).
Information Contacts: Observatorio Vulcanologico de la Universidad de Colima (Colima Volcanological Observatory), Calle Manuel Payno, 209 Colima, Col., 28045 Mexico (URL: http://www.ucol.mex/volc/); NASA Earth Observatory (URL: http://earthobservatory.nasa.gov/); Hawai'i Institute of Geophysics and Planetology (HIGP) MODVOLC Thermal Alerts System, School of Ocean and Earth Science and Technology (SOEST), Univ. of Hawai'i, 2525 Correa Road, Honolulu, HI 96822, USA (URL: http://modis.higp.hawaii.edu/).
Microearthquakes leading to January 2013 explosions ending 18 month calm
One and a half years of calm at Colima volcano ended after explosive events starting on 6 January 2013. A sequence of January explosions cored out the previous dome and generated pyroclastic flows that reached 2.8 km W of the dome. As discussed in our previous report (BGVN 36:03) the 1998-2011 effusive-to-explosive eruption at Colima ended in June 2011, leaving in the crater an andesitic lava dome constructed during 2007-2011 extrusions stage (see BGVN 36:03). During the subsequent 1.5 years of calm, seismicity dropped and all visible signs of dome growth ceased.
We begin with an abstract that describes the end date of the previous eruptive 2007-2011 interval: 21 June 2011. Next we present a synthesis of a new series of eruption that started in 2013, sent to us in a report from the Colima Volcano Observatory, a report emphasizing both morphologic changes to the dome as a result of the January 2013 explosions and the seismic record associated with those explosions. We follow that submission with information from other sources including news coverage. Colima was the centerpiece at the recent Cities on Volcanoes meeting held in the city of Colima, Mexico in November 2012. At that stage the volcano still remained quiet.
2011 eruption's end date. The missing ingredient in many assessments of eruptions with declining, drawn out waning stages is often the last date of eruption prior to repose. Precise start dates are common, but end dates are not, restricting the precision of eruptive duration. Fortunately, increasing numbers of instrument- and satellite-aided techniques have emerged to help document eruption end dates. Salzer and others (2013) used satellite InSar deformation data coupled with a web camera to assess 21 June 2011 as Colima's final eruption in the 2007-2011 dome extrusion episode. They noted that "measuring deformation in the region of the crater is important to determine the rate of the ongoing eruption and the stability of the dome. The latter part of their abstract follows.
"The activity in the summit region has been recorded by a video monitoring system installed by the University of Colima volcano observatory. We have analysed the optical camera data obtained between February and June 2011 using spatial digital image correlation techniques. We show that the velocity of dome extrusion varies strongly on a daily basis, reaching up to 3m/day, and then systematically decreased over the following months. Deformation was barely above the detection threshold of 30cm/day in the weeks prior to June 21st, when a significant explosion occurred, removing part of the dome. Camera data recorded after this event does not show any displacements, possibly due to the low spatial resolution of the camera data.
"In order to analyse slower deformation processes, we have acquired TerraSAR-X data in spotlight mode for ascending and descending tracks over Colima, obtaining a high spatial resolution of up to 2 m, and a temporal resolution of up to 11 days. In combination with a high resolution digital elevation model, the InSAR data allow the detection of modifications of the dome at a resolution that is two orders of magnitude below the detection threshold of the cameras. The different temporal and spatial scales of deformation detectable by camera and radar monitoring (metre to centimetre, respectively), highlight the benefit of combining these methods to observe the full range of activites at Colima. The results reveal that explosions may occur suddenly after a period of declined dome growth."
Eruptions resume in January 2013. Figure 101(A) shows the dome as seen on 9 March 2012 in the midst of the year and a half interval of quiet when all visible and available geophysical signs of dome growth remained absent. In contrast, figure 101(B) shows the scene after eruptions resumed, starting with explosions on 6 January 2013. There developed both a depression in the dome's summit and some large ejecta perched near that crater's rim. The photo was taken on 31 January after a sequence of explosive events on 6, 13, and 29 January.
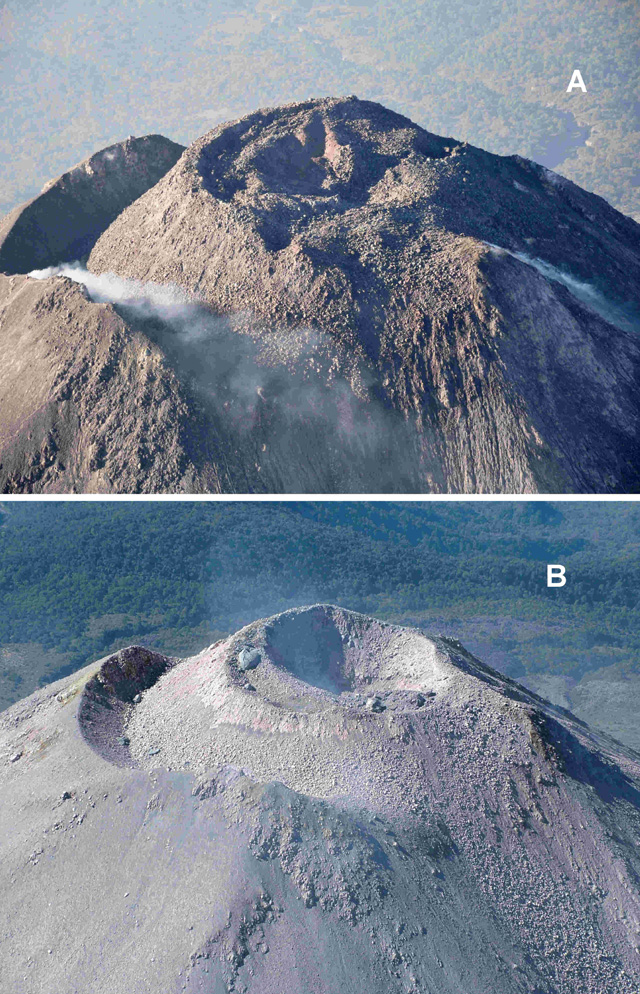 |
Figure 101. (a) The lava dome that was formed in the crater of Colima volcano during the 2007-2011 activity, as seen from the air on 9 March 2012. Few if any documented changes were seen here during June 2011 and prior to the 6 January 2013 explosion. (b) A photograph taken on 31 January 2013 from a perspective somewhat similar to the adjacent photo. The dome had resumed eruption by this time, resulting in a restructuring of the upper part of the dome's surface morphology and a more pronounced circular crater at the dome's crown. Large blocks prominent on the inner rim are from the new activity. Photos from (a) Facultad de Ciencias, Universitad de Colima, and (b) taken during a flight by the Civil Protection of Jalisco State and acquired by the Colima Volcano Observatory. |
The January explosions cored out and partly destroyed the 2007-2011 lava dome. Figure 101(B) shows the new crater that was formed within this old lava dome. The volume of this new crater was estimated at about 250,000 m3. During the explosions, a new lava dome began to grow in the new crater with an initial eruption of ˜0.14 m3/s. The January eruptions generated pyroclastic flows that reached 2.8 km W of the dome.
No precursory volcano-tectonic earthquakes or deformation signals were recorded prior to the January sequences. On the other hand, sequences of numerous microearthquakes (pulgas) occurred preceding the largest explosive events. This is shown in the 6 January seismic data presented in figure 102.
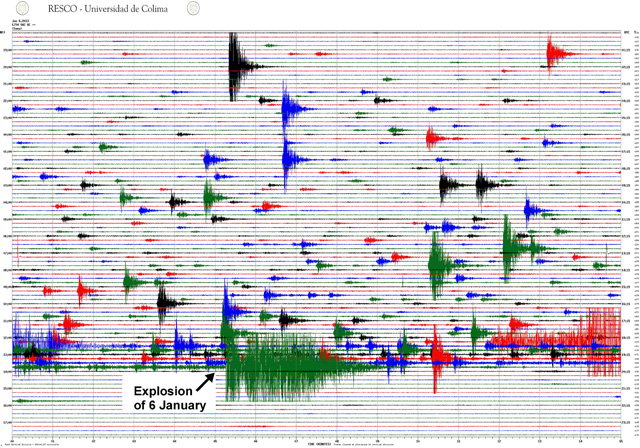 |
Figure 102. A seismogram containing the 24 hour interval of 6 January 2013 record from a short period instrument located 1.9 km from Colima's crater (vertical lines show 1 min time intervals; horizontal lines correspond to local time zone at left and UTC at right). Note the abundance of microearthquakes of many sizes prior to the explosion. After that explosion, microearthquakes in this amplitude range essentially ceased during the rest of the day. Courtesy of Colima Volcano Observatory. |
Figure 103 shows the 29 January explosion as viewed from video station Nevado installed 5.3 km N of Colima's crater.
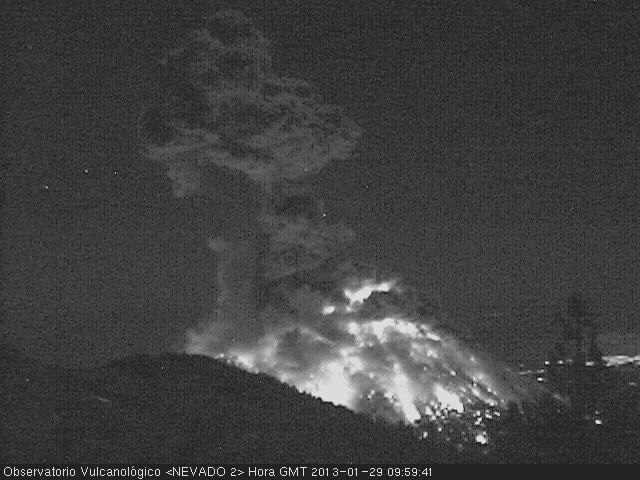 |
Figure 103. Image made during the explosion of 29 January 2013 from Nevado station N of the crater. Incandescent material has splashed over much of the visible dome surfaces. A dark cauliflower-shaped cloud rose above the summit. Courtesy of Colima Volcano Observatory. |
Seismic comparisons. The largest of the explosions in the January eruptive sequence can be compared from seismic records. As noted above, the associated eruptions generated small pyroclastic flows.
Table 19 shows the energy associated with each of the eruptive pulses (6, 13, and 29 January). These results were estimated from the broadband seismic record measured at a distance of 4 km from the crater using the methods described in (Zobin and others, 2009, 2010).
Table 19. Energy of Colima's three largest explosions during January 2013. Courtesy of Colima Volcano Observatory.
| Date | Energy, J |
| 06 Jan 2013 | 7.2 x 10¹⁰ |
| 13 Jan 2013 | 2.3 x 10¹⁰ |
| 29 Jan 2013 | 1.5 x 10¹¹ |
Figure 104 provides another look at Colima seismic data during January 2013. On the upper two of the three plots (A and B), dates of the three explosions (on the 6th, 13th, and 29th) are indicated as black downward pointing arrows and the key to the seismic signals is shown. Figure 104(A) shows the number of microearthquakes, with in all three cases numbers of events increasing with approach to the explosions. For the first two eruptions, the peaks in microearthquakes coincided with the eruption. For the third microearthquake, on the 29th, counts rose rapidly and peaked prior to the eruption. The counts decreased after the eruption (figure 104(B)).
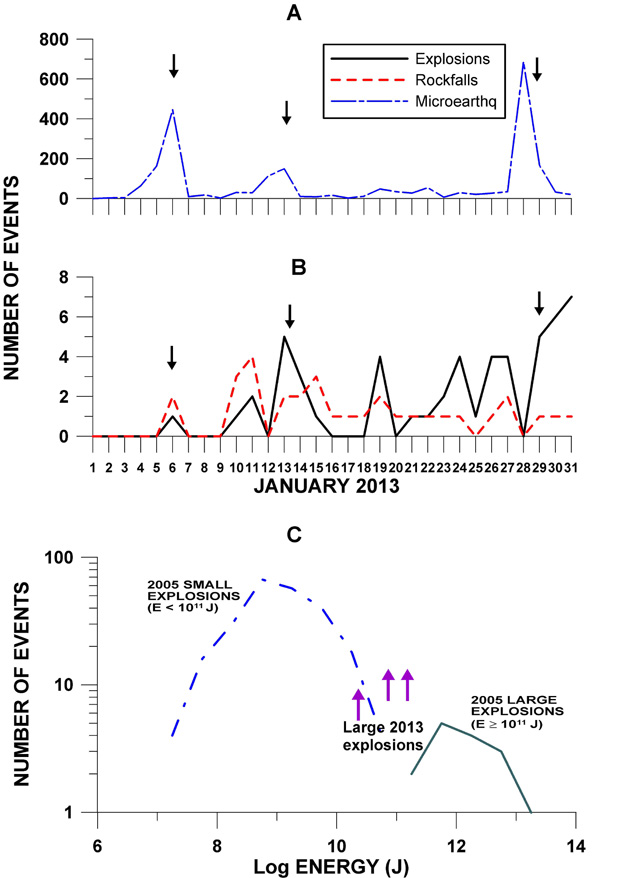 |
Figure 104. Plots of seismicity and energy associated with Colima's explosive sequence of January 2013. (A and B) Variations with time in the number of events recorded by a highly sensitive broadband station 1.9 km from the crater. Arrows in A and B show the appearance of three large explosions. (A) Microearthquakes plotted here resulted from processing, where the seismic records were filtered between 1 and 50 Hz to better see seismic events of high frequency and small amplitude. (B) The number of seismic signals indicative of small explosions, rock falls, and pyroclastic density currents. Several peaks occurred-some coincident and others not coincident with the three marked explosions. (C) A plot of log number of events versus log energy to compare the energy of the three largest explosions of the January 2013 sequence (colored, up-pointing arrows) with the computed energy distributions of the small and large explosive events recorded during the 2005 explosive stage. Courtesy of Colima Volcano Observatory. |
Figure 104(B) indicates that there were multiple seismically inferred explosions, on the three noted days, as well as on other days. For example, starting at left on Figure 104(B) one sees a progression from the 6th, 1 explosion; to the 10th and 11th, 1 and 2 explosions respectively. The largest number shown was associated with the arrow indicating the explosion on the 29th, 5 explosions, in a sequence escalating to 7 on the 31st (last data on the plot).
Figure 104(C) plots the energy of the three largest explosions of the January 2013 sequence (at the tips of the colored arrows aiming upwards). The two other fields on the plot show the energy distributions of small and large explosive events recorded during 2005 at Colima (Zobin and others, 2010). Thus, figure 104(C) shows that, for events assessed at Colima and in terms of seismically detected energy, the 2013 events may be considered as small to intermediate in size.
News reports. According to news articles, a scientific advisory committee reported the 6 January 2013 eruption from Colima, saying that it ejected tephra and an ash plume that rose ˜2 km above the crater. Ash fell on residents near Ciudad Guzmán, tens of kilometers NE of the volcano. Visitors were evacuated from the Nevado de Colima national park, which contains both Nevado de Colima and the active Volcan de Colima.
During the explosion of 29 January, residents up to 20 km away reported a loud noise, shaking ground, and rattling windows. Colima ejected incandescent material. According to the Washington Volcanic Ash Advisory Center (VAAC), on the 29th an ash plume rose ˜2.5 km above the crater. Based on analyses of satellite imagery, the VAAC reported that the ash plume drifted 55 km NE at an uncertain altitude to a distance of 150 km from the volcano.
References: Salzer , J, Walter , T, Legrand , D, Breton , M, and Reyes , G, 2013, Multiscale deformation monitoring at Colima Volcano using TerraSAR-X interferometry and camera observations, EGU General Assembly Conference Abstracts (2013), vol. 15, pp. 9290.
Zobin, VM, Reyes, GA, Guevara, E, 2, and Bretón, M, 2009, Scaling relationship for Vulcanian explosions derived from broadband seismic signals, J. Geophys. Res., vol. 114, B3, March 2009. DOI: 10.1029/2008JB005983.
Zobin, VM, Melnik, O E, González, M, Macedo, O and Bretón, M, 2010, Swarms of microearthquakes associated with the 2005 Vulcanian explosion sequence at Volcán de Colima, México. Geophysical Journal International, vol. 182, issue 2, pp. 808-828. doi: 10.1111/j.1365-246X.2010.04647.
Information Contacts: Observatorio Vulcanologico de la Universidad de Colima (Colima Volcanological Observatory), Calle Manuel Payno, 209 Colima, Col., 28045 Mexico (URL: http://www.ucol.mex/volc/);Facultad de Ciencias, Universidad de Colima; Washington Volcanic Ash Advisory Center (VAAC), NOAA Science Center Room 401, 5200 Auth road, Camp Springs, MD 20746, USA (URL: http://www.ospo.noaa.gov/Products/atmosphere/vaac/).
Episode of lava effusion following the January 2013 sequence of explosions
[Following 18-months of calm at Volcán de Colima (BGVN 38:04), a sequence of intermediate-to-small size Vulcanian explosions began in January 2013.] This sequence of explosions excavated a 250,000 m3 crater in the 2007-2011 lava dome (figure 105). Episodes of effusive activity within the new crater were recorded between the explosive events. An infrared image shows fresh magma at the crater base (figure 106).
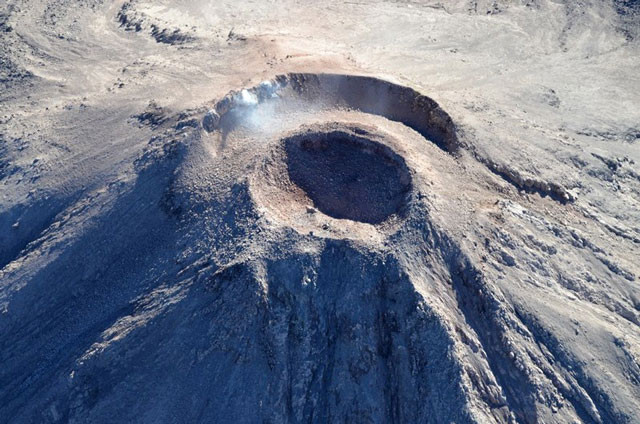 |
Figure 105. The new crater at Colima that was formed during the January 2013 explosive sequence. Photo was taken on 31 January 2013 during a flight of Civil Protection of Jalisco State. Courtesy of Colima Volcano Observatory. |
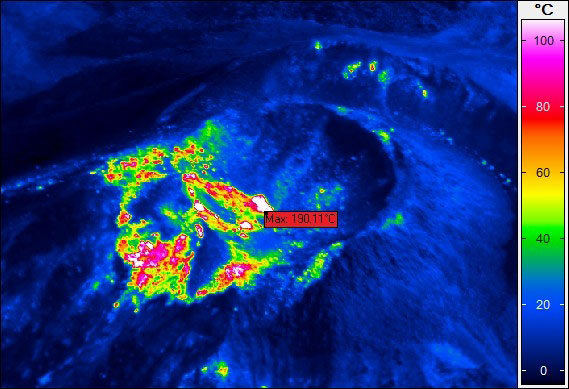 |
Figure 106. Thermal image taken during a flight over Colima on 11 January showing the emergence of fresh high temperature lava. Courtesy of Facultad de Ciencias, University of Colima. |
Activity during 2013. [There were three stages of activity at Colima during 2013, defined based on data from seismic and video monitoring (figure 107).] The first stage (St. 1) refers to the sequence of explosions described in (BGVN 38:04). On 15 February and the end of March (St. 2), video observations indicated continued gradual lava dome growth in the new crater. The dome increased in height at the rate of ~1 m/day. As a result, during this interval the [summit elevation] increased from 3,843 to 3,874 m. The dome continued to fill the crater through the end of March (figure 108). During April-November 2013 the third stage (St. 3) of significant dome growth stopped. The February-March lava dome growth was accompanied by an increase in the frequency and energy of the small explosions. Once the dome filled the crater a small lava flow traveled toward the W. Due to the steepness of this flank, much of the fresh material descended as rockfalls, whose frequency increased from April.
 |
Figure 107. Plots A-C describe the development of the 2013 eruption at VolcÁn de Colima., showing three stages of development: Stage One (St. 1), involving explosions; Stage Two (St. 2), involving dome growth and extra-crater lava flow; and Stage Three (St. 3), involving lack of measurable dome growth but with ongoing explosions. (A) Daily variations in the number of small explosions and rockfalls identified from a seismometer 4 km from the crater. (B) Variations in the radiated seismic energy of explosive events recorded at a distance of 4 km. The four largest explosions of the St.1 are shown with diamonds. (C) Variations in the maximum elevation of the growing lava dome based on continuous video monitoring. Courtesy of Colima Volcano Observatory. |
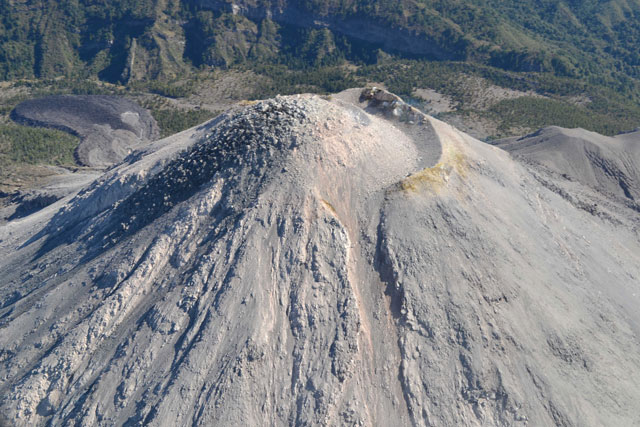 |
Figure 108. The filled crater and the lava flow that was formed during the second stage of activity on Colima's western slope. Photo was taken on 19 [March] 2013 during a flight of Civil Protection of Jalisco State. Courtesy of Colima Volcano Observatory. |
During the third stage, the daily number of small explosions and rockfalls was quite stable. This stage was associated with the occurrence of 14 lahars that began with the rainy season being registered between 11 June and 8 October 2013 descending the flanks of the volcano (figure 109). The largest, lasting around 6 hours, occurred on 16 September 2013, when the Pacific coast was affected by tropical cyclone Manuel.
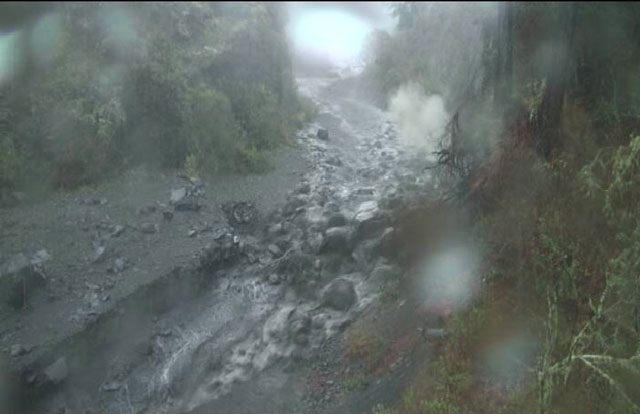 |
Figure 109. Block-rich front of the 11 June 2013 lahar recorded along the Montegrande ravine by the lahar monitoring station located 5.8 km S of the crater. Courtesy of Centro de Geociencias, UNAM. |
Activity during 2014. On 21 January 2014 the Washington VAAC first reported scattered ash emissions drifting S at 4.9 km altitude followed by a second and third emission that drifted SSW and S, respectively. Smaller ash emissions were noted throughout the following weeks. For example, Washington VAAC reported that on 7 February a small emission rose and drifted E then SE, followed by a later one the same day that drifted SE. From data provided by the Mexico Meteorological Watch Office, on 28 February an ash emission drifted 15 km SE at altitudes up to 4.6 km, and the following day, on 1 March, two emissions were reported drifting NNW, followed by three other plumes later the same day. The Washington VACC continued to report on activity as seen from satellite imaging, noting another emission on 6 March that drifted NE before dissipating and ; an emission on 12 March that drifted 25 km NNE before similarly dissipating; and a 19 March emission, which rose to 4.6 km and drifted E before dissipating 30 km from the source. A separate later plume followed on 22 March and drifted N.
Information Contacts: Observatorio Vulcanologico de la Universidad de Colima (Colima Volcanological Observatory), Calle Manuel Payno, 209 Colima, Col., 28045 Mexico (URL: http://www.ucol.mex/volc/); Facultad de Ciencias, Universidad de Colima; and Washington Volcanic Ash Advisory Center (VAAC), NOAA Science Center Room 401, 5200 Auth road, Camp Springs, MD 20746, USA (URL: http://www.ospo.noaa.gov/Products/atmosphere/vaac/).
Explosive activity, lahars, pyroclastic and lava flows continue eruptive phase
Eruptive activity at Mexico's Volcan de Colima in 2014 began with continued Vulcanian explosions that had started in January 2013 after 18 months of calm. Rockfall frequency was constant until early March, declined steadily through June 2014, increased again between July and September, and then tapered off once again through the end of the year. Explosion frequency also declined in March to a very low level by September, although the largest explosions (and pyroclastic flows they generated) occurred in the last quarter of 2014. Thirteen major lahars were recorded from two monitoring stations during the June through September rainy season; no damage was reported from these events. Three lava flows generating significant thermal anomalies formed on the WNW and SW flanks in September and November. By the end of 2014, the dome created in early 2013 had been destroyed by numerous explosive events. Information for this report comes primarily from geoscientists at the Colima Volcano Observatory and the Faculty of Science of Colima University, and also from the Washington Volcanic Advisory Center (VAAC), and the University of Hawaii MODVOLC thermal alert system.
Explosive activity. Between late January and May 2014 the Washington VAAC issued 10 reports of intermittent ash emissions due to explosive activity. The eight January through March events were reported in the previous Bulletin (BGVN 38:12). On 15 May, an ash emission rose to an altitude of 6.1 km. Another possible ash plume was observed on 18 May in satellite images drifting 30 km W. No additional ash plumes were reported by the VAAC until late November.
The year 2014 began with the continuation of high numbers of rockfalls (~150 per day), and a stable number of explosions (roughly 15-25 per day) (figure 110, top). Beginning in March 2014, they both began to decrease in number. By early July 2014, rockfalls reached their lowest number, and by September, almost no explosions were seismically recorded. Later in July 2014 the number of rockfalls abruptly increased, reaching a peak of 218 daily events on 16 September and then declined again through the end of December 2014.
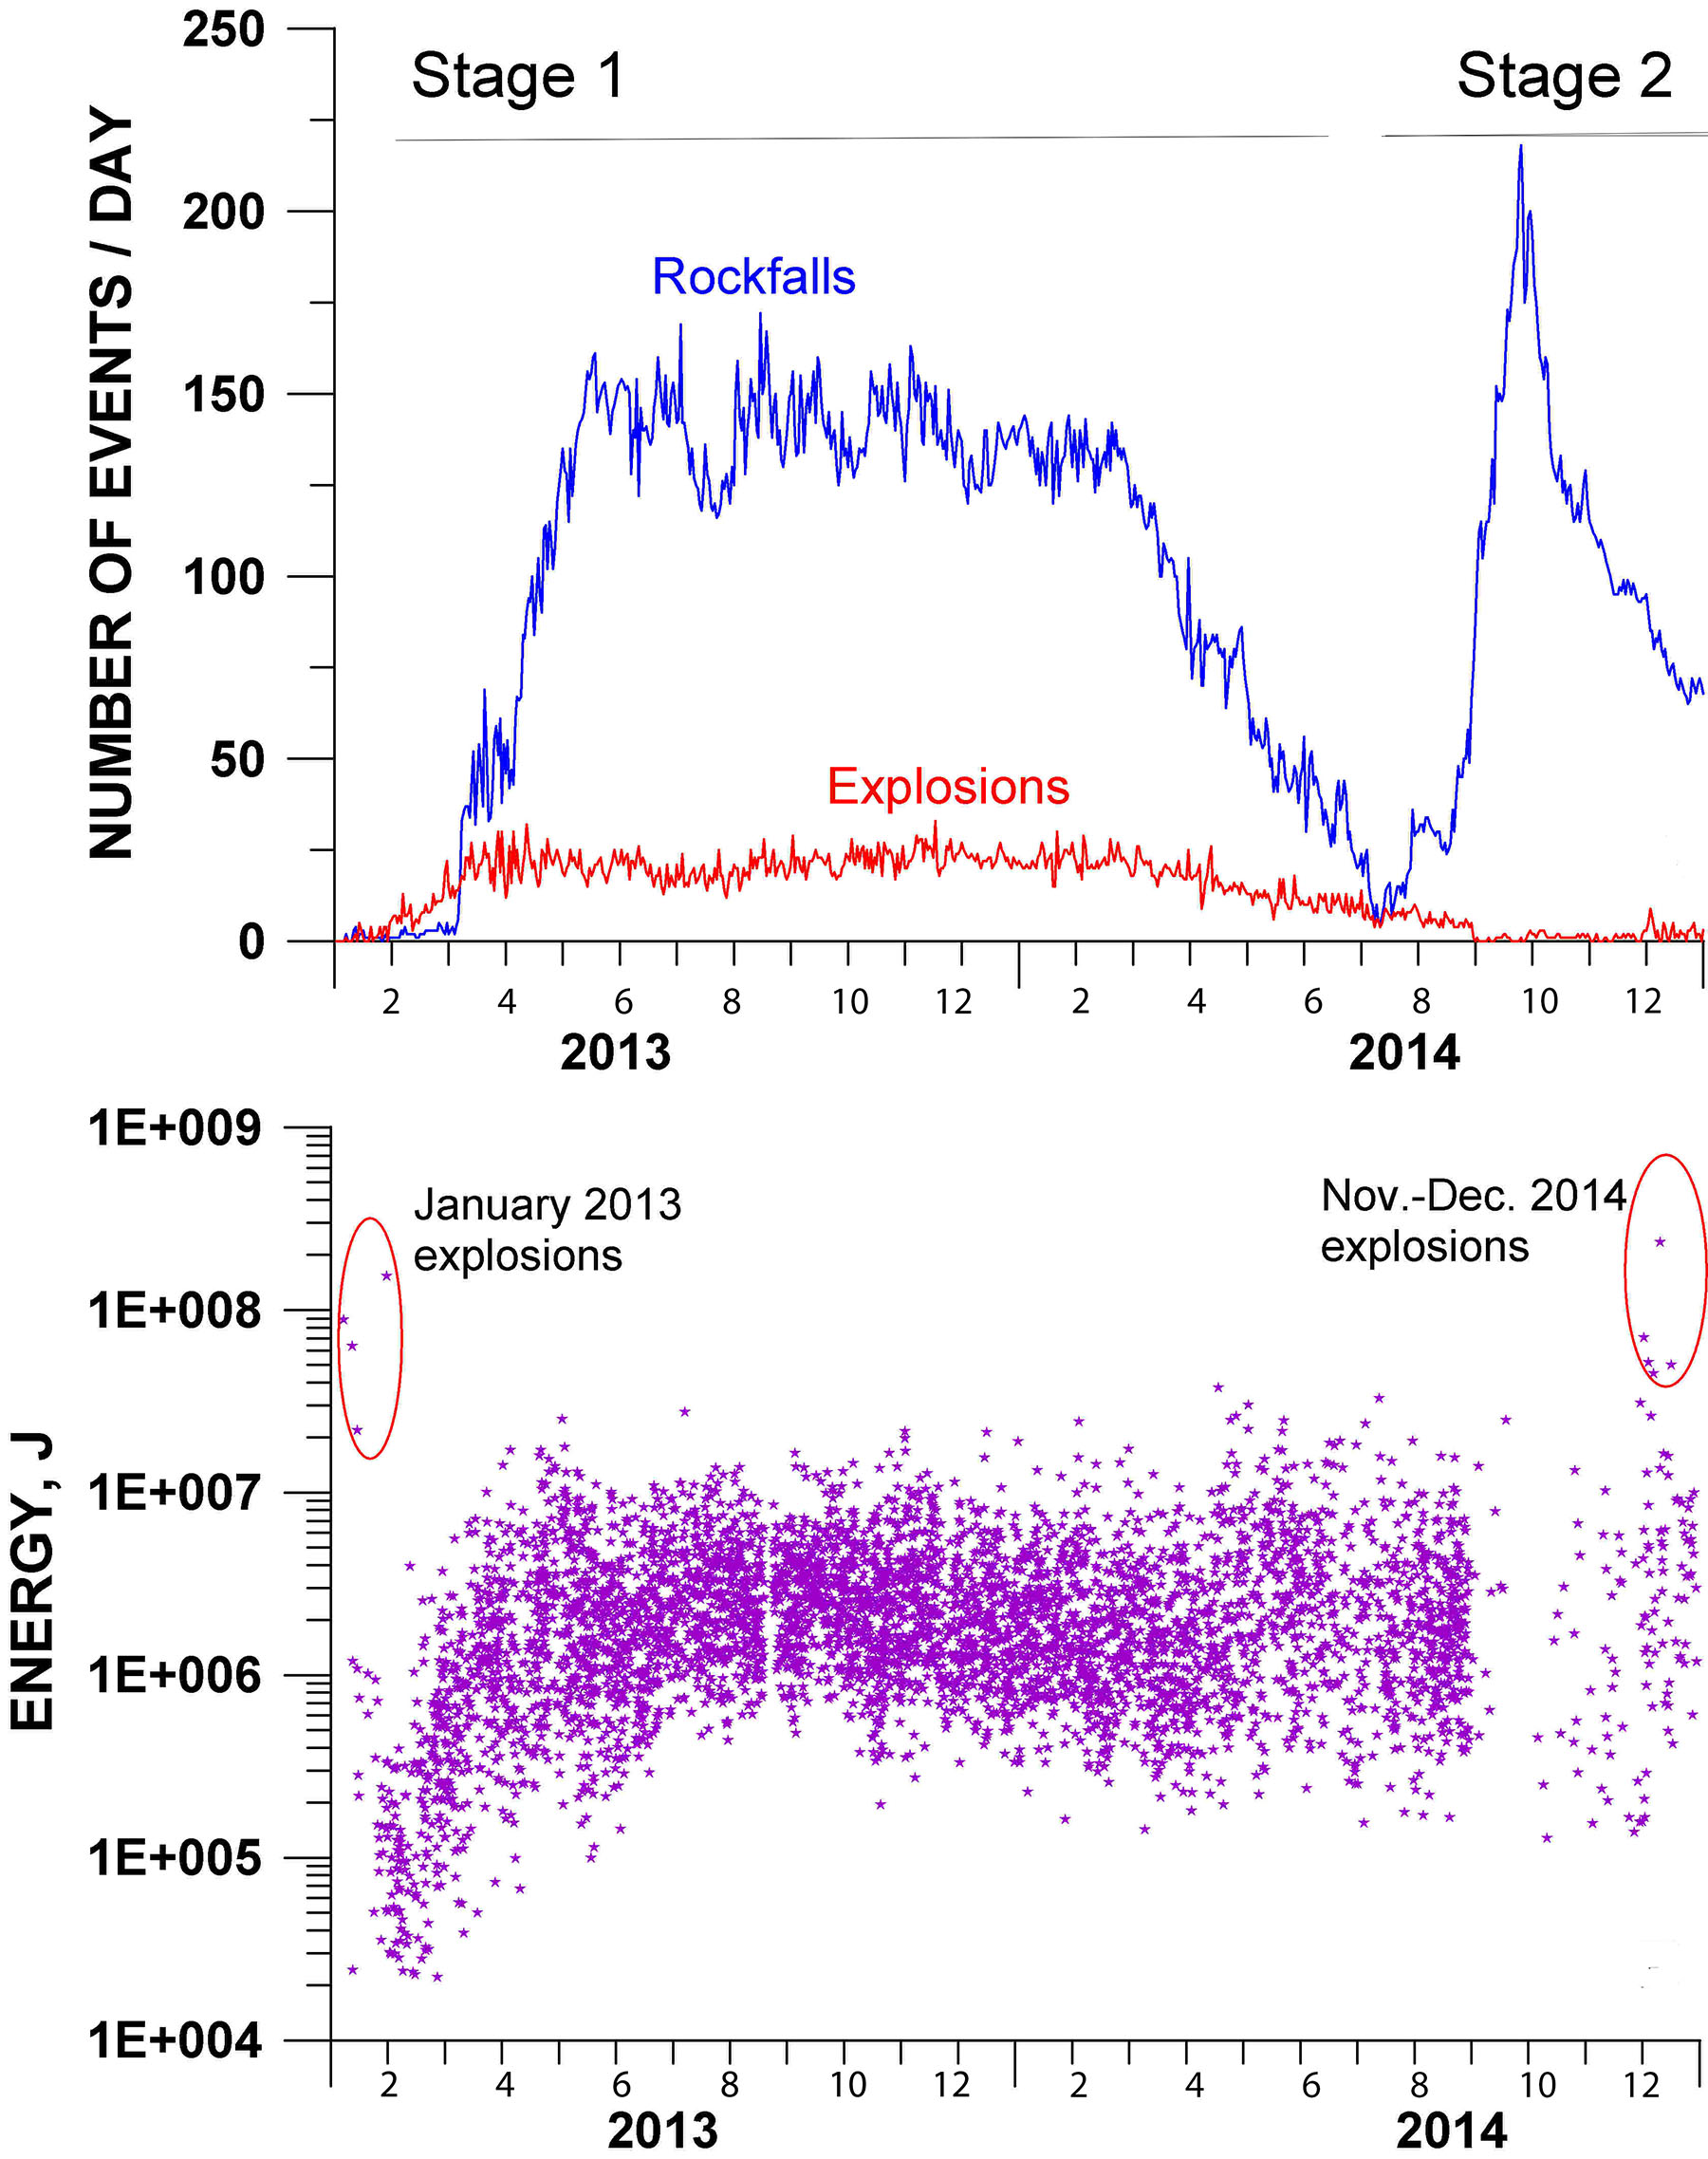 |
Figure 110. Overview of the seismicity recorded during the 2013-2014 eruption episode at Volcán de Colima. Upper plot: Daily variations in the number of rockfalls (blue line) and explosions (red line). Lower plot: Variations in the energy of explosive events; two sequences of more significant, higher-energy explosions in January 2013 and November-December 2014 are shown in ellipses. Courtesy of Centro Universitario de Estudios e Investigaciones de Vulcanología, Universidad de Colima. |
While the number of explosions decreased significantly from July to December 2014, the intensity of some of the larger explosions recorded during November-December was significant (figure 110, bottom). The largest event occurred during mid-December and measured over 2 x 10⁸ J. The energy of several explosions during November and December was comparable to the energy of the intermediate-size Vulcanian events observed at the beginning of the eruptive phase during January 2013.
MODVOLC thermal alerts showed only 8 pixels of thermal anomalies at Colima from January through 2 June 2014, suggesting that lava flows and explosions of incandescent material were intermittent and short-lived for the first part of the year.
Lahars. During June 2014, the second of two lahar monitoring stations began operation. It monitored a part of the volcano's S sector along the La Lumbre ravine. The first such monitoring station was installed in the Montegrande ravine in 2011. At both stations, the rainfall is measured and lahar detection is based on both visual and seismic records. Total rainfall recorded for the 2014 rainy season (from the end of June to September) was around 450 mm. During 2014 the lahars were concentrated mostly at the beginning of the rainy season (June-July), and the detected events were triggered by instances of ~20 mm of rain. Ten major lahars were recorded along the Montegrande ravine and three were recorded along the La Lumbre ravine during the 2014 rainy season (figure 111).
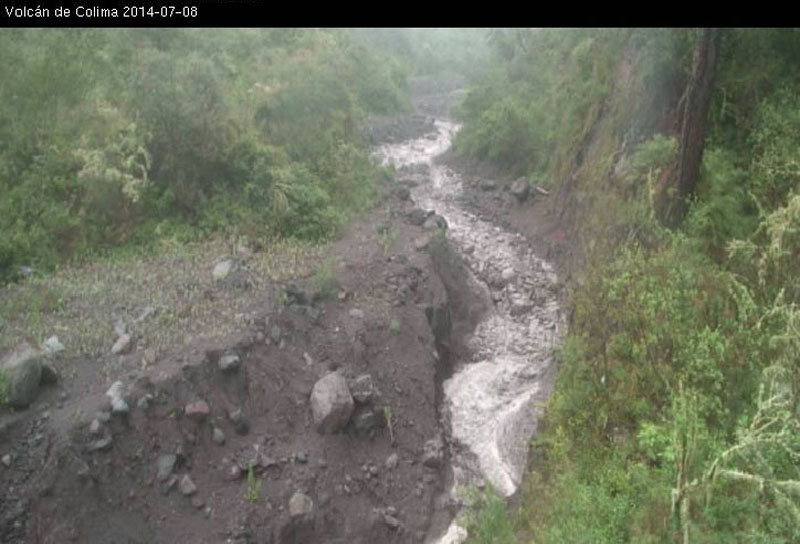 |
Figure 111. A surge in an advancing lahar at Colima that occurred on 7 July 2014 along the Montegrande ravine. The arrival of the surge appears mid-photo, evidenced as a block-rich, steepened front above the white apron of frothy water in the foreground. The lahar that contained this surge lasted more than one hour. Starting in June 2014, two drainages at Colima contained lahar-monitoring technology. Photo credit to Lucia Capra (Centro de Geosciencias, UNAM). |
Three of the recorded lahars were debris flows that contained block-rich fronts and were associated with events that lasted more than one hour. The other events were hyperconcentrated flood flows (less coherent than debris flows). The flood flows were common along the La Lumbre ravine which has a wider channel than the Montegrande ravine. The recorded lahars reached maximum distances of about 12 km, after which point they were diluted to stream flow. No damage was reported.
Lava flows. Two major lava flows associated with September 2014 explosions descended the WNW and SW flanks. The longest (on the SW flank) reached about 2.4 km (figure 112). Another pulse of magma occurred during November which produced a new flow on top of the earlier SW flow, significantly slowing its advance.
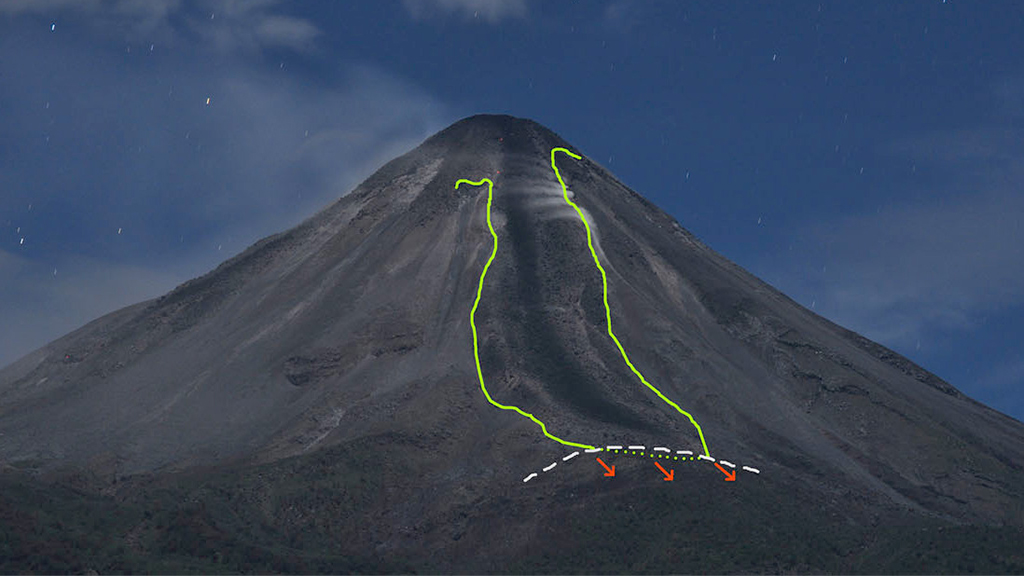 |
Figure 112. An annotated photo taken during the night of 7 November 2014 illustrating the path of the longest lava flow at Colima during September 2014, which descended the SW slope. The green lines indicates the flow's boundary. The dashed white line shows the location of topography near the end of flow. The direction of advance in November is shown with arrows. Courtesy of Facultad de Ciencias de la Universidad de Colima, photo by Nick Varley. |
The thermal signature from the lava flows and explosive activity in the 4th quarter of 2014 is very clear in MODVOLC data. Fourteen pixels in September, including five between 9 and 11 September on the SW flank (figure 113) likely show the lava flows described above and shown in figure 112. In addition, 66 pixels of thermal anomalies around the summit between 1 October and 1 January 2015 indicate strong, ongoing eruptive activity.
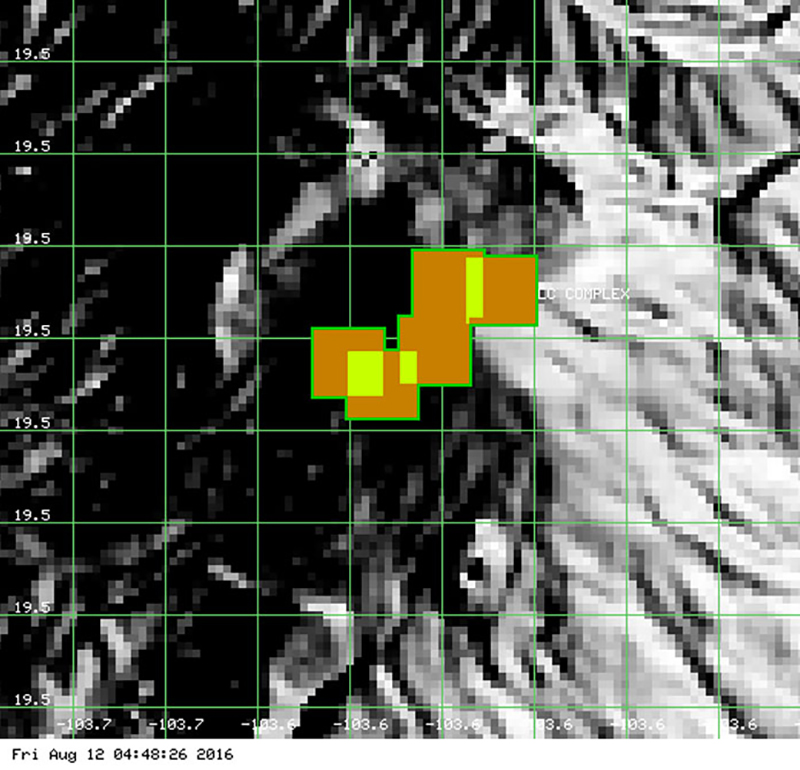 |
Figure 113. MODVOLC thermal signature from Colima for 9 to 11 September, 2014 showing thermal anomaly along SW flank corresponding to lava flow described in text. Image courtesy HIGP - MODVOLC Thermal Alerts System. |
Pyroclastic flows, ash plumes, and dome destruction. A strong explosion on 21 November 2014 produced a pyroclastic density current down the S flank which split into two ravines. The dilute part of the flow had an 8-m-high flow front and traveled 2.9 km along the Montegrande ravine. A denser part of the flow descended the San Antonio ravine and reached a distance of 3.1 km. Washington VAAC confirmed that this explosion produced a volcanic ash cloud that rose to 7 km and drifted 116 km ENE.
Another larger explosion was recorded the night of 30 November 2014 (figure 114). Based on satellite image analysis, the Washington VAAC reported an ash plume at 0300 local time (0800 UTC) that rose to 5 km and drifted 80 km NE, and a second smaller puff at 1540 local time that was below 4.9 km altitude and drifted 45 km E. Two additional plumes of ash were reported by the Washington VAAC in December. A plume on 4 December rose to 4.9 km as drifted a short distance SE, and another on 24 December rose to 6 km and drifted NE. Only a small amount of volcanic ash in the plume was reported by the Colima Volcanic Observatory from the 24 December event. The eruptive sequence of November-December 2014 destroyed the dome that originally formed near the beginning of this eruptive episode in 2013 (figure 115).
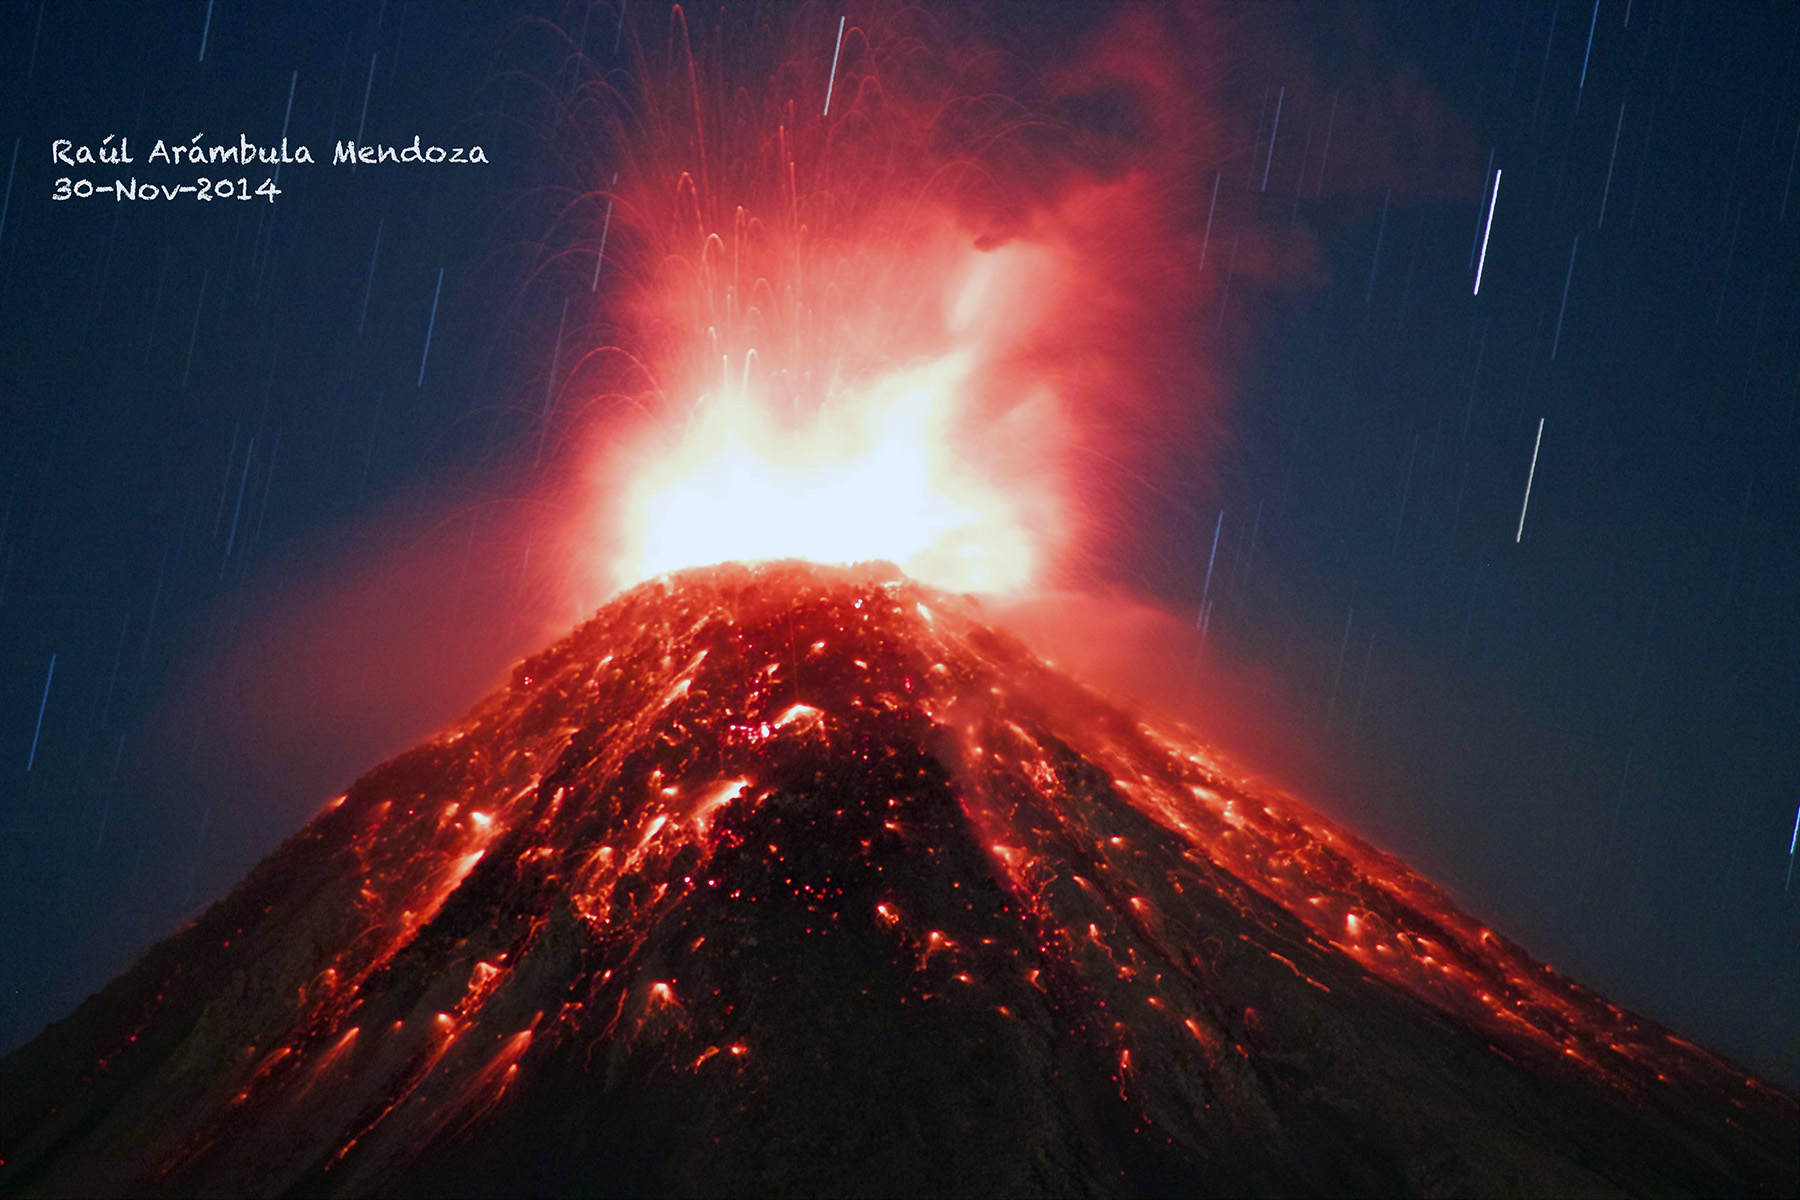 |
Figure 114. Colima's explosion on 30 November 2014. The resulting plume rose to ~5 km. Extended exposure taken at night by R. Arámbula-Mendoza (Centro Universitario de Estudios Vulcanologicos de la Universidad de Colima). |
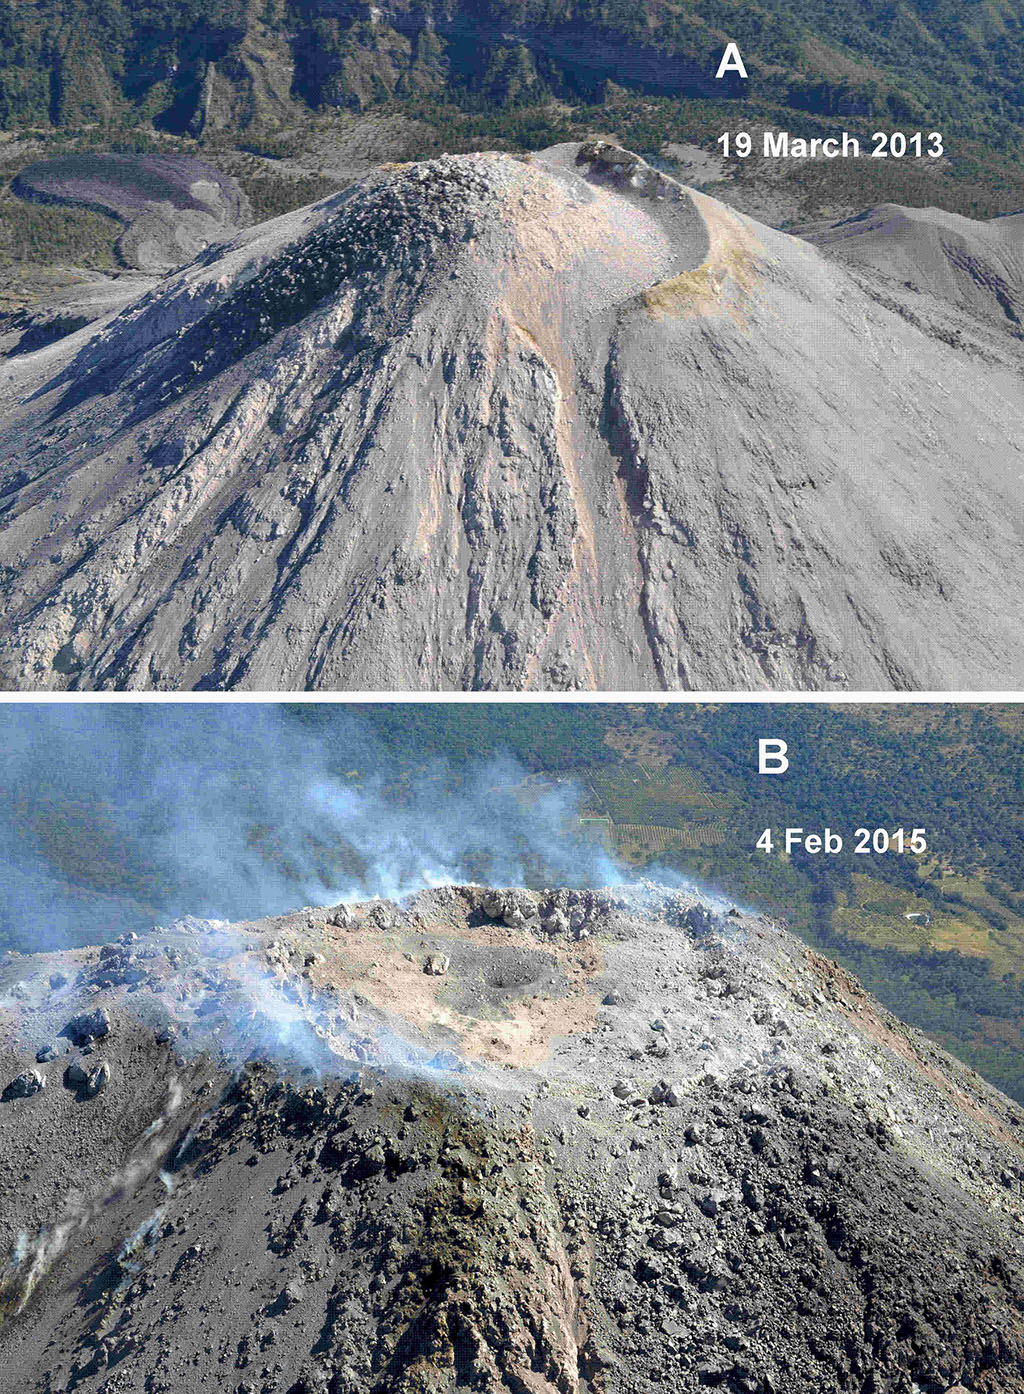 |
Figure 115. Colima's dome and crater area before (A) and after (B) dome destruction associated with the November-December 2014 eruptions. (A) Crater filled with lava dome on 19 March 2013, looking from SSW to NNE. The dome lavas spilling downslope were recorded as a high number of daily rockfall events. (B) Crater on 4 February 2015, looking from NNE to SSW. The summit dome area formed a depression with a nearly flat floor. Photo by Carlos Navarro Ochoa (Centro Universitario de Estudios Vulcanologicos de la Universidad de Colima). |
General Reference: Zobin, V. M., Arámbula, R., Bretón, M., Reyes, G., Plascencia, I., Navarro, C., Téllez, A., Campos, A., González, M., León, Z., Martinez, A, and Ramírez, C., 2015, Dynamics of the January 2013–June 2014 explosive-effusive episode in the eruption of Volcán de Colima, México: insights from seismic and video monitoring. Bulletin of Volcanology, v. 77, no. 4, p. 1-13. DOI: 10.1007/s00445-015-0917-z.
Information Contacts: Observatorio Vulcanológico, Universidad de Colima, Colima, Col. 28045, Mexico; Centro Universitario de Estudios Vulcanologicos y Facultad de Ciencias de la Universidad de Colima, Avenida Universidad 333, Colima, Col., 28045 Mexico (URL: http://portal.ucol.mx/cueiv/); Washington Volcanic Ash Advisory Center (VAAC), Satellite Analysis Branch (SAB), NOAA/NESDIS E/SP23, NOAA Science Center Room 401, 5200 Auth Rd, Camp Springs, MD 20746, USA (URL: http://www.ospo.noaa.gov/Products/atmosphere/vaac/); Hawai'i Institute of Geophysics and Planetology (HIGP), MODVOLC Thermal Alerts System, School of Ocean and Earth Science and Technology (SOEST), Univ. of Hawai'i, 2525 Correa Road, Honolulu, HI 96822, USA (URL: http://modis.higp.hawaii.edu/)
Large eruptions on 21 January and 10 July 2015; nearly constant eruptive activity all year
Frequent historical eruptions at Mexico's Volcán de Colima (also known as Volcán Fuego) date back to the 16th century and include vulcanian and phreatic explosions, lava flows and large debris avalanches. An eruptive episode that began in 2013 with small explosions, rockfalls, lava flows and lahars continued through 2015. Information was provided by the airports in Mexico City and Colima, and pilot observations to the Washington VAAC (Volcanic Ash Advisory Center); the Unidad Estatal de Protección Civil de Colima (UEPCC) issued several bulletins during the year; and a web camera in Carrizalillo located 13 km SW of the volcano and managed by WebCams de Mexico captured numerous photographs and videos of the eruptive activity. There was also substantial coverage of the 2015 eruptions by major news outlets.
Explosive activity in 2015 was extensive, resulting in the Washington VAAC issuing 751 advisories during the year. The plumes reached heights over 7 km many times, and often reach distances of 150 or more kilometers away from the volcano. Two significant eruptions, on 21 January and 10 July, caused extensive ashfall, with a number of evacuations after the July event. In addition, lava flows were active down multiple flanks of the volcano, lava block avalanches were common, and pyroclastic flows were witnessed in July.
Colima began the year with an explosion on 3 January (reported by Informador.mx) that sent an ash plume to 3 km and caused ashfall in seven communities between 26 and 175 km NE, including the municipalities of Zapotlán El Grande (26 km NE), Concepción de Buenos Aires (63 km NE), Manzanilla de la Paz (72 km NE), Ayotlán (175 km NE), Poncitlán (122 km NE), Jamay (128 NE), and Tizapán (95 km NE). Additionally, the communities of Tuxpan (25 km ENE) and Zapotiltic (23 km NE) received repeated ashfall for much of January. On 21 January at 0713 another large explosion (figure 116) rose to 4 km and drifted NE again up to 78 km affecting the communities of Huescalpa (25 km NE), Tuxpan (25 km ENE), Zapotiltic (23 km NE), Atenquique (20 km E), and Mazamitla (78 km NE). MODVOLC showed that thermal anomalies occurred 18 times in January.
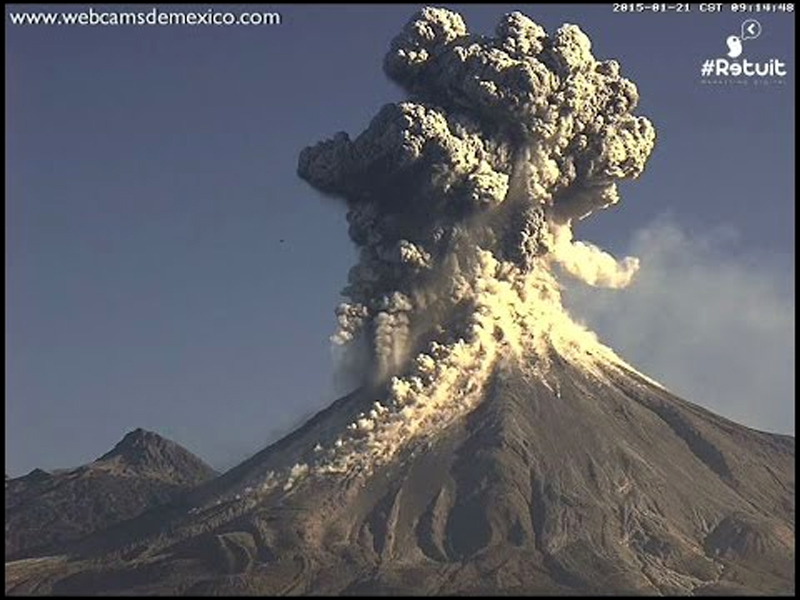 |
Figure 116. Webcam image of Volcan de Colima erupting on 21 January 2015. The webcam is located in Carrizalillo, 13 km SW. The ash plume rose to 4 km and spread ash up to 78 km NE; numerous lava block avalanches came down the flanks. A video of this eruption captured by the webcam can be viewed on the Webcams de Mexico YouTube channel. Courtesy of Webcams de Mexico. |
The UEPCC reported that lava flows were active on the W and WNW flanks on 24 January, and that the recent explosions had partially destroyed the lava dome. By 17 February they reported that a crater about 140 m in diameter had formed at the summit. Persistent ashfall in areas within 30 km of the volcano continued from multiple daily explosions through April. While most of the ash drifted NE or ENE, occasional plumes to the NW or SE were also reported. The Washington VAAC regularly reported plumes between 5.5 and 7.6 km in altitude during February through April. The highest plumes of 8.5 km were reported during the second half of April. The farthest drift of ash plumes were recorded in late February, observed on satellite images by Washington VAAC up to 370 km SE of the volcano. Persistent MODIS thermal anomalies (MODVOLC alerts) several times a week confirmed extensive activity during this time.
The frequency of ash plumes appeared to decrease from May through early July, with ash emissions generally recorded every few days instead of multiple times per day. Altitudes of plumes were 4.3-6.7 km, and the plumes traveled as far as 200 km E. Based on webcam views, the Washington VAAC reported an explosion on 18 June that ejected lava onto the flanks in addition to a probable ash emission. A 7 July UEPCC Bulletin noted that the lava dome had been growing rapidly the previous week, overtopping the crater rim and sending incandescent rock avalanches down the flanks. A gradual increase in the number of emissions and landslides was detected the following week, including pyroclastic flows that traveled up to 2.5 km down the N, W, and S flanks.
A large explosion on 10 July at 1200 sent an ash plume 7.6 km high which drifted 150 km W. Washington VAAC noted intense thermal anomalies and constant ash emissions throughout the day. Mexico's National Civil Protection Agency noted that activity increased that evening at 2017 and was characterized by incandescent material descending the WSW flanks, pyroclastic flows, and ash plumes that rose 4 km above the crater (7.8 km altitude) (figures 117 and 118). Significant ash fell in the communities of La Yerbabuena (8 km SW) (5-cm-thick ash deposits), San Antonio (12 km WSW), Carrizalillo (13 km SW), El Naranjal (12 km SW), and Suchitlán (18 km SSW) in Colima State. The Unidad Estatal de Protección Civil de Colima ordered La Yerbabuena and adjacent villages to evacuate, and some residents in nearby towns self-evacuated. A pyroclastic flow traveled 9 km S. By the next day ashfall was reported 30 km SW in Comala (26 km SW), Villa de Alvarez (30 km SW) and Colima (30 km SW), and the airport, El Aeropuerto Nacional de Colima, suspended operations due to ashfall.
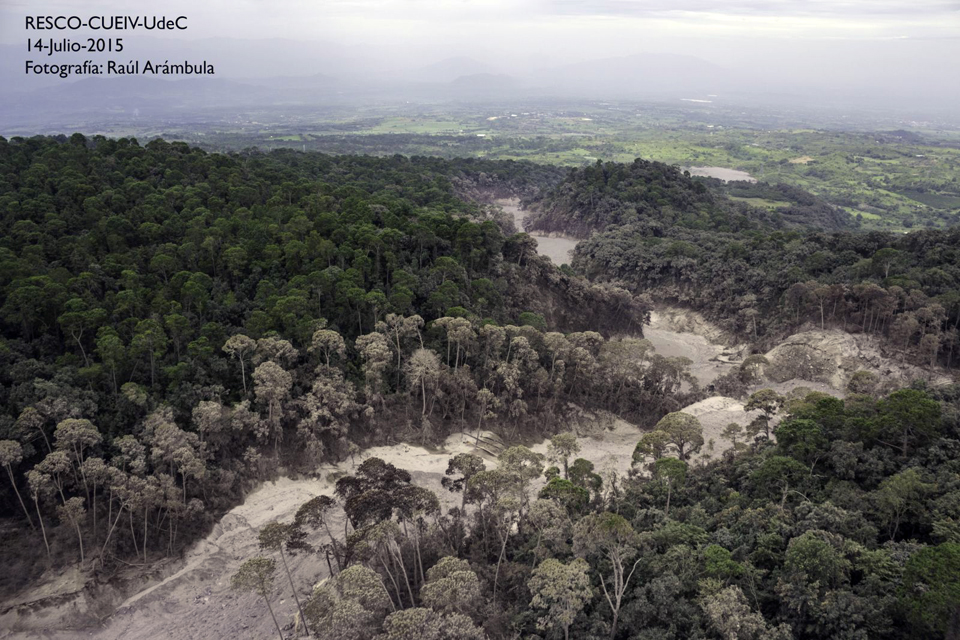 |
Figure 117. Pyroclastic flow deposits from the explosions at Colima on 10 and 11 July 2015. Photo by Raúl Arámbula taken on 14 July 2015, courtesy of Centro Universitario de Estudios e Investigaciones de Vulcanologia, Universidad de Colima (CUEIV-UdC). |
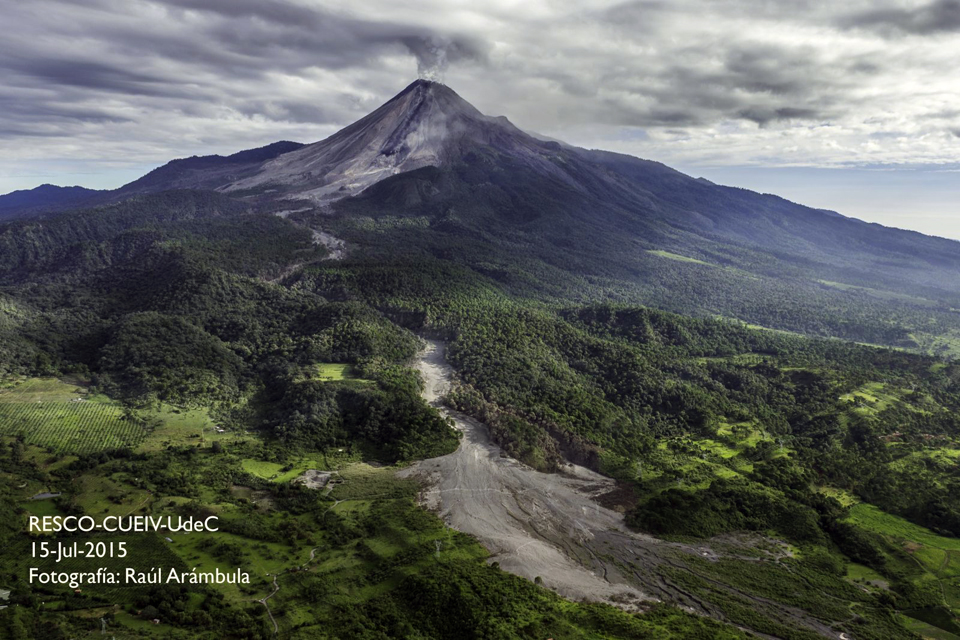 |
Figure 118. A pyroclastic flow traveled 9 km S from Colima on 10 July 2015. Additional pyroclastic flows and incandescent landslides formed during 11-12 July. Steam from the lava flow can be seen near the base of the flank. Photo by Raúl Arámbula, taken 15 July 2015, courtesy of Centro Universitario de Estudios e Investigaciones de Vulcanologia, Universidad de Colima (CUEIV-UdC). |
Ejected incandescent material, ash emissions, incandescent landslides, and pyroclastic flows continued at a moderate level during 11-12 July. Evacuations continued on 12 July, and ashfall persisted in Comala, Villa de Alvarez, and Colima. By 15 July, Washington VAAC reported that ash emissions had ceased, however, incandescent avalanches continued to descend the flanks. MODVOLC showed 54 thermal anomalies for July, confirming the extent of the eruptive activity.
Daily and multiple-daily ash plumes resumed at Colima on 31 July, and continued nearly every day through the end of the year. The ash plumes ranged from 4.2 to 7.6 km high and were observed drifting as far as 150 km away. The wind directions were more variable than earlier in the year, but the plumes drifted generally to the N and W. There were 15 MODVOLC thermal anomaly pixels in August, but only five more for the rest of the year. Three of these were on 14 and 19 December when plumes to 7.6 km were reported by the Washington VAAC.
The UEPCC reported that on 6 October scientists conducted an overflight of Colima and noted that the summit crater was 200 m wide and 50 m deep. Explosions had excavated parts of the crater, exposing the inner wall stratigraphy in the W and N parts of the crater. Fumarolic plumes rose from vents outside of the crater and from the SE interior. Weaker fumarolic activity was present in the NE and W sectors. An explosion on 5 October had produced a small pyroclastic flow that had traveled 2.1 km down the flanks.
Information Contacts: Unidad Estatal de Protección Civil de Colima (UEPCC), Roberto Esperón 1170 Col. de los Trabajadores, C.P. 28020 (URL: http://www.proteccioncivil.col.gob.mx/); Washington Volcanic Ash Advisory Center (VAAC), Satellite Analysis Branch (SAB), NOAA/NESDIS E/SP23, NOAA Science Center Room 401, 5200 Auth Rd, Camp Springs, MD 20746, USA (URL: http://www.ospo.noaa.gov/Products/atmosphere/vaac/); Webcams de Mexico (URL: http://www.webcamsdemexico.com/); Informador.mx (URL: http://www.informador.com.mx/jalisco/2015/568514/6/volcan-colima-rocia-ceniza-sobre-siete-municipios.htm); Hawai'i Institute of Geophysics and Planetology (HIGP), MODVOLC Thermal Alerts System, School of Ocean and Earth Science and Technology (SOEST), Univ. of Hawai'i, 2525 Correa Road, Honolulu, HI 96822, USA (URL: http://modis.higp.hawaii.edu/); Centro Universitario de Estudios e Investigaciones de Vulcanologia, Universidad de Colima (CUEIV-UdC), Colima, Col. 28045, Mexico; Centro Universitario de Estudios Vulcanologicos y Facultad de Ciencias de la Universidad de Colima, Avenida Universidad 333, Colima, Col., 28045 Mexico (URL: http://portal.ucol.mx/cueiv/).
Multiple flows from the lava dome during October-December 2016; frequent explosions and ash emissions until 7 March 2017
Frequent historical eruptions at México's Volcán de Colima (Volcán Fuego) date back to the 16th century and include vulcanian and phreatic explosions, lava flows, large debris avalanches, and pyroclastic flows. The latest eruptive episode began in January 2013. Extensive activity in 2015 included near-constant ash plumes with extensive ashfall, lava flows, and pyroclastic flows (BGVN 41:01). The eruption continued throughout 2016 until the last ash-bearing explosion was reported on 7 March 2017. This report covers the activity through June 2017. Most of the information for this report was gathered from the Unidad Estatal de Protección Civil de Colima (UEPCC), the Centro Universitario de Estudios e Investigaciones de Vulcanologia, Universidad de Colima (CUEIV-UdC), and the Washington Volcanic Ash Advisory Center (VAAC).
Colima was very active from January through April 2016 with hundreds of ash emissions, and a slow-growing lava dome that was first observed on 19 February. Activity decreased during May-September, although multiple explosions with ash plumes still took place most weeks during the period. On 30 September, the lava dome overflowed the crater rim, and sent a slow-moving lava flow and incandescent material down the SW flank. The lava flow continued to grow, reaching over 2 km in length by the end of October. A second lava flow appeared in mid-November, and advanced 1.7 km by early December. Strong ash-bearing explosions during December 2016-January 2017 sent plumes to heights of 4-6 km above the crater. Activity decreased during the second half of February; the last ash-bearing explosion was reported on 7 March 2017. Decreasing seismicity and minor landslides were reported through June 2017 with no further eruptive activity.
Incandescent activity during explosions in January 2016 sent glowing blocks down the flanks of Colima along with spectacular lightning in the ash plumes (figure 119). Ash emissions continued at Colima at a very high rate of multiple daily events, similar to December 2015 (figure 120). The Washington VAAC issued multiple advisories nearly every day during the month with information based on satellite imagery, wind data, webcam images, and notices from the México City Meteorological Watch Office (MWO). The ash plumes rose to altitudes of 4.3-6.7 km and most commonly drifted N or E. They generally drifted a few tens of kilometers before dissipating, but a few were still visible as far as 200 km from the summit.
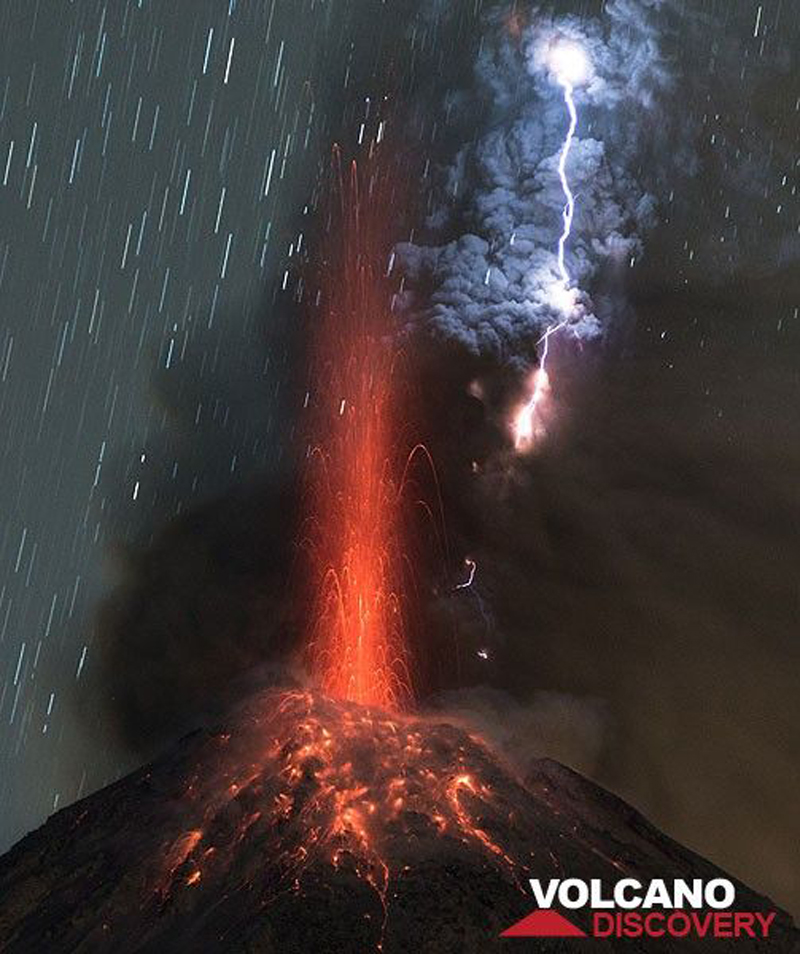 |
Figure 119. Eruption of ash plume and incandescent material at Colima on 3 January 2016. Courtesy of Volcano Discovery. |
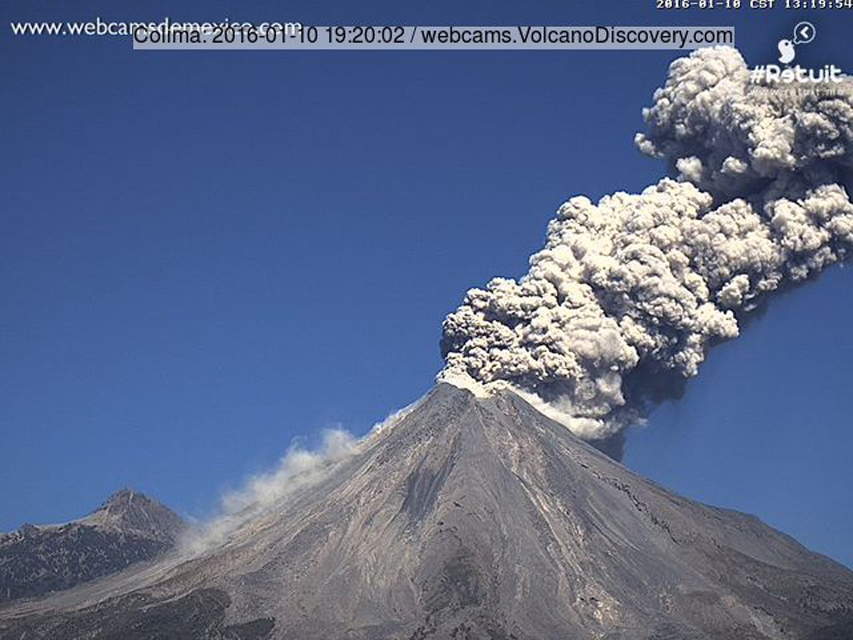 |
Figure 120. Ash eruption at Colima on 10 January 2016. Image from the Webcams de México Colima webcam located at the Laguna de Carrizalillos in Comala, about 25 km SW of the summit. |
Multiple daily ash advisories from the Washington VAAC continued during 1-9 February. They resumed on 14 February, and were intermittent for the rest of the month with similar altitudes and drift directions as those observed during January, but at a slightly lower frequency, decreasing towards the end of the month. On 19 February, CUEIV-UdC researcher Nick Varley observed a lava dome emerging from the floor of the crater (figure 121) during a helicopter overflight. It was estimated to be 25-30 m in diameter and 10 m high inside the almost 300-m-diameter, 50-m-deep summit crater. By 29 February, the dome had increased in size (figure 122), and fumarolic activity had also increased on the SE side of the summit crater.
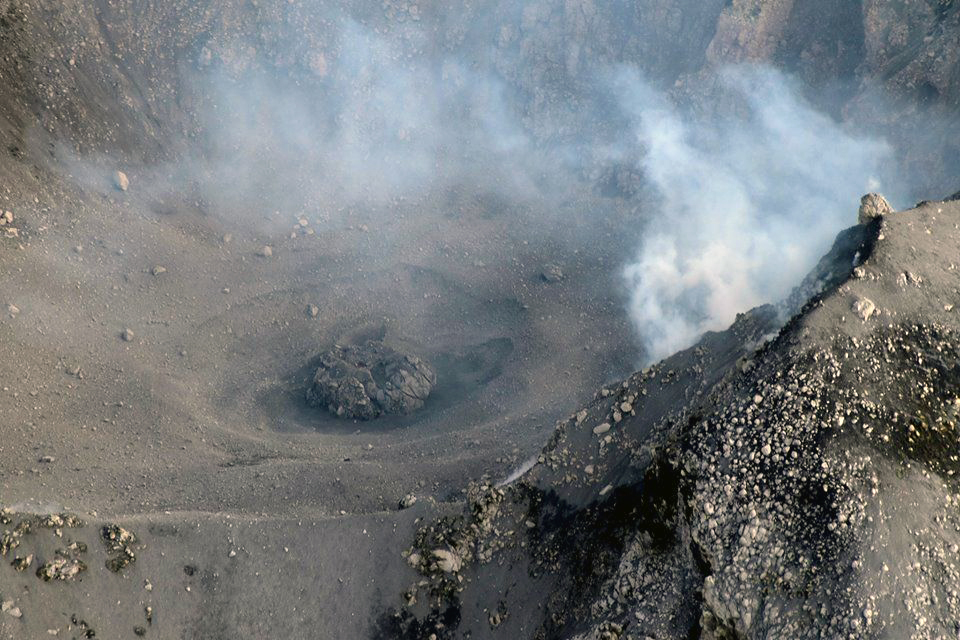 |
Figure 121. A new lava dome in the summit crater of Colima on 19 February 2016. Courtesy of CUEIV-UdC (http://www.ucol.mx/enterate/nota.php?docto=2473). |
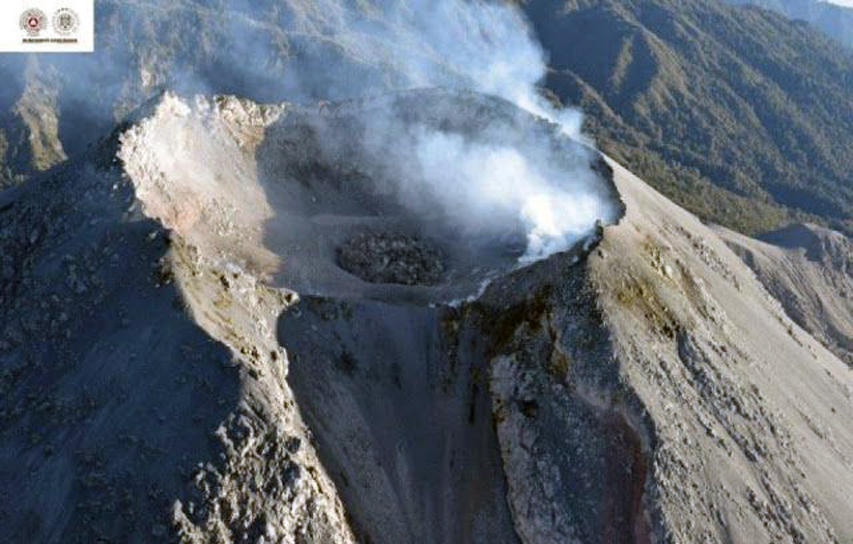 |
Figure 122. The lava dome at Colima photographed on 29 February 2016 was noticeably larger than when first photographed ten days earlier. Courtesy of SkyAlert (2 March 2016). |
Ash plume heights during March 2016 were slightly lower than during February (4.0-6.1 km altitude). Most of the plumes continued to drift NE or SE, and most dissipated within 50 km. During the first week of April, scientists observed fresh ashfall covering the dome at the center of the crater, which had not changed significantly since the previous overflight at the end of February. Persistent ash plumes continued throughout April with a three-minute-long ash emission recorded on 28 April by Colima's webcam.
The frequency of ash emissions decreased during May 2016 and further still during June 2016, when advisories from the Washington VAAC only appeared during five days of the month (1, 4, 13, 23, 30); the plume heights remained similar to previous months, except for a 16 May plume observed moving ENE at 7.6 km. After a two week pause, ash emissions resumed on 17 July with plume heights ranging from 4.3 to 7.3 km altitude through the end of the month. During the second half of August and for part of September, intermittent plumes did not exceed 6.1 km altitude, and dissipated within a few tens of kilometers of the summit.
The Unidad Estatal de Protección Civil de Colima reported that on 26 September seismicity at Colima increased, and incandescence appeared at the crater. On 27 September, small landslides originating from the growing lava dome traveled 100 m down the S flank. By the evening of 30 September, the webcam showed intense activity and crater incandescence as lava spilled over the crater rim and flowed down the SW flank (figure 123). An intense thermal anomaly was visible in short-wave infrared satellite images. An ash plume detected on 1 October in satellite images drifted almost 40 km S and SW; the webcam recorded explosions and pyroclastic flows down the flanks. The OMI instrument on the Aura satellite also recorded significant SO2 plumes drifting W and SW from Colima on 30 September and 1 October (figure 124).
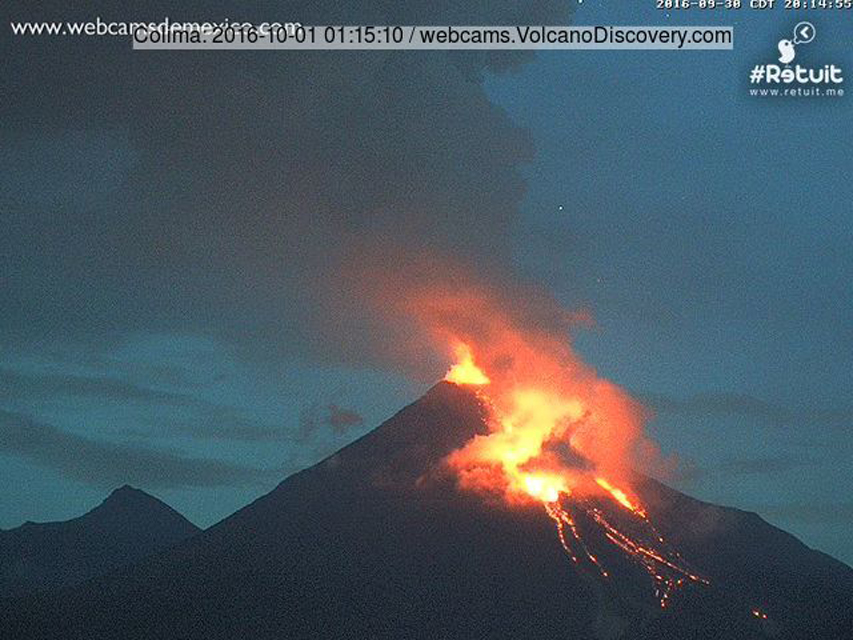 |
Figure 123. Intense activity at Colima during the late evening of 30 September 2016 (2014 CST), as a new lava flow emerged from the summit crater and moved down the SW flank. Image from the Webcams de México Colima webcam located at the Laguna de Carrizalillos in Comala, about 25 km SW of the summit. |
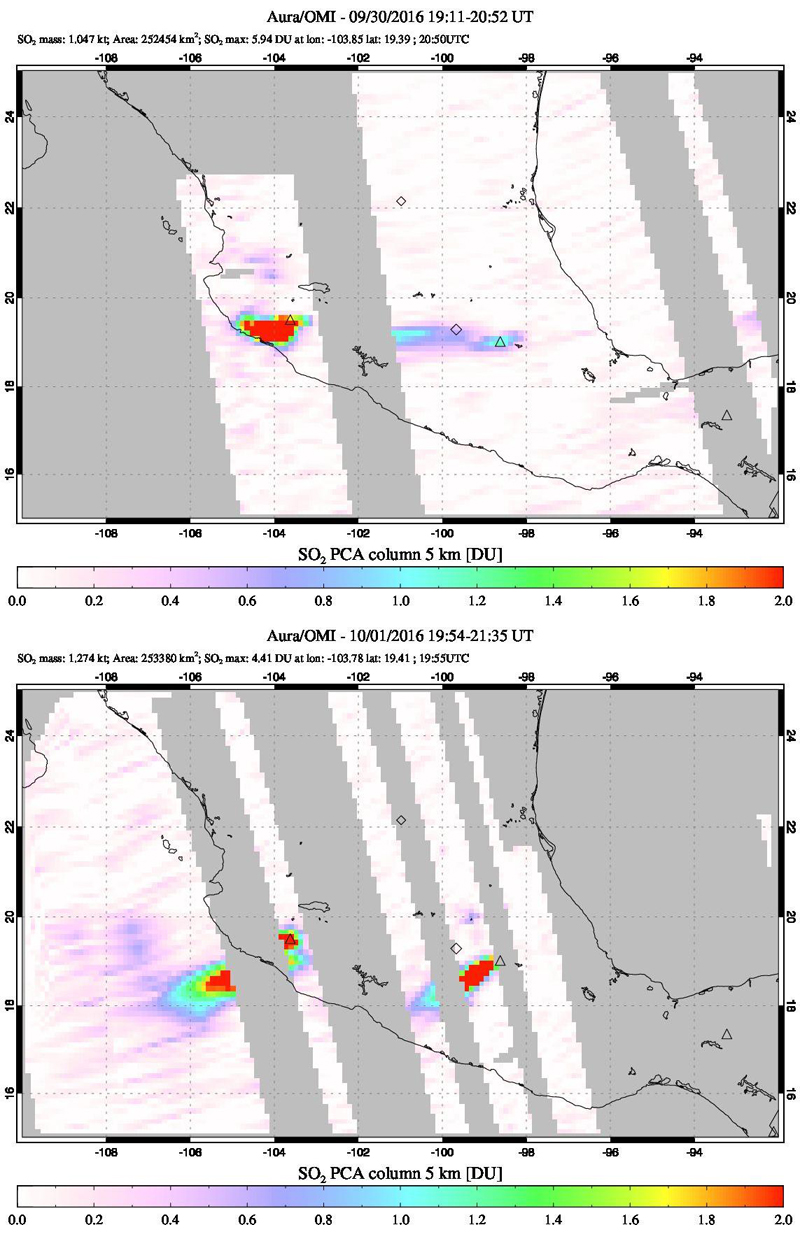 |
Figure 124. Sulfur dioxide plumes from Colima were captured by the OMI instrument on the Aura satellite on 30 September (upper) and 1 October 2016 (lower). Colima is on the left (west) side, near the coast. The other SO2 plume in central Mexico on the 1 October is from Popocatépetl. The red pixels indicate Dobson Unit (DU) values greater than 2. DU are a measure of molecular density of SO2 in the atmosphere. Courtesy of NASA Goddard Space Flight Center. |
According to news articles (Noticieros Televisa), during 29 September-1 October gas-and-ash plumes rose 4 km and caused ashfall in nearby areas, including La Becererra, La Yerbabuena, San Antonio, and El Jabali in the municipality of Comala (26 km SW), Montitlán in the municipality of Cuauhtémoc (34 km NW), and Juan Barragan in Tonila, Jalisco (14 km SE). On 1 October the Colima State government stated that the communities of La Yerbabuena (80 people) and La Becerrera (230 people) were preemptively evacuated, and an exclusion zone was extended to 12 km on the SW side. A news article noted that Juan Barragan was also evacuated.
The lava flow continued down the flank with incandescent rockfalls (figure 125) and occasional pyroclastic flows; by 4 October it had reached the base of the cone. The volume of the lava dome was estimated to have exceeded 1.2 million cubic meters (figure 126). By 8 October 2016, the lava flow was about 2,000 m long and 270 m wide at its front at the base of the cone. The Washington VAAC reported a strong hotspot consistent with the lava flow in satellite imagery on 9 October. On 13 October, they noted an ash plume that had drifted over 200 km W from the summit. Strong, multi-pixel, daily thermal alerts were issued from MODVOLC during 1-14 October. On 21 October, UEPCC reported that lava continued to flow down the S flank. It was 2.3 km long, 320 m wide, and had an estimated volume of 21 million m3.
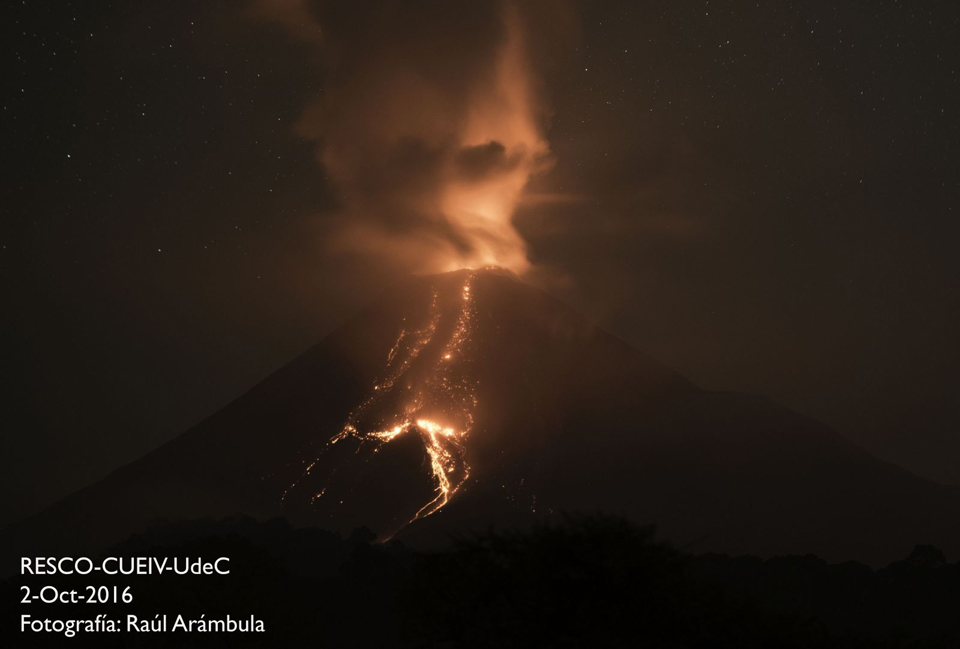 |
Figure 125. A lava flow descends the S flank of Colima on 2 October 2016. Image by Raúl Arámbula, courtesy of Red Sismologica Telemetrica del Estado de Colima-Centro Universitario de Estudios e Investigaciones de Vulcanologia-Universidad de Colima (RESCO-CUEIV-UdeC). |
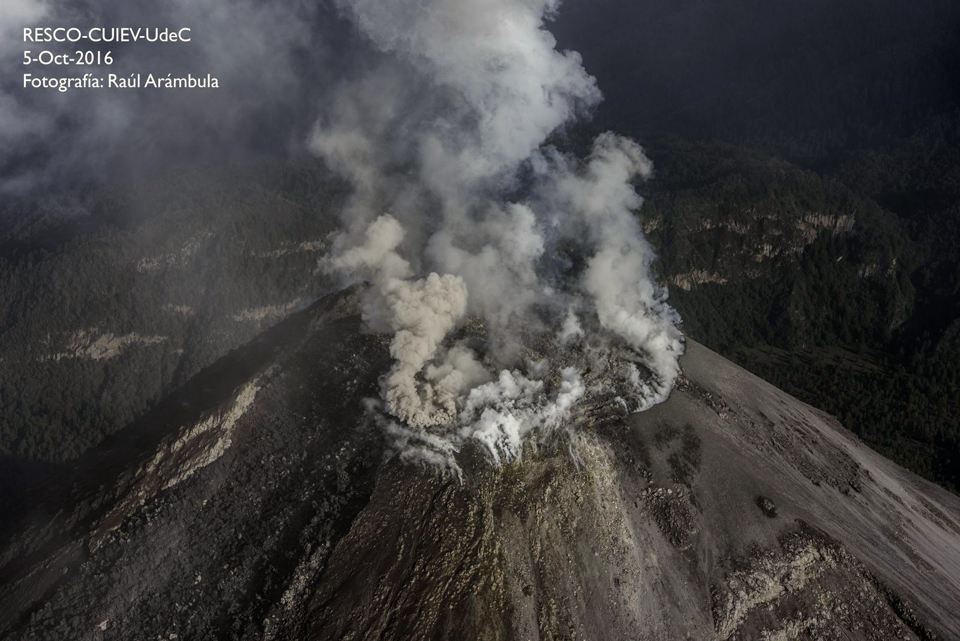 |
Figure 126. The lava dome overflowing the summit crater at Colima on 5 October 2016. Image by Raúl Arámbula, courtesy of RESCO-CUIEV-UdeC. |
Multiple ash plumes rose to altitudes of 5.5-8.2 km and drifted 25-40 km S, SW, and W during 2-4 October. Ashfall was reported in areas on the S and SW flanks. Ash explosions were also frequent throughout the rest of October, with plumes rising to altitudes of 4.3-7 km on many days (figure 127), until they ceased on 4 November for several weeks.
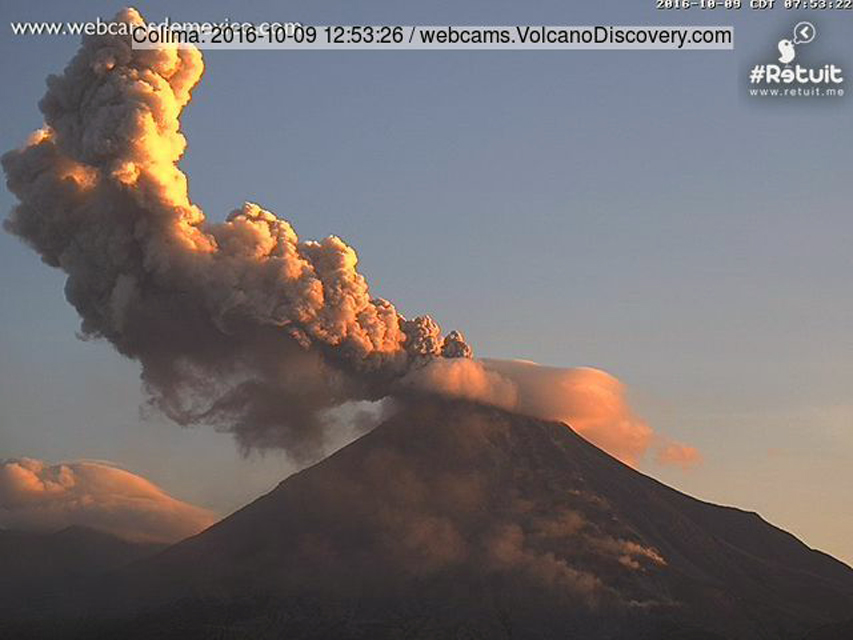 |
Figure 127. Ash explosion at Colima on 9 October 2016. Steam in the foreground is from the lava flow travelling down the SW flank. Image from the Webcams de México Colima webcam located at the Laguna de Carrizalillos in Comala, about 25 km SW of the summit. |
Effusive activity increased again at the very end of October 2016 with the growth of a new lava dome inside the summit crater. By 17 November, a new lava flow was also visible on the S flank (figure 128); it was reported to be about 500 m long by 20 November. After intermittent MODVOLC thermal alerts during late October and early November, they intensified with daily multi-pixel alerts between 15 November and 1 December.
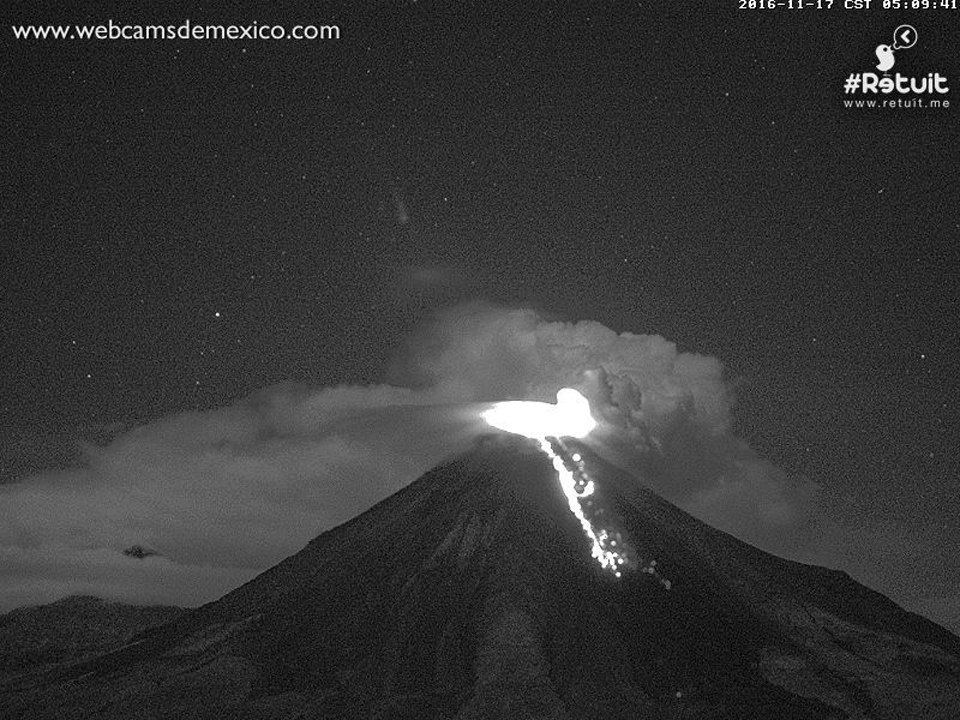 |
Figure 128. A new lava flow on the S flank of Colima on 17 November 2016. Image from the Webcams de México Colima webcam located at the Laguna de Carrizalillos in Comala, about 25 km SW of the summit. |
During 26-28 November 2016, a brief episode of ash emissions sent plumes to 4.9-5.5 km altitude that drifted W, N, and NE as far as 75 km before dissipating. Observations of Colima made on 5 December by UEPCC during a helicopter overflight indicated that the lava flow on the S flank was slowing its advance, and had reached about 1,700 m in length (figure 129).
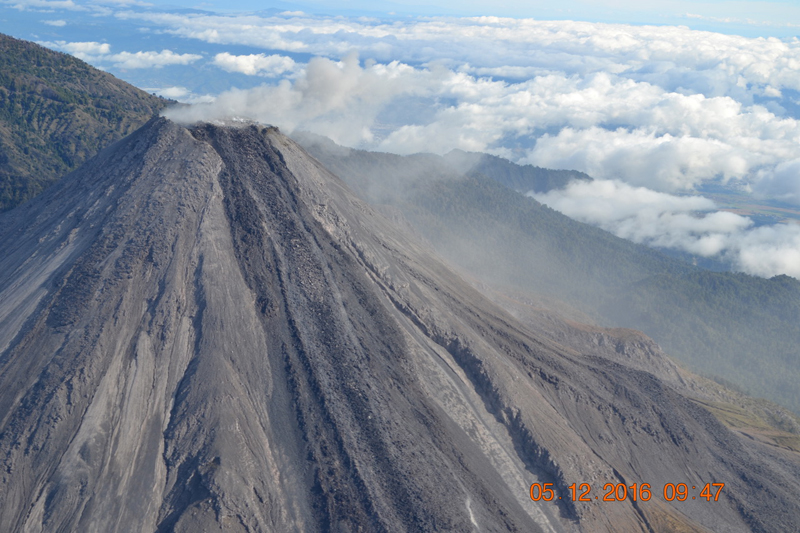 |
Figure 129. The lava flow on the S flank of Colima had reached 1.7 km in length on 5 December 2016. Courtesy of UEPCC. |
A new series of strong explosions with abundant ash emissions began on 7 December that continued through the end of the month. Multiple daily ash emissions appeared in both the webcam and satellite imagery. The plume on 8 December rose to 7.3 km and extended about 185 km NE of the summit near Lago de Chapala before dissipating. Incandescence during the explosions was visible at night, and glowing blocks were common on the upper flanks.
Ash clouds from multiple emissions were observed drifting W to WSW on 14 December at altitudes from 6.1 to 7.9 km (about 4 km above the summit). These plumes were visible 370 km WSW of the summit the next day. Plumes rose as high as 9.1 km altitude on 15 December, and spread N and NW. A series of strong, multiple daily explosions during 16-18 December included some of the strongest explosions since July 2015 (figure 130). Many of the multiple daily explosions during 19-31 December had plumes rising over 7 km in altitude and drifting over 100 km from the summit before dissipating. MODVOLC thermal alerts appeared on 13 days during December 2016.
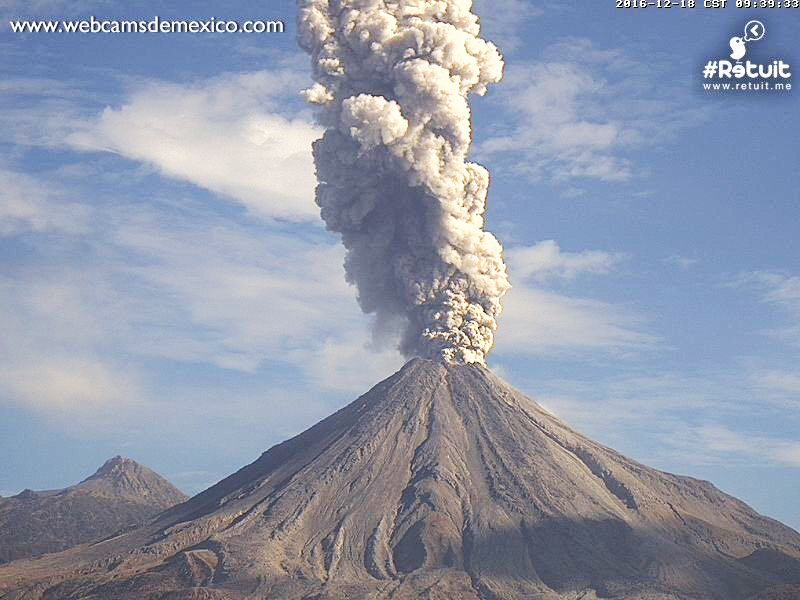 |
Figure 130. A strong explosion at Colima on 18 December 2016. Image from the Webcams de México Colima webcam located at the Laguna de Carrizalillos in Comala, about 25 km SW of the summit. |
Frequent strong explosive activity continued during January 2017. For the first three weeks of the month, the multiple daily plumes rose to altitudes of 4.6-7.6 km, drifting in multiple directions, some as far as 135 km. The UEPCC reported that at 0027 on 18 January a moderate-to-large explosion ejected incandescent material as far as 2 km onto the W, SW, SE, and N flanks. Based on webcam and satellite images, the México City MWO, and pilot observations, the Washington VAAC reported that during 18-24 January ash plumes rose to altitudes of 4.1-6.7 km and drifted in multiple directions. On 19 January, strong explosions were recorded by the webcam and noted by the Jalisco Civil Protection Agency (figure 131); they also reported ashfall in Comala and Cuauhtémoc. A strong thermal anomaly was identified in satellite images. Remnant ash clouds from the explosions were centered about 350 km SE on 20 January. A large ash plume rose to an altitude of 10.7 km on 23 January and drifted NE; several plumes that rose to over 7 km altitude were reported through the end of January. MODVOLC thermal alerts were issued on 11 days during January, but no further alerts appeared through June 2017.
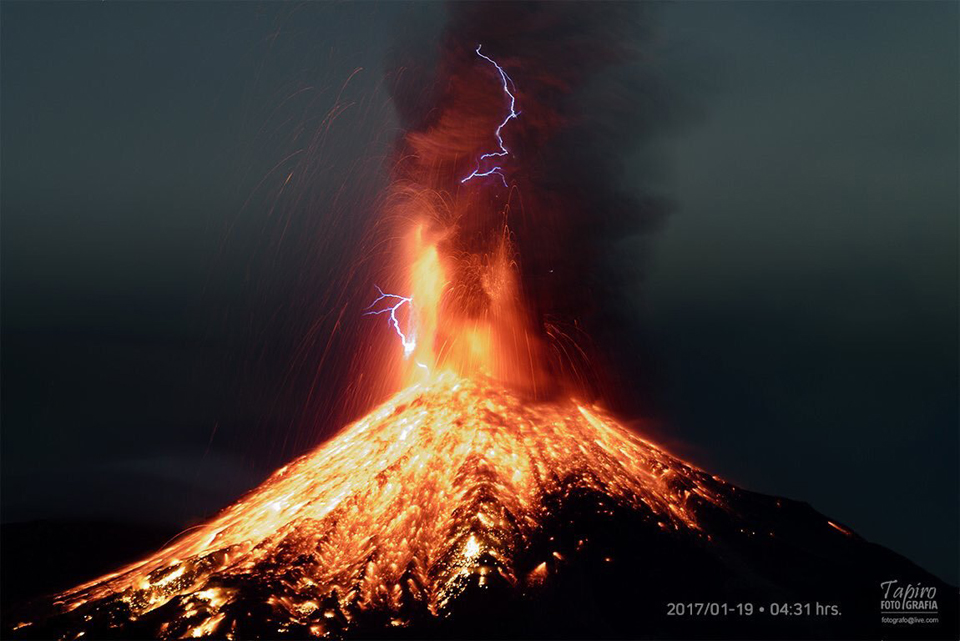 |
Figure 131. Eruption at Colima at 0431 on 19 January 2017. Courtesy of Sergio Tapiro. |
The CUEIV-UdC reported that a large explosion at 1732 on 3 February 2017 generated an ash plume that rose 6 km above the crater rim and drifted SSW (figure 132). The Washington VAAC reported the plume at 7.6 km altitude (3.7 km above the crater) shortly before midnight on 4 February. The CUEIV-UdC also noted that a small pyroclastic flow traveled down the E flank. Their report stated that the internal crater was about 250 m in diameter and 50-60 m deep; previous lava domes had been destroyed in late September and mid-November 2016.
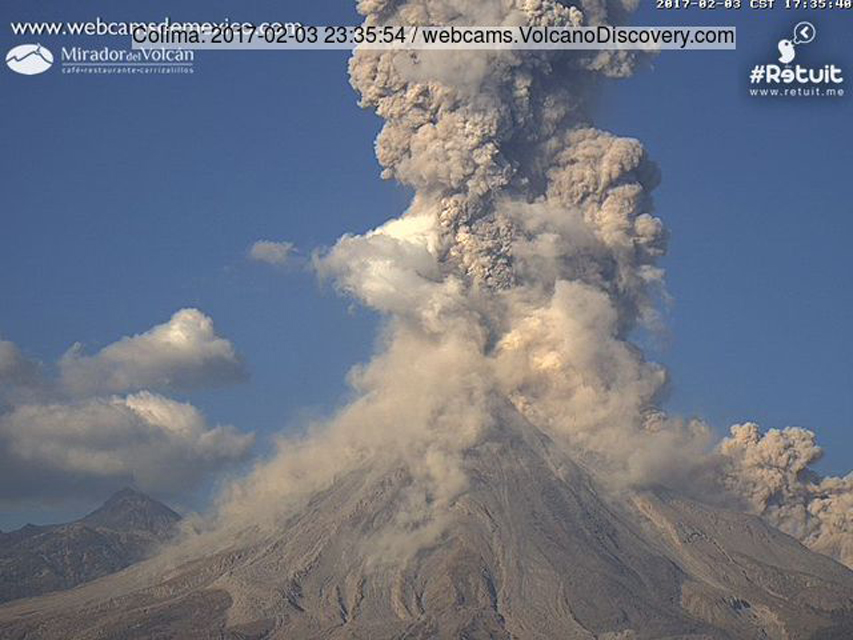 |
Figure 132. An explosion at Colima on 3 February 2017 caused an ash plume that the Universidad de Colima reported as rising to six km above the crater, drifting SSW. A small pyroclastic flow descended the E flank. Image from the Webcams de México Colima webcam located at the Laguna de Carrizalillos in Comala, about 25 km SW of the summit. |
A brief period of low-intensity explosions during 10-16 February 2017 generated ash plumes reported by the Washington VAAC at 4-5.2 km altitude. There were no further aviation alerts issued during February. According to CUEIV-UdC, a few low-intensity explosions occurred during 3-16 March. The ash plume on 7 March rose about 2 km above the crater and drifted SW. During an overflight in the middle of March, researchers from CUEIV-UdC noted degassing from small explosion craters on the floor of the main crater; there was no evidence of effusive activity or growth of a new dome. After the middle of March, seismicity steadily decreased; CUEIV-UdC reported landslides every week through June, but no additional ash emissions were reported.
The MIROVA radiative power plot of the MODIS thermal anomaly data clearly shows the thermal activity at Colima during September 2016-February 2017 (figure 133).
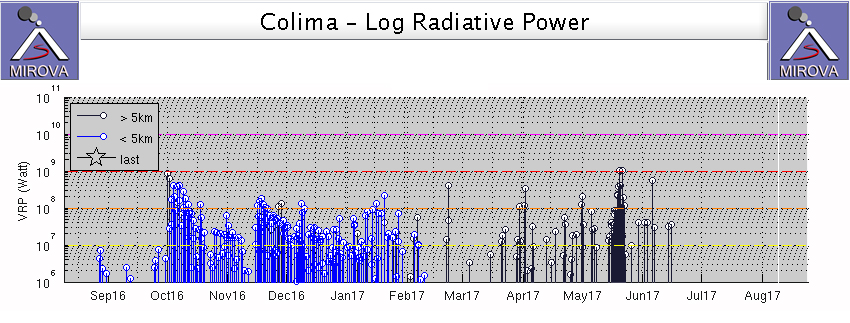 |
Figure 133. MIROVA log radiative power data from MODIS thermal anomaly satellite information clearly shows the strong thermal anomalies from the lava flows at Colima during September 2016-February 2017. The thermal anomalies shown in black after February 2017 are not located on the edifice and are not related to volcanic activity. Courtesy of MIROVA. |
Information Contacts: Unidad Estatal de Protección Civil de Colima (UEPCC), Roberto Esperón 1170 Col. de los Trabajadores, C.P. 28020 (URL: http://www.proteccioncivil.col.gob.mx/); Centro Universitario de Estudios e Investigaciones de Vulcanologia (CUEIV-UdC), Universidad de Colima, Colima, Col. 28045, México; Centro Universitario de Estudios Vulcanologicos y Facultad de Ciencias de la Universidad de Colima, Avenida Universidad 333, Colima, Col., 28045 México (URL: http://portal.ucol.mx/cueiv/); Washington Volcanic Ash Advisory Center (VAAC), Satellite Analysis Branch (SAB), NOAA/NESDIS OSPO, NOAA Science Center Room 401, 5200 Auth Rd, Camp Springs, MD 20746, USA (URL: http://www.ospo.noaa.gov/Products/atmosphere/vaac/, archive at: http://www.ssd.noaa.gov/VAAC/archive.html); Hawai'i Institute of Geophysics and Planetology (HIGP), MODVOLC Thermal Alerts System, School of Ocean and Earth Science and Technology (SOEST), Univ. of Hawai'i, 2525 Correa Road, Honolulu, HI 96822, USA (URL: http://modis.higp.hawaii.edu/); MIROVA (Middle InfraRed Observation of Volcanic Activity), a collaborative project between the Universities of Turin and Florence (Italy) supported by the Centre for Volcanic Risk of the Italian Civil Protection Department (URL: http://www.mirovaweb.it/); NASA Goddard Space Flight Center (NASA/GSFC), Global Sulfur Dioxide Monitoring Page, Atmospheric Chemistry and Dynamics Laboratory, 8800 Greenbelt Road, Goddard, Maryland, USA (URL: https://so2.gsfc.nasa.gov/); Webcams de México (URL: http://www.webcamsdemexico.com/); Tom Pfeiffer, Volcano Discovery (URL: http://www.volcanodiscovery.com/); SkyAlert, Twitter (@SkyAlertMx) (URL: https://twitter.com/SkyAlertMx/status/705188862318882816); Sergio Tapiro, Twitter (@tapirofoto); Noticieros Televisa (URL: http://noticeros.televisa.com).
Renewed volcanism after two years of quiet; explosion on 11 May 2019
Frequent historical eruptions at Volcán de Colima date back to the 16th century and include explosive activity, lava flows, and large debris avalanches. The most recent eruptive episode began in January 2013 and continued through March 2017. Previous reports have covered activity involving ash plumes with extensive ashfall, lava flows, lahars, and pyroclastic flows (BGVN 41:01 and 42:08). In late April 2019, increased seismicity related to volcanic activity began again. This report covers activity through July 2019. The primary source of information was the Centro Universitario de Estudios e Investigaciones de Vulcanologia, Universidad de Colima (CUEIV-UdC).
On 11 May 2019, CUEIV-UdC reported an explosion that was recorded by several monitoring stations. A thermal camera located south of Colima captured thermal anomalies associated with the explosion as well as intermittent degassing, which mainly consisted of water vapor (figure 134). A report from the Unidad Estatal de Protección Civil de Colima (UEPCC), and seismic and infrasound network data from CUEIV-UdC, recorded about 60 high-frequency events, 16 landslides, and 14 low-magnitude explosions occurring on the NE side of the crater during 11-24 May. Drone imagery showed fumarolic activity occurring on the inner wall of this crater on 22 May (figure 135).
|
Figure 134. Gas emissions from Colima during the 11 May 2019 eruption as seen from the Naranjal station. Courtesy of CUEIV-UdC (Boletin Seminal de la Actividad del Volcan de Colima 17 mayo 2019 no 121). |
|
Figure 135. A drone photo showing fumarolic activity occurring within the NE wall of the crater at Colima on 22 May 2019. Courtesy of CUEIV-UdC (Boletin Seminal de la Actividad del Volcan de Colima 24 mayo 2019 no 122). |
Small explosions and gas-and-steam emissions continued intermittently through mid-July 2019 concentrated on the NE side of the crater. An overflight on 9 July 2019 revealed that subsidence from the consistent activity slightly increased the diameter of the vent; other areas within the crater also showed evidence of subsidence and some collapsed material on the outer W wall (figure 136). During the weeks of 19 and 26 July 2019, monitoring cameras and seismic data recorded eight lahars.
|
Figure 136. A drone photo of the crater at Colima on 8 July 2019 shows continuing fumarolic activity and evidence of a collapsed wall on the W exterior side. Courtesy of CUEIV-UdC (Boletin Seminal de la Actividad del Volcan de Colima 12 julio 2019 no 129). |
Information Contacts: Centro Universitario de Estudios e Investigaciones de Vulcanologia, Universidad de Colima (CUEIV-UdC), Colima, Col. 28045, Mexico; Centro Universitario de Estudios Vulcanologicos y Facultad de Ciencias de la Universidad de Colima, Avenida Universidad 333, Colima, Col. 28045, Mexico (URL: http://portal.ucol.mx/cueiv/); Unidad Estatal de Protección Civil, Colima, Roberto Esperón No. 1170 Col. de los Trabajadores, C.P. 28020, Mexico (URL: http://www.proteccioncivil.col.gob.mx/).
|
|
||||||||||||||||||||||||||||
There is data available for 79 confirmed eruptive periods.
2019 May 11 - 2019 Jul 12 Confirmed Eruption (Explosive / Effusive) VEI: 1
| Episode 1 | Eruption (Explosive / Effusive) | ||||||||||||||
|---|---|---|---|---|---|---|---|---|---|---|---|---|---|---|
| 2019 May 11 - 2019 Jul 12 | Evidence from Observations: Reported | |||||||||||||
|
List of 1 Events for Episode 1
|
||||||||||||||
2013 Jan 6 - 2017 Mar 7 Confirmed Eruption (Explosive / Effusive) VEI: 3
| Episode 1 | Eruption (Explosive / Effusive) | Summit crater | |||||||||||||||||||||||||||||||||||||||||||||||||||||||||||||||||||||||||||||||||||||||||||||||||||||||||||||||||||||||||||||||||||||||||||||||||||||||||||||||||||||||||||||||||||||||||||||||||||||||||||||||||||||||||||||||
|---|---|---|---|---|---|---|---|---|---|---|---|---|---|---|---|---|---|---|---|---|---|---|---|---|---|---|---|---|---|---|---|---|---|---|---|---|---|---|---|---|---|---|---|---|---|---|---|---|---|---|---|---|---|---|---|---|---|---|---|---|---|---|---|---|---|---|---|---|---|---|---|---|---|---|---|---|---|---|---|---|---|---|---|---|---|---|---|---|---|---|---|---|---|---|---|---|---|---|---|---|---|---|---|---|---|---|---|---|---|---|---|---|---|---|---|---|---|---|---|---|---|---|---|---|---|---|---|---|---|---|---|---|---|---|---|---|---|---|---|---|---|---|---|---|---|---|---|---|---|---|---|---|---|---|---|---|---|---|---|---|---|---|---|---|---|---|---|---|---|---|---|---|---|---|---|---|---|---|---|---|---|---|---|---|---|---|---|---|---|---|---|---|---|---|---|---|---|---|---|---|---|---|---|---|---|---|---|---|---|---|---|---|---|---|---|---|---|---|---|---|---|---|---|---|
| 2013 Jan 6 - 2014 May 23 | Evidence from Observations: Reported | |||||||||||||||||||||||||||||||||||||||||||||||||||||||||||||||||||||||||||||||||||||||||||||||||||||||||||||||||||||||||||||||||||||||||||||||||||||||||||||||||||||||||||||||||||||||||||||||||||||||||||||||||||||||||||||||
|
List of 43 Events for Episode 1 at Summit crater
|
||||||||||||||||||||||||||||||||||||||||||||||||||||||||||||||||||||||||||||||||||||||||||||||||||||||||||||||||||||||||||||||||||||||||||||||||||||||||||||||||||||||||||||||||||||||||||||||||||||||||||||||||||||||||||||||||
| Episode 2 | Eruption (Explosive / Effusive) | Summit crater | ||||||||||||||||||||||||||||||||||||||||||||||||||||||||||||||||||||||||||||||||||||||||||||||||||||||||||||||||||||||||||||||||||||||||||||||||||||||||||||||||||||||||||||||||||||||||||||||||||||||||||||||||||||||||||||||||||||||||||||||||||||||||||||||||||||||||||||||||||||||||||||||||||||||||||||||||||||||||||||||||||||||||||||||||||||||||||||||||||||||||||||||||||||||||||||||||||||||||||||||||||||||||||||||||||||||||||||||||||||||||||||||||||||||||||||||||||||||||||||||||||||||||||||||||||||||||||||||||||||||||||||||||||||||||||||||||||||||||||||||||||||||||||||||||||||||||||||||||||||||||||||||||||||||||||||||||||||||||||||||||||||||||||||||||||||||||||||||||||||||||||||||||||||||||||||||||||||||||||||||||||||||||||||||||||||||||||||||||||||||||||||||||||||||||||||||||||||||||||||||||||||||||||||||||||||||||||||||||||||||||||||||||||||||||||||||||||||||||||||||||||||||||||||||||||||||||||||||||||||||||||||||||||||||||||||||||||||||||||||||||||||||||||||||||||||||||||||||||||||||
|---|---|---|---|---|---|---|---|---|---|---|---|---|---|---|---|---|---|---|---|---|---|---|---|---|---|---|---|---|---|---|---|---|---|---|---|---|---|---|---|---|---|---|---|---|---|---|---|---|---|---|---|---|---|---|---|---|---|---|---|---|---|---|---|---|---|---|---|---|---|---|---|---|---|---|---|---|---|---|---|---|---|---|---|---|---|---|---|---|---|---|---|---|---|---|---|---|---|---|---|---|---|---|---|---|---|---|---|---|---|---|---|---|---|---|---|---|---|---|---|---|---|---|---|---|---|---|---|---|---|---|---|---|---|---|---|---|---|---|---|---|---|---|---|---|---|---|---|---|---|---|---|---|---|---|---|---|---|---|---|---|---|---|---|---|---|---|---|---|---|---|---|---|---|---|---|---|---|---|---|---|---|---|---|---|---|---|---|---|---|---|---|---|---|---|---|---|---|---|---|---|---|---|---|---|---|---|---|---|---|---|---|---|---|---|---|---|---|---|---|---|---|---|---|---|---|---|---|---|---|---|---|---|---|---|---|---|---|---|---|---|---|---|---|---|---|---|---|---|---|---|---|---|---|---|---|---|---|---|---|---|---|---|---|---|---|---|---|---|---|---|---|---|---|---|---|---|---|---|---|---|---|---|---|---|---|---|---|---|---|---|---|---|---|---|---|---|---|---|---|---|---|---|---|---|---|---|---|---|---|---|---|---|---|---|---|---|---|---|---|---|---|---|---|---|---|---|---|---|---|---|---|---|---|---|---|---|---|---|---|---|---|---|---|---|---|---|---|---|---|---|---|---|---|---|---|---|---|---|---|---|---|---|---|---|---|---|---|---|---|---|---|---|---|---|---|---|---|---|---|---|---|---|---|---|---|---|---|---|---|---|---|---|---|---|---|---|---|---|---|---|---|---|---|---|---|---|---|---|---|---|---|---|---|---|---|---|---|---|---|---|---|---|---|---|---|---|---|---|---|---|---|---|---|---|---|---|---|---|---|---|---|---|---|---|---|---|---|---|---|---|---|---|---|---|---|---|---|---|---|---|---|---|---|---|---|---|---|---|---|---|---|---|---|---|---|---|---|---|---|---|---|---|---|---|---|---|---|---|---|---|---|---|---|---|---|---|---|---|---|---|---|---|---|---|---|---|---|---|---|---|---|---|---|---|---|---|---|---|---|---|---|---|---|---|---|---|---|---|---|---|---|---|---|---|---|---|---|---|---|---|---|---|---|---|---|---|---|---|---|---|---|---|---|---|---|---|---|---|---|---|---|---|---|---|---|---|---|---|---|---|---|---|---|---|---|---|---|---|---|---|---|---|---|---|---|---|---|---|---|---|---|---|---|---|---|---|---|---|---|---|---|---|---|---|---|---|---|---|---|---|---|---|---|---|---|---|---|---|---|---|---|---|---|---|---|---|---|---|---|---|---|---|---|---|---|---|---|---|---|---|---|---|---|---|---|---|---|---|---|---|---|---|---|---|---|---|---|---|---|---|---|---|---|---|---|---|---|---|---|---|---|---|---|---|---|---|---|---|---|---|---|---|---|---|---|---|---|---|---|---|---|---|---|---|---|---|---|---|---|---|---|---|---|---|---|---|---|---|---|---|---|---|---|---|---|---|---|---|---|---|---|---|---|---|---|---|---|---|---|---|---|---|---|---|---|---|---|---|---|---|---|---|---|---|---|---|---|---|---|---|---|---|---|---|---|---|---|---|---|---|---|---|---|---|---|---|---|---|---|---|---|---|---|---|---|---|---|---|---|---|---|---|---|---|---|---|---|---|---|---|---|---|---|---|---|---|---|---|---|---|---|---|---|---|---|---|---|---|---|---|---|---|---|---|---|---|---|---|---|---|---|---|---|---|---|---|---|---|---|---|---|---|---|---|---|---|---|---|---|---|---|---|---|---|---|---|---|---|---|---|---|---|---|---|---|---|---|---|---|---|---|---|---|---|---|---|---|---|---|---|---|---|---|---|---|---|---|---|---|---|---|---|---|---|---|---|---|---|---|---|---|---|---|---|---|---|---|---|---|---|---|---|---|---|---|---|---|---|---|---|---|---|---|---|---|---|---|---|---|---|---|---|---|---|---|---|---|---|---|---|---|---|---|---|---|---|---|---|---|---|---|---|---|---|---|---|---|---|---|---|---|---|---|---|---|---|---|---|---|---|---|---|---|---|---|---|---|---|---|---|---|---|---|---|---|---|---|---|---|---|---|---|---|---|---|---|---|---|---|---|---|---|---|---|---|---|---|---|---|
| 2014 Aug 26 - 2017 Mar 7 | Evidence from Observations: Satellite (infrared) | ||||||||||||||||||||||||||||||||||||||||||||||||||||||||||||||||||||||||||||||||||||||||||||||||||||||||||||||||||||||||||||||||||||||||||||||||||||||||||||||||||||||||||||||||||||||||||||||||||||||||||||||||||||||||||||||||||||||||||||||||||||||||||||||||||||||||||||||||||||||||||||||||||||||||||||||||||||||||||||||||||||||||||||||||||||||||||||||||||||||||||||||||||||||||||||||||||||||||||||||||||||||||||||||||||||||||||||||||||||||||||||||||||||||||||||||||||||||||||||||||||||||||||||||||||||||||||||||||||||||||||||||||||||||||||||||||||||||||||||||||||||||||||||||||||||||||||||||||||||||||||||||||||||||||||||||||||||||||||||||||||||||||||||||||||||||||||||||||||||||||||||||||||||||||||||||||||||||||||||||||||||||||||||||||||||||||||||||||||||||||||||||||||||||||||||||||||||||||||||||||||||||||||||||||||||||||||||||||||||||||||||||||||||||||||||||||||||||||||||||||||||||||||||||||||||||||||||||||||||||||||||||||||||||||||||||||||||||||||||||||||||||||||||||||||||||||||||||||||||||
|
List of 274 Events for Episode 2 at Summit crater
|
|||||||||||||||||||||||||||||||||||||||||||||||||||||||||||||||||||||||||||||||||||||||||||||||||||||||||||||||||||||||||||||||||||||||||||||||||||||||||||||||||||||||||||||||||||||||||||||||||||||||||||||||||||||||||||||||||||||||||||||||||||||||||||||||||||||||||||||||||||||||||||||||||||||||||||||||||||||||||||||||||||||||||||||||||||||||||||||||||||||||||||||||||||||||||||||||||||||||||||||||||||||||||||||||||||||||||||||||||||||||||||||||||||||||||||||||||||||||||||||||||||||||||||||||||||||||||||||||||||||||||||||||||||||||||||||||||||||||||||||||||||||||||||||||||||||||||||||||||||||||||||||||||||||||||||||||||||||||||||||||||||||||||||||||||||||||||||||||||||||||||||||||||||||||||||||||||||||||||||||||||||||||||||||||||||||||||||||||||||||||||||||||||||||||||||||||||||||||||||||||||||||||||||||||||||||||||||||||||||||||||||||||||||||||||||||||||||||||||||||||||||||||||||||||||||||||||||||||||||||||||||||||||||||||||||||||||||||||||||||||||||||||||||||||||||||||||||||||||||||||
1997 Nov 22 - 2011 Jun 21 Confirmed Eruption (Explosive / Effusive) VEI: 3
| Episode 1 | Eruption (Explosive / Effusive) | 1994 crater | |||||||||||||||||||||||||||||||||||||||||||||||||||||||||||||||||||||||||||||||||||||||||||||
|---|---|---|---|---|---|---|---|---|---|---|---|---|---|---|---|---|---|---|---|---|---|---|---|---|---|---|---|---|---|---|---|---|---|---|---|---|---|---|---|---|---|---|---|---|---|---|---|---|---|---|---|---|---|---|---|---|---|---|---|---|---|---|---|---|---|---|---|---|---|---|---|---|---|---|---|---|---|---|---|---|---|---|---|---|---|---|---|---|---|---|---|---|---|---|
| 1997 Nov 22 - 2011 Jun 21 | Evidence from Observations: Reported | |||||||||||||||||||||||||||||||||||||||||||||||||||||||||||||||||||||||||||||||||||||||||||||
|
List of 17 Events for Episode 1 at 1994 crater
|
||||||||||||||||||||||||||||||||||||||||||||||||||||||||||||||||||||||||||||||||||||||||||||||
1994 Jul 21 - 1994 Jul 21 Confirmed Eruption (Explosive / Effusive) VEI: 1
| Episode 1 | Eruption (Explosive / Effusive) | West of 1987 explosion crater | ||||||||||||||||||||||||||||||||||||||||||||||||
|---|---|---|---|---|---|---|---|---|---|---|---|---|---|---|---|---|---|---|---|---|---|---|---|---|---|---|---|---|---|---|---|---|---|---|---|---|---|---|---|---|---|---|---|---|---|---|---|---|---|
| 1994 Jul 21 - 1994 Jul 21 | Evidence from Observations: Reported | ||||||||||||||||||||||||||||||||||||||||||||||||
|
List of 8 Events for Episode 1 at West of 1987 explosion crater
|
|||||||||||||||||||||||||||||||||||||||||||||||||
1991 Mar 1 - 1991 Oct 16 ± 15 days Confirmed Eruption (Explosive / Effusive) VEI: 2
| Episode 1 | Eruption (Explosive / Effusive) | |||||||||||||||||||||||||||||||||||||||||||||||||||||||||||||||||||||
|---|---|---|---|---|---|---|---|---|---|---|---|---|---|---|---|---|---|---|---|---|---|---|---|---|---|---|---|---|---|---|---|---|---|---|---|---|---|---|---|---|---|---|---|---|---|---|---|---|---|---|---|---|---|---|---|---|---|---|---|---|---|---|---|---|---|---|---|---|---|
| 1991 Mar 1 - 1991 Oct 16 ± 15 days | Evidence from Observations: Reported | ||||||||||||||||||||||||||||||||||||||||||||||||||||||||||||||||||||
|
List of 12 Events for Episode 1
|
|||||||||||||||||||||||||||||||||||||||||||||||||||||||||||||||||||||
[ 1988 Jun 15 ± 180 days ] Uncertain Eruption
| Episode 1 | Eruption (Explosive / Effusive) | |||||||||||||||||||||||||||||
|---|---|---|---|---|---|---|---|---|---|---|---|---|---|---|---|---|---|---|---|---|---|---|---|---|---|---|---|---|---|
| 1988 Jun 15 ± 180 days - Unknown | Evidence from Unknown | ||||||||||||||||||||||||||||
|
List of 4 Events for Episode 1
|
|||||||||||||||||||||||||||||
1987 Jul 2 - 1987 Jul 2 Confirmed Eruption (Explosive / Effusive) VEI: 1
| Episode 1 | Eruption (Explosive / Effusive) | East side of summit lava dome | ||||||||||||||||||||||||||||
|---|---|---|---|---|---|---|---|---|---|---|---|---|---|---|---|---|---|---|---|---|---|---|---|---|---|---|---|---|---|
| 1987 Jul 2 - 1987 Jul 2 | Evidence from Observations: Reported | ||||||||||||||||||||||||||||
|
List of 4 Events for Episode 1 at East side of summit lava dome
|
|||||||||||||||||||||||||||||
1985 Jul 2 ± 182 days - 1986 Jan 5 ± 4 days Confirmed Eruption (Explosive / Effusive) VEI: 1
| Episode 1 | Eruption (Explosive / Effusive) | |||||||||||||||||||||||||||||||||||||||
|---|---|---|---|---|---|---|---|---|---|---|---|---|---|---|---|---|---|---|---|---|---|---|---|---|---|---|---|---|---|---|---|---|---|---|---|---|---|---|---|
| 1985 Jul 2 ± 182 days - 1986 Jan 5 ± 4 days | Evidence from Observations: Reported | ||||||||||||||||||||||||||||||||||||||
|
List of 6 Events for Episode 1
|
|||||||||||||||||||||||||||||||||||||||
[ 1983 Feb 11 - 1983 Feb 15 ] Uncertain Eruption
| Episode 1 | Eruption (Explosive / Effusive) | ||||||||||||||||||||||||||||||||||
|---|---|---|---|---|---|---|---|---|---|---|---|---|---|---|---|---|---|---|---|---|---|---|---|---|---|---|---|---|---|---|---|---|---|---|
| 1983 Feb 11 - 1983 Feb 15 | Evidence from Unknown | |||||||||||||||||||||||||||||||||
|
List of 5 Events for Episode 1
|
||||||||||||||||||||||||||||||||||
1977 Dec 16 ± 15 days - 1982 Jun 16 ± 15 days Confirmed Eruption (Explosive / Effusive) VEI: 1
| Episode 1 | Eruption (Explosive / Effusive) | ||||||||||||||||||||||||||||||||||||||||||||
|---|---|---|---|---|---|---|---|---|---|---|---|---|---|---|---|---|---|---|---|---|---|---|---|---|---|---|---|---|---|---|---|---|---|---|---|---|---|---|---|---|---|---|---|---|
| 1977 Dec 16 ± 15 days - 1982 Jun 16 ± 15 days | Evidence from Observations: Reported | |||||||||||||||||||||||||||||||||||||||||||
|
List of 7 Events for Episode 1
|
||||||||||||||||||||||||||||||||||||||||||||
1975 Dec 11 (?) - 1976 Jun 20 Confirmed Eruption (Explosive / Effusive) VEI: 2
| Episode 1 | Eruption (Explosive / Effusive) | |||||||||||||||||||||||||||||
|---|---|---|---|---|---|---|---|---|---|---|---|---|---|---|---|---|---|---|---|---|---|---|---|---|---|---|---|---|---|
| 1975 Dec 11 (?) - 1976 Jun 20 | Evidence from Observations: Reported | ||||||||||||||||||||||||||||
|
List of 4 Events for Episode 1
|
|||||||||||||||||||||||||||||
[ 1973 Jan 30 ] Uncertain Eruption
| Episode 1 | Eruption (Explosive / Effusive) | ||||||||||||||||||||||||
|---|---|---|---|---|---|---|---|---|---|---|---|---|---|---|---|---|---|---|---|---|---|---|---|---|
| 1973 Jan 30 - Unknown | Evidence from Unknown | |||||||||||||||||||||||
|
List of 3 Events for Episode 1
|
||||||||||||||||||||||||
1963 Jul 2 ± 182 days - 1970 Jul 2 ± 182 days Confirmed Eruption (Explosive / Effusive) VEI: 1
| Episode 1 | Eruption (Explosive / Effusive) | ||||||||||||||||||||||||||||||||||
|---|---|---|---|---|---|---|---|---|---|---|---|---|---|---|---|---|---|---|---|---|---|---|---|---|---|---|---|---|---|---|---|---|---|---|
| 1963 Jul 2 ± 182 days - 1970 Jul 2 ± 182 days | Evidence from Observations: Reported | |||||||||||||||||||||||||||||||||
|
List of 5 Events for Episode 1
|
||||||||||||||||||||||||||||||||||
1961 Jul 2 ± 182 days - 1962 Dec 1 ± 30 days Confirmed Eruption (Explosive / Effusive) VEI: 1
| Episode 1 | Eruption (Explosive / Effusive) | |||||||||||||||||||||||||||||||||||||||
|---|---|---|---|---|---|---|---|---|---|---|---|---|---|---|---|---|---|---|---|---|---|---|---|---|---|---|---|---|---|---|---|---|---|---|---|---|---|---|---|
| 1961 Jul 2 ± 182 days - 1962 Dec 1 ± 30 days | Evidence from Observations: Reported | ||||||||||||||||||||||||||||||||||||||
|
List of 6 Events for Episode 1
|
|||||||||||||||||||||||||||||||||||||||
1957 May 14 - 1960 Jul 2 ± 182 days Confirmed Eruption (Explosive / Effusive) VEI: 1
| Episode 1 | Eruption (Explosive / Effusive) | ||||||||||||||||||||||||
|---|---|---|---|---|---|---|---|---|---|---|---|---|---|---|---|---|---|---|---|---|---|---|---|---|
| 1957 May 14 - 1960 Jul 2 ± 182 days | Evidence from Observations: Reported | |||||||||||||||||||||||
|
List of 3 Events for Episode 1
|
||||||||||||||||||||||||
[ 1941 Apr 15 ] Uncertain Eruption
| Episode 1 | Eruption (Explosive / Effusive) | |||||||||||||||||||||||||||||||||||||||
|---|---|---|---|---|---|---|---|---|---|---|---|---|---|---|---|---|---|---|---|---|---|---|---|---|---|---|---|---|---|---|---|---|---|---|---|---|---|---|---|
| 1941 Apr 15 - Unknown | Evidence from Unknown | ||||||||||||||||||||||||||||||||||||||
|
List of 6 Events for Episode 1
|
|||||||||||||||||||||||||||||||||||||||
1926 ± 4 years - 1931 (?) Confirmed Eruption (Explosive / Effusive) VEI: 1 (?)
| Episode 1 | Eruption (Explosive / Effusive) | ||||||||||||||||||||||||||||||||||
|---|---|---|---|---|---|---|---|---|---|---|---|---|---|---|---|---|---|---|---|---|---|---|---|---|---|---|---|---|---|---|---|---|---|---|
| 1926 ± 4 years - 1931 (?) | Evidence from Observations: Reported | |||||||||||||||||||||||||||||||||
|
List of 5 Events for Episode 1
|
||||||||||||||||||||||||||||||||||
1913 Jan 17 - 1913 Jan 24 Confirmed Eruption (Explosive / Effusive) VEI: 4
| Episode 1 | Eruption (Explosive / Effusive) | ||||||||||||||||||||||||||||||||||||||||||||||||||||||
|---|---|---|---|---|---|---|---|---|---|---|---|---|---|---|---|---|---|---|---|---|---|---|---|---|---|---|---|---|---|---|---|---|---|---|---|---|---|---|---|---|---|---|---|---|---|---|---|---|---|---|---|---|---|---|
| 1913 Jan 17 - 1913 Jan 24 | Evidence from Observations: Reported | |||||||||||||||||||||||||||||||||||||||||||||||||||||
|
List of 9 Events for Episode 1
|
||||||||||||||||||||||||||||||||||||||||||||||||||||||
1908 Dec 18 - 1909 Jul 1 ± 30 days Confirmed Eruption (Explosive / Effusive) VEI: 3
| Episode 1 | Eruption (Explosive / Effusive) | |||||||||||||||||||||||||||||||||||||||||||||||||
|---|---|---|---|---|---|---|---|---|---|---|---|---|---|---|---|---|---|---|---|---|---|---|---|---|---|---|---|---|---|---|---|---|---|---|---|---|---|---|---|---|---|---|---|---|---|---|---|---|---|
| 1908 Dec 18 - 1909 Jul 1 ± 30 days | Evidence from Observations: Reported | ||||||||||||||||||||||||||||||||||||||||||||||||
|
List of 8 Events for Episode 1
|
|||||||||||||||||||||||||||||||||||||||||||||||||
1904 - 1906 Confirmed Eruption (Explosive / Effusive) VEI: 1 (?)
| Episode 1 | Eruption (Explosive / Effusive) | ||||||||||||||||||||||||||||||||||
|---|---|---|---|---|---|---|---|---|---|---|---|---|---|---|---|---|---|---|---|---|---|---|---|---|---|---|---|---|---|---|---|---|---|---|
| 1904 - 1906 | Evidence from Observations: Reported | |||||||||||||||||||||||||||||||||
|
List of 5 Events for Episode 1
|
||||||||||||||||||||||||||||||||||
1903 Feb 15 - 1903 Oct 30 Confirmed Eruption (Explosive / Effusive) VEI: 3
Large explosive eruptions with abundant ash emission and occasional pyroclastic flows took place between 15 February and 14 March 1903 (Arreola, 1903), which created a large new crater and the summit of the volcano. Additional eruptions of decreasing intensity occurred in May, before activity ceased in August (Breton et al., 2002). However, the USS Concord reported seeing ash explosions on 30 October 1903.
| Episode 1 | Eruption (Explosive / Effusive) | ||||||||||||||||||||||||||||||||||||||||||||
|---|---|---|---|---|---|---|---|---|---|---|---|---|---|---|---|---|---|---|---|---|---|---|---|---|---|---|---|---|---|---|---|---|---|---|---|---|---|---|---|---|---|---|---|---|
| 1903 Feb 15 - 1903 Aug | Evidence from Observations: Reported | |||||||||||||||||||||||||||||||||||||||||||
|
List of 7 Events for Episode 1
|
||||||||||||||||||||||||||||||||||||||||||||
| Episode 2 | Eruption (Explosive / Effusive) | |||||||||||||||||||
|---|---|---|---|---|---|---|---|---|---|---|---|---|---|---|---|---|---|---|---|
| 1903 Oct 30 - 1903 Oct 30 | Evidence from Observations: Reported | ||||||||||||||||||
|
List of 2 Events for Episode 2
|
|||||||||||||||||||
1893 Dec 4 - 1902 Confirmed Eruption (Explosive / Effusive) VEI: 2
| Episode 1 | Eruption (Explosive / Effusive) | ||||||||||||||||||||||||||||||||||||||||||||||||||||||
|---|---|---|---|---|---|---|---|---|---|---|---|---|---|---|---|---|---|---|---|---|---|---|---|---|---|---|---|---|---|---|---|---|---|---|---|---|---|---|---|---|---|---|---|---|---|---|---|---|---|---|---|---|---|---|
| 1893 Dec 4 - 1902 | Evidence from Observations: Reported | |||||||||||||||||||||||||||||||||||||||||||||||||||||
|
List of 9 Events for Episode 1
|
||||||||||||||||||||||||||||||||||||||||||||||||||||||
1891 Jul - 1892 Jun Confirmed Eruption (Explosive / Effusive) VEI: 2
| Episode 1 | Eruption (Explosive / Effusive) | |||||||||||||||||||||||||||||
|---|---|---|---|---|---|---|---|---|---|---|---|---|---|---|---|---|---|---|---|---|---|---|---|---|---|---|---|---|---|
| 1891 Jul - 1892 Jun | Evidence from Observations: Reported | ||||||||||||||||||||||||||||
|
List of 4 Events for Episode 1
|
|||||||||||||||||||||||||||||
1890 Nov 18 Confirmed Eruption (Explosive / Effusive) VEI: 2 (?)
| Episode 1 | Eruption (Explosive / Effusive) | ||||||||||||||||||||||||||||||||||
|---|---|---|---|---|---|---|---|---|---|---|---|---|---|---|---|---|---|---|---|---|---|---|---|---|---|---|---|---|---|---|---|---|---|---|
| 1890 Nov 18 - Unknown | Evidence from Observations: Reported | |||||||||||||||||||||||||||||||||
|
List of 5 Events for Episode 1
|
||||||||||||||||||||||||||||||||||
1889 Aug 9 - 1890 Feb 16 Confirmed Eruption (Explosive / Effusive) VEI: 4
| Episode 1 | Eruption (Explosive / Effusive) | ||||||||||||||||||||||||||||||||||||||||||||||||||||||
|---|---|---|---|---|---|---|---|---|---|---|---|---|---|---|---|---|---|---|---|---|---|---|---|---|---|---|---|---|---|---|---|---|---|---|---|---|---|---|---|---|---|---|---|---|---|---|---|---|---|---|---|---|---|---|
| 1889 Aug 9 - 1890 Feb 16 | Evidence from Observations: Reported | |||||||||||||||||||||||||||||||||||||||||||||||||||||
|
List of 9 Events for Episode 1
|
||||||||||||||||||||||||||||||||||||||||||||||||||||||
1887 Confirmed Eruption (Explosive / Effusive) VEI: 0
| Episode 1 | Eruption (Explosive / Effusive) | |||||||||||||||||||
|---|---|---|---|---|---|---|---|---|---|---|---|---|---|---|---|---|---|---|---|
| 1887 - Unknown | Evidence from Observations: Reported | ||||||||||||||||||
|
List of 2 Events for Episode 1
|
|||||||||||||||||||
1885 Dec 26 - 1886 Oct Confirmed Eruption (Explosive / Effusive) VEI: 3 (?)
| Episode 1 | Eruption (Explosive / Effusive) | |||||||||||||||||||||||||||||||||||||||||||||||||
|---|---|---|---|---|---|---|---|---|---|---|---|---|---|---|---|---|---|---|---|---|---|---|---|---|---|---|---|---|---|---|---|---|---|---|---|---|---|---|---|---|---|---|---|---|---|---|---|---|---|
| 1885 Dec 26 - 1886 Oct | Evidence from Observations: Reported | ||||||||||||||||||||||||||||||||||||||||||||||||
|
List of 8 Events for Episode 1
|
|||||||||||||||||||||||||||||||||||||||||||||||||
1882 - 1884 Confirmed Eruption (Explosive / Effusive) VEI: 1
| Episode 1 | Eruption (Explosive / Effusive) | |||||||||||||||||||
|---|---|---|---|---|---|---|---|---|---|---|---|---|---|---|---|---|---|---|---|
| 1882 - 1884 | Evidence from Observations: Reported | ||||||||||||||||||
|
List of 2 Events for Episode 1
|
|||||||||||||||||||
1880 Dec 1 ± 30 days - 1881 Apr 12 Confirmed Eruption (Explosive / Effusive) VEI: 2
| Episode 1 | Eruption (Explosive / Effusive) | |||||||||||||||||||||||||||||||||||||||
|---|---|---|---|---|---|---|---|---|---|---|---|---|---|---|---|---|---|---|---|---|---|---|---|---|---|---|---|---|---|---|---|---|---|---|---|---|---|---|---|
| 1880 Dec 1 ± 30 days - 1881 Apr 12 | Evidence from Observations: Reported | ||||||||||||||||||||||||||||||||||||||
|
List of 6 Events for Episode 1
|
|||||||||||||||||||||||||||||||||||||||
1879 Dec 23 - 1880 Apr 30 Confirmed Eruption (Explosive / Effusive) VEI: 1
| Episode 1 | Eruption (Explosive / Effusive) | Summit vent and SW flank | |||||||||||||||||||||||||||||||||
|---|---|---|---|---|---|---|---|---|---|---|---|---|---|---|---|---|---|---|---|---|---|---|---|---|---|---|---|---|---|---|---|---|---|---|
| 1879 Dec 23 - 1880 Apr 30 | Evidence from Observations: Reported | |||||||||||||||||||||||||||||||||
|
List of 5 Events for Episode 1 at Summit vent and SW flank
|
||||||||||||||||||||||||||||||||||
1875 - 1878 Confirmed Eruption (Explosive / Effusive) VEI: 1
| Episode 1 | Eruption (Explosive / Effusive) | NE flank (El Volcancito) | |||||||||||||||||||||||||||||||||
|---|---|---|---|---|---|---|---|---|---|---|---|---|---|---|---|---|---|---|---|---|---|---|---|---|---|---|---|---|---|---|---|---|---|---|
| 1875 - 1878 | Evidence from Observations: Reported | |||||||||||||||||||||||||||||||||
|
List of 5 Events for Episode 1 at NE flank (El Volcancito)
|
||||||||||||||||||||||||||||||||||
1874 Jun 12 Confirmed Eruption (Explosive / Effusive) VEI: 1
| Episode 1 | Eruption (Explosive / Effusive) | NE flank (El Volcancito) | ||||||||||||||||||||||||||||
|---|---|---|---|---|---|---|---|---|---|---|---|---|---|---|---|---|---|---|---|---|---|---|---|---|---|---|---|---|---|
| 1874 Jun 12 - Unknown | Evidence from Observations: Reported | ||||||||||||||||||||||||||||
|
List of 4 Events for Episode 1 at NE flank (El Volcancito)
|
|||||||||||||||||||||||||||||
1872 Feb 26 - 1873 Mar 27 Confirmed Eruption (Explosive / Effusive) VEI: 3
| Episode 1 | Eruption (Explosive / Effusive) | El Volcancito and main crater | ||||||||||||||||||||||||||||||||||||||||||||||||||||||||||||||||||||
|---|---|---|---|---|---|---|---|---|---|---|---|---|---|---|---|---|---|---|---|---|---|---|---|---|---|---|---|---|---|---|---|---|---|---|---|---|---|---|---|---|---|---|---|---|---|---|---|---|---|---|---|---|---|---|---|---|---|---|---|---|---|---|---|---|---|---|---|---|---|
| 1872 Feb 26 - 1873 Mar 27 | Evidence from Observations: Reported | ||||||||||||||||||||||||||||||||||||||||||||||||||||||||||||||||||||
|
List of 12 Events for Episode 1 at El Volcancito and main crater
|
|||||||||||||||||||||||||||||||||||||||||||||||||||||||||||||||||||||
1870 - 1871 Confirmed Eruption (Explosive / Effusive) VEI: 0
| Episode 1 | Eruption (Explosive / Effusive) | NE flank (El Volcancito) | |||||||||||||||||||||||
|---|---|---|---|---|---|---|---|---|---|---|---|---|---|---|---|---|---|---|---|---|---|---|---|---|
| 1870 - 1871 | Evidence from Observations: Reported | |||||||||||||||||||||||
|
List of 3 Events for Episode 1 at NE flank (El Volcancito)
|
||||||||||||||||||||||||
1869 Jun 12 - 1869 Aug 24 (on or after) Confirmed Eruption (Explosive / Effusive) VEI: 3
| Episode 1 | Eruption (Explosive / Effusive) | NE flank (El Volcancito) | ||||||||||||||||||||||||||||||||||||||
|---|---|---|---|---|---|---|---|---|---|---|---|---|---|---|---|---|---|---|---|---|---|---|---|---|---|---|---|---|---|---|---|---|---|---|---|---|---|---|---|
| 1869 Jun 12 - 1869 Aug 24 (on or after) | Evidence from Observations: Reported | ||||||||||||||||||||||||||||||||||||||
|
List of 6 Events for Episode 1 at NE flank (El Volcancito)
|
|||||||||||||||||||||||||||||||||||||||
[ 1866 Mar 4 - 1868 ] Discredited Eruption
1819 Confirmed Eruption (Explosive / Effusive) VEI: 1
| Episode 1 | Eruption (Explosive / Effusive) | |||||||||||||||||||
|---|---|---|---|---|---|---|---|---|---|---|---|---|---|---|---|---|---|---|---|
| 1819 - Unknown | Evidence from Observations: Reported | ||||||||||||||||||
|
List of 2 Events for Episode 1
|
|||||||||||||||||||
1818 Feb 15 - 1818 Feb 16 (?) Confirmed Eruption (Explosive / Effusive) VEI: 4
| Episode 1 | Eruption (Explosive / Effusive) | ||||||||||||||||||||||||||||||||||||||||||||||||||||||
|---|---|---|---|---|---|---|---|---|---|---|---|---|---|---|---|---|---|---|---|---|---|---|---|---|---|---|---|---|---|---|---|---|---|---|---|---|---|---|---|---|---|---|---|---|---|---|---|---|---|---|---|---|---|---|
| 1818 Feb 15 - 1818 Feb 16 (?) | Evidence from Observations: Reported | |||||||||||||||||||||||||||||||||||||||||||||||||||||
|
List of 9 Events for Episode 1
|
||||||||||||||||||||||||||||||||||||||||||||||||||||||
1806 - 1809 Confirmed Eruption (Explosive / Effusive) VEI: 2 (?)
| Episode 1 | Eruption (Explosive / Effusive) | |||||||||||||||||||||||||||||||||||||||
|---|---|---|---|---|---|---|---|---|---|---|---|---|---|---|---|---|---|---|---|---|---|---|---|---|---|---|---|---|---|---|---|---|---|---|---|---|---|---|---|
| 1806 - 1809 | Evidence from Observations: Reported | ||||||||||||||||||||||||||||||||||||||
|
List of 6 Events for Episode 1
|
|||||||||||||||||||||||||||||||||||||||
1804 Confirmed Eruption (Explosive / Effusive) VEI: 2
| Episode 1 | Eruption (Explosive / Effusive) | |||||||||||||||||||
|---|---|---|---|---|---|---|---|---|---|---|---|---|---|---|---|---|---|---|---|
| 1804 - Unknown | Evidence from Observations: Reported | ||||||||||||||||||
|
List of 2 Events for Episode 1
|
|||||||||||||||||||
1795 Mar - 1795 Sep Confirmed Eruption (Explosive / Effusive) VEI: 2
| Episode 1 | Eruption (Explosive / Effusive) | ||||||||||||||||||||||||||||||||||
|---|---|---|---|---|---|---|---|---|---|---|---|---|---|---|---|---|---|---|---|---|---|---|---|---|---|---|---|---|---|---|---|---|---|---|
| 1795 Mar - 1795 Sep | Evidence from Observations: Reported | |||||||||||||||||||||||||||||||||
|
List of 5 Events for Episode 1
|
||||||||||||||||||||||||||||||||||
1794 Aug Confirmed Eruption (Explosive / Effusive) VEI: 2
| Episode 1 | Eruption (Explosive / Effusive) | |||||||||||||||||||
|---|---|---|---|---|---|---|---|---|---|---|---|---|---|---|---|---|---|---|---|
| 1794 Aug - Unknown | Evidence from Observations: Reported | ||||||||||||||||||
|
List of 2 Events for Episode 1
|
|||||||||||||||||||
1780 Nov 26 Confirmed Eruption (Explosive / Effusive) VEI: 2
| Episode 1 | Eruption (Explosive / Effusive) | |||||||||||||||||||
|---|---|---|---|---|---|---|---|---|---|---|---|---|---|---|---|---|---|---|---|
| 1780 Nov 26 - Unknown | Evidence from Observations: Reported | ||||||||||||||||||
|
List of 2 Events for Episode 1
|
|||||||||||||||||||
1771 Confirmed Eruption (Explosive / Effusive) VEI: 3
| Episode 1 | Eruption (Explosive / Effusive) | ||||||||||||||||||||||||||||||||||
|---|---|---|---|---|---|---|---|---|---|---|---|---|---|---|---|---|---|---|---|---|---|---|---|---|---|---|---|---|---|---|---|---|---|---|
| 1771 - Unknown | Evidence from Observations: Reported | |||||||||||||||||||||||||||||||||
|
List of 5 Events for Episode 1
|
||||||||||||||||||||||||||||||||||
1770 Mar 10 - 1770 Mar 12 Confirmed Eruption (Explosive / Effusive) VEI: 3
| Episode 1 | Eruption (Explosive / Effusive) | ||||||||||||||||||||||||||||||||||||||||||||
|---|---|---|---|---|---|---|---|---|---|---|---|---|---|---|---|---|---|---|---|---|---|---|---|---|---|---|---|---|---|---|---|---|---|---|---|---|---|---|---|---|---|---|---|---|
| 1770 Mar 10 - 1770 Mar 12 | Evidence from Observations: Reported | |||||||||||||||||||||||||||||||||||||||||||
|
List of 7 Events for Episode 1
|
||||||||||||||||||||||||||||||||||||||||||||
1769 Confirmed Eruption (Explosive / Effusive) VEI: 2 (?)
| Episode 1 | Eruption (Explosive / Effusive) | ||||||||||||||||||||||||
|---|---|---|---|---|---|---|---|---|---|---|---|---|---|---|---|---|---|---|---|---|---|---|---|---|
| 1769 - Unknown | Evidence from Observations: Reported | |||||||||||||||||||||||
|
List of 3 Events for Episode 1
|
||||||||||||||||||||||||
[ 1749 ] Uncertain Eruption
| Episode 1 | Eruption (Explosive / Effusive) | ||||||||||||||||||||||||
|---|---|---|---|---|---|---|---|---|---|---|---|---|---|---|---|---|---|---|---|---|---|---|---|---|
| 1749 - Unknown | Evidence from Unknown | |||||||||||||||||||||||
|
List of 3 Events for Episode 1
|
||||||||||||||||||||||||
1744 Confirmed Eruption (Explosive / Effusive) VEI: 2
| Episode 1 | Eruption (Explosive / Effusive) | ||||||||||||||||||||||||||||||||||
|---|---|---|---|---|---|---|---|---|---|---|---|---|---|---|---|---|---|---|---|---|---|---|---|---|---|---|---|---|---|---|---|---|---|---|
| 1744 - Unknown | Evidence from Observations: Reported | |||||||||||||||||||||||||||||||||
|
List of 5 Events for Episode 1
|
||||||||||||||||||||||||||||||||||
1743 Oct 22 Confirmed Eruption (Explosive / Effusive) VEI: 2 (?)
| Episode 1 | Eruption (Explosive / Effusive) | |||||||||||||||||||||||||||||
|---|---|---|---|---|---|---|---|---|---|---|---|---|---|---|---|---|---|---|---|---|---|---|---|---|---|---|---|---|---|
| 1743 Oct 22 - Unknown | Evidence from Observations: Reported | ||||||||||||||||||||||||||||
|
List of 4 Events for Episode 1
|
|||||||||||||||||||||||||||||
1711 Confirmed Eruption (Explosive / Effusive) VEI: 3 (?)
| Episode 1 | Eruption (Explosive / Effusive) | ||||||||||||||||||||||||
|---|---|---|---|---|---|---|---|---|---|---|---|---|---|---|---|---|---|---|---|---|---|---|---|---|
| 1711 - Unknown | Evidence from Observations: Reported | |||||||||||||||||||||||
|
List of 3 Events for Episode 1
|
||||||||||||||||||||||||
1690 Confirmed Eruption (Explosive / Effusive) VEI: 3 (?)
| Episode 1 | Eruption (Explosive / Effusive) | ||||||||||||||||||||||||||||||||||
|---|---|---|---|---|---|---|---|---|---|---|---|---|---|---|---|---|---|---|---|---|---|---|---|---|---|---|---|---|---|---|---|---|---|---|
| 1690 - Unknown | Evidence from Observations: Reported | |||||||||||||||||||||||||||||||||
|
List of 5 Events for Episode 1
|
||||||||||||||||||||||||||||||||||
1622 Jun 8 - 1622 Jun 9 Confirmed Eruption (Explosive / Effusive) VEI: 4
| Episode 1 | Eruption (Explosive / Effusive) | |||||||||||||||||||||||||||||
|---|---|---|---|---|---|---|---|---|---|---|---|---|---|---|---|---|---|---|---|---|---|---|---|---|---|---|---|---|---|
| 1622 Jun 8 - 1622 Jun 9 | Evidence from Observations: Reported | ||||||||||||||||||||||||||||
|
List of 4 Events for Episode 1
|
|||||||||||||||||||||||||||||
1611 Apr 15 - 1613 Confirmed Eruption (Explosive / Effusive) VEI: 3
| Episode 1 | Eruption (Explosive / Effusive) | |||||||||||||||||||||||||||||||||||||||
|---|---|---|---|---|---|---|---|---|---|---|---|---|---|---|---|---|---|---|---|---|---|---|---|---|---|---|---|---|---|---|---|---|---|---|---|---|---|---|---|
| 1611 Apr 15 - 1613 | Evidence from Observations: Reported | ||||||||||||||||||||||||||||||||||||||
|
List of 6 Events for Episode 1
|
|||||||||||||||||||||||||||||||||||||||
1606 Nov 25 - 1606 Dec 13 (on or after) Confirmed Eruption (Explosive / Effusive) VEI: 4
| Episode 1 | Eruption (Explosive / Effusive) | ||||||||||||||||||||||||||||||||||||||||||||
|---|---|---|---|---|---|---|---|---|---|---|---|---|---|---|---|---|---|---|---|---|---|---|---|---|---|---|---|---|---|---|---|---|---|---|---|---|---|---|---|---|---|---|---|---|
| 1606 Nov 25 - 1606 Dec 13 (on or after) | Evidence from Observations: Reported | |||||||||||||||||||||||||||||||||||||||||||
|
List of 7 Events for Episode 1
|
||||||||||||||||||||||||||||||||||||||||||||
[ 1602 ] Uncertain Eruption
| Episode 1 | Eruption (Explosive / Effusive) | |||||||||||||||||||
|---|---|---|---|---|---|---|---|---|---|---|---|---|---|---|---|---|---|---|---|
| 1602 - Unknown | Evidence from Unknown | ||||||||||||||||||
|
List of 2 Events for Episode 1
|
|||||||||||||||||||
1590 Jan 14 - 1590 Jan 15 Confirmed Eruption (Explosive / Effusive) VEI: 3
| Episode 1 | Eruption (Explosive / Effusive) | ||||||||||||||||||||||||||||||||||
|---|---|---|---|---|---|---|---|---|---|---|---|---|---|---|---|---|---|---|---|---|---|---|---|---|---|---|---|---|---|---|---|---|---|---|
| 1590 Jan 14 - 1590 Jan 15 | Evidence from Observations: Reported | |||||||||||||||||||||||||||||||||
|
List of 5 Events for Episode 1
|
||||||||||||||||||||||||||||||||||
1585 Jan 10 Confirmed Eruption (Explosive / Effusive) VEI: 4
| Episode 1 | Eruption (Explosive / Effusive) | ||||||||||||||||||||||||||||||||||||||||||||
|---|---|---|---|---|---|---|---|---|---|---|---|---|---|---|---|---|---|---|---|---|---|---|---|---|---|---|---|---|---|---|---|---|---|---|---|---|---|---|---|---|---|---|---|---|
| 1585 Jan 10 - Unknown | Evidence from Observations: Reported | |||||||||||||||||||||||||||||||||||||||||||
|
List of 7 Events for Episode 1
|
||||||||||||||||||||||||||||||||||||||||||||
1576 Confirmed Eruption (Explosive / Effusive) VEI: 3
| Episode 1 | Eruption (Explosive / Effusive) | ||||||||||||||||||||||||||||||||||||||||||||
|---|---|---|---|---|---|---|---|---|---|---|---|---|---|---|---|---|---|---|---|---|---|---|---|---|---|---|---|---|---|---|---|---|---|---|---|---|---|---|---|---|---|---|---|---|
| 1576 - Unknown | Evidence from Observations: Reported | |||||||||||||||||||||||||||||||||||||||||||
|
List of 7 Events for Episode 1
|
||||||||||||||||||||||||||||||||||||||||||||
1560 Confirmed Eruption (Explosive / Effusive) VEI: 2
| Episode 1 | Eruption (Explosive / Effusive) | |||||||||||||||||||
|---|---|---|---|---|---|---|---|---|---|---|---|---|---|---|---|---|---|---|---|
| 1560 - Unknown | Evidence from Observations: Reported | ||||||||||||||||||
|
List of 2 Events for Episode 1
|
|||||||||||||||||||
1519 - 1523 Confirmed Eruption (Explosive / Effusive) VEI: 3 (?)
| Episode 1 | Eruption (Explosive / Effusive) | |||||||||||||||||||
|---|---|---|---|---|---|---|---|---|---|---|---|---|---|---|---|---|---|---|---|
| 1519 - 1523 | Evidence from Observations: Reported | ||||||||||||||||||
|
List of 2 Events for Episode 1
|
|||||||||||||||||||
1110 ± 200 years Confirmed Eruption (Explosive / Effusive)
| Episode 1 | Eruption (Explosive / Effusive) | ||||||||||||||||||||||||
|---|---|---|---|---|---|---|---|---|---|---|---|---|---|---|---|---|---|---|---|---|---|---|---|---|
| 1110 ± 200 years - Unknown | Evidence from Isotopic: 14C (calibrated) | |||||||||||||||||||||||
|
List of 3 Events for Episode 1
|
||||||||||||||||||||||||
0730 ± 100 years Confirmed Eruption (Explosive / Effusive)
| Episode 1 | Eruption (Explosive / Effusive) | |||||||||||||||||||
|---|---|---|---|---|---|---|---|---|---|---|---|---|---|---|---|---|---|---|---|
| 0730 ± 100 years - Unknown | Evidence from Isotopic: 14C (uncalibrated) | ||||||||||||||||||
|
List of 2 Events for Episode 1
|
|||||||||||||||||||
0540 ± 150 years Confirmed Eruption (Explosive / Effusive)
| Episode 1 | Eruption (Explosive / Effusive) | |||||||||||||||||||
|---|---|---|---|---|---|---|---|---|---|---|---|---|---|---|---|---|---|---|---|
| 0540 ± 150 years - Unknown | Evidence from Isotopic: 14C (calibrated) | ||||||||||||||||||
|
List of 2 Events for Episode 1
|
|||||||||||||||||||
0650 BCE ± 200 years Confirmed Eruption (Explosive / Effusive)
| Episode 1 | Eruption (Explosive / Effusive) | ||||||||||||||||||||||||||||||||||
|---|---|---|---|---|---|---|---|---|---|---|---|---|---|---|---|---|---|---|---|---|---|---|---|---|---|---|---|---|---|---|---|---|---|---|
| 0650 BCE ± 200 years - Unknown | Evidence from Isotopic: 14C (calibrated) | |||||||||||||||||||||||||||||||||
|
List of 5 Events for Episode 1
|
||||||||||||||||||||||||||||||||||
1140 BCE (?) Confirmed Eruption (Explosive / Effusive)
| Episode 1 | Eruption (Explosive / Effusive) | |||||||||||||||||||
|---|---|---|---|---|---|---|---|---|---|---|---|---|---|---|---|---|---|---|---|
| 1140 BCE (?) - Unknown | Evidence from Isotopic: 14C (uncalibrated) | ||||||||||||||||||
|
List of 2 Events for Episode 1
|
|||||||||||||||||||
1170 BCE ± 200 years Confirmed Eruption (Explosive / Effusive)
| Episode 1 | Eruption (Explosive / Effusive) | |||||||||||||||||||
|---|---|---|---|---|---|---|---|---|---|---|---|---|---|---|---|---|---|---|---|
| 1170 BCE ± 200 years - Unknown | Evidence from Isotopic: 14C (calibrated) | ||||||||||||||||||
|
List of 2 Events for Episode 1
|
|||||||||||||||||||
1320 BCE (?) Confirmed Eruption (Explosive / Effusive)
| Episode 1 | Eruption (Explosive / Effusive) | |||||||||||||||||||
|---|---|---|---|---|---|---|---|---|---|---|---|---|---|---|---|---|---|---|---|
| 1320 BCE (?) - Unknown | Evidence from Isotopic: 14C (uncalibrated) | ||||||||||||||||||
|
List of 2 Events for Episode 1
|
|||||||||||||||||||
1450 BCE ± 100 years Confirmed Eruption (Explosive / Effusive)
| Episode 1 | Eruption (Explosive / Effusive) | |||||||||||||||||||
|---|---|---|---|---|---|---|---|---|---|---|---|---|---|---|---|---|---|---|---|
| 1450 BCE ± 100 years - Unknown | Evidence from Isotopic: 14C (uncalibrated) | ||||||||||||||||||
|
List of 2 Events for Episode 1
|
|||||||||||||||||||
1890 BCE ± 75 years Confirmed Eruption (Explosive / Effusive)
| Episode 1 | Eruption (Explosive / Effusive) | |||||||||||||||||||
|---|---|---|---|---|---|---|---|---|---|---|---|---|---|---|---|---|---|---|---|
| 1890 BCE ± 75 years - Unknown | Evidence from Isotopic: 14C (uncalibrated) | ||||||||||||||||||
|
List of 2 Events for Episode 1
|
|||||||||||||||||||
1940 BCE ± 300 years Confirmed Eruption (Explosive / Effusive)
| Episode 1 | Eruption (Explosive / Effusive) | ||||||||||||||||||||||||||||||||||
|---|---|---|---|---|---|---|---|---|---|---|---|---|---|---|---|---|---|---|---|---|---|---|---|---|---|---|---|---|---|---|---|---|---|---|
| 1940 BCE ± 300 years - Unknown | Evidence from Isotopic: 14C (calibrated) | |||||||||||||||||||||||||||||||||
|
List of 5 Events for Episode 1
|
||||||||||||||||||||||||||||||||||
2370 BCE ± 150 years Confirmed Eruption (Explosive / Effusive) VEI: 4 (?)
| Episode 1 | Eruption (Explosive / Effusive) | |||||||||||||||||||||||||||||
|---|---|---|---|---|---|---|---|---|---|---|---|---|---|---|---|---|---|---|---|---|---|---|---|---|---|---|---|---|---|
| 2370 BCE ± 150 years - Unknown | Evidence from Isotopic: 14C (uncalibrated) | ||||||||||||||||||||||||||||
|
List of 4 Events for Episode 1
|
|||||||||||||||||||||||||||||
2800 BCE ± 100 years Confirmed Eruption (Explosive / Effusive)
| Episode 1 | Eruption (Explosive / Effusive) | |||||||||||||||||||
|---|---|---|---|---|---|---|---|---|---|---|---|---|---|---|---|---|---|---|---|
| 2800 BCE ± 100 years - Unknown | Evidence from Isotopic: 14C (calibrated) | ||||||||||||||||||
|
List of 2 Events for Episode 1
|
|||||||||||||||||||
3030 BCE ± 50 years Confirmed Eruption (Explosive / Effusive)
| Episode 1 | Eruption (Explosive / Effusive) | |||||||||||||||||||
|---|---|---|---|---|---|---|---|---|---|---|---|---|---|---|---|---|---|---|---|
| 3030 BCE ± 50 years - Unknown | Evidence from Isotopic: 14C (uncalibrated) | ||||||||||||||||||
|
List of 2 Events for Episode 1
|
|||||||||||||||||||
3180 BCE ± 100 years Confirmed Eruption (Explosive / Effusive)
| Episode 1 | Eruption (Explosive / Effusive) | Tephra units X, Y | ||||||||||||||||||||||||||||
|---|---|---|---|---|---|---|---|---|---|---|---|---|---|---|---|---|---|---|---|---|---|---|---|---|---|---|---|---|---|
| 3180 BCE ± 100 years - Unknown | Evidence from Isotopic: 14C (calibrated) | ||||||||||||||||||||||||||||
|
List of 4 Events for Episode 1 at Tephra units X, Y
|
|||||||||||||||||||||||||||||
3270 BCE (?) Confirmed Eruption (Explosive / Effusive)
| Episode 1 | Eruption (Explosive / Effusive) | Tephra unit W | |||||||||||||||||||||||
|---|---|---|---|---|---|---|---|---|---|---|---|---|---|---|---|---|---|---|---|---|---|---|---|---|
| 3270 BCE (?) - Unknown | Evidence from Correlation: Tephrochronology | |||||||||||||||||||||||
|
List of 3 Events for Episode 1 at Tephra unit W
|
||||||||||||||||||||||||
3350 BCE ± 300 years Confirmed Eruption (Explosive / Effusive)
| Episode 1 | Eruption (Explosive / Effusive) | Tephra unit V | ||||||||||||||||||
|---|---|---|---|---|---|---|---|---|---|---|---|---|---|---|---|---|---|---|---|
| 3350 BCE ± 300 years - Unknown | Evidence from Isotopic: 14C (calibrated) | ||||||||||||||||||
|
List of 2 Events for Episode 1 at Tephra unit V
|
|||||||||||||||||||
3510 BCE ± 200 years Confirmed Eruption (Explosive / Effusive)
| Episode 1 | Eruption (Explosive / Effusive) | ||||||||||||||||||||||||
|---|---|---|---|---|---|---|---|---|---|---|---|---|---|---|---|---|---|---|---|---|---|---|---|---|
| 3510 BCE ± 200 years - Unknown | Evidence from Isotopic: 14C (calibrated) | |||||||||||||||||||||||
|
List of 3 Events for Episode 1
|
||||||||||||||||||||||||
3600 BCE ± 200 years Confirmed Eruption (Explosive / Effusive)
| Episode 1 | Eruption (Explosive / Effusive) | Tephra unit U | ||||||||||||||||||
|---|---|---|---|---|---|---|---|---|---|---|---|---|---|---|---|---|---|---|---|
| 3600 BCE ± 200 years - Unknown | Evidence from Isotopic: 14C (calibrated) | ||||||||||||||||||
|
List of 2 Events for Episode 1 at Tephra unit U
|
|||||||||||||||||||
4110 BCE ± 100 years Confirmed Eruption (Explosive / Effusive)
| Episode 1 | Eruption (Explosive / Effusive) | Tephra unit T | ||||||||||||||||||
|---|---|---|---|---|---|---|---|---|---|---|---|---|---|---|---|---|---|---|---|
| 4110 BCE ± 100 years - Unknown | Evidence from Isotopic: 14C (calibrated) | ||||||||||||||||||
|
List of 2 Events for Episode 1 at Tephra unit T
|
|||||||||||||||||||
4430 BCE ± 300 years Confirmed Eruption (Explosive / Effusive)
| Episode 1 | Eruption (Explosive / Effusive) | Tephra units S, R | ||||||||||||||||||
|---|---|---|---|---|---|---|---|---|---|---|---|---|---|---|---|---|---|---|---|
| 4430 BCE ± 300 years - Unknown | Evidence from Isotopic: 14C (calibrated) | ||||||||||||||||||
|
List of 2 Events for Episode 1 at Tephra units S, R
|
|||||||||||||||||||
4500 BCE ± 200 years Confirmed Eruption (Explosive / Effusive)
| Episode 1 | Eruption (Explosive / Effusive) | |||||||||||||||||||
|---|---|---|---|---|---|---|---|---|---|---|---|---|---|---|---|---|---|---|---|
| 4500 BCE ± 200 years - Unknown | Evidence from Isotopic: 14C (uncalibrated) | ||||||||||||||||||
|
List of 2 Events for Episode 1
|
|||||||||||||||||||
4960 BCE ± 200 years Confirmed Eruption (Explosive / Effusive)
| Episode 1 | Eruption (Explosive / Effusive) | ||||||||||||||||||||||||
|---|---|---|---|---|---|---|---|---|---|---|---|---|---|---|---|---|---|---|---|---|---|---|---|---|
| 4960 BCE ± 200 years - Unknown | Evidence from Isotopic: 14C (uncalibrated) | |||||||||||||||||||||||
|
List of 3 Events for Episode 1
|
||||||||||||||||||||||||
5880 BCE ± 200 years Confirmed Eruption (Explosive / Effusive)
| Episode 1 | Eruption (Explosive / Effusive) | Tephra unit P | ||||||||||||||||||
|---|---|---|---|---|---|---|---|---|---|---|---|---|---|---|---|---|---|---|---|
| 5880 BCE ± 200 years - Unknown | Evidence from Isotopic: 14C (calibrated) | ||||||||||||||||||
|
List of 2 Events for Episode 1 at Tephra unit P
|
|||||||||||||||||||
6320 BCE ± 200 years Confirmed Eruption (Explosive / Effusive)
| Episode 1 | Eruption (Explosive / Effusive) | ||||||||||||||||||||||||
|---|---|---|---|---|---|---|---|---|---|---|---|---|---|---|---|---|---|---|---|---|---|---|---|---|
| 6320 BCE ± 200 years - Unknown | Evidence from Isotopic: 14C (uncalibrated) | |||||||||||||||||||||||
|
List of 3 Events for Episode 1
|
||||||||||||||||||||||||
7420 BCE ± 500 years Confirmed Eruption (Explosive / Effusive)
| Episode 1 | Eruption (Explosive / Effusive) | |||||||||||||||||||
|---|---|---|---|---|---|---|---|---|---|---|---|---|---|---|---|---|---|---|---|
| 7420 BCE ± 500 years - Unknown | Evidence from Isotopic: 14C (uncalibrated) | ||||||||||||||||||
|
List of 2 Events for Episode 1
|
|||||||||||||||||||
7690 BCE ± 500 years Confirmed Eruption (Explosive / Effusive)
| Episode 1 | Eruption (Explosive / Effusive) | |||||||||||||||||||||||||||||
|---|---|---|---|---|---|---|---|---|---|---|---|---|---|---|---|---|---|---|---|---|---|---|---|---|---|---|---|---|---|
| 7690 BCE ± 500 years - Unknown | Evidence from Isotopic: 14C (uncalibrated) | ||||||||||||||||||||||||||||
|
List of 4 Events for Episode 1
|
|||||||||||||||||||||||||||||
This compilation of synonyms and subsidiary features may not be comprehensive. Features are organized into four major categories: Cones, Craters, Domes, and Thermal Features. Synonyms of features appear indented below the primary name. In some cases additional feature type, elevation, or location details are provided.
Synonyms |
||||
| Fuego, Volcán de | Fuego de Colima | Tzapotlán | ||||
Cones |
||||
| Feature Name | Feature Type | Elevation | Latitude | Longitude |
| Apaxtepec | Pyroclastic cone | 1720 m | 19° 38' 0.00" N | 103° 30' 0.00" W |
| Carpintero Norte, El | Pyroclastic cone | 1700 m | 19° 44' 0.00" N | 103° 44' 0.00" W |
| Carpintero Sur, El | Pyroclastic cone | 1760 m | 19° 43' 0.00" N | 103° 44' 0.00" W |
| Colima, Nevado de
Cuidad Guzmán, Volcán de |
Stratovolcano | 4226 m | 19° 33' 48.00" N | 103° 36' 30.00" W |
| Comal Chico | Pyroclastic cone | 1400 m | 19° 44' 0.00" N | 103° 48' 0.00" W |
| Comal Grande | Pyroclastic cone | 1500 m | 19° 45' 0.00" N | 103° 48' 0.00" W |
| Cuauhtemoc | Pyroclastic cone | 960 m | 19° 37' 0.00" N | 103° 55' 0.00" W |
| Erita, La | Pyroclastic cone | 1720 m | 19° 39' 0.00" N | 103° 45' 0.00" W |
| San Isidro | Pyroclastic cone | 1700 m | 19° 37' 0.00" N | 103° 45' 0.00" W |
| Telcampana | Pyroclastic cone | 1460 m | 19° 42' 0.00" N | 103° 46' 0.00" W |
| Tezontal | Pyroclastic cone | 1280 m | 19° 37' 0.00" N | 103° 24' 0.00" W |
| Usmajac | Pyroclastic cone | 1420 m | 19° 52' 0.00" N | 103° 32' 0.00" W |
Domes |
||||
| Feature Name | Feature Type | Elevation | Latitude | Longitude |
| Volcanicito, El | Dome | 3542 m | 19° 31' 1.00" N | 103° 36' 36.00" W |
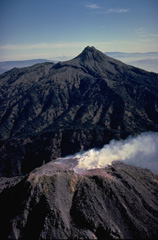 A steam plume pours off the summit of Colima volcano in June 1978, with sharp-peaked Nevado de Colima in the background to the north. During an eruptive period from December 1977 to June 1982, growth of the summit lava dome was accompanied by periodic small exposions and block-and-ash flows. A lava flow was extruded down the south flank beginning in December 1981.
 The Colima volcanic complex consists of the massive overlapping edifices Nevado de Colima (the highest point of the complex to the right) and Volcán de Colima (left). Volcán de Colima was constructed within a 5-km-wide caldera that opens to the south and has been the source of large debris avalanches. Frequent historical eruptions have included dome growth, explosive activity, pyroclastic flows, and lava flows.
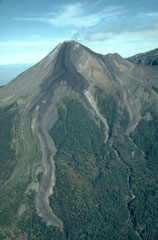 During an eruption from December 1975 to June 1976 lava flows from the Colima summit lava dome descended the E and SE flanks. The SE flow (left) split into two lobes, the longest of which traveled 3.5 km. Another flow traveled initially to the NE before diverting around El Volcancito, the smaller cone on the right horizon, and descended the E flank. All three lobes cross the upper-vegetation line that marks the location of the caldera wall that has been largely buried.
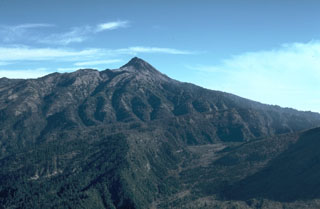 The lower area in the foreground of this view of Nevado de Colima is the moat of a large horseshoe-shaped caldera. The steep rim forms the forested arcuate ridge in the center. The caldera formed during collapse of the ancestral Colima, south of the current cone. The flanks of modern-day Colima, which have filled much of the caldera and overtopped in on three sides, appear to the lower right.
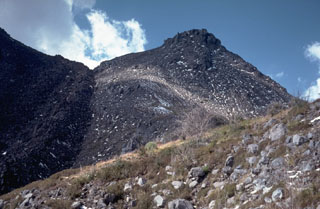 The peak to the upper right is El Volcancito, a lava dome on the NE flank of Colima that began extruding on 12 June 1869 following large explosive eruptions. The dark-colored lava flow with the steep margins to the left erupted from the summit dome during 1975-76. The flow descended the NE flank towards the saddle and then split into two lobes on either side of Volcancito and traveled N and SE.
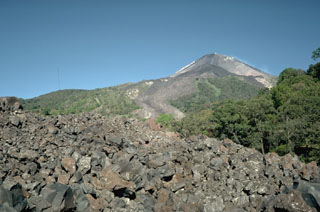 The lava flow in the foreground, which was emplaced during the 1975-76 eruption of Mexico's Colima volcano, can be seen descending through the vegetation at the center. The flow originated from the summit and traveled 3.5 km down the SE flank. The flow bifurcated on the upper slopes to form another lobe that traveled E, forming the darker area that descends into the vegetation at the upper right.
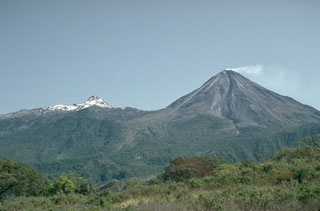 A weak plume from the summit of Mexico's Colima volcano in 1992 with snow-capped Nevado de Colima to the left; view from the WSW. Frequent eruptions have been recorded at Colima since the 16th century. Eruptions have been dominated during the past century by lava effusion associated with lava dome growth, explosive eruptions of varying magnitude, and frequent pyroclastic flows.
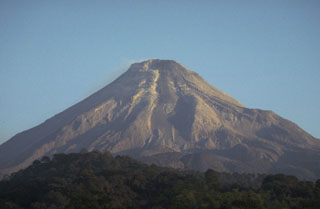 A lava flow travels down the upper flank of Colima in this 20 January 1982 view from the south. The dark-colored flow can be seen descending from the dome down the center. A period of lava dome growth with intermittent small explosions and block-and-ash flows had begun in December 1977. Renewed lava extrusion had begun on 9 December 1980.
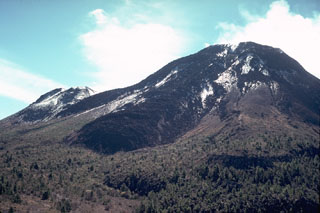 The thick viscous lava flow in the center was emplaced in 1961 during a period of dome growth. The flow traveled over the rim of the summit crater, eventually reaching the caldera floor by the end of 1962. The flow is seen here in 1978 from the caldera rim NW of the Colima summit. El Volcancito, the lava dome forming the NE-flank peak to the left, formed during the 1869 eruption. The forested lava flow to the lower right was probably erupted in 1872.
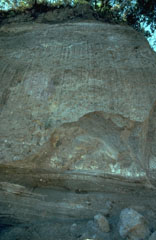 The bedded deposits at the base of this outcrop on the SW flank of Colima near the village of San Antonio are pyroclastic flow and pyroclastic surge deposits from an eruption that was radiocarbon dated to about 4,300 years ago. The thick deposit forming the majority of the outcrop is a debris avalanche deposit produced by collapse of the volcano. Erosion at the base of this deposit has exposed its mottled internal texture, reflecting various lithologic units that were transported without being mixed together.
 This painting by Rugendas published in 1856 depicts the active crater of Colima as it appeared in 1834 during the first scientific expedition to the summit. The painting shows the broad, deep crater excavated by the major explosive eruption of 15 February 1818. This eruption produced pyroclastic flows and abundant ash emission. Ashfall was reported up to 440 km away in Querétaro, Mexico City, Zacateras, and San Luis Potosí. Nevado de Colima appears in the background.
 This sketch shows an eruption of Colima on 16 April 1872, as seen from the SE with Nevado de Colima peak on the right skyline. The sketch correctly depicts the eruption as originating from El Volcancito, a NE-flank vent. This event began at 10 in the morning and lasted for 30 minutes. The 1872 eruption began on 26 February and lasted until 14 March of the next year, when ashfall occurred in Colima City 35 km to the south.
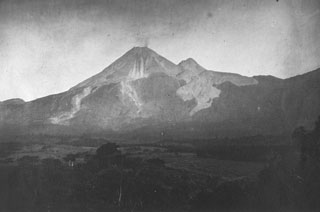 This 11 March 1901 photo from the east shows a small plume from the summit of Colima during a period of intermittent mild explosive eruptions that began in 1893. This eruption included the emission of small lava flows from the summit during 1895-1902. The unvegetated lava flows descending from El Volcancito, the dome on the NE (right) flank, were produced during its formation in 1869.
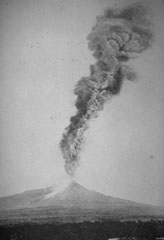 An ash plume towers above Colima on 7 March 1903 in this view from the south. A large explosive eruption on 15 February produced abundant ashfall and pyroclastic flows. The light-colored area down the flank to the left may be pyroclastic flow deposits. More than 20 large explosions, including this one, took place between 15 February and 14 March.
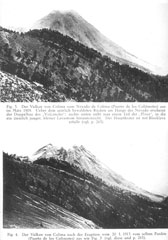 These two photos show the summit of Volcán de Colima from Nevado de Colima in 1909 (top) and 1913 (bottom). They illustrate the effects of a major explosive eruption on 20 January 1913, which removed nearly 100 m of the upper part of the cone and created a 450-m-wide crater that was at least 350 m deep. The eruption produced heavy ashfall and pyroclastic flows that traveled down all flanks. This continued the typical Colima cycle of century-long dome growth and minor explosions culminating in a very powerful explosive eruption.
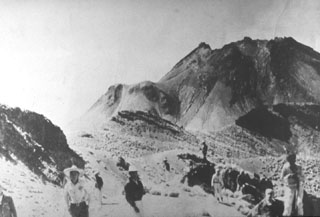 The powerful 1913 explosive eruption at Colima removed about 100 m of the summit and created a large 450-m-wide crater. The jagged 1913 crater rim is seen here in 1936 from Nevado de Colima. Lava had partially filled the 350-m-deep crater, but did not overflow the rim until 1961. El Volcancito, the lava dome created in 1869, is the feature on the left side of the cone.
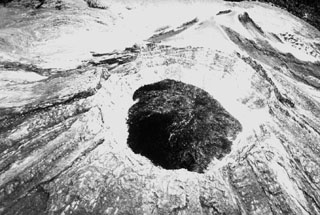 A 1941 aerial photo from the SW shows a dark lava dome that was extruded into the 450-m-wide crater created by the powerful explosive eruption of January 1913. In 1922 the crater floor had a depth of about 300 m and was covered by debris from the crater walls. By May 1930 the crater bottom lay about 150 below the crater rim, and when the crater was visited in January 1931 black lava was up to 50 m below the notch on the northern crater rim. Renewed dome growth in 1957 soon filled the crater and by 1961 lava began flowing over the crater rim.
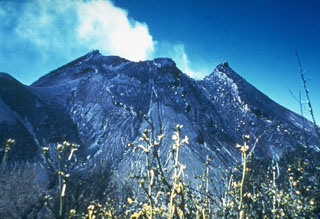 A gas plume rises above a growing lava dome below the crater rim of Colima in May 1958. The dome, which had been at a level 50 m below the deep notch in the northern crater rim (right) for several decades, had begun growing in May 1957 and eventually filled the crater. In 1961 lava began overflowing the crater through this notch. The photo was taken from the NE, with the NE-flank El Volcancito lava dome to the far left.
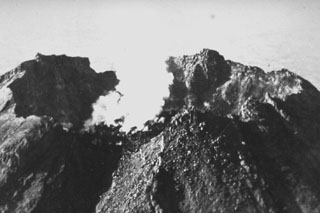 This 1958 photo shows a degassing lava dome in the 450-m-wide summit crater of Colima. Renewed dome growth had begun on 14 May 1957 after a period of quiescence since the early 1930's, and the dome rose 70 m by the end of the year. Dome growth continued for several years, and by 1961 lava began overflowing the crater rim.
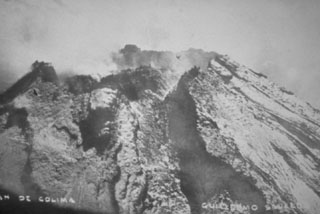 By the time that this 7 June 1960 photo was taken at Colima, the lava dome had risen to the height of the crater rim. The dome had begun growing again in May 1957 after about 25 years of quiescence, from a depth about 50 m below the notch in the northern crater rim (center) known as La Gran Vena. In 1961 this dome growth resulted in lava flowing out of the crater through this notch and down the northern flank.
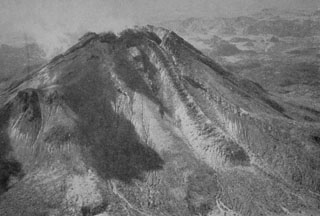 Renewed growth of the lava dome in the summit crater began in 1957. By the time of this aerial photo from the NE in 1961, lava had spilled over a notch in the northern crater rim and produced the lava flow seen here descending the northern flank to the lower right. By the end of 1962 the flow had traveled 1 km from the summit, reaching the caldera floor.
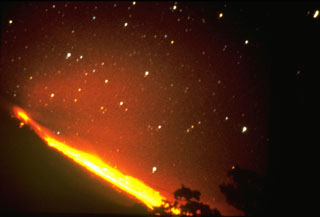 Incandescent blocks dislodging from a slow-moving lava flow create an incandescent path below stars in this 24 April 1961 night-time long exposure of Colima. Following lava dome growth in the summit crater, a lava flow began traveling down the northern flank in 1961 and reached the caldera moat by the end of 1962.
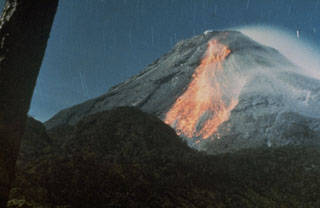 A night-time long exposure photo shows incandescent blocks rolling down the south flank of Colima after being dislodged from the 1982 lava flow. Lava movement down the south flank had begun on 9 December 1981 and was preceded by intermittent small explosions accompanying growth of the summit lava dome.
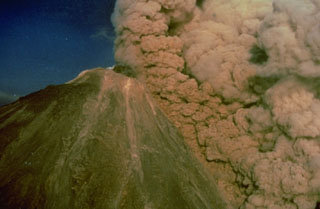 An ash plume rises above a pyroclastic flow traveling down the SW flank of Colima on 16 April 1991, colored orange by the late-afternoon sun. The pyroclastic flow was produced by collapse of unstable parts of the summit lava dome. The black mass at the summit is a lava dome that began growing on 1 March. Later in the eruption, which ended in October, a lava flow traveled down the SW flank to 2,600 m elevation from the roughly 3,850-m-high summit.
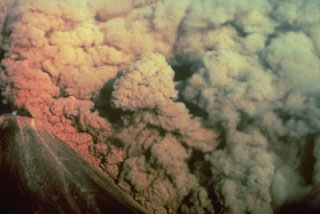 A convecting ash column rises above a small pyroclastic flow on the SW flank of Colima volcano in México on 16 April 1991. The pyroclastic flow, colored by the late-afternoon sun, was produced by the collapse of portions of the summit lava dome.
 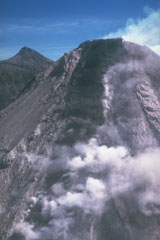 A lava flow advances down the steep upper SW flank of Colima in 1991. Aerial observations revealed lateral levees, pressure ridges near the flow front, and a lava channel within which most of the flow was advancing. The flow was about 100 m wide, 30 m thick, and 300 m long at the time of this 20 April 1991 photograph. Renewed lava extrusion took place following the partial collapse of the summit dome on 16 April. Nevado de Colima is in the background.
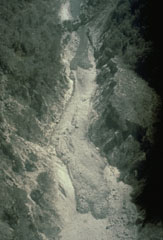 This 24 April 1991 aerial photo shows deposits from the 1991 eruption of Colima in the lower part of the Barranca El Cordobán on the south flank. The deposits at the bottom of the photo with rounded flow fronts and well-defined levees originated from block-and-ash flows. The darker, more recent deposits near the top of the photo contain a higher amount of juvenile (fresh magmatic) material.
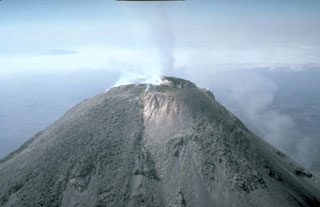 An aerial view from the east shows a weak plume from the 1991 summit dome and the geothermal area directly east of the dome in the 1987 vent. The lighter deposits in center of the photo are hydrothermally altered, forming a highly unstable area similar to those that collapsed to the south on 16 April.
 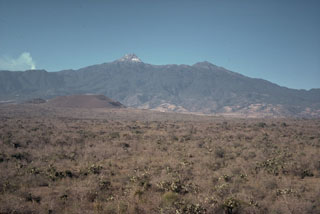 A group of nearly a dozen scoria cones and lava flows were erupted during the late Pleistocene on the floor of the southern Colima graben immediately NE and NW of the Colima volcanic complex. Cerro Apaxtepec (left center), one of these young cones, is seen here with the peak of Nevado de Colima in the center-background. A small plume rises from the active Fuego de Colima volcano to the left.
 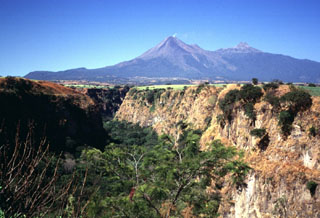 Repeated flank failure events from both Volcán Colima (left) and Nevado de Colima (right) have lefta thick apron of debris avalanche deposits on three sides of the complex. This steep-sided, 120-m-deep canyon wall at La Platanera, SE of Colima, exposes deposits inferred to represent at least seven major debris avalanches. The vegetation line on Colima volcano marks the largely buried rim of a horseshoe-shaped collapse scarp that has been the source of one or more recent avalanches.
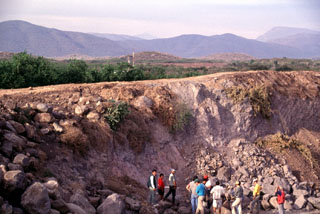 Collapse of México's Colima volcanic complex during the late Pleistocene produced a major debris avalanche and debris flow that traveled 120 km to the Pacific Ocean. The quarried hummock in the foreground and the two brown hills in the middle distance are composed of material transported more than 100 km from Colima volcano (seen in the far distance above the left-hand hummock) and incorporated from valley floors during transport.
 Textures associated with volcanic landslides are preserved in this quarry wall more than 100 km from the source of this major avalanche from México's Colima volcano. Large fractured blocks appear at the top of the exposure, and a color mottling is produced by adjacent segments of the volcano or valley floor material incorporated during transport. A 2-m-high ruler provides scale.
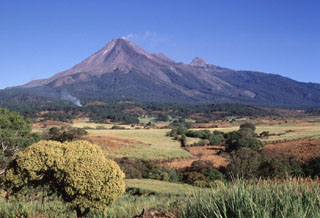 Colima (left), with a diffuse gas plume drifting from its summit, and Nevado de Colima (right) form a pair of edifices comprising the Colima volcanic complex. The modern Colima cone was constructed during the past 2,600 years within a large horseshoe-shaped flank collapse scarp that opens towards the south. The modern edifice has overtopped the eastern caldera rim (roughly corresponding to the vegetation line), and unvegetated lava flows that were emplaced during 1975-76 are visible down the outer flanks.
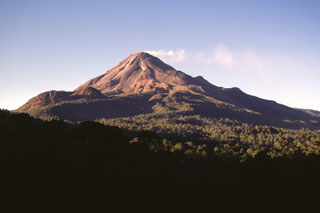 Two lava domes, known as Los Hijos del Volcán, form the two hills on the southern flank just below the left horizon of Colima. They are the southernmost of the Colima volcanic complex vents, which have erupted further towards the south through time. The 1981-1982 lava flow forms the lobe descending diagonally from the summit to the left.
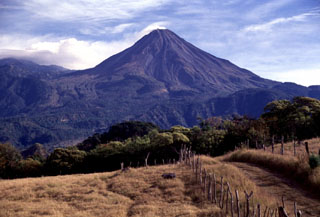 Volcán de Colima was constructed within a large horseshoe-shaped scarp formed by repetitive collapse of a previous edifice. The northern scarp rim forms the arcuate ridge to the far-left of this view from the SW. The modern cone was built over the past 2,600 years and had grown to a height of 400 m above the caldera rim at the time of this 1997 photo. Lava flows form much of the flanks.
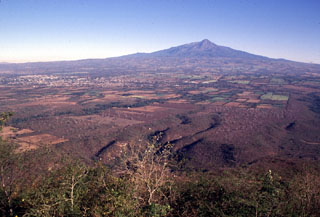 The history of the Colima volcanic complex has been characterized by repetitive collapse of the cones, producing rapid debris avalanches that can travel far from their source. The entire broad apron south of Colima in this view, including the area underlying Colima City to the left, is formed of deposits produced by volcanic landslides and associated lahars. The youngest avalanche, about 2,600 years ago, traveled 35 km as far as the city of Colima.
 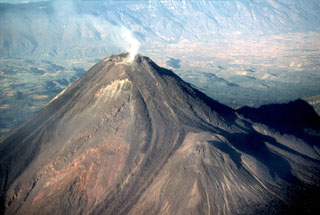 The NE-most of two lava flows produced during the 1975-76 eruption descended the flank of the summit cone until it encountered the 1869 El Volcancito lava dome (lower right). The flow then bifurcated into two lobes to the north and south. The Colima graben floor to the upper left is blanketed by debris avalanche deposits that formed during collapse of previous edifices.
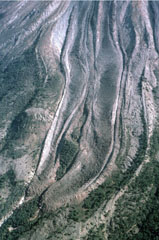 Two parallel lava lobes with lateral levees were emplaced in the Cordoban drainage on the SW flank of Colima, seen here on 8 February 1999. The flows are partly confined within levees of older lava flows. Lava extrusion had begun from the summit lava dome on 20 November 1998 and quickly produced a flow that split into three lobes as it diverged around topographic highs on the upper flanks.
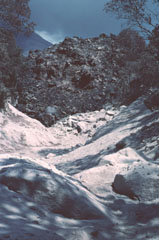 The slowly advancing front of the westernmost of three lava flows in the Cordobán drainage buries light-colored block-and-ash flow deposits formed during earlier collapse of the moving flow front. This photo was taken on 7 February 1999, about two and half months after lava extrusion began in November 1998. The flow front is about 30 m high.
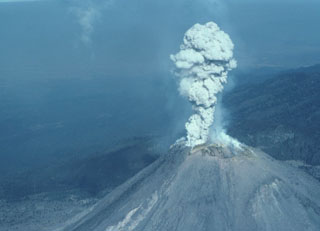 A small explosion 8 February 1999 produced a plume of gas and minor ash that is seen here from the SE about 5 seconds after the explosion began. Rapid lava extrusion began on 20 November 1998 and produced a lava dome in the 1994 crater that soon flowed over the crater rim, producing lava flows that descended the SW flank in several lobes. Block-and-ash flows from collapse of the flow fronts traveled down SW flank drainages. Periodic larger explosions occurred later during this eruption.
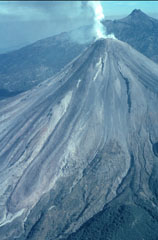 A helicopter view of Colima volcano towards the north on 8 February 1999 shows the degassing lava dome and active lava flows with Nevado de Colima in the background. A single flow originated from the summit dome, but the light-colored topographic high on the upper SW flank caused it to split into separate lobes. The easternmost lobe can be seen here descending diagonally to the lower left. The lava flow from 1991 was completely covered by this new flow.
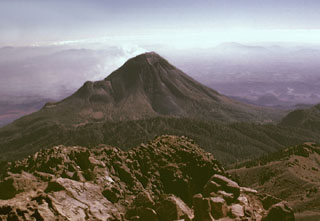 Colima volcano is seen here from the summit of neighboring Nevado de Colima. The forested ridge extending across the center of the photo is the rim of a large scarp formed by the collapse of the ancestral Colima edifice on the southern flank of Nevado. The modern Colima edifice grew within this scarp during the past few thousand years. The ridge on the NE (left) flank of Colima is El Volcancito, a lava dome that formed in 1869.
 The post-caldera cone of Nevado de Colima forms the high point of the Colima volcanic complex and is the highest peak in western México. The cone, formed of steeply dipping lava flows, was constructed within the youngest of three large scarps that date back to about 500,000 years and has since been extensively glaciated. The scarps open towards the east and formed in part as a result of large flank failures. The youngest is about 5 km in diameter and has a well-preserved western wall, from which this photo was taken.
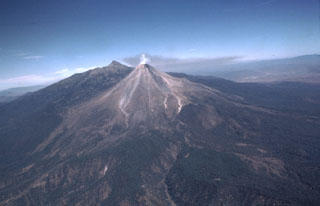 A diffuse gas plume emits from the summit of Colima with a rate of 320 ± 50 tons/day in February 1982. Volcanism at the Colima volcanic complex has migrated southward from the 300-500 km3 Nevado de Colima in the background. The ancestral Colima volcano was constructed on the southern flank of Nevado de Colima and then collapsed to form the scarp, which now holds the modern Colima edifice (foreground) that grew over the past 2,600 years.
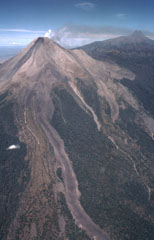 This 3.5-km-long lava flow was emplaced in 1975-76 at Colima. The flow split into two lobes on the upper flank; a shorter lobe drops diagonally to the right just below the light-colored barranca wall (center). Another flow during this eruption traveled down the NE flank and diverged around El Volcancito, the lava dome forming the ridge on the NE (right-hand) flank. A plume drifts to the NE toward the summit of Nevado de Colima.
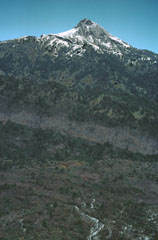 The summit of Nevado de Colima is seen here from the top of El Volcancito, a lava dome on the NE flank. A lava flow from Volcancito descended to the lower right. A light-colored east-dipping lava flow is exposed in the scarp wall, and the rim is seen diagonally across the center of the photo.
 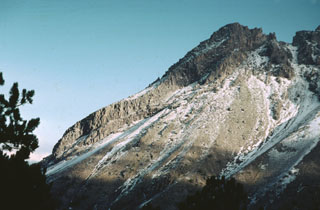 This 1978 photo shows an andesite lava flow several hundred meters long formed the northern summit ridge of Nevado de Colima, which was constructed within the youngest of three overlapping collapse scarps. This post-caldera cone has been extensively glaciated.
 Eleven scoria cones have formed in the southern Colima graben near the flanks of Colima volcano since the late Pleistocene. Cerro la Erita, a 190-m-high cone, is seen here from the NE. Cerro el Petacál (top right) is a fault block of older rocks that rises above the graben floor. Sierra Manantlán forms the 1,700-m-high western graben wall on the SW block of the rift zone.
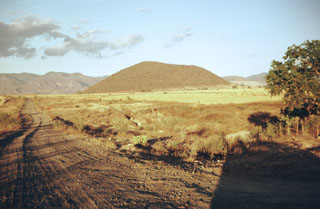 Volcán Telcampana, seen here from the SW, is one of a cluster of late-Pleistocene scoria cones that formed within the southern Colima graben, at the NW base of Nevado de Colima volcano. Pyroclastic surge deposits were emplaced when the cone erupted through a former lake or marsh and are exposed in roadcuts on the west side of the volcano.
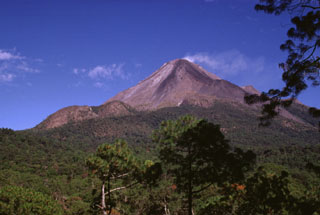 The two rounded peaks to the lower left are the Los Hijos del Volcán lava domes on Colima. These domes formed immediately south of the partially buried remnant of the SE caldera wall. The two domes and associated lava flows post-date caldera formation and mark the southernmost volcanic center of the Cantaro-Colima volcanic chain. Another flank lava dome, El Volcancito, forms the small ridge on the lower right flank, NE of the degassing summit.
 Ash deposits cleared from the streets of Ciudad Guzmán are piled up after the major explosive eruption of 20 January 1913. The eruption plume was calculated to have reached a height of 21 km, and the resulting ashfall caused significant disruption to the major city of Ciudad Guzmán, 25 km to the NE. Pyroclastic flows from this eruption reached as far as 17 km from the volcano.
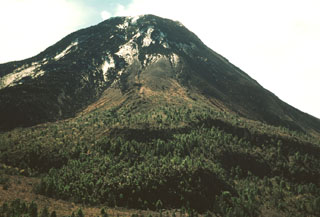 The exact age of the forested lava flow with the lobate margins in the foreground below El Volcancito on the NE flank of Colima is not known, but it may have been erupted in 1872. The 0.06 km3 lava flow traveled over the NW rim of the summit crater. Large explosive eruptions took place in 1872, and ash covered a >30 km radius. An explosion on 10 January 1873 caused ashfall 200 km away in Zamora.
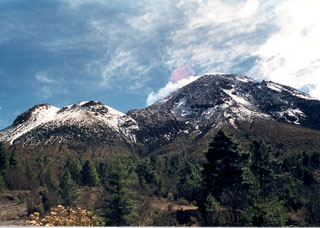 The two rounded peaks to the left, 700 m below and 1 km NE of the summit of Colima, are the El Volcancito lava-dome complex, with dome growth commencing on 12 June 1869 after large explosive eruptions. Deformation had been visible with the naked eye since 19 March. During the eruption 0.21 km3 of lava filled the NE part of the caldera, and lava flows from Volcancito flowed to the ESE and ENE over the caldera rim.
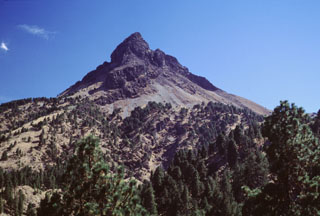 The summit of Nevado de Colima is the highest peak in western México and has been extensively eroded by glaciers, exposing steeply dipping lava flows. This cone is seen here from the northern rim of the outer collapse scarp, which contains a younger scarp on its NW side. This smaller 5-km-wide scarp formed during the late Pleistocene as a result of the collapse of the Nevado II edifice.
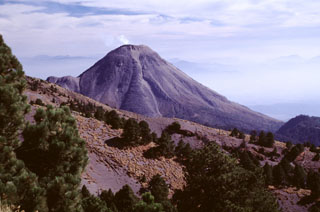 A weak gas plume rises from Volcán de Colima, seen here from the north near the antenna station on Nevado de Colima. The prominent lava flow descending the center of the north flank was erupted in 1961 at the time of the initial overflow of the 1913 crater. The ridge on the left-hand slope is El Volcancito, a NE-flank lava dome that began growing in 1869.
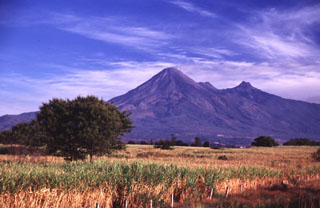 The Colima volcanic complex towers above the floor of the Colima graben. Volcán de Colima is seen here from the SE, with Nevado de Colima, the highest peak in western México, to the right. The flat ridge between the peaks is El Volcancito, a lava dome that began growing in 1869 on the NE flank. The Colima complex, including Volcán Cántaro to the north, forms the westernmost of three major N-S-trending volcanic chains perpendicular to the E-W trending Mexican Volcanic Belt.
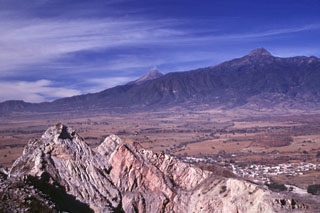 Volcán de Colima (center) and Nevado de Colima (right) are seen here from a quarry at Cerro la Escalera, 23 km NE. Up to 25 m of volcanic deposits (not visible in this photo) from both Cántaro and Colima volcanoes are exposed at Cerro la Escalera. The rocky outcrop in the foreground is a quarry wall cut in Cretaceous limestones for cement. The town of Huescalapa is visible to the lower right within the Colima graben.
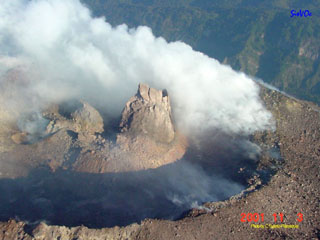 On 3 November 2001 this lava dome was observed on the north side of Colima's summit crater with a spine forming at the top. The spine was about 40 m tall, 40 m wide at its base, and smooth with vertical walls. Extrusion of this new dome had begun in early October and continued with a high extrusion rate, reaching a maximum on 14 October. This was part of a long eruption that began in November 1997 and was accompanied by small explosions.
 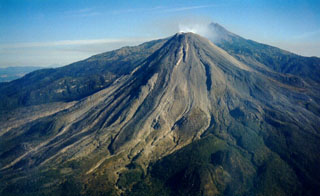 An aerial view of Colima's SW flank on 11 March 1999 shows recently erupted lava flows with lateral levees. Nevado de Colima appears to the right of the Volcán de Colima summit. Intermittent ash eruptions beginning in 1997 were followed by lava effusion, dome growth, pyroclastic flows, and more powerful explosive eruptions a year later.
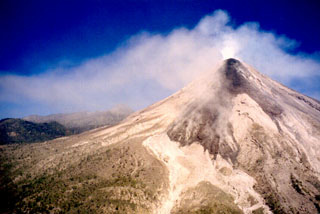 Lava flowing is seen here on 11 December 1998 flowing down the Cordobán drainage (barrancas) on Colima's upper SW flank. From left to right these headwaters comprise the Western, Central, and Eastern Cordobán. The light-colored areas below the lava flow lobes are pyroclastic flow deposits formed by collapse of the lava flow fronts.
 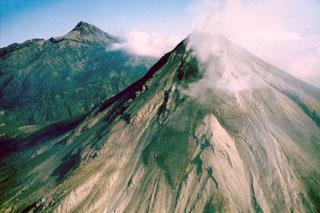 An overflight on the morning of 3 December 1998 shows lava flows advancing down the SW flank of Colima. The flow in the center is diverted by a topographic high into two lobes. By the previous day the three lava flows on the SSW flanks had reached estimated lengths of 1 km (westerly flow), 1.2 km (central flow), and 0.9 km (SE flow). Nevado de Colima is to the left.
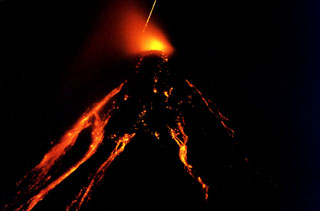 Time-lapse photograph (30 minutes) of Colima taken from a point near Suchitlán (18 km SSW) around 2300 on 26 November 1998. Incandescence appears above the summit lava dome, and lava flows and hot blocks detaching from the flows are visible down the flanks. Rapid lava extrusion had begun at 20 November 1998 following a year of small intermittent ash emissions. Long-term intermittent lava extrusion, dome growth, pyroclastic flows, and occasional strong explosions continued for several years.
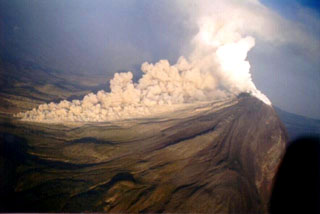 A pyroclastic flow descends the western flank of Colima at 0830 on 22 November 1998. The new growing lava dome had almost entirely filled the 1994 crater by the morning of the previous day, after which lava started flowing out of the summit crater area and producing block-and-ash flows at 3-5-minute intervals that mostly traveled south within the eastern branch of Barranca El Cordobán to distances of more than 4 km.
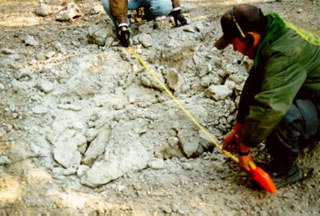 Scientists measure a shattered block ejected during Colima's 10 February 1999 explosion. Several impact craters were measured about 3 km NE of the summit, including from this block, which landed on the road to the caldera. This was the biggest explosion reported for the volcano in the previous 80 years. A substantial number of incandescent blocks started fires on the upper flanks.
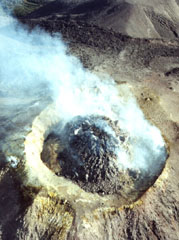 A degassing lava dome partially fills the crater at the summit of Colima on 11 January 2002. Renewed lava dome growth began in May 2001, and by the end of January 2002 the total volume of the dome was estimated to be 1,450,000 m3.
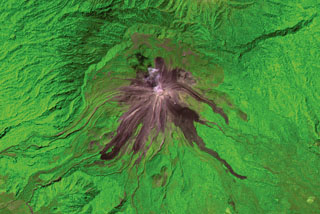 Recent lava flows from Volcán de Colima radiate from the summit in this 2001 ASTER satellite image (N is at the top; this image is approximately 13 km wide). The flows on the E and SE flanks were produced in 1975-76 and reached up to 3.5 km from the summit. The longest flows down the SW flank formed in 1998-99; the three major lobes seen here covered a SW-flank flow from 1991. The headwall of the horseshoe-shaped scarp to the N was produced by collapse of an older edifice.
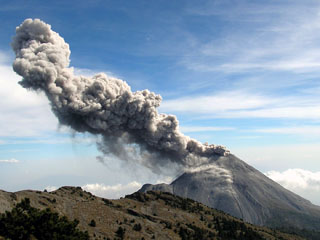 A Vulcanian explosion typical of activity at Colima is seen here from the north on 10 March 2007. Intermittent explosive eruptions with occasional lava dome growth and associated pyroclastic flows had been continuing for nearly a decade at this time.
  The Colima volcanic complex has two main edifices, the northern Nevado de Colima and the active Volcán de Colima to the south, both in the center of this December 2019 Planet Labs satellite image monthly mosaic (N is at the top; this image is approximately 44 km across). The active cone formed within a 5-km-wide flank collapse scarp, that produced a debris avalanche to the south, one of at least nine collapse events during the past 45,000 years.
The following 685 samples associated with this volcano can be found in the Smithsonian's NMNH Department of Mineral Sciences collections, and may be availble for research (contact the Rock and Ore Collections Manager). Catalog number links will open a window with more information.
| Catalog Number | Sample Description | Lava Source | Collection Date |
|---|---|---|---|
| NMNH 116597-1 | Leucite Basanite | -- | -- |
| NMNH 116597-10 | Minette | -- | -- |
| NMNH 116597-11 | Minette | -- | -- |
| NMNH 116597-12 | Basanite | -- | -- |
| NMNH 116597-13 | Basanite | -- | -- |
| NMNH 116597-14 | Basanite | -- | -- |
| NMNH 116597-15 | Monchiquite | -- | -- |
| NMNH 116597-16 | Minette | -- | -- |
| NMNH 116597-17 | Minette | -- | -- |
| NMNH 116597-18 | Basanite | -- | -- |
| NMNH 116597-19 | Minette | -- | -- |
| NMNH 116597-2 | Minette | -- | -- |
| NMNH 116597-20 | Basanite | -- | -- |
| NMNH 116597-21 | Minette | -- | -- |
| NMNH 116597-22 | Leucite Basanite | -- | -- |
| NMNH 116597-23 | Leucite Basanite | -- | -- |
| NMNH 116597-24 | Basanite | -- | -- |
| NMNH 116597-25 | Basanite | -- | -- |
| NMNH 116597-26 | Basanite | -- | -- |
| NMNH 116597-27 | Basanite | -- | -- |
| NMNH 116597-28 | Basanite | -- | -- |
| NMNH 116597-29 | Minette | -- | -- |
| NMNH 116597-3 | Minette | -- | -- |
| NMNH 116597-4 | Minette | -- | -- |
| NMNH 116597-5 | Minette | -- | -- |
| NMNH 116597-6 | Minette | -- | -- |
| NMNH 116597-7 | Minette | -- | -- |
| NMNH 116597-8 | Basaltic Andesite | -- | -- |
| NMNH 116597-9 | Basalt | -- | -- |
| NMNH 116598-1 | Andesite | -- | -- |
| NMNH 116598-10 | Andesite | -- | -- |
| NMNH 116598-11 | Andesite | -- | -- |
| NMNH 116598-12 | Andesite | -- | -- |
| NMNH 116598-13 | Andesite | -- | -- |
| NMNH 116598-14 | Andesite | -- | -- |
| NMNH 116598-15 | Andesite | -- | -- |
| NMNH 116598-16 | Andesite | -- | -- |
| NMNH 116598-17 | Andesite | -- | -- |
| NMNH 116598-18 | Andesite | -- | -- |
| NMNH 116598-19 | Andesite | -- | -- |
| NMNH 116598-2 | Andesite | -- | -- |
| NMNH 116598-20 | Andesite | -- | -- |
| NMNH 116598-21 | Andesite | -- | -- |
| NMNH 116598-22 | Andesite | -- | -- |
| NMNH 116598-23 | Andesite | -- | -- |
| NMNH 116598-24 | Andesite | -- | -- |
| NMNH 116598-25 | Andesite | -- | -- |
| NMNH 116598-26 | Andesite | -- | -- |
| NMNH 116598-27 | Andesite | -- | -- |
| NMNH 116598-28 | Andesite | -- | -- |
| NMNH 116598-29 | Andesite | -- | -- |
| NMNH 116598-3 | Andesite | -- | -- |
| NMNH 116598-30 | Andesite | -- | -- |
| NMNH 116598-31 | Andesite | -- | -- |
| NMNH 116598-32 | Andesite | -- | -- |
| NMNH 116598-33 | Andesite | -- | -- |
| NMNH 116598-34 | Andesite | -- | -- |
| NMNH 116598-35 | Andesite | -- | -- |
| NMNH 116598-36 | Andesite | -- | -- |
| NMNH 116598-37 | Andesite | -- | -- |
| NMNH 116598-38 | Andesite | -- | -- |
| NMNH 116598-39 | Andesite | -- | -- |
| NMNH 116598-4 | Andesite | -- | -- |
| NMNH 116598-40 | Andesite | -- | -- |
| NMNH 116598-41 | Andesite | -- | -- |
| NMNH 116598-42 | Andesite | -- | -- |
| NMNH 116598-43 | Andesite | -- | -- |
| NMNH 116598-44 | Andesite | -- | -- |
| NMNH 116598-45 | Andesite | -- | -- |
| NMNH 116598-46 | Andesite | -- | -- |
| NMNH 116598-47 | Andesite | -- | -- |
| NMNH 116598-48 | Andesite | -- | -- |
| NMNH 116598-49 | Andesite | -- | -- |
| NMNH 116598-5 | Andesite | -- | -- |
| NMNH 116598-50 | Andesite | -- | -- |
| NMNH 116598-51 | Andesite | -- | -- |
| NMNH 116598-52 | Andesite | -- | -- |
| NMNH 116598-53 | Andesite | -- | -- |
| NMNH 116598-54 | Andesite | -- | -- |
| NMNH 116598-6 | Andesite | -- | -- |
| NMNH 116598-7 | Andesite | -- | -- |
| NMNH 116598-8 | Andesite | -- | -- |
| NMNH 116598-9 | Andesite | -- | -- |
| NMNH 116603-1 | Andesite | -- | -- |
| NMNH 116603-10 | Dacite | -- | -- |
| NMNH 116603-2 | Andesite | -- | -- |
| NMNH 116603-3 | Andesite | -- | -- |
| NMNH 116603-4 | Andesite | -- | -- |
| NMNH 116603-5 | Andesite | -- | -- |
| NMNH 116603-6 | Andesite | -- | -- |
| NMNH 116603-7 | Andesite | -- | -- |
| NMNH 116603-8 | Andesite | -- | -- |
| NMNH 116603-9 | Dacite | -- | -- |
| NMNH 117274-1 | Andesitic Lava | -- | -- |
| NMNH 117274-2 | Andesitic Lava | -- | -- |
| NMNH 117274-3 | Andesitic Lava | -- | -- |
| NMNH 117274-4 | Andesitic Lava | -- | -- |
| NMNH 117274-5 | Andesitic Lava | -- | -- |
| NMNH 117274-6 | Andesitic Lava | -- | -- |
| NMNH 117274-7 | Andesitic Lava | -- | -- |
| NMNH 117593-1 | Pumice | -- | -- |
| NMNH 117593-10 | Pumice | -- | -- |
| NMNH 117593-100 | Andesite | -- | -- |
| NMNH 117593-101 | Andesite | -- | -- |
| NMNH 117593-102 | Andesite | -- | -- |
| NMNH 117593-103 | Andesite | -- | -- |
| NMNH 117593-104 | Andesite | -- | -- |
| NMNH 117593-105 | Andesite | -- | -- |
| NMNH 117593-106 | Andesite | -- | -- |
| NMNH 117593-107 | Andesite | -- | -- |
| NMNH 117593-108 | Andesite | -- | -- |
| NMNH 117593-109 | Andesite | -- | -- |
| NMNH 117593-11 | Pumice | -- | -- |
| NMNH 117593-110 | Andesite | -- | -- |
| NMNH 117593-111 | Andesite | -- | -- |
| NMNH 117593-112 | Andesite | -- | -- |
| NMNH 117593-113 | Andesite | -- | -- |
| NMNH 117593-114 | Andesite | -- | -- |
| NMNH 117593-115 | Andesite | -- | -- |
| NMNH 117593-116 | Andesite | -- | -- |
| NMNH 117593-117 | Andesite | -- | -- |
| NMNH 117593-118 | Andesite | -- | -- |
| NMNH 117593-119 | Andesite | -- | -- |
| NMNH 117593-12 | Mud | -- | -- |
| NMNH 117593-120 | Andesite | -- | -- |
| NMNH 117593-121 | Andesite | -- | -- |
| NMNH 117593-122 | Andesite | -- | -- |
| NMNH 117593-123 | Basaltic Andesite | -- | -- |
| NMNH 117593-124 | Basaltic Andesite | -- | -- |
| NMNH 117593-125 | Granodiorite | -- | -- |
| NMNH 117593-126 | Andesite | -- | -- |
| NMNH 117593-127 | Ash-Flow (?) Tuff | -- | -- |
| NMNH 117593-128 | Andesite | -- | -- |
| NMNH 117593-129 | Andesite | -- | -- |
| NMNH 117593-13 | Scoria | -- | -- |
| NMNH 117593-130 | Ash | -- | -- |
| NMNH 117593-131 | Ash | -- | -- |
| NMNH 117593-132 | Ash | -- | -- |
| NMNH 117593-133 | Ash | -- | -- |
| NMNH 117593-134 | Ash | -- | -- |
| NMNH 117593-135 | Ash | -- | -- |
| NMNH 117593-136 | Ash | -- | -- |
| NMNH 117593-137 | Ash | -- | -- |
| NMNH 117593-138 | Ash | -- | -- |
| NMNH 117593-139 | Ash | -- | -- |
| NMNH 117593-14 | Ash | -- | -- |
| NMNH 117593-140 | Ash | -- | -- |
| NMNH 117593-141 | Ash | -- | -- |
| NMNH 117593-142 | Ash | -- | -- |
| NMNH 117593-143 | Ash | -- | -- |
| NMNH 117593-144 | Ash | -- | -- |
| NMNH 117593-145 | Ash | -- | -- |
| NMNH 117593-146 | Ash | -- | -- |
| NMNH 117593-147 | Ash | -- | -- |
| NMNH 117593-148 | Ash | -- | -- |
| NMNH 117593-149 | Ash | -- | -- |
| NMNH 117593-15 | Pumice | -- | -- |
| NMNH 117593-150 | Ash | -- | -- |
| NMNH 117593-153 | Andesite | -- | -- |
| NMNH 117593-154 | Andesite | -- | -- |
| NMNH 117593-155 | Andesite | -- | -- |
| NMNH 117593-156 | Andesite | -- | -- |
| NMNH 117593-157 | Andesite | -- | -- |
| NMNH 117593-158 | Andesite | -- | -- |
| NMNH 117593-159 | Andesite | -- | -- |
| NMNH 117593-16 | Ash | -- | -- |
| NMNH 117593-160 | Andesite | -- | -- |
| NMNH 117593-161 | Andesite | -- | -- |
| NMNH 117593-162 | Andesite | -- | -- |
| NMNH 117593-163 | Andesite | -- | -- |
| NMNH 117593-164 | Andesite | -- | -- |
| NMNH 117593-165 | Andesite | -- | -- |
| NMNH 117593-166 | Andesite | -- | -- |
| NMNH 117593-167 | Andesite | -- | -- |
| NMNH 117593-168 | Andesite | -- | -- |
| NMNH 117593-169 | Andesite | -- | -- |
| NMNH 117593-17 | Pumice | -- | -- |
| NMNH 117593-170 | Andesite | -- | -- |
| NMNH 117593-171 | Andesite | -- | -- |
| NMNH 117593-172 | Andesite | -- | -- |
| NMNH 117593-173 | Andesite | -- | -- |
| NMNH 117593-174 | Andesite | -- | -- |
| NMNH 117593-175 | Andesite | -- | -- |
| NMNH 117593-176 | Andesite | -- | -- |
| NMNH 117593-177 | Andesite | -- | -- |
| NMNH 117593-178 | Andesite | -- | -- |
| NMNH 117593-179 | Andesite | -- | -- |
| NMNH 117593-18 | Pumice | -- | -- |
| NMNH 117593-180 | Andesite | -- | -- |
| NMNH 117593-181 | Andesite | -- | -- |
| NMNH 117593-182 | Andesite | -- | -- |
| NMNH 117593-183 | Andesite | -- | -- |
| NMNH 117593-184 | Andesite | -- | -- |
| NMNH 117593-185 | Andesite | -- | -- |
| NMNH 117593-186 | Andesite | -- | -- |
| NMNH 117593-187 | Ash | -- | -- |
| NMNH 117593-188 | Ash | -- | -- |
| NMNH 117593-189 | Ash | -- | -- |
| NMNH 117593-19 | Pumice | -- | -- |
| NMNH 117593-190 | Scoria | Volcan Tezontal | -- |
| NMNH 117593-192 | Diamictite | -- | -- |
| NMNH 117593-193 | Diamictite | -- | -- |
| NMNH 117593-194 | Andesite | -- | -- |
| NMNH 117593-195 | Andesite | -- | -- |
| NMNH 117593-196 | Trachyandesite | -- | -- |
| NMNH 117593-197 | Scoria (?) | Cuauhtemoc | -- |
| NMNH 117593-198 | Andesitic Inclusion | Comal Chico | -- |
| NMNH 117593-199 | Scoria | Apaxtepec | -- |
| NMNH 117593-2 | Pumice | -- | -- |
| NMNH 117593-20 | Pumice | -- | -- |
| NMNH 117593-200 | Scoria | Apaxtepec | -- |
| NMNH 117593-201 | Andesite | -- | -- |
| NMNH 117593-202 | Unidentified | -- | -- |
| NMNH 117593-203 | Unidentified | -- | -- |
| NMNH 117593-204 | Andesite | -- | -- |
| NMNH 117593-205 | Andesite | -- | -- |
| NMNH 117593-206 | Andesite | -- | -- |
| NMNH 117593-207 | Andesite | -- | -- |
| NMNH 117593-208 | Diamictite | -- | -- |
| NMNH 117593-209 | Basalt | -- | -- |
| NMNH 117593-21 | Pumice | -- | -- |
| NMNH 117593-210 | Unidentified | -- | -- |
| NMNH 117593-211 | Andesite | -- | -- |
| NMNH 117593-212 | Andesite | -- | -- |
| NMNH 117593-213 | Andesite | -- | -- |
| NMNH 117593-214 | Unidentified | -- | -- |
| NMNH 117593-215 | Andesite | -- | -- |
| NMNH 117593-216 | Andesite | -- | -- |
| NMNH 117593-217 | Andesite | -- | -- |
| NMNH 117593-218 | Andesite | -- | -- |
| NMNH 117593-219 | Tuff (?) | -- | -- |
| NMNH 117593-22 | Scoria | -- | -- |
| NMNH 117593-220 | Diamictite | -- | -- |
| NMNH 117593-221 | Diamictite | -- | -- |
| NMNH 117593-222 | Diamictite | -- | -- |
| NMNH 117593-223 | Diamictite | -- | -- |
| NMNH 117593-224 | Scoria | -- | -- |
| NMNH 117593-225 | Scoria | -- | -- |
| NMNH 117593-226 | Calc-alkaline Basalt | -- | -- |
| NMNH 117593-227 | Scoria | -- | -- |
| NMNH 117593-228 | Scoria | -- | -- |
| NMNH 117593-229 | Scoria | -- | -- |
| NMNH 117593-23 | Pumice | -- | -- |
| NMNH 117593-230 | Minette | -- | -- |
| NMNH 117593-231 | Basanite | El Carpintero | -- |
| NMNH 117593-232 | Pumice | -- | -- |
| NMNH 117593-233 | Pumice | -- | -- |
| NMNH 117593-234 | Scoria | -- | -- |
| NMNH 117593-235 | Scoria | -- | -- |
| NMNH 117593-236 | Pumice | -- | -- |
| NMNH 117593-237 | Pumice | -- | -- |
| NMNH 117593-238 | Tuff | -- | -- |
| NMNH 117593-239 | Tuff | -- | -- |
| NMNH 117593-24 | Pumice | -- | -- |
| NMNH 117593-240 | Ash | -- | -- |
| NMNH 117593-241 | Ash | -- | -- |
| NMNH 117593-242 | Ash | -- | -- |
| NMNH 117593-243 | Pumice | -- | -- |
| NMNH 117593-244 | Pumice | -- | -- |
| NMNH 117593-245 | Tuff | -- | -- |
| NMNH 117593-246 | Scoria | -- | -- |
| NMNH 117593-247 | Scoria | -- | -- |
| NMNH 117593-248 | Pumice | -- | -- |
| NMNH 117593-249 | Scoria | -- | -- |
| NMNH 117593-25 | Pumice | -- | -- |
| NMNH 117593-250 | Scoria | -- | -- |
| NMNH 117593-251 | Scoria | -- | -- |
| NMNH 117593-252 | Pumice | -- | -- |
| NMNH 117593-253 | Pumice | -- | -- |
| NMNH 117593-254 | Pumice | -- | -- |
| NMNH 117593-255 | Pumice | -- | -- |
| NMNH 117593-256 | Pumice | -- | -- |
| NMNH 117593-257 | Pumice | -- | -- |
| NMNH 117593-258 | Scoria | -- | -- |
| NMNH 117593-259 | Scoria | -- | -- |
| NMNH 117593-26 | Pumice | -- | -- |
| NMNH 117593-260 | Scoria | -- | -- |
| NMNH 117593-261 | Scoria | -- | -- |
| NMNH 117593-262 | Scoria | -- | -- |
| NMNH 117593-263 | Charcoal | -- | -- |
| NMNH 117593-264 | Pumice | -- | -- |
| NMNH 117593-265 | Pumice | -- | -- |
| NMNH 117593-266 | Scoria | -- | -- |
| NMNH 117593-267 | Scoria | -- | -- |
| NMNH 117593-268 | Scoria | -- | -- |
| NMNH 117593-269 | Scoria | -- | -- |
| NMNH 117593-27 | Pumice | -- | -- |
| NMNH 117593-270 | Pumice | -- | -- |
| NMNH 117593-271 | Scoria | -- | -- |
| NMNH 117593-272 | Scoria | -- | -- |
| NMNH 117593-273 | Scoria | -- | -- |
| NMNH 117593-274 | Scoria | -- | -- |
| NMNH 117593-275 | Scoria | -- | -- |
| NMNH 117593-276 | Scoria | -- | -- |
| NMNH 117593-277 | Scoria | -- | -- |
| NMNH 117593-278 | Scoria | -- | -- |
| NMNH 117593-279 | Scoria | -- | -- |
| NMNH 117593-28 | Ash | -- | -- |
| NMNH 117593-280 | Scoria | -- | -- |
| NMNH 117593-281 | Scoria | -- | -- |
| NMNH 117593-282 | Scoria | -- | -- |
| NMNH 117593-283 | Scoria | -- | -- |
| NMNH 117593-284 | Scoria | -- | -- |
| NMNH 117593-285 | Pumice | -- | -- |
| NMNH 117593-286 | Pumice | -- | -- |
| NMNH 117593-287 | Scoria | -- | -- |
| NMNH 117593-288 | Scoria | -- | -- |
| NMNH 117593-289 | Scoria | -- | -- |
| NMNH 117593-29 | Ash | -- | -- |
| NMNH 117593-290 | Scoria | -- | -- |
| NMNH 117593-291 | Scoria | -- | -- |
| NMNH 117593-292 | Ash-Flow Tuff | -- | -- |
| NMNH 117593-293 | Scoria | -- | -- |
| NMNH 117593-294 | Scoria | -- | -- |
| NMNH 117593-295 | Scoria | -- | -- |
| NMNH 117593-296 | Scoria | -- | -- |
| NMNH 117593-297 | Scoria | -- | -- |
| NMNH 117593-298 | Scoria | -- | -- |
| NMNH 117593-299 | Scoria | -- | -- |
| NMNH 117593-3 | Pumice | -- | -- |
| NMNH 117593-30 | Pumice | -- | -- |
| NMNH 117593-300 | Scoria | -- | -- |
| NMNH 117593-301 | Scoria | -- | -- |
| NMNH 117593-302 | Scoria | -- | -- |
| NMNH 117593-303 | Scoria | -- | -- |
| NMNH 117593-304 | Scoria | -- | -- |
| NMNH 117593-305 | Scoria | -- | -- |
| NMNH 117593-306 | Pumice | -- | -- |
| NMNH 117593-307 | Scoria | -- | -- |
| NMNH 117593-308 | Scoria | -- | -- |
| NMNH 117593-309 | Scoria | -- | -- |
| NMNH 117593-31 | Pumice | -- | -- |
| NMNH 117593-310 | Scoria | -- | -- |
| NMNH 117593-311 | Scoria | -- | -- |
| NMNH 117593-312 | Scoria | -- | -- |
| NMNH 117593-313 | Scoria | -- | -- |
| NMNH 117593-314 | Scoria | -- | -- |
| NMNH 117593-315 | Scoria | -- | -- |
| NMNH 117593-316 | Scoria | -- | -- |
| NMNH 117593-317 | Scoria | -- | -- |
| NMNH 117593-318 | Scoria | -- | -- |
| NMNH 117593-319 | Scoria | -- | -- |
| NMNH 117593-32 | Pumice | -- | -- |
| NMNH 117593-320 | Scoria | -- | -- |
| NMNH 117593-321 | Scoria | -- | -- |
| NMNH 117593-322 | Scoria | -- | -- |
| NMNH 117593-323 | Scoria | -- | -- |
| NMNH 117593-324 | Scoria | -- | -- |
| NMNH 117593-325 | Ash | -- | -- |
| NMNH 117593-326 | Ash | -- | -- |
| NMNH 117593-327 | Ash | -- | -- |
| NMNH 117593-328 | Scoria | -- | -- |
| NMNH 117593-329 | Scoria | -- | -- |
| NMNH 117593-33 | Pumice | -- | -- |
| NMNH 117593-330 | Scoria | -- | -- |
| NMNH 117593-331 | Scoria | -- | -- |
| NMNH 117593-332 | Scoria | -- | -- |
| NMNH 117593-333 | Scoria | -- | -- |
| NMNH 117593-334 | Scoria | -- | -- |
| NMNH 117593-335 | Pumice | -- | -- |
| NMNH 117593-336 | Scoria | -- | -- |
| NMNH 117593-337 | Scoria | -- | -- |
| NMNH 117593-338 | Scoria | -- | -- |
| NMNH 117593-339 | Scoria | -- | -- |
| NMNH 117593-34 | Pumice | -- | -- |
| NMNH 117593-340 | Scoria | -- | -- |
| NMNH 117593-341 | Scoria | -- | -- |
| NMNH 117593-342 | Pumice | -- | -- |
| NMNH 117593-343 | Scoria | -- | -- |
| NMNH 117593-344 | Pumice | -- | -- |
| NMNH 117593-345 | Pumice | -- | -- |
| NMNH 117593-346 | Pumice | -- | -- |
| NMNH 117593-347 | Scoria | -- | -- |
| NMNH 117593-348 | Pumice | -- | -- |
| NMNH 117593-349 | Hornblende Andesite | -- | -- |
| NMNH 117593-35 | Pumice | -- | -- |
| NMNH 117593-350 | Scoria | -- | -- |
| NMNH 117593-351 | Scoria | -- | -- |
| NMNH 117593-352 | Scoria | -- | -- |
| NMNH 117593-353 | Scoria | -- | -- |
| NMNH 117593-354 | Scoria | -- | -- |
| NMNH 117593-355 | Scoria | -- | -- |
| NMNH 117593-356 | Scoria | -- | -- |
| NMNH 117593-357 | Scoria | -- | -- |
| NMNH 117593-358 | Scoria | -- | -- |
| NMNH 117593-359 | Scoria | -- | -- |
| NMNH 117593-36 | Scoria | -- | -- |
| NMNH 117593-360 | Scoria | -- | -- |
| NMNH 117593-361 | Scoria | -- | -- |
| NMNH 117593-362 | Ash | -- | -- |
| NMNH 117593-363 | Scoria | -- | -- |
| NMNH 117593-364 | Scoria | -- | -- |
| NMNH 117593-365 | Scoria | -- | -- |
| NMNH 117593-366 | Ash | -- | -- |
| NMNH 117593-367 | Scoria | -- | -- |
| NMNH 117593-368 | Ash | -- | -- |
| NMNH 117593-369 | Ash | -- | -- |
| NMNH 117593-37 | Ash | -- | -- |
| NMNH 117593-370 | Scoria | -- | -- |
| NMNH 117593-371 | Ash | -- | -- |
| NMNH 117593-372 | Ash | -- | -- |
| NMNH 117593-373 | Scoria | -- | -- |
| NMNH 117593-374 | Scoria | -- | -- |
| NMNH 117593-375 | Scoria | -- | -- |
| NMNH 117593-376 | Scoria | -- | -- |
| NMNH 117593-377 | Scoria | -- | -- |
| NMNH 117593-378 | Ash | -- | -- |
| NMNH 117593-379 | Scoria | -- | -- |
| NMNH 117593-38 | Pumice | -- | -- |
| NMNH 117593-380 | Ash | -- | -- |
| NMNH 117593-381 | Ash | -- | -- |
| NMNH 117593-382 | Ash | -- | -- |
| NMNH 117593-383 | Ash | -- | -- |
| NMNH 117593-384 | Scoria | -- | -- |
| NMNH 117593-385 | Scoria | -- | -- |
| NMNH 117593-386 | Scoria | -- | -- |
| NMNH 117593-387 | Ash | -- | -- |
| NMNH 117593-388 | Ash | -- | -- |
| NMNH 117593-389 | Ash | -- | -- |
| NMNH 117593-39 | Pumice | -- | -- |
| NMNH 117593-390 | Ash | -- | -- |
| NMNH 117593-391 | Scoria | -- | -- |
| NMNH 117593-392 | Scoria | -- | -- |
| NMNH 117593-393 | Scoria | -- | -- |
| NMNH 117593-394 | Scoria | -- | -- |
| NMNH 117593-395 | Scoria | Cerro Apaxtepec | -- |
| NMNH 117593-396 | Scoria | Cerro Apaxtepec | -- |
| NMNH 117593-397 | Scoria | Cerro Apaxtepec | -- |
| NMNH 117593-398 | Scoria | -- | -- |
| NMNH 117593-399 | Scoria | -- | -- |
| NMNH 117593-4 | Pumice | -- | -- |
| NMNH 117593-40 | Pumice | -- | -- |
| NMNH 117593-400 | Scoria | -- | -- |
| NMNH 117593-401 | Scoria | -- | -- |
| NMNH 117593-402 | Scoria | -- | -- |
| NMNH 117593-403 | Scoria | -- | -- |
| NMNH 117593-404 | Scoria | -- | -- |
| NMNH 117593-405 | Scoria | -- | -- |
| NMNH 117593-406 | Scoria | -- | -- |
| NMNH 117593-407 | Ash | -- | -- |
| NMNH 117593-408 | Scoria | -- | -- |
| NMNH 117593-409 | Scoria | -- | -- |
| NMNH 117593-41 | Pumice | -- | -- |
| NMNH 117593-410 | Scoria | -- | -- |
| NMNH 117593-411 | Scoria | -- | -- |
| NMNH 117593-412 | Scoria | -- | -- |
| NMNH 117593-413 | Scoria | -- | -- |
| NMNH 117593-414 | Scoria | -- | -- |
| NMNH 117593-415 | Scoria | -- | -- |
| NMNH 117593-416 | Minette | Volcán San Isidro | -- |
| NMNH 117593-417 | Scoria | San Isidro Cone | -- |
| NMNH 117593-418 | Scoria | Volcán La Erita | -- |
| NMNH 117593-419 | Scoria | Telcampana Cone | -- |
| NMNH 117593-42 | Pumice | -- | -- |
| NMNH 117593-420 | Scoria | Telcampana Cone | -- |
| NMNH 117593-421 | Ash | -- | -- |
| NMNH 117593-422 | Ash | -- | -- |
| NMNH 117593-423 | Scoria | -- | -- |
| NMNH 117593-424 | Ash | -- | -- |
| NMNH 117593-425 | Ash | -- | -- |
| NMNH 117593-426 | Scoria | -- | -- |
| NMNH 117593-427 | Scoria | -- | -- |
| NMNH 117593-428 | Ash | -- | -- |
| NMNH 117593-429 | Scoria | -- | -- |
| NMNH 117593-43 | Pumice | -- | -- |
| NMNH 117593-430 | Scoria | -- | -- |
| NMNH 117593-431 | Scoria | -- | -- |
| NMNH 117593-432 | Scoria | -- | -- |
| NMNH 117593-433 | Scoria | -- | -- |
| NMNH 117593-434 | Scoria | -- | -- |
| NMNH 117593-435 | Scoria | -- | -- |
| NMNH 117593-436 | Scoria | -- | -- |
| NMNH 117593-437 | Scoria | -- | -- |
| NMNH 117593-438 | Scoria | -- | -- |
| NMNH 117593-439 | Scoria | -- | -- |
| NMNH 117593-44 | Pumice | -- | -- |
| NMNH 117593-440 | Scoria | -- | -- |
| NMNH 117593-441 | Scoria | -- | -- |
| NMNH 117593-442 | Scoria | -- | -- |
| NMNH 117593-443 | Scoria | -- | -- |
| NMNH 117593-444 | Scoria | -- | -- |
| NMNH 117593-445 | Scoria | -- | -- |
| NMNH 117593-446 | Scoria | -- | -- |
| NMNH 117593-447 | Scoria | -- | -- |
| NMNH 117593-448 | Scoria | -- | -- |
| NMNH 117593-449 | Scoria | -- | -- |
| NMNH 117593-45 | Pumice | -- | -- |
| NMNH 117593-450 | Scoria | -- | -- |
| NMNH 117593-451 | Ash | -- | -- |
| NMNH 117593-452 | Scoria | -- | -- |
| NMNH 117593-453 | Scoria | -- | -- |
| NMNH 117593-454 | Ash | -- | -- |
| NMNH 117593-455 | Ash | -- | -- |
| NMNH 117593-456 | Scoria | -- | -- |
| NMNH 117593-457 | Ash | -- | -- |
| NMNH 117593-458 | Scoria | -- | -- |
| NMNH 117593-459 | Scoria | -- | -- |
| NMNH 117593-46 | Pumice | -- | -- |
| NMNH 117593-460 | Scoria | -- | -- |
| NMNH 117593-461 | Ash | -- | -- |
| NMNH 117593-462 | Scoria | -- | -- |
| NMNH 117593-463 | Scoria | -- | -- |
| NMNH 117593-464 | Scoria | -- | -- |
| NMNH 117593-465 | Scoria | -- | -- |
| NMNH 117593-466 | Scoria | -- | -- |
| NMNH 117593-467 | Scoria | -- | -- |
| NMNH 117593-468 | Scoria | -- | -- |
| NMNH 117593-469 | Scoria | -- | -- |
| NMNH 117593-47 | Pumice | -- | -- |
| NMNH 117593-470 | Scoria | -- | -- |
| NMNH 117593-471 | Scoria | -- | -- |
| NMNH 117593-472 | Scoria | -- | -- |
| NMNH 117593-473 | Scoria | -- | -- |
| NMNH 117593-474 | Scoria | -- | -- |
| NMNH 117593-475 | Scoria | -- | -- |
| NMNH 117593-476 | Wood | -- | -- |
| NMNH 117593-477 | Scoria | -- | -- |
| NMNH 117593-478 | Scoria | -- | -- |
| NMNH 117593-479 | Scoria | -- | -- |
| NMNH 117593-48 | Pumice | -- | -- |
| NMNH 117593-480 | Scoria | -- | -- |
| NMNH 117593-481 | Scoria | -- | -- |
| NMNH 117593-482 | Scoria | -- | -- |
| NMNH 117593-483 | Ash | -- | -- |
| NMNH 117593-484 | Ash | -- | -- |
| NMNH 117593-485 | Ash | -- | -- |
| NMNH 117593-486 | Ash | -- | -- |
| NMNH 117593-487 | Ash | -- | -- |
| NMNH 117593-488 | Scoria | -- | -- |
| NMNH 117593-489 | Andesite | -- | -- |
| NMNH 117593-49 | Pumice | -- | -- |
| NMNH 117593-490 | Andesite | -- | -- |
| NMNH 117593-491 | Andesite | -- | -- |
| NMNH 117593-492 | Andesite | -- | -- |
| NMNH 117593-493 | Andesite | -- | -- |
| NMNH 117593-494 | Andesite | -- | -- |
| NMNH 117593-495 | Andesite | -- | -- |
| NMNH 117593-496 | Andesite | -- | -- |
| NMNH 117593-497 | Andesite | -- | -- |
| NMNH 117593-498 | Andesite | -- | -- |
| NMNH 117593-499 | Andesite | -- | -- |
| NMNH 117593-5 | Pumice | -- | -- |
| NMNH 117593-50 | Andesite | -- | -- |
| NMNH 117593-500 | Andesite | -- | -- |
| NMNH 117593-501 | Scoria | -- | -- |
| NMNH 117593-502 | Scoria | -- | -- |
| NMNH 117593-503 | Ash | -- | -- |
| NMNH 117593-504 | Minette | -- | -- |
| NMNH 117593-505 | Scoria | -- | -- |
| NMNH 117593-506 | Scoria | -- | -- |
| NMNH 117593-507 | Ash-Flow Tuff | -- | -- |
| NMNH 117593-508 | Charcoal | -- | -- |
| NMNH 117593-509 | Scoria | -- | -- |
| NMNH 117593-51 | Andesite | -- | -- |
| NMNH 117593-510 | Charcoal | -- | -- |
| NMNH 117593-511 | Scoria | -- | -- |
| NMNH 117593-512 | Charcoal | -- | -- |
| NMNH 117593-513 | Ash | -- | -- |
| NMNH 117593-514 | Scoria | -- | -- |
| NMNH 117593-515 | Charcoal | -- | -- |
| NMNH 117593-516 | Scoria | -- | -- |
| NMNH 117593-517 | Scoria | -- | -- |
| NMNH 117593-518 | Scoria | -- | -- |
| NMNH 117593-519 | Ash | -- | -- |
| NMNH 117593-52 | Ash | -- | -- |
| NMNH 117593-520 | Scoria | -- | -- |
| NMNH 117593-521 | Scoria | -- | -- |
| NMNH 117593-522 | Charcoal | -- | -- |
| NMNH 117593-523 | Scoria | -- | -- |
| NMNH 117593-524 | Charcoal | -- | -- |
| NMNH 117593-525 | Scoria | -- | -- |
| NMNH 117593-526 | Ash | -- | -- |
| NMNH 117593-527 | Ash | -- | -- |
| NMNH 117593-528 | Granulite | -- | -- |
| NMNH 117593-529 | Scoria | -- | -- |
| NMNH 117593-53 | Pumice | -- | -- |
| NMNH 117593-530 | Scoria | -- | -- |
| NMNH 117593-531 | Scoria | -- | -- |
| NMNH 117593-532 | Scoria | -- | -- |
| NMNH 117593-533 | Scoria | -- | -- |
| NMNH 117593-534 | Scoria | -- | -- |
| NMNH 117593-535 | Scoria | -- | -- |
| NMNH 117593-536 | Ash | -- | -- |
| NMNH 117593-537 | Scoria | -- | -- |
| NMNH 117593-538 | Scoria | -- | -- |
| NMNH 117593-539 | Scoria | -- | -- |
| NMNH 117593-54 | Pumice | -- | -- |
| NMNH 117593-540 | Scoria | -- | -- |
| NMNH 117593-541 | Scoria | -- | -- |
| NMNH 117593-542 | Scoria | -- | -- |
| NMNH 117593-543 | Scoria | -- | -- |
| NMNH 117593-544 | Scoria | -- | -- |
| NMNH 117593-545 | Scoria | -- | -- |
| NMNH 117593-546 | Scoria | -- | -- |
| NMNH 117593-547 | Scoria | -- | -- |
| NMNH 117593-548 | Ash | -- | -- |
| NMNH 117593-549 | Ash | -- | -- |
| NMNH 117593-55 | Andesite | -- | -- |
| NMNH 117593-550 | Scoria | -- | -- |
| NMNH 117593-551 | Scoria | -- | -- |
| NMNH 117593-552 | Scoria | -- | -- |
| NMNH 117593-553 | Scoria | -- | -- |
| NMNH 117593-554 | Scoria | -- | -- |
| NMNH 117593-555 | Scoria | -- | -- |
| NMNH 117593-556 | Scoria | -- | -- |
| NMNH 117593-557 | Scoria | -- | -- |
| NMNH 117593-558 | Scoria | -- | -- |
| NMNH 117593-559 | Scoria | -- | -- |
| NMNH 117593-56 | Andesite | -- | -- |
| NMNH 117593-560 | Scoria | -- | -- |
| NMNH 117593-561 | Scoria | -- | -- |
| NMNH 117593-562 | Scoria | -- | -- |
| NMNH 117593-563 | Scoria | -- | -- |
| NMNH 117593-564 | Scoria | -- | -- |
| NMNH 117593-565 | Scoria | -- | -- |
| NMNH 117593-566 | Scoria | -- | -- |
| NMNH 117593-567 | Lava | -- | -- |
| NMNH 117593-568 | Ash-Flow (?) Tuff | -- | -- |
| NMNH 117593-569 | Scoria | -- | -- |
| NMNH 117593-57 | Andesite | -- | -- |
| NMNH 117593-570 | Scoria | -- | -- |
| NMNH 117593-571 | Scoria | -- | -- |
| NMNH 117593-572 | Ash | -- | -- |
| NMNH 117593-573 | Ash | -- | -- |
| NMNH 117593-574 | Ash | -- | -- |
| NMNH 117593-575 | Ash | -- | -- |
| NMNH 117593-576 | Scoria | -- | -- |
| NMNH 117593-577 | Scoria | -- | -- |
| NMNH 117593-578 | Scoria | Volcán San Isidro | -- |
| NMNH 117593-579 | Volcanic Rock | -- | -- |
| NMNH 117593-58 | Andesite | -- | -- |
| NMNH 117593-580 | Pumice | -- | -- |
| NMNH 117593-581 | Ash | -- | -- |
| NMNH 117593-582 | Scoria | -- | -- |
| NMNH 117593-583 | Pumice | -- | -- |
| NMNH 117593-584 | Pumice | -- | -- |
| NMNH 117593-585 | Ash-Flow Tuff | -- | -- |
| NMNH 117593-586 | Dacite | -- | -- |
| NMNH 117593-59 | Andesite | -- | -- |
| NMNH 117593-6 | Ash | -- | -- |
| NMNH 117593-60 | Andesite | -- | -- |
| NMNH 117593-61 | Andesite | -- | -- |
| NMNH 117593-62 | Andesite | -- | -- |
| NMNH 117593-63 | Andesite | -- | -- |
| NMNH 117593-64 | Andesite | -- | -- |
| NMNH 117593-65 | Andesite | -- | -- |
| NMNH 117593-66 | Andesite | -- | -- |
| NMNH 117593-67 | Basalt | -- | -- |
| NMNH 117593-68 | Andesite | -- | -- |
| NMNH 117593-69 | Pumice | -- | -- |
| NMNH 117593-7 | Scoria | -- | -- |
| NMNH 117593-70 | Scoria | -- | -- |
| NMNH 117593-71 | Scoria | -- | -- |
| NMNH 117593-72 | Scoria | -- | -- |
| NMNH 117593-73 | Scoria | -- | -- |
| NMNH 117593-74 | Ash | -- | -- |
| NMNH 117593-75 | Scoria | -- | -- |
| NMNH 117593-76 | Scoria | -- | -- |
| NMNH 117593-77 | Andesite | -- | -- |
| NMNH 117593-78 | Trachyandesite | -- | -- |
| NMNH 117593-79 | Trachyandesite | -- | -- |
| NMNH 117593-8 | Scoria | -- | -- |
| NMNH 117593-80 | Andesite | -- | -- |
| NMNH 117593-81 | Pumice | -- | -- |
| NMNH 117593-82 | Andesite | -- | -- |
| NMNH 117593-83 | Andesite | -- | -- |
| NMNH 117593-84 | Volcanic Rock | -- | -- |
| NMNH 117593-85 | Andesite | -- | -- |
| NMNH 117593-86 | Andesite | -- | -- |
| NMNH 117593-87 | Andesite | -- | -- |
| NMNH 117593-88 | Volcanic Rock | -- | -- |
| NMNH 117593-89 | Trachyandesite | -- | -- |
| NMNH 117593-9 | Ash | -- | -- |
| NMNH 117593-90 | Andesite | -- | -- |
| NMNH 117593-91 | Andesite | -- | -- |
| NMNH 117593-92 | Basaltic Trachyandesite | -- | -- |
| NMNH 117593-93 | Trachyandesite | -- | -- |
| NMNH 117593-94 | Trachyandesite | -- | -- |
| NMNH 117593-95 | Andesite | -- | -- |
| NMNH 117593-96 | Andesite | -- | -- |
| NMNH 117593-97 | Andesite | -- | -- |
| NMNH 117593-98 | Andesite | -- | -- |
| NMNH 117593-99 | Andesite | -- | -- |
| NMNH 76975 | Volcanic Dust | -- | -- |
| NMNH 76976 | Volcanic Dust | -- | -- |
| Copernicus Browser | The Copernicus Browser replaced the Sentinel Hub Playground browser in 2023, to provide access to Earth observation archives from the Copernicus Data Space Ecosystem, the main distribution platform for data from the EU Copernicus missions. |
| MIROVA | Middle InfraRed Observation of Volcanic Activity (MIROVA) is a near real time volcanic hot-spot detection system based on the analysis of MODIS (Moderate Resolution Imaging Spectroradiometer) data. In particular, MIROVA uses the Middle InfraRed Radiation (MIR), measured over target volcanoes, in order to detect, locate and measure the heat radiation sourced from volcanic activity. |
| MODVOLC Thermal Alerts | Using infrared satellite Moderate Resolution Imaging Spectroradiometer (MODIS) data, scientists at the Hawai'i Institute of Geophysics and Planetology, University of Hawai'i, developed an automated system called MODVOLC to map thermal hot-spots in near real time. For each MODIS image, the algorithm automatically scans each 1 km pixel within it to check for high-temperature hot-spots. When one is found the date, time, location, and intensity are recorded. MODIS looks at every square km of the Earth every 48 hours, once during the day and once during the night, and the presence of two MODIS sensors in space allows at least four hot-spot observations every two days. Each day updated global maps are compiled to display the locations of all hot spots detected in the previous 24 hours. There is a drop-down list with volcano names which allow users to 'zoom-in' and examine the distribution of hot-spots at a variety of spatial scales. |
|
WOVOdat
Single Volcano View Temporal Evolution of Unrest Side by Side Volcanoes |
WOVOdat is a database of volcanic unrest; instrumentally and visually recorded changes in seismicity, ground deformation, gas emission, and other parameters from their normal baselines. It is sponsored by the World Organization of Volcano Observatories (WOVO) and presently hosted at the Earth Observatory of Singapore.
GVMID Data on Volcano Monitoring Infrastructure The Global Volcano Monitoring Infrastructure Database GVMID, is aimed at documenting and improving capabilities of volcano monitoring from the ground and space. GVMID should provide a snapshot and baseline view of the techniques and instrumentation that are in place at various volcanoes, which can be use by volcano observatories as reference to setup new monitoring system or improving networks at a specific volcano. These data will allow identification of what monitoring gaps exist, which can be then targeted by remote sensing infrastructure and future instrument deployments. |
| Volcanic Hazard Maps | The IAVCEI Commission on Volcanic Hazards and Risk has a Volcanic Hazard Maps database designed to serve as a resource for hazard mappers (or other interested parties) to explore how common issues in hazard map development have been addressed at different volcanoes, in different countries, for different hazards, and for different intended audiences. In addition to the comprehensive, searchable Volcanic Hazard Maps Database, this website contains information about diversity of volcanic hazard maps, illustrated using examples from the database. This site is for educational purposes related to volcanic hazard maps. Hazard maps found on this website should not be used for emergency purposes. For the most recent, official hazard map for a particular volcano, please seek out the proper institutional authorities on the matter. |
| IRIS seismic stations/networks | Incorporated Research Institutions for Seismology (IRIS) Data Services map showing the location of seismic stations from all available networks (permanent or temporary) within a radius of 0.18° (about 20 km at mid-latitudes) from the given location of Colima. Users can customize a variety of filters and options in the left panel. Note that if there are no stations are known the map will default to show the entire world with a "No data matched request" error notice. |
| UNAVCO GPS/GNSS stations | Geodetic Data Services map from UNAVCO showing the location of GPS/GNSS stations from all available networks (permanent or temporary) within a radius of 20 km from the given location of Colima. Users can customize the data search based on station or network names, location, and time window. Requires Adobe Flash Player. |
| DECADE Data | The DECADE portal, still in the developmental stage, serves as an example of the proposed interoperability between The Smithsonian Institution's Global Volcanism Program, the Mapping Gas Emissions (MaGa) Database, and the EarthChem Geochemical Portal. The Deep Earth Carbon Degassing (DECADE) initiative seeks to use new and established technologies to determine accurate global fluxes of volcanic CO2 to the atmosphere, but installing CO2 monitoring networks on 20 of the world's 150 most actively degassing volcanoes. The group uses related laboratory-based studies (direct gas sampling and analysis, melt inclusions) to provide new data for direct degassing of deep earth carbon to the atmosphere. |
| Large Eruptions of Colima | Information about large Quaternary eruptions (VEI >= 4) is cataloged in the Large Magnitude Explosive Volcanic Eruptions (LaMEVE) database of the Volcano Global Risk Identification and Analysis Project (VOGRIPA). |
| EarthChem | EarthChem develops and maintains databases, software, and services that support the preservation, discovery, access and analysis of geochemical data, and facilitate their integration with the broad array of other available earth science parameters. EarthChem is operated by a joint team of disciplinary scientists, data scientists, data managers and information technology developers who are part of the NSF-funded data facility Integrated Earth Data Applications (IEDA). IEDA is a collaborative effort of EarthChem and the Marine Geoscience Data System (MGDS). |

