Report on Manam (Papua New Guinea) — February 2005
Bulletin of the Global Volcanism Network, vol. 30, no. 2 (February 2005)
Managing Editor: Richard Wunderman.
Manam (Papua New Guinea) One death, 14 injuries due to 27 January eruption; stratospheric injection
Please cite this report as:
Global Volcanism Program, 2005. Report on Manam (Papua New Guinea) (Wunderman, R., ed.). Bulletin of the Global Volcanism Network, 30:2. Smithsonian Institution. https://doi.org/10.5479/si.GVP.BGVN200502-251020
Manam
Papua New Guinea
4.08°S, 145.037°E; summit elev. 1807 m
All times are local (unless otherwise noted)
On 24 October 2004 a strong eruption occurred at Manam (BGVN 29:10). Several more significant eruptions followed in late 2004 (BGVN 29:11), leading to the most severe and damaging one, which took place on 27 January 2005. That event occurred in conditions favorable to satellite imagery, enabling Andrew Tupper of the Darwin Volcanic Ash Advisory Centre (VAAC), and colleagues, to confirm that the associated ash cloud reached to over 20 km altitude, well into the stratosphere.
Satellite remote sensing documented 5 eruption plumes ascending to over 15 km during this issue's reporting interval, 23 October 2004-28 January 2005. One additional plume may have been missed by remote sensing in adverse weather conditions. Various images from the 2004 and 2005 eruptions are on the Darwin VAAC website (see Information Contacts, below). Sulfur dioxide is discussed there as well as on websites of the OMI-TOMS Volcanic Emissions Group and related sites.
The Bulletin has benefitted from reports by the Rabaul Volcano Observatory (RVO), the media, and the Darwin VAAC. Although the 27 January eruption received comparatively little press coverage, it caused several injuries and one death. RVO staff working at Manam faced challenging, hazardous conditions. The island had been home to ~ 9,500 now-displaced residents.
Summary of RVO observations. During the reporting interval both lava flows and pyroclastic flows reached the sea at various times (BGVN 29:10 and 29:11). The main pathways were the NE and SE valleys (table 2, figures 16 and 17). Intervals of tremor were common.
Table 2. A summary of RVO observations involving lava flows and pyroclastic flows associated with Manam's eruptions during 23 October 2004-28 January 2005. Andrew Tupper (of the Darwin VAAC) compiled this list from available RVO reports and communications with RVO staff.
| Date | Event Description |
| 24 Oct 2004 | Pyroclastic flows reached the sea and lava flowed 600 m down the SE valley. |
| 31 Oct 2004 | Three-lobed lava flow in NE valley, and possibly a small flow in the NW valley. |
| 11 Nov 2004 | Lava in NE valley. |
| 23-24 Nov 2004 | Lava in NE valley. "The flow that headed towards Bokure 1 terminated about 100 m away from the main road . . . the Kolang lava flow had reached the sea" (reported by Warisi observer Herman Tibong). Ash on roofs caused a number of houses to collapse. |
| 19-20 Dec 2004 | Lava and pyroclastic flows in SE valley. Pyroclastic flows stopped 200 m from the sea on the 19th (no report on what happened on the 20th). |
| 27-28 Jan 2005 | 14 injured and 1 dead at Warisi; debris voluminous and widespread on the island; ashfall reported ~230 km W of Manam. |
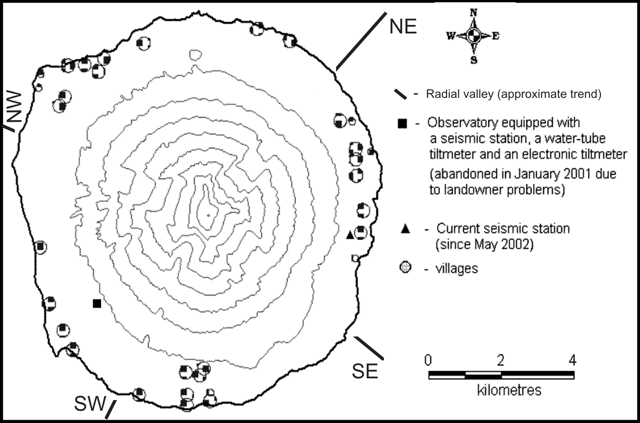 |
Figure 16. Map of Manam island made or updated circa 2002 (contour interval, 200 m). A temporary observatory was at Warisi (triangle, 'current seismic station') on the island's E side, but the eruption on 27 January 2005 destroyed it. Approximate trends of radial valleys were added by Bulletin editors. Courtesy of RVO. |
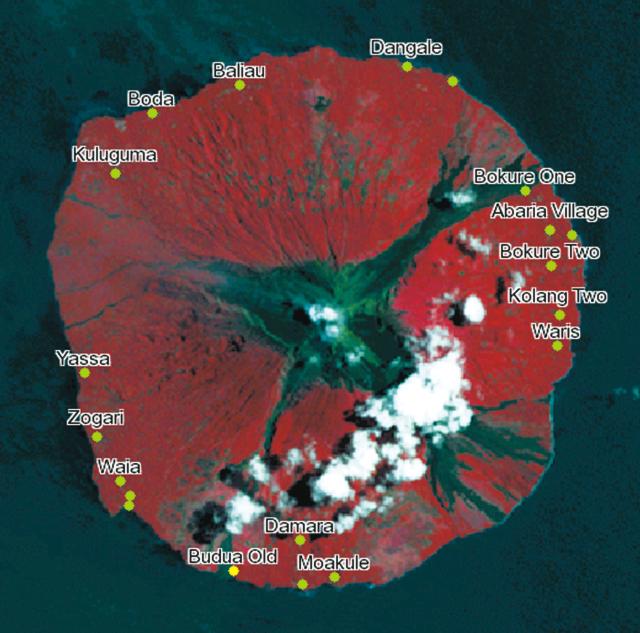 |
Figure 17. Annotated image of Manam indicating village and other place names on a false-color satellite photo (note the cloud cover; for scale, compare to previous figure). Source details are unknown. "Waris," is more commonly spelled "Warisi" in RVO reports. Courtesy of the PNG Mapserver website. |
Eruption on 27 January 2005. RVO reported that eruptive activity during the evening of 27 January was more severe than previous eruptions of the current eruptive period. As indicated on table 1, during 27-28 January there were 14 people injured and one person killed at Warisi village. RVO's monitoring base at Warisi was completely destroyed, taking out its HF radio, seismograph, and a satellite phone, thus preventing RVO from providing information on the current level of activity. The phone had been donated by an airline just a few weeks prior, provided as a means of aiding eruption-warning efforts. The station sat on the E flank at Warisi village (figures 1 and 2). RVO later recovered the station's seismograph and installed it on the island's NW side; they also restored radio communications.
According to the Papua New Guinea (PNG) news source,The National, some people had returned on 27 January from the displacement camps on the mainland to gather food from their island gardens, only to have their boat destroyed by impacts from erupted rocks. The National also reported that many of the residents of the island who were originally evacuated in November 2004 had returned. There were reports of several houses that had burned down from hot emissions and others that collapsed under the weight of ash and pyroclastic material. It was reported that after the large eruption on 27 January, local authorities planned to evacuate about 2,000 residents.
Ash fell at ~ 230 km W of Manam (in Ambunti district, East Sepik province, PNG). Tupper recognized NW monsoon winds that took low-level ash SE. Thus, the ash that fell in Ambunti must have traveled at a higher altitude, which Tupper estimated to be above 6 km altitude.
The October-January eruptive sequence. Figure 18 plots eruption heights versus time during 23 October 2004 to late January 2005. Three kinds of eruption-height estimates appear: those from pilot reports, RVO's estimates (ground-based observations), and Tupper's post-analysis studies of satellite data. In a descussion below, Tupper mentions the differences between the three height-estimate techniques. The line showing alert level corresponds to the right-hand scale. Six eruptive clouds are clear on the graph.
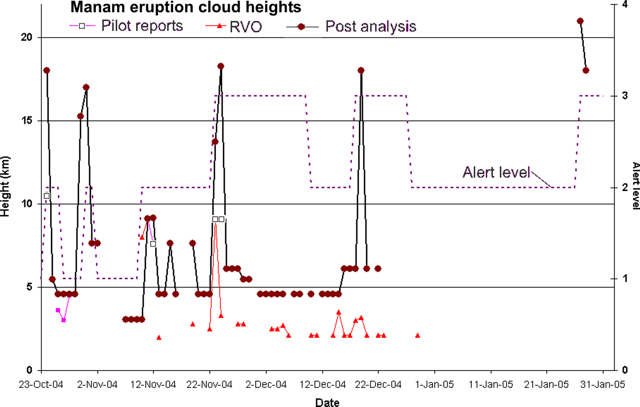 |
Figure 18. A graph of Manam's cloud heights from 23 October 2004 to late-January 2005, as determined from various means (see key along top). The dashed line corresponds to the right-hand scale of the graph, which displays alert levels reported by RVO (0-4, with 4 as the highest). Courtesy of Andrew Tupper, Darwin VAAC. |
The 24 October eruption at Manam occurred just before the Terra and Aqua satellites passed over. The data from those satellites, and from AVHRR and GOES satellites, indicated a very ice-rich cloud. Associated with Manam's eruption on 24 October, the coldest temperature measured from the high-level cloud was about 204 K (a couple of hours after the eruption), which translated to an altitude of about 15-18 km (a height supported by the ash cloud's subsequent dispersion, including wind trajectories consistent with the ~ 18 km altitude plotted on figure 3). There was no evidence of significant stratospheric penetration. Pilot reports for the cloud's top were generally lower, as is usual for large eruptions (Tupper and Kinoshita, 2003).
Figure 19 presents a photo of the 11 November eruption plume as seen by Air Niugini pilot David Innes. He estimated the visible portion of the plume height at "30,000 feet" (~ 9 km), but the cloud probably ascended at least a bit higher as it entered into masking cirrus clouds from a tropical disturbance to the N, so the pilot's estimate might be stated as 'above 9 km.' RVO's ground observer estimated a plume at ~ 8 km slightly earlier in the eruption, on about 10 November. The satellite-based analysis was thwarted by the cirrus cloud cover during this eruption.
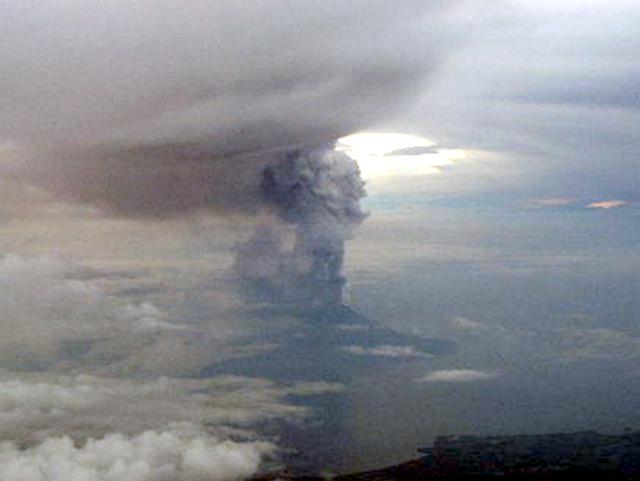 |
Figure 19. A N-looking aerial photo showing Manam's plume at 0630 local time on 11 November 2004. The plume extends to ~9 km before disappearing into higher weather clouds. Photo by David Innes of Air Niugini; used here with his permission. |
From 20 December until just before the 27 January eruption, no plumes or hot spots were visible. Few plumes were reported by RVO, and none were seen by pilots (table 2). The 27 January eruption began about 1400 UTC; and an Aqua/MODIS image from 0507 UTC is shown as figure 20.
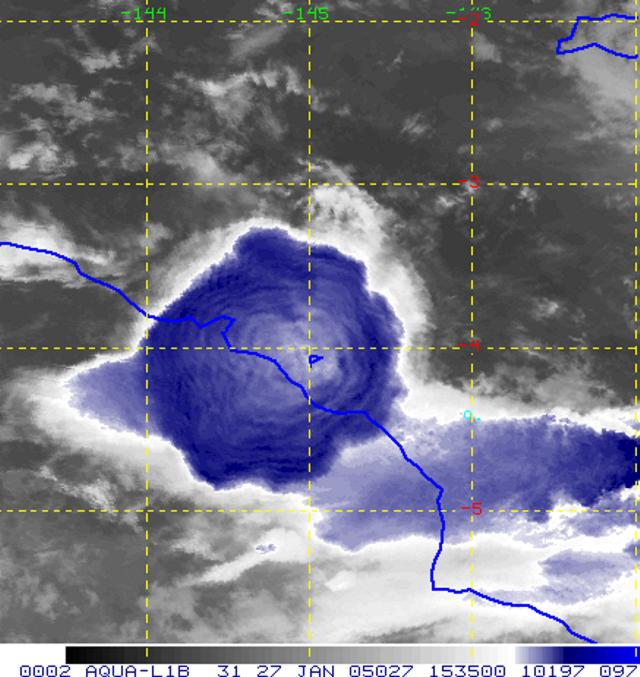 |
Figure 20. An infrared Aqua/MODIS image of the umbrella cloud from the 27 January 2005 Manam eruption (taken at 1535 UTC on the night of the 27th). The image is enhanced to show the 'warm spot' in the centre of the cloud (warm because of the stratospheric intrusion) and the gravity waves in the cloud. The lobate structure at the fringes of the cloud is similar to other observed umbrella clouds, such as the 1991 Pinatubo cloud. At this stage the cloud had a diameter of approximately 180 km. Courtesy of Andrew Tupper. |
The Darwin VAAC initially estimated the 27 January eruption cloud's maximum height as 21 km altitude, but later analysis found the range 21-24 km a better estimate. Infrared 11-µm imagery from GOES-9 at 1440 UTC and Aqua/MODIS at 1539 UTC on 27 January showed 'warm' spots in the middle of the umbrella cloud of 215.4 K and 210.4 K, respectively, indicating a substantial overshoot of the cloud top into the warmer stratosphere (tropopause temperatures were around 187 K). The GOES-9 temperature may be less useful because of poorer satellite resolution and calibration, and because at that stage the cloud may not have come into equilibrium with its environment. Comparing these temperatures to a temperature sonde taken from nearby Manus Island at 0000 UTC on 28 January suggests a cloud altitude of 21-24 km. Tupper plotted the more conservative (smaller) value on figure 3.
The 27 January eruption cloud was extremely difficult to track, as it was ice-rich and mixed with monsoonal storms, but dispersion models and satellite analysis suggest that a mid-tropospheric portion spread quite quickly W over Irian Jaya, while higher cloud remained near the eruption site for some time. The best 'tracer' for the cloud in operations turned out to be the strong 'ice' signature in split-window imagery similar to the Hekla (Iceland) eruption in the year 2000.
Another large eruption occurred around 2300 on 28 January. That plume's height plots at 18 km altitude (figure 3).
Preliminary synopsis. Tupper wrote that he and his group were aware of five or six major events "during these [Manam] eruptions that have generated high (over 10 km altitude) eruption clouds—23-24 October 2004, 31 October 2004, 10-11 November 2004, 23-24 November 2004, 19-20 December 2004, and 27-28 January 2005 [figure 3]. On each of these occasions a high and sometimes persistent cloud has developed over a stronger phase of the eruption. The largest event by far has been the 27-28 January event, which was the only one to clearly penetrate into the stratosphere.
"Attached is a graph [figure 3] showing the heights reported by ground observers, by local pilots, and derived from satellite analysis. Some major differences of perspective are evident. I believe that, in general, the ground observer heights are most accurate for the lower eruptions, pilot reports can be accurate or quite inaccurate depending on the pilot and the viewing angle, and satellite estimates are most accurate for the larger eruptions.
"The cold-point tropopause generally occurs at around 16-18 km at this time of year in Papua New Guinea, and scores of thunderstorms reach these altitudes every day in the area. Consequently, it is not surprising that the larger eruptions are easily able to reach these altitudes. The tropopause is also the major dynamical limit on the rise of the larger eruption clouds. The eruption of 27 January clearly penetrated into the stratosphere, to altitudes of 21-24 km, based on the warmth of the central umbrella cloud, and the subsequent dispersion of the ice-cloud, and the SO2 from the eruption."
"All of the eruption clouds have been water/ice rich, and difficult to track using satellite techniques. The ash signal at altitudes above the freezing level has been overwhelmed by the ice signal in infrared split-window imagery. Similarly, in visible and true-colour imagery, even where the lower level clouds have shown an ash signal, the higher clouds have been a brilliant white and have only been revealed as volcanic in short-wave infrared (3.7 µm) imagery and with SO2 retrievals. For example, [in BGVN 29:11 (the first of two satellite photos)] the large brilliant white cloud to the N of Manam (overlying the dark ash cloud) derives from the same 24 October eruption."
References. Tupper, A., and Kinoshita, K., 2003, Satellite, air and ground observations of volcanic clouds over island of the Southwest Pacific: South Pacific Study, v. 23, no. 2, p. 21-46.
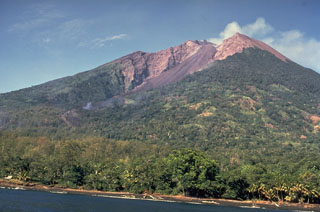
Geological Summary. The 10-km-wide island of Manam, lying 13 km off the northern coast of mainland Papua New Guinea, is one of the country's most active volcanoes. Four large radial valleys extend from the unvegetated summit of the conical basaltic-andesitic stratovolcano to its lower flanks. These valleys channel lava flows and pyroclastic avalanches that have sometimes reached the coast. Five small satellitic centers are located near the island's shoreline on the northern, southern, and western sides. Two summit craters are present; both are active, although most observed eruptions have originated from the southern crater, concentrating eruptive products during much of the past century into the SE valley. Frequent eruptions, typically of mild-to-moderate scale, have been recorded since 1616. Occasional larger eruptions have produced pyroclastic flows and lava flows that reached flat-lying coastal areas and entered the sea, sometimes impacting populated areas.
Information Contacts: Andrew Tupper, Darwin Volcanic Ash Advisory Centre, Australian Bureau of Meteorology (URL: http://www.bom.gov.au/info/vaac); Rabaul Volcano Observatory (RVO), P.O. Box 386, Rabaul, Papua New Guinea; National Disaster Centre, Department of Provincial Affairs and Local Level Government (Ministry of Inter-Government Relations), PO Box 4970, Boroko, National Capital District, Papua New Guinea (URL: http://www.pngndc.gov.pg/); The National Online, Lot 13 Section 38, Waigani Drive Hohola, PO Box 6817 Boroko, National Capital District, Papua New Guinea (URL: http://www.thenational.com.pg/); Papua New Guinea Mapserver (Mapu), EDF 8/9 EU-SOPAC Reducing Vulnerability of Pacific ACP States Project; David Innes, Flight Safety Office, Air Niugini, P.O.Box 7186, Boroko, Port Moresby, National Capital District, Papua New Guinea (URL: http://www.airniugini.com.pg/); Simon Carn, TOMS Volcanic Emissions Group, University of Maryland, 1000 Hilltop Circle, Baltimore, MD 21250, USA (URL: https://so2.gsfc.nasa.gov/).