Report on Sierra Negra (Ecuador) — October 2005
Bulletin of the Global Volcanism Network, vol. 30, no. 10 (October 2005)
Managing Editor: Richard Wunderman.
Sierra Negra (Ecuador) Eruption ends 30 October; some lava on NE flank, more on E caldera floor
Please cite this report as:
Global Volcanism Program, 2005. Report on Sierra Negra (Ecuador) (Wunderman, R., ed.). Bulletin of the Global Volcanism Network, 30:10. Smithsonian Institution. https://doi.org/10.5479/si.GVP.BGVN200510-353050
Sierra Negra
Ecuador
0.83°S, 91.17°W; summit elev. 1124 m
All times are local (unless otherwise noted)
Our last report (BGVN 30:09) described the first five days of this eruption, and was taken largely from a valuable joint report of Ecuador's Instituto Geofísico and Parque Nacional Galápagos. Here we report information from several sources on these topics: (a) initial observations of the eruption, (b) caldera-floor deformation prior to the eruption, (c) observations of the eruption's progress during 26 to 30 October (when it ended), and (d) satellite infrared observations of thermal fluxes associated with the eruption.
Eruption's start and subsequent plumes. As noted previously (BGVN 30:09), the eruption began around 1730 on 22 October 2005, when an explosion was heard by many residents of the volcano's S flank. Satellite images showed no activity at 1715, but revealed a large eruption at 1745 local time (2345 UTC). The eruption cloud reached an estimated altitude of at least 15 km (50,000 ft) and was moving SW.
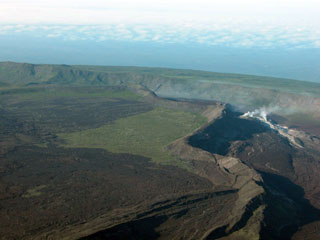
At about this time, passengers and crew on Lindblad Expeditions' 80 passenger vessel M/N Polaris had an excellent view of the eruptive plume (figure 5). Lucho Verdesoto, the expedition leader, reported that the ship was then at Cerro Dragon, Santa Cruz island. Sunset was at 1753. As night fell they sailed to a position ~ 18 km NE of the volcano, where they had clear views of flows descending the volcano's upper NE flank (figure 6).
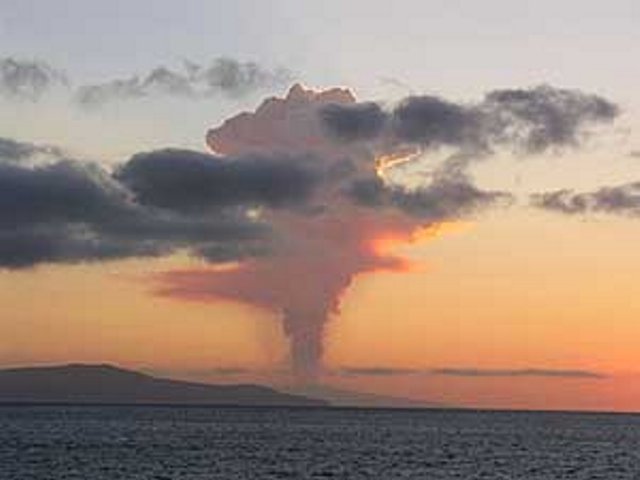 |
Figure 5. Early photo of the Sierra Negra plume from the cruise ship Polaris, anchored off NW Santa Cruz island around sunset on 22 October 2005. Courtesy of Lucho Verdesoto. |
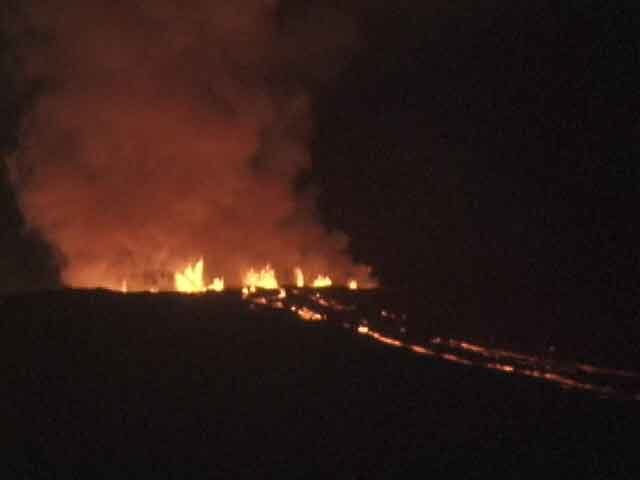 |
Figure 6. Lava spews skyward from circumferential fissure vents near the N rim of Sierra Negra caldera as flows descend the upper N flank. The photos were taken on 22 October, during the first few hours of the eruption, from the Polaris. Courtesy of Lucho Verdesoto. |
Naturalist Carman Guzman wrote, "After sunset the show was fascinating so we decided to move the Polaris to a much closer location. After dinner, we were only eleven miles from the eruption itself. What a thrill! The darkness of the night enhanced the beauty of the fiery reds and oranges that were seen at the top of the caldera. We spent several hours enjoying this rare and fantastic event. Rivers of lava were running down the slopes of the volcano and enormous flames were lighting up the sky."
According to NASA MODIS imagery and VAAC/NOAA reports, on 25 October 2005 a large plume of gases and steam was observed in GOES 12 imagery for 1545 local time (2145 UTC). The plume extended ~ 460 km W and SW of the summit at an altitude of ~ 4.6 km. Figure 7 shows the average concentration of SO2 over the Sierra Negra plume as imaged by NASA's Aura satellite for the period 23 October-1 November.
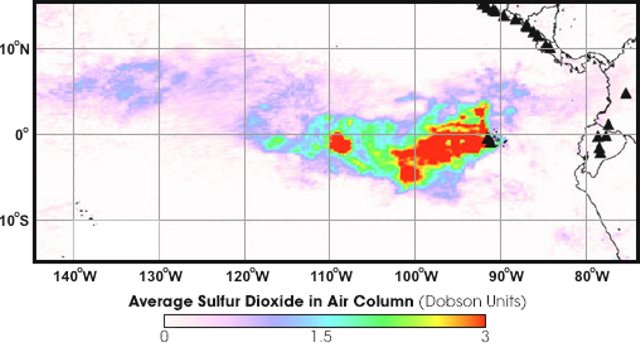 |
Figure 7. The average concentration of sulfur dioxide (SO2) over Sierra Negra from 23 October-1 November measured by the Ozone Monitoring Instrument (OMI) on NASA's Aura satellite. In agreement with reports from the ground, OMI stopped seeing measurable sulfur dioxide coming from the volcano on 31 October. The column abundances of SO2 appear on the associated key (in Dobson Units, DU, a product of concentration and pathlength that reflects the number of SO2 molecules in a unit area of the atmospheric column). Courtesy of NASA Earth Observatory/Natural Hazards website. |
Deformation monitoring. In the early stages of this eruption, Bill Chadwick (NOAA) submitted a report on pre-eruption deformation (figure 8). The plot shows both Synthetic Aperture Radar (InSAR) and GPS data on vertical deformation of the caldera floor. Chadwick wrote that he, Dennis Geist (University of Idaho), and Dan Johnson (University of Puget Sound, recently deceased) installed a 27 station GPS network at Sierra Negra in 2000, that was reoccupied in 2001 and 2002 (Geist and others, in press). With help from UNAVCO (a consortium supporting high-precision deformation measurements), the group then added a 6-station, continuous GPS network in 2002. Since then, there occurred a change from caldera subsidence to caldera uplift in March 2003. During this uplift, an M 4.6 earthquake on 16 April 2005 marked trapdoor faulting. The continuous GPS network measured a surface displacement of 85 cm within 10 seconds. Both this event and the previous case of trapdoor faulting in 1997-8-documented by satellite measurements using Interferometric Synthetic Aperture Radar (InSAR) (Amelung and others, 2000)-were preceded by over a meter of inflation (Jónsson and others, 2005). Both the 1997-98 and 2005 trapdoor movements occurred along the caldera floor's S side.
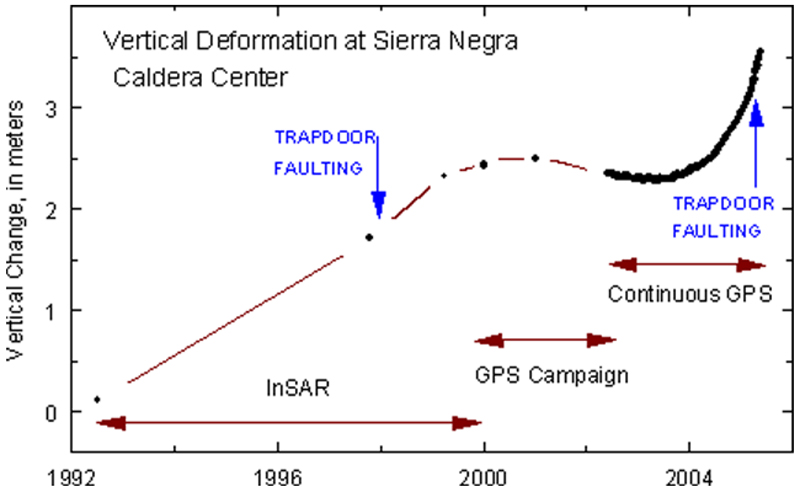 |
Figure 8. Recent history of uplift at the center of Sierra Negra's caldera. The data plotted are only through April 2005 when the trapdoor faulting event occurred. Although not plotted, GPS data since April has continued to indicate robust deformation. Courtesy Bill Chadwick, NOAA. |
Aside from its immediate affects, the April 2005 earthquake left the later inflation rate unchanged. Caldera-centered uplift has continued since then without pause at about the same high rate. During the interval from March 2002 to April 2005 there was about ~ 1.2 m of uplift. Rates after the April 2005 earthquake are not plotted but were roughly the same as those during the interval March 2002-April 2005. The only other large earthquakes at Sierra Negra in the last year were an M 4.0 on 23 February 2005, which was associated with a small (2 cm) displacement near the trapdoor fault, an M 4.6 on 19 September 2005 that caused no obvious displacements, and an M 5.5, just 3 hours before the 22 October eruption started. The GPS data has not yet been processed.
Field descriptions of the eruption. The eruption began on 22 October with venting along a 2-km fissure near the caldera's N rim (figure 6). The fissure descended the caldera's inner wall at its E end. Flows were fed both northward down the outer N flank and southward onto the NE caldera floor. Although flows reached 5 km down the outer flank, flow into the caldera soon dominated, with strong channels descending inner caldera slopes before combining to form a wide aa flow banked against the caldera's E wall and moving steadily southward (see figures and discussion, BGVN 30:09).
Figure 9 is a photo taken by Greg Estes on 24 October. It highlights the vigorous venting and intracaldera flows at that point in the eruption. Figure 10, a post-eruption satellite photo, illustrates the broad pattern of still-cooling, erupted lavas (which appear as light colored areas on this 2 November thermal-infrared image). Although this may represent the best overview of the new lavas at this time, some of the thinnest flows or chilled flow features may not appear on this image.
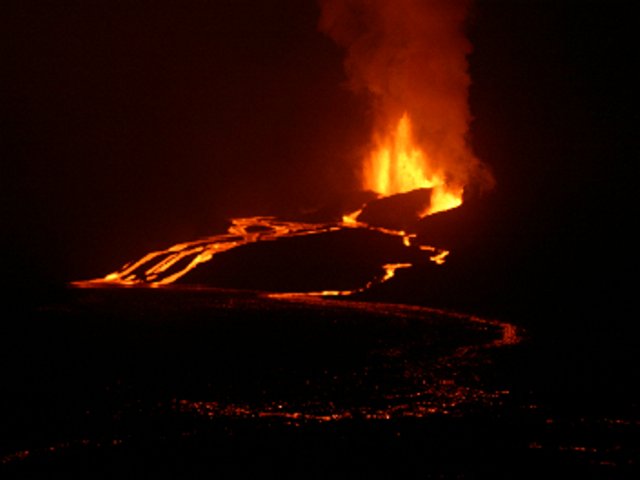 |
Figure 9. The Sierra Negra eruption setting as viewed from the E caldera rim. The fissure vent was vigorously emitting fountains, and there were several anastomosing lava flows pouring into the caldera. Photo was taken at night on 24 October 2005, day 3 of the eruption. The scattered glow in the foreground was due to ponded lava covering the caldera's E floor. Courtesy of Greg Estes (Galápagos resident and Park Guide). |
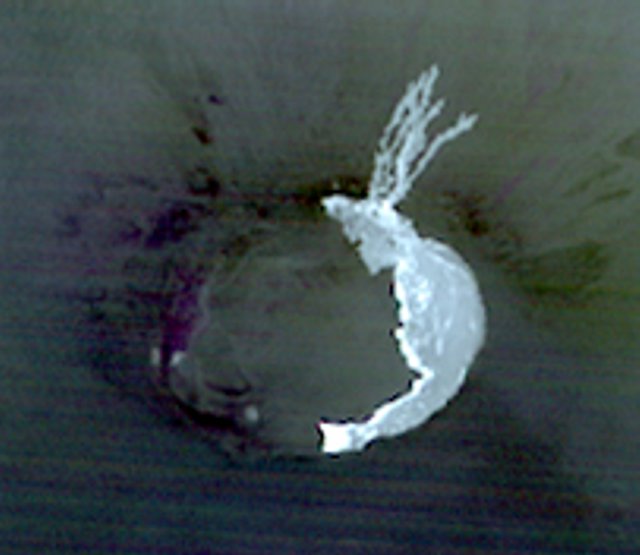 |
Figure 10. The Sierra Negra eruption setting as viewed from space in a false color ASTER (Advanced Spaceborne Thermal Emission and Reflection Radiometer) infrared image taken at night on 2 November, ~ 3 days after the eruption ended. N is towards the top. Caldera is 7 x 10.5 km across. Note the extra-caldera, N-flank lava flows, the lunate zone of ponded lavas along the E caldera. NASA image created by Jesse Allen, Earth Observatory, using data provided courtesy of Eric Fielding (NASA/JPL), the NASA/GSFC/METI/ERSDAC/JAROS, and U.S./Japan ASTER Science Team. |
By 26 October, fissure activity had narrowed to one major vent very near the N rim, but at 0830 on the 27th, eyewitness Godfrey Merlin reported that a second vent opened downslope and SE of the first. This new vent did not diminish the activity of the first, meaning that the total flux of erupting lava nearly doubled.
By about 1400 on the 27th, a team including Dennis Geist (University of Idaho), Terry Naumann (University of Alaska), and Karen Harpp (Colgate University) had arrived at the E caldera rim and began sending back a series of valuable reports. Their first report noted a major vent immediately below GPS station SN12 on the rim NE of the caldera's center. This vent emitted a large intracaldera aa flow.
Some active N-flank vents stood about 300-400 m NW of a station (GV01) on the caldera's N rim . There, two major vents fed lava fountains up to 50 m high. Most lava being erupted was flowing into the caldera, although some of the scoria from the fountains was falling outside the caldera and then forming a short, sluggish flow. Lava inside the caldera was cascading from the vents down the slope on the N edge of the caldera in 3 main channels, each 30-40 m across, with lava flowing at ~10 m/s (36 km/h) and in some cases over 10 m/s, and coalescing into a major aa flow to the S. On the caldera floor these channels merged into one big aa channel about 100 m wide that flowed more slowly both to the S, clockwise along the base of the E caldera wall, and into the moat along the S edge of the caldera floor. Pahoehoe outbreaks occurred along the margins of the major aa flow. New aa lava covered an estimated one-third of the caldera floor.
The report for 28 October noted that the eruption was still going strong. There were no significant new events on this day, but it appeared that the lava flux had increased because the vents looked wider and there seemed to be a lot more gas emitted. The lava continued to feed from the vents to the caldera floor in two large streams, each ~ 20 m across with lava traveling at 5-10 m/s, adding up to probably hundreds of millions of cubic meters of lava per day. The aa field continued to grow. The group reached the caldera floor and were able to sample both lava and tephra.
By 0700 on the 29th some of the vents had shut down and the two lava channels to the W (previously fed by the upper vent) stopped moving. The lower vent still emitted lava and fed one channel E of the others. The team estimated the channel to be ~10 m wide and moving ~5 m/s. Assuming a 2-m depth, the lava flux was 5 to 10 million cubic meters per day, about half that seen the morning of the 29th.
The emission rate continued to diminish throughout the 29th and by the evening it was only 10-20% of that seen on the 28th. In addition, the amount of gases emitted decreased such that the gas plume only rose ~1 km, whereas earlier plumes had risen to several kilometers. The lower vent was no longer fountaining continuously as it had on the 28th; instead the fountaining came in bursts at intervals of about 1-30 seconds. A lava lake sloshed around in the lower vent's crater; some lava escaped this crater along a breach in the crater rim. The upper vent (the one that shut off) was still incandescent with a lot of gas coming out, so it was possible that there was a lava lake there too.
The eruption appeared to end on the 30th. Glow was observed at 0200, but had ceased by 0400. The vents still emitted gas, but not fresh lava. However, it was possible that there was still N-flank activity. There were reports of lava flows there, and while it was certain that at least some of these flows were clastogenic (composed of spatter from fire fountains that accumulated and then began to flow), it was uncertain whether there were also actively erupting flank vents. The team remained separated from this area by hot lava, thwarting reconnaissance. Initial estimates of the coverage of the caldera floor were an area of ~14 km2. Assuming a 3-4 m average flow thickness, this was ~0.05 km3 (50,000,000 m3) of lava. There were obviously high error bars on this estimate, but it was clearly much less than the ~1 km3 extruded in the 1979 eruption.
MODVOLC Thermal Alerts. A large set of thermal hotspots in multispectral imagery was observed beginning late 22 October (local time and date) and continuing through 16 November 2005 (figure 11). Although MODVOLC data were missing for some days and reduced for others (presumably due to cloud cover screening the radiation from the satellite) these hot-spot pixels dramatically document the course of the eruption. Data on figure 11 appear consistent with in situ observations, in that by the second day, lava was at least 5 km down the outer N slope and covering much of the E caldera floor. By the 8th day (30 October), the outer slope flows had cooled significantly, but flows inside the caldera had continued their clockwise advance, filling all low points to the extreme SW corner of the caldera. Ten days later (9 November), the eruption had ended and only flows from the vents to the SE caldera floor were still emitting detectable heat. The last pixels observed, two above the original vent area on the N rim, were on 16 November.
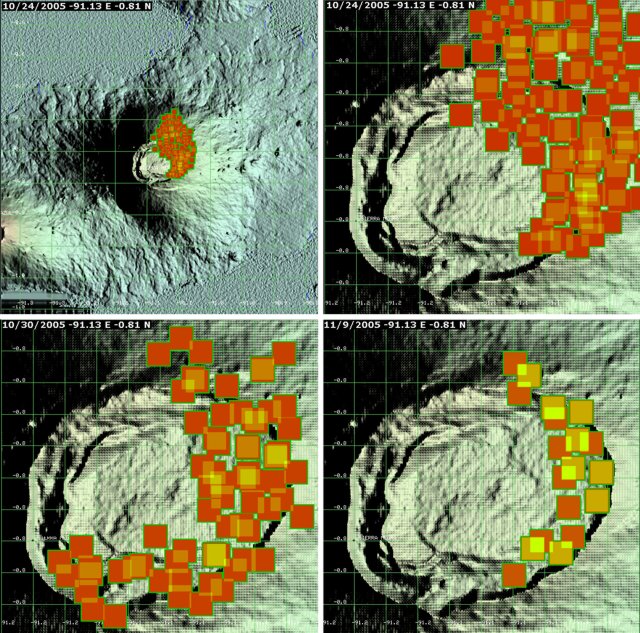 |
Figure 11. Selected images of MODVOLC thermal anomalies for Sierra Negra measured from satellite (MODIS) data at three days during and after the 2005 eruption. Part A presents an overview of the region (smaller scale than the other images) on 24 October. Parts B-D give a zoom-in on the 7 x 10.5 km caldera. Part B represents 24 October; Part C, 30 October; and part D, 9 November 2005. Since the eruption ended 30 October, the latter two images must thus portray the post-eruptive thermal inertial of the cooling lavas. Courtesy of Hawai`i Institute of Geophysics and Planetology, University of Hawai`i. |
References. Amelung, F., Jónsson, S., Zebker, H., and Segall, P., 2000, Widespread uplift and 'trapdoor' faulting on Galápagos volcanoes observed with radar interferometry: Nature, v. 407, p. 993-996.
Geist, D.J., Chadwick, W.W., Jr., and Johnson, D.J., in press, Results from new GPS monitoring networks at Fernandina and Sierra Negra volcanoes, Galápagos, 2000-2002: Journal of Volcanology and Geothermal Research (in press).
Jónsson, S., H. Zebker, and F. Amelung, 2005, On trapdoor faulting at Sierra Negra volcano, Galápagos; Journal of Volcanology and Geothermal Research, v. 144, p. 59-71.
Geological Summary. The broad shield volcano of Sierra Negra at the southern end of Isabela Island contains a shallow 7 x 10.5 km caldera that is the largest in the Galápagos Islands. Flank vents abound, including cinder cones and spatter cones concentrated along an ENE-trending rift system and tuff cones along the coast and forming offshore islands. Although it is the largest of the five major Isabela volcanoes, it has the flattest slopes, averaging less than 5° and diminishing to 2° near the coast. A sinuous 14-km-long, N-S-trending ridge occupies the west part of the caldera floor, which lies only about 100 m below its rim. The Volcán de Azufre fumarolic area lies within a graben between this ridge and the west caldera wall. Lava flows from a major eruption in 1979 extend all the way to the north coast from circumferential fissure vents on the upper northern flank.
Information Contacts: Lucho Verdesoto and Carman Guzman, M/NPolaris, Galápagos Islands, Ecuador; Francisco Dousdebes, Galápagos Expedition Manager, Metropolitan Touring, Ecuador; Lindblad Expeditions (URL: http://www.expeditions.com/); U.S. National Aeronautical and Space Administration (NASA) (URL: http://earthobservatory.nasa.gov/); Bill Chadwick, Cooperative Institute for Marine Resources Studies (CIMRS), National Oceanic and Atmospheric Agency (NOAA) Pacific Marine Environmental Laboratory (PMEL), Oregon State University, 2115 SE OSU Drive, Newport, OR 97365, USA; Dennis Geist, Department of Geological Sciences, University of Idaho, Moscow, ID 83844-3022 USA; Terry Naumann, Department of Geology, University of Alaska at Anchorage, Anchorage, AK 99598, USA (URL: https://www.uaa.alaska.edu/academics/college-of-arts-and-sciences/departments/geology/); Karen Harpp, Department of Geology, Colgate University, 408 Lathrop Hall, Hamilton, NY 13346, USA (URL: http://www.colgate.edu/facultysearch/FacultyDirectory/karen-harpp); MODVOLC Alerts Team, Hawaii Institute of Geophysics and Planetology (HIGP), University of Hawaii at Manoa, 1680 East-West Road, Post 602, Honolulu, HI 96822, USA (URL: http://modis.higp.hawaii.edu/).