IG reported that the eruption at Sierra Negra that began on 26 June was divided into two main phases. The first and most energetic phase lasted one day (26 June) and was characterized by the opening of five fissures and lava flows traveling as far as 7 km from the vents. Lava was only produced from fissure 4 during the 57-day-long second phase (27 June-23 August), with lava reaching the sea on 6 July and expanding the coastline. By 25 August the lava flows in total covered an area of 30.6 square kilometers. Activity continued to decline the last week of August with decreased seismicity, gas emission, and no surficial activity visible.
Source: Instituto Geofísico-Escuela Politécnica Nacional (IG-EPN)
Fissure opens on NNE caldera rim 26 June 2018, NW-flank lava flows reach the sea
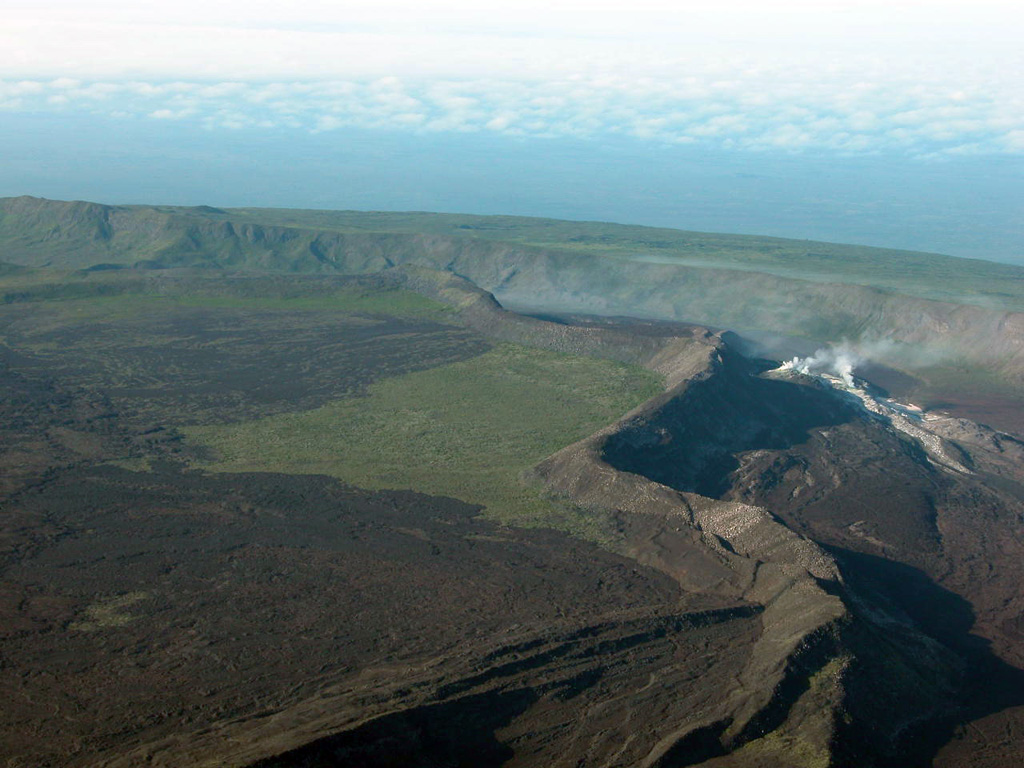
Sierra Negra shield volcano on the Galápagos Island of Isabela has erupted six times since 1948, most recently in 2005. The eruptions of 2005, 1979, 1963, and 1953 were located in the area known as 'Volcán Chico' near the NNE rim of the summit caldera, which extends about 9 km E-W and 7 km N-S (figure 12). The lava flows generated in these eruptions were directed mainly towards the N and NE flanks of Sierra Negra, in some cases reaching Elizabeth Bay to the N and in others filling the interior of the caldera (figure 13). A new effusive eruption that occurred from 26 June through August 2018 is covered in this report with information provided primarily by Instituto Geofísico, Escuela Politécnica Nacional (IG-EPN). Additional information comes from the Washington Volcanic Ash Advisory Center (VAAC), and several sources of satellite information.
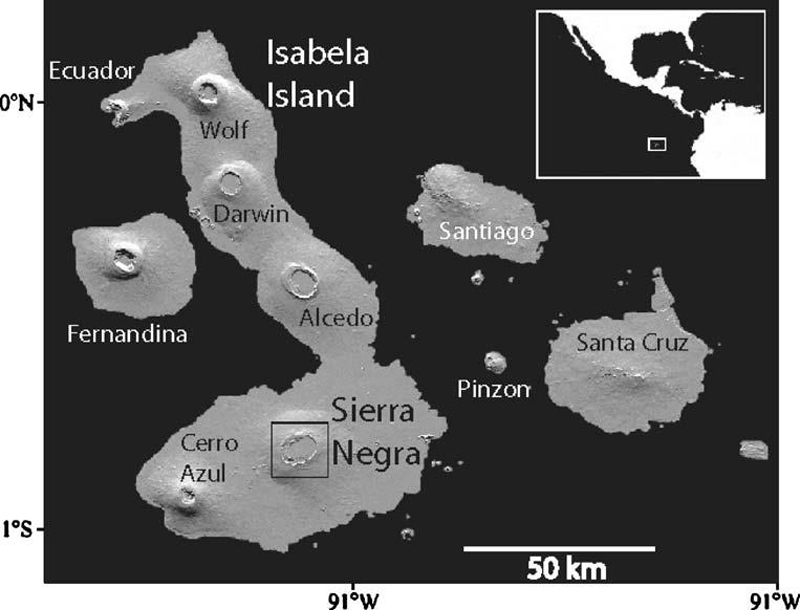 |
Figure 12. Sierra Negra is located on the southern part of Isabela Island in the Galápagos National Park, Ecuador. Courtesy of IG (Informe Especial Nº 2, Volcán Sierra Negra- Islas Galápagos: Descripción del estado de agitación interna y posibles escenarios eruptivos, 12 January 2018). |
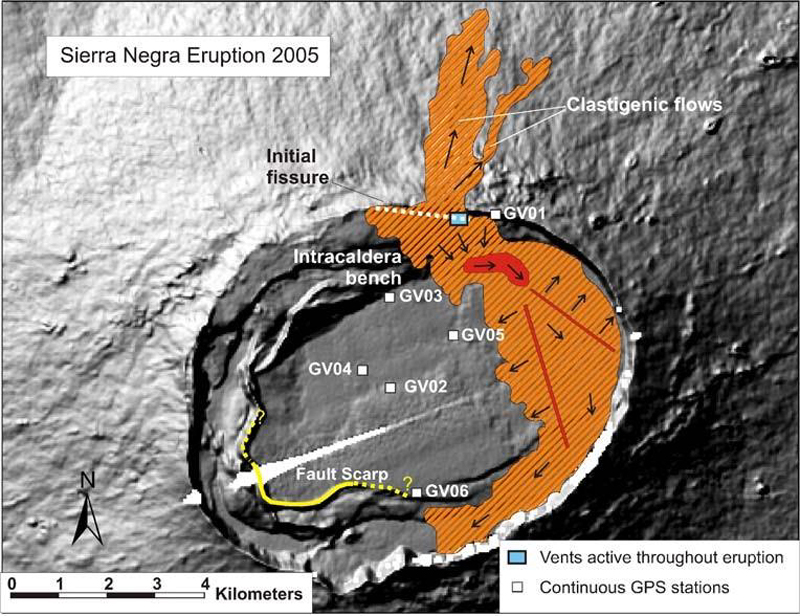 |
Figure 13. The Sierra Negra caldera with the locations of GPS stations and the fissures, vents, and flows from the 2005 eruption. From Geist et al. (2005), courtesy of IG (Informe Especial Nº 2, Volcán Sierra Negra- Islas Galápagos: Descripción del estado de agitación interna y posibles escenarios eruptivos, 12 January 2018). |
Beginning in 2017, the Geophysical Institute of the National Polytechnic School (IGEPN) installed a surveillance network of six broadband seismic stations for the Galápagos volcanoes. One station is located on the NE edge of the Sierra Negra caldera and another on the SE flank. After 12 years of little activity, an increase in seismicity beneath and around the caldera became evident by July 2017 (figure 14). On 19 October 2017 (local time) the seismic monitors detected a 16-km-deep M 3.8 earthquake with an epicenter on the NE border of the caldera in the vicinity of Volcán Chico. Four additional similar earthquakes occurred within the next hour. Another earthquake of similar size occurred on 22 October; between 15 and 16 November, three earthquakes with M 3.0 or greater were recorded. The frequency of seismic activity increased significantly in December 2017, with over 550 events recorded during the first three weeks of December 2017; at least three had magnitudes greater than 3. GPS receivers showed uplift of the caldera floor of 80 cm between 2013 and 2017. InSAR interferometry data indicated substantial inflation of the caldera floor of about 70 cm between December 2016 and late November 2017, reaching a level higher than that which preceded the eruption of 2005 (figure 15).
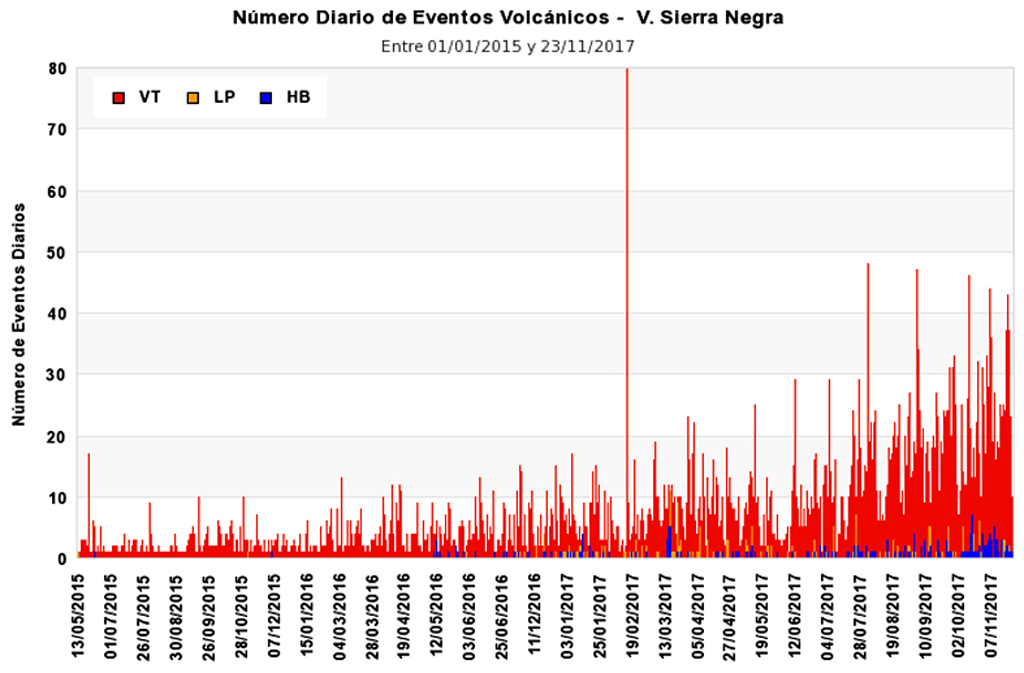 |
Figure 14. The number of daily seismic events at Sierra Negra between 13 May 2015 and 23 November 2017 show a distinct increase in activity by July 2017. The colors represent different types of earthquakes; red is VT or volcanotectonic, orange is LP or Long Period, and blue is HB or Hybrid. Courtesy of IG (Informe Especial Sierra Negra N.- 2, Actividad reciente del volcán Sierra Negra – Isla Isabela, 23 November 2017). |
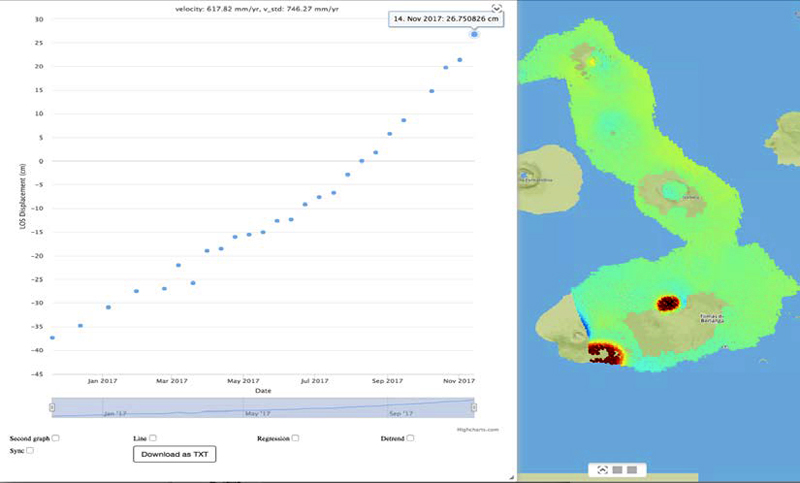 |
Figure 15. Inflation of the caldera floor at Sierra Negra between December 2016 and November 2017 exceeded 70 cm. The left graph shows the displacement plotted in centimeters versus time, and the right image is the spatial deformation from the InSAR data showing inflation at the caldera (center) and on the SW coast of Isla Isabela. Figures courtesy of Falk Amelung (RSMAS) and IG (Informe Especial Sierra Negra N.- 2, Actividad reciente del volcán Sierra Negra – Isla Isabela, 23 November 2017). |
By early January 2018, inflation over the preceding 12 months was close to 1 m, with a total inflation exceeding that prior to the 2005 eruption. Seismic activity, focused on two fracture zones trending NE-SW across the summit caldera, continued to increase until 26 June 2018 when a fissure opened near Volcán Chico on the NNE caldera rim. Over the next 24 hours four fissures opened on the N rim and the NW flank. Three of the fissures were active only for this period, but the fourth, on the NW flank about 7 km below the caldera rim, continued to effuse lava for all of July and most of August 2018. Lava flows reached the sea in early July. Several pulses of increased effusive activity corresponded with increased seismic, thermal, and gas-emission activity recorded by both ground-based and satellite instrumentation. By the last week of August active flows were no longer observed, although the cooling flows continued to emit thermal signals for several weeks.
Activity during January-early June 2018. Elevated seismicity continued into 2018 with a M 3.8 event recorded on 6 January 2018 that was felt by tourists, guides, and Galápagos National Park officials. Tens of additional smaller events continued throughout the month, reaching more than 100 seismic events per day a few times; the earthquakes were located below the caldera at a depth of less than 8 km. A M 4.1 event on 10 January was located at a depth of 7 km. By 12 January, the total inflation of the caldera since the beginning of 2017 was 98 cm (figure 16).
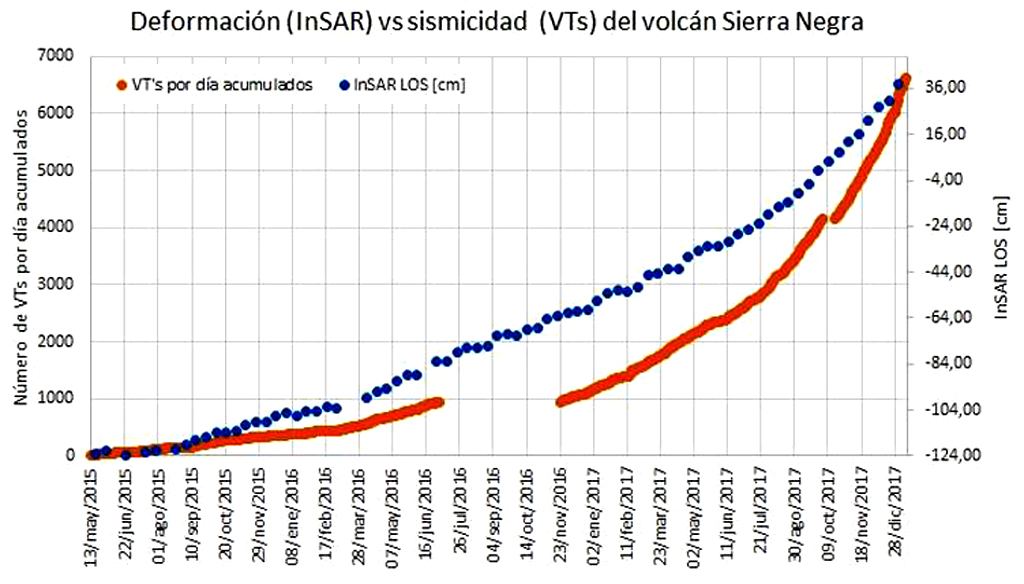 |
Figure 16. Seismicity and deformation at Sierra Negra between 13 May 2015 and 28 December 2017. The orange line represents the cumulative VT earthquakes, and the blue points record the inflation in cm of the floor accumulated since the beginning of 2015. A change in slope of both curves is evident at the end of 2017 indicating the rate of increase of inflation and seismicity. Courtesy of IG (Informe Especial Nº 2, Volcán Sierra Negra- Islas Galápagos: Descripción del estado de agitación interna y posibles escenarios eruptivos, 12 January 2018). |
IG reported 14 seismic events with magnitudes ranging from 3.0-4.6 between 1 January and 19 March 2018. A M 4.4 event on 18 January was located less than 1 km below the surface with an epicenter on the S rim of the caldera. A M 4.1 event on 27 February was also located less than 1 km below the surface. A M 4.6 event on 14 March was the largest to date at Sierra Negra and was located only 0.3 km below the surface. Measurements of CO2, SO2, and H2S made at the Azufral fumarole field (figure 17) on the W rim of the caldera in early February did not have values significantly different compared to May 2014 and September 2017. With the continued increase in frequency and magnitude of shallow seismic activity, IG noted the increased risk of renewed eruptive activity, and noted that most of the active flows of the last 1,000 years were located on the N flank (figure 18).
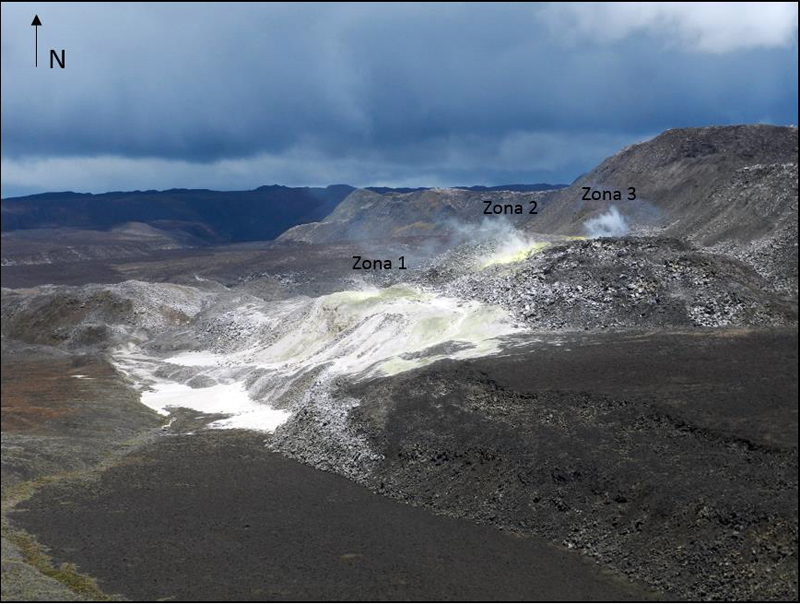 |
Figure 17. A fumarole field near Azufral on the W rim of the Sierra Negra caldera on 6 February 2018 remained unchanged after several months of increased seismicity in the area. Photo by M. Almeida, courtesy of IG-EPN (Informe Especial del Volcán Sierra Negra (Islas Galápagos) -2018 - Nº 3, Actualizado del estado de agitación interna y posibles escenarios eruptivos, 19 March 2018). |
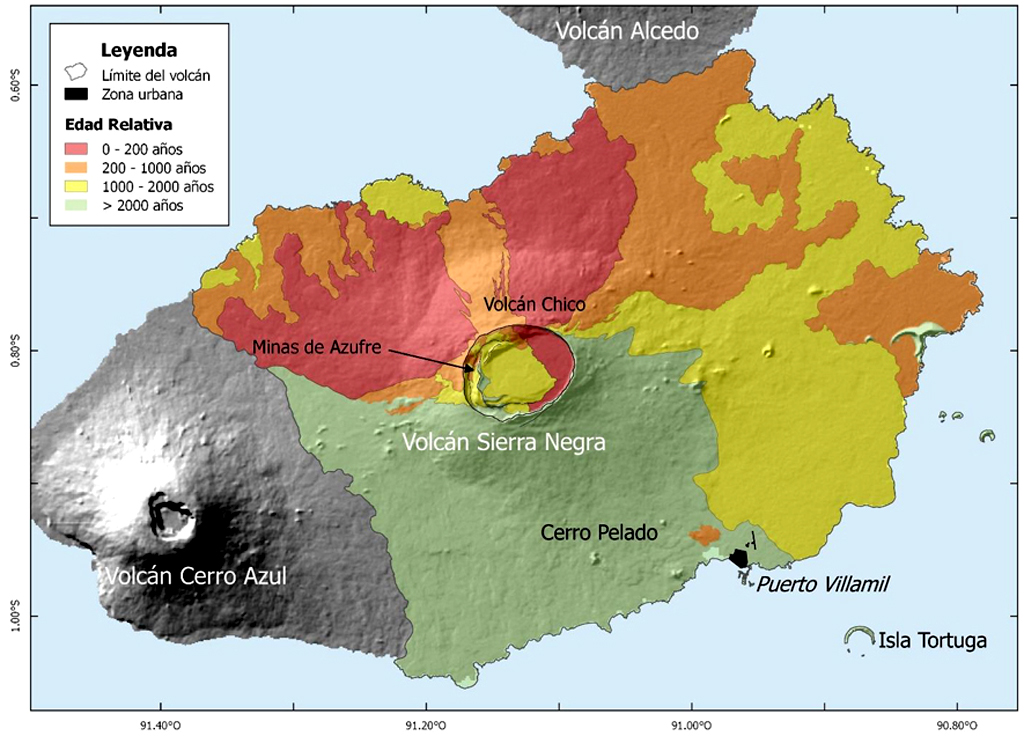 |
Figure 18. Simplified geologic map of Sierra Negra with lava flows colored as a function of relative age (modified from Reynolds et al., 1995), courtesy of IG (Informe Especial del Volcán Sierra Negra (Islas Galápagos) -2018 - Nº 3, Actualizado del estado de agitación interna y posibles escenarios eruptivos, 19 March 2018). |
Increases in seismicity continued into early June. IG noted that on 25 May 2018, 104 seismic events were recorded, the largest number in a single day since 2015. A M 4.8 event on 8 June was accompanied by over 40 other smaller earthquakes. The earthquake epicenters were mainly located on the edges of the crater in two NE-SW trending lineaments; the first covered the N and W edges of the crater and the second trended from the NE edge to the S edge. Deformation data indicated the largest displacements were at the caldera's center, compared with lower levels of deformation outside of the caldera.
Eruption of 26 June-late August 2018. IG reported an increase in seismicity and a M 4.2 earthquake on 22 June 2018. A larger M 5.3 earthquake was detected at 0315 on 26 June, 5.3 km below the caldera. The event was felt strongly on the upper flanks and in Puerto Villamil (23 km SE). About 8 hours later, at 1117, an earthquake swarm characterized by events located at 3-5 km depth was recorded. A M 4.2 earthquake took place at 1338 and was followed by increasing amplitudes of seismic and infrasound signals. Parque Nacional Galápagos staff then reported noises described as bellows coming from the Volcán Chico fissure vent, which, coupled with the seismicity and infrasound data, suggested the start of an eruption. About 20 minutes later IG described a thermal anomaly identified in satellite images in the N area of the caldera near Volcán Chico and Park staff observed lava flowing towards the crater's interior as well as towards the N flank in the direction of Elizabeth Bay (figure 19).
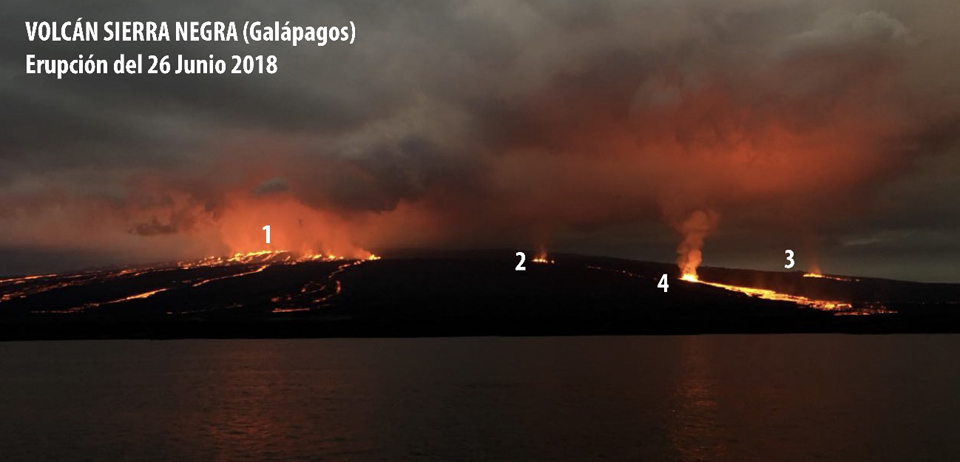 |
Figure 19. Lava flows descended from the N flank of Sierra Negra to Elizabeth Bay on 26 June 2018 from four distinct fissure vents (numbered). Fissure 1 was located near Volcan Chico on the caldera rim, and fissures 2, 3, and 4 were located on the N flank. Details of the fissures are discussed later in the report. Video of the flow was captured by Nature Galápagos. Photo courtesy of AFP and BBC News, annotated and reprinted by IG (Informe Especial N° 16 – 2018, Volcán Sierra Negra, Islas Galápagos, Actualización de la Actividad Eruptiva, Quito, 23 de Julio del 2018). |
The Washington VAAC reported an ash plume visible in satellite imagery late on 26 June at 10.6 km altitude drifting SW. By the following morning, a plume of ash mixed with SO2 was drifting W at 8.2 km altitude. IG reported a new ash emission late on 27 June drifting NW at 6.1 km altitude. A substantial SO2 plume emerged on 27 June and was recorded by the OMI and OMPS satellite-based instruments drifting SW that day and the next (figure 20). The MODVOLC thermal alert system confirmed the beginning of the eruption with over 100 alert pixels recorded on 27 June and over 50 the following day. The MIROVA system recorded an abrupt, very high thermal signal beginning on 26 June (figure 21). Seismic and acoustic data indicated a gradual decrease of activity after the initial outburst, but effusive lava flows continued on 27 June.
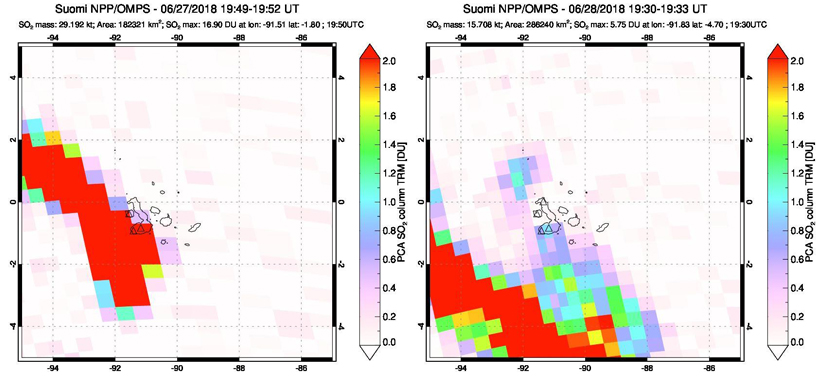 |
Figure 20. A large plume of SO2 was emitted from Sierra Negra on 27 June 2018 at the beginning of the latest eruptive episode. It drifted SW the following day, as seen in these images captured by the OMPS instrument on the Suomi NPP satellite. Courtesy of NASA Goddard Space Flight Center. |
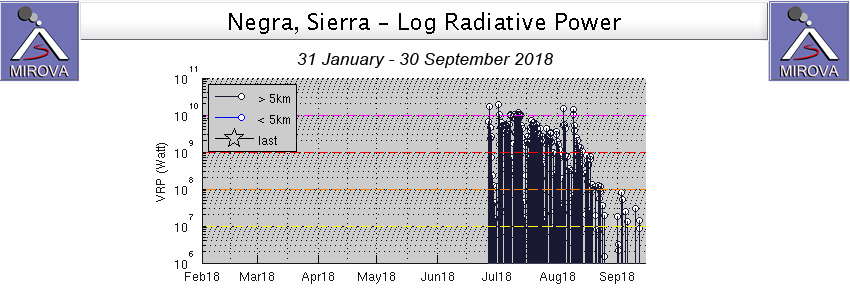 |
Figure 21. The MIROVA project graph of thermal energy at Sierra Negra from 31 January 2018 through September 2108 shows the start of the lava flows on 27 June 2018 (UTC). Pulses of high thermal energy continued through late August when flow activity ceased; cooling of the flows continued into September 2018. Courtesy of MIROVA. |
During 27 and 28 June, IG scientists were able to make a site visit to capture thermal, photographic, and physical evidence of the new lava flows (figure 22). A composite thermal image showed the extent of flows that traveled down the N flank as well as into the caldera (figure 23). A temperature of 580°C was measured near the eruptive fissure, and the surface temperatures averaged about 60°C, although some flows were measured as high as 200°C. The temperature inside a fracture on a lava flow was measured at 975°C (figure 24). Pelée hair and "spatter" bombs were visible around the eruptive fissures.
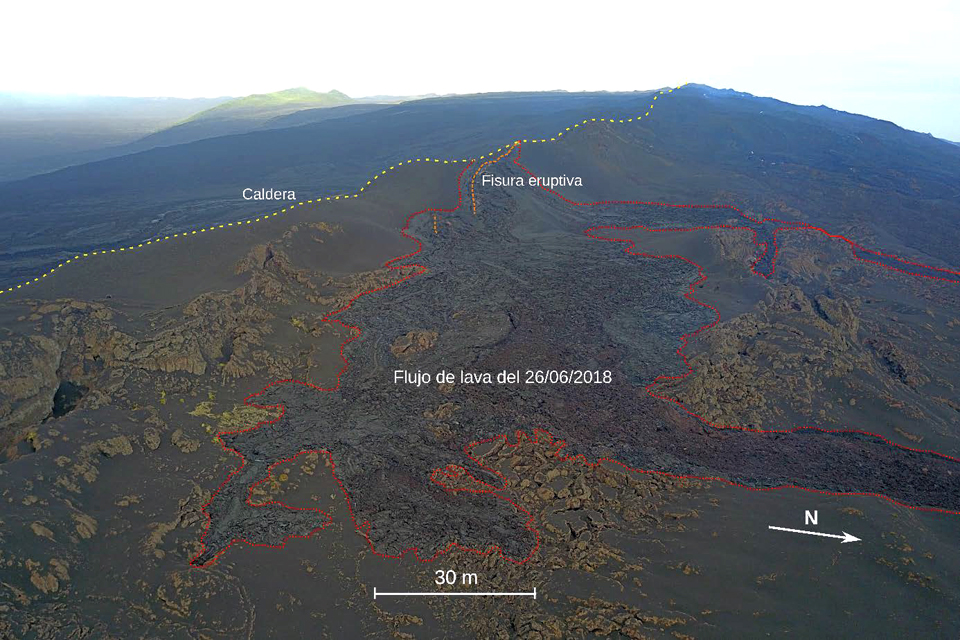 |
Figure 22. The lava flows of 26 June 2018 at Sierra Negra emerged from a fissure on the N flank of the caldera rim and other fissures on the N flank and flowed N. N is to the right. Photo by Benjamin Bernard, courtesy of IG (Volcán Sierra Negra, Informe de campo 27-28 junio2018, Termografía, Cartografía, y muestreo de los nuevos flujos de lava, sector de Volcán Chico). |
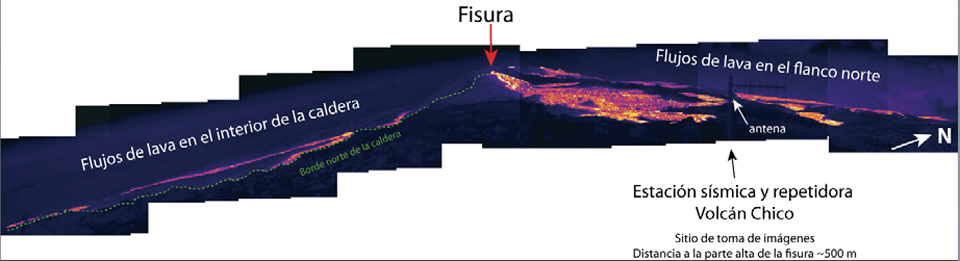 |
Figure 23. Composite thermal images of the new lava flows at Sierra Negra taken on 27 June 2018 reveal the flows that emerged from the Volcán Chico fissure zone; most flows traveled N down the flank, a few (on the left) traveled down into the caldera. Images by Silvia Vallejo, courtesy of IGEPN (Volcán Sierra Negra, Informe de campo 27-28 junio2018, Termografía, Cartografía, y muestreo de los nuevos flujos de lava, sector de Volcán Chico). |
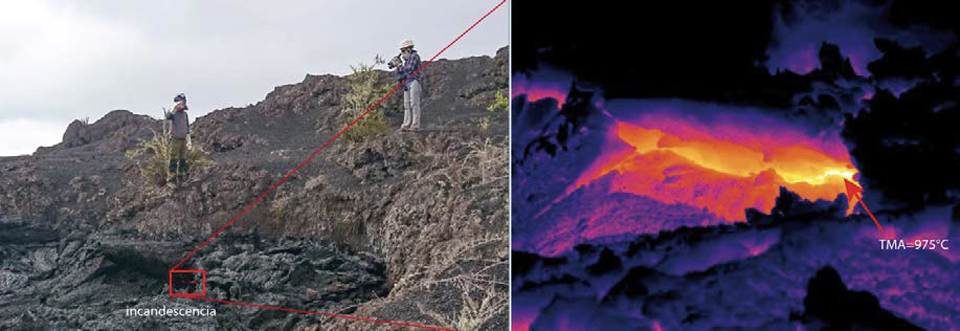 |
Figure 24. The temperature of incandescent lava within a fresh flow at Sierra Negra was measured at 975°C on 27 June 2018. Left image by Francisco Vásconez; thermal image by Silvia Vallejo, courtesy of IGEPN (Volcán Sierra Negra, Informe de campo 27-28 junio2018, Termografía, Cartografía, y muestreo de los nuevos flujos de lava, sector de Volcán Chico). |
Pahoehoe and aa flows along with lava tunnels were visible in drone images. The visible fissures were slightly arcuate and aligned in a general ENE direction, similar to the fissures of 1979 and 2005 in the vicinity of Volcán Chico. The largest flow was more than 150 m long; they reached up to 130 m wide in the flat areas, but only between 25 and 35 m wide where they were channeled on the steeper slope. In the flatter areas they had characteristics of pahoehoe with a smooth surface, a sometimes rounded texture and lava tunnels (figure 25), while in the channelized areas with a steeper slope they had a rougher surface and were characterized as aa (figure 26). The flows averaged 0.5-1 m thick and in several places the lava filled fissures or previous depressions. The samples of pahoehoe that were collected were all aphanitic with no crystals, strongly iridescent, and vesiculated with fluid textures that indicated a high gas content and low viscosity.
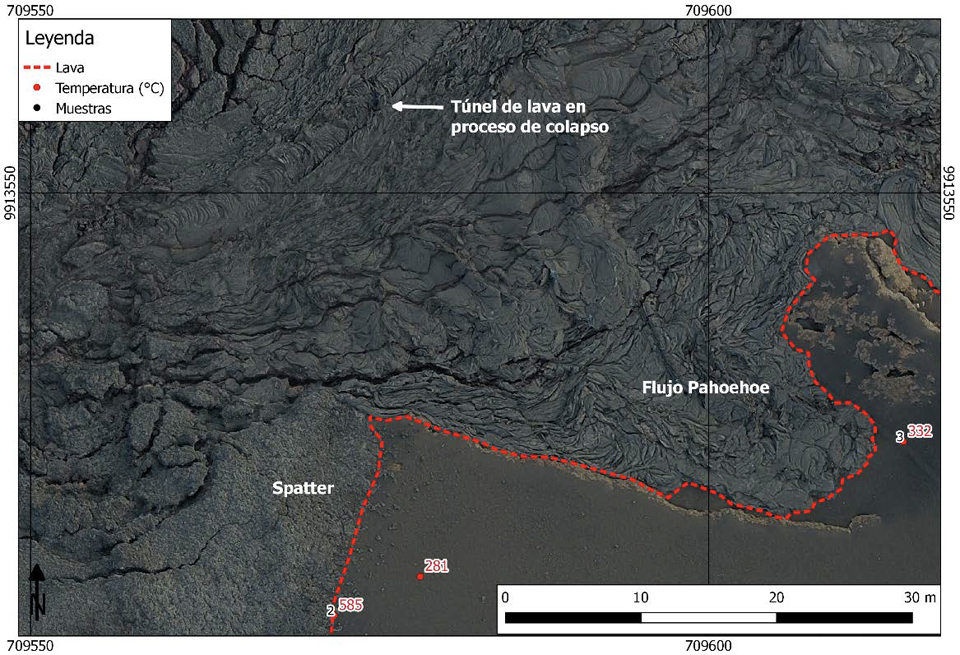 |
Figure 25. Pahoehoe flows, spatter, and a collapsing lava tunnel were visible near fissure 1 (above 'Spatter') at Sierra Negra when imaged by a drone during a field visit on 27-28 June 2018 shortly after the new eruptive episode began. This image covers the area near the top center of the image in figure 22 close to the fissure. Photos were taken by a drone flying 60 m above the flows by Benjamin Bernard, courtesy IGEPN (Volcán Sierra Negra, Informe de campo 27-28 junio2018, Termografía, Cartografía, y muestreo de los nuevos flujos de lava, sector de Volcán Chico). |
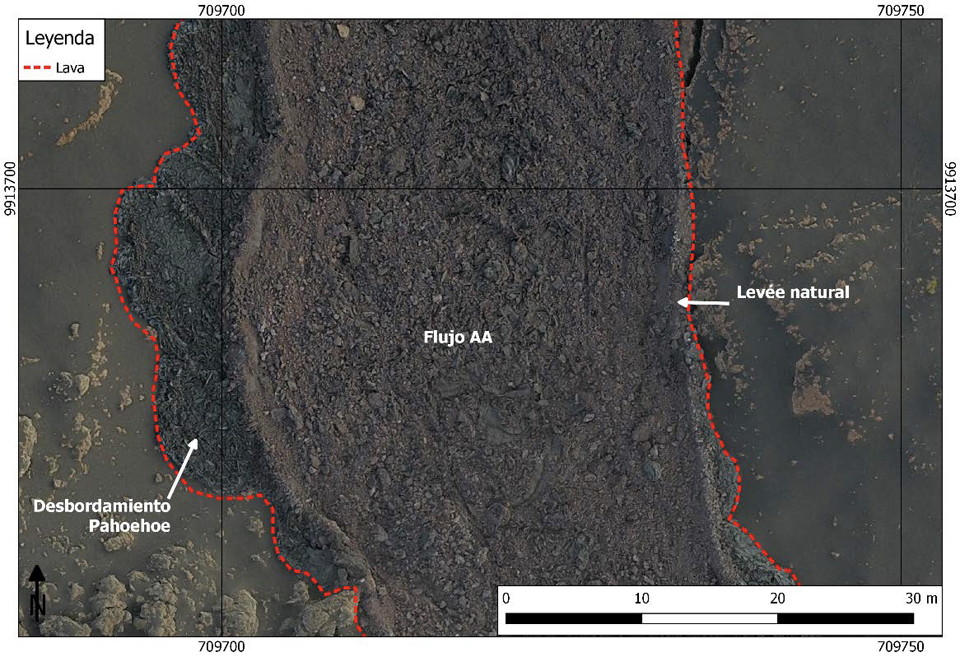 |
Figure 26. Aa flows formed as lava traveled down the steeper parts of the N flank of Sierra Negra on 26 June 2018, seen in this drone image taken during a field visit on 27-28 June. This image general location can be seen in the bottom right area in figure 22. Photos were taken by a drone flying 60 m above the flows by Benjamin Bernard, courtesy IGEPN (Volcán Sierra Negra, Informe de campo 27-28 junio2018, Termografía, Cartografía, y muestreo de los nuevos flujos de lava, sector de Volcán Chico). |
A small seismic event followed by several hours of tremor was recorded at 1552 on 1 July; a short while later National Park staff observed active lava flows on the NW flank. On 4 July, IG reported a M 5.2 earthquake that was 5 km deep; it was followed by 68 smaller seismic events. On 7 July seismic tremor activity indicating another pulse of magmatic activity was recorded by a station on the NE edge of the caldera at 1700. At the same time, satellite data showed an increase in the intensity of the thermal anomaly on the NW flank; Parque Nacional Galápagos staff confirmed strong visible incandescence in an area near the beach. Tremor activity continued on 8 July, although the amplitude gradually decreased.
The Washington VAAC reported an ash plume visible in satellite imagery on 2 July at 6.1 km altitude drifting SW. Later in the day a concentrated plume interpreted to be primarily steam and gas extended about 260 km SW. On 8 July ash could be seen moving both W and SW in satellite imagery at 2.7-3.0 km altitude. Later that day ash was visible extending about 115 km SW from the summit and other gases extended 370 km W. That evening the ash plume extended about 190 km SW at 3.7 km altitude. Gas-and-ash plumes were observed continuously drifting SW for the next three days (9-11 July) at 3.7 km altitude to a distance of about 80 km. On 13 July, two areas of ash and gas were seen in satellite imagery moving 25 km NW from the summit and up to 45 km SW at altitudes of 3.9 and 2.4 km respectively. A low-level ash plume on 16 July extended 30 km SW from the summit at 2.4 km altitude; incandescence was also visible in the webcam. The next day ash and gas emissions extended about 120 km SW at a similar altitude. Ongoing steam, gas, and ash emissions were seen in satellite imagery and in the webcam extending 110 km NW from the summit on 19 July at 3.4 km altitude. The Washington VAAC reported an ash plume on 30 July that rose to 3.4 km altitude and drifted SW. Strong SO2 emissions were recorded by both the OMPS and OMI satellite instruments throughout July 2018 (figure 27).
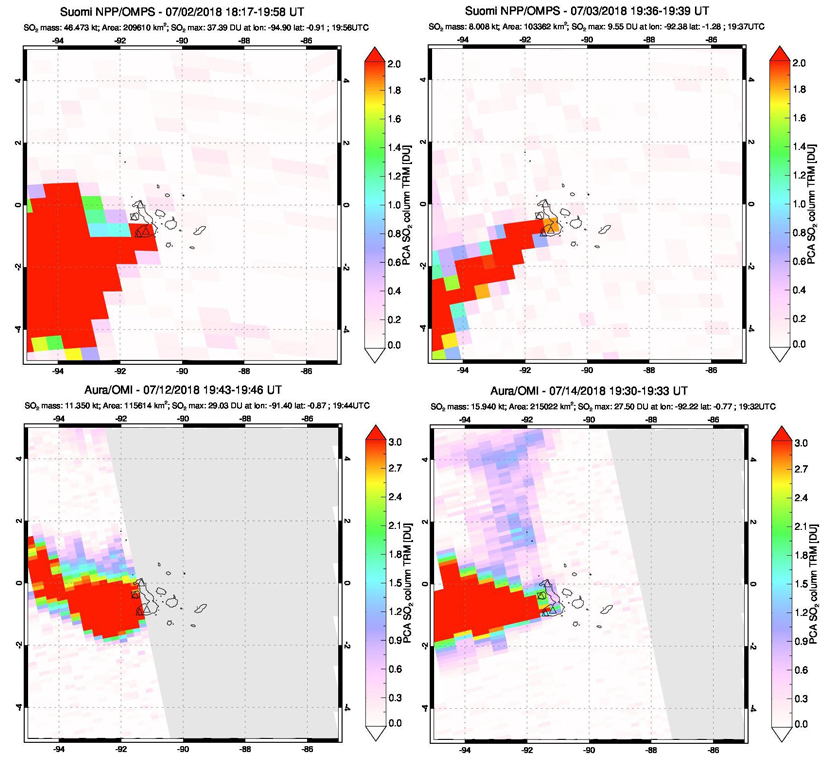 |
Figure 27. SO2 plumes from Sierra Negra exceeded 2 Dobson Units (DU) nearly every day during July 2018. Data gathered by the OMPS satellite instrument showed a large plume drifting SW on 2 July (top left), and a more narrow stream of SO2 drifting SW on 3 July (top right). The OMI satellite instrument captured large W-drifting plumes on 12 (bottom left) and 14 (bottom right) July. Courtesy of NASA Goddard Space Flight Center. |
In a report issued by IGEPN covering activity through 23 July 2018, they noted that at least four fissures had initially opened on 26 June at the start of the eruption (see numbers in figure 19 at the beginning of this report, and figure 31 at the end). Fissure 1, the longest at 4 km, was located at the edge of the caldera in the area of Volcán Chico; lava flows from this fissure traveled 7 km down the flanks, and over 1 km within the interior of the caldera. NW-flank fissures 2, 3, and 4 were much smaller (about 250 m long). Fissures 1-3 were active only until 27 June; fissure 4 continued to be active throughout July. Lava from this fissure reached the ocean on 6 July.
Gas and possible volcanic ash extended 35 km SW of the summit on 4 August at 1.5 km altitude; this was the last report of an ash plume by the Washington VAAC for the eruption. Daily reports from IGEPN indicated that nightly incandescence from advancing flows continued into August. Occasional low-level steam and gas plumes were also visible. Pulses of lava effusion on 4 and 9 August were accompanied by major episodes of seismic tremor activity and substantial SO2 plumes (figure 28). On 15 August satellite images showed lava from fissure 4 continuing to enter the ocean. The area where the lavas entered the sea were far from any human population or agricultural activities and only accessible by boats.
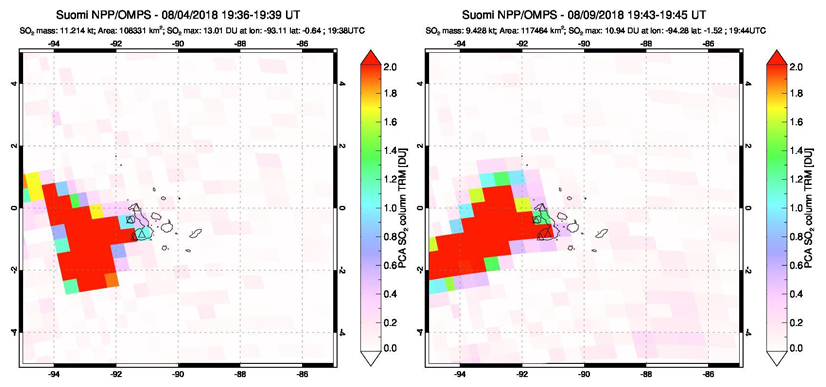 |
Figure 28. At Sierra Negra, large SO2 plumes were recorded by the OMPS instrument on the Suomi NPP satellite at the same time that an increase in seismic activity and effusion were noted on both 4 (left) and 9 (right) August 2018. Courtesy of NASA Goddard Space Flight Center. |
Throughout the ongoing eruption, pulses of thermal activity detected by MODIS infrared satellite sensors correlated with increases in seismic activity and observed flow activity. The MIROVA plot showed a high level of heat flow from the onset of the eruption on 26 June gradually decreasing in intensity through mid-August (figure 21). This was followed by a significant drop in heat flow and gradual cooling thereafter. After the initial fissure activity near the crater rim on 26-27 June, all subsequent activity was concentrated farther down the N flank at fissure 4 and is reflected in the number of pixels concentrated in that area of the MODVOLC plot of thermal alerts from June-September 2018 (figure 29).
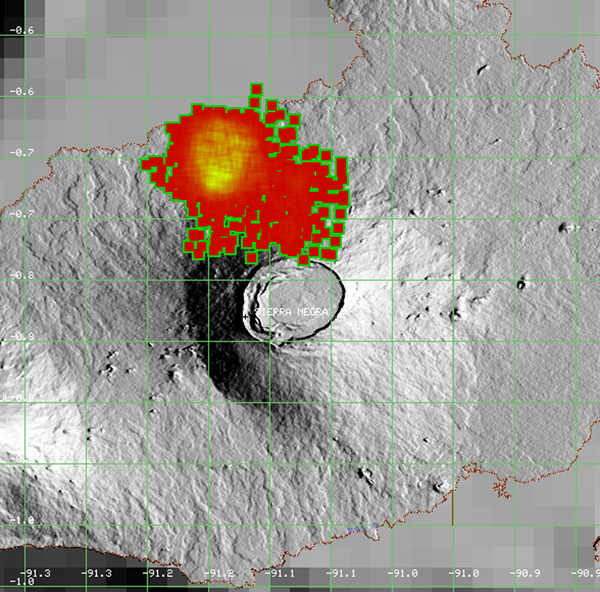 |
Figure 29. MODVOLC thermal alert locations corresponded to the locations of the observed flow activity at Sierra Negra, showing the sustained thermal activity from the mid-flank fissure 4 that lasted from late June through mid-September 2018. Courtesy of HIGP - MODVOLC Thermal Alerts System . |
The number of seismic events recorded during the eruptive episode had increased between 26 June and 30 July 2018 to an average of 265 per day. The peak was recorded on 29 June with 940 earthquakes. Between 31 July and 23 August, the average number was 121 per day, still higher than the level of 38 per day prior to the beginning of the eruption on 26 June. IG reported a continuous decline in activity during the last two weeks of August 2018. After the initial burst of effusive activity during 26-27 June, five additional pulses of increased thermal, seismic, and gas-emission activity were observed in multiple sources of data on 1-2, 7-8, and 31 July, and 4 and 9 August (figure 30).
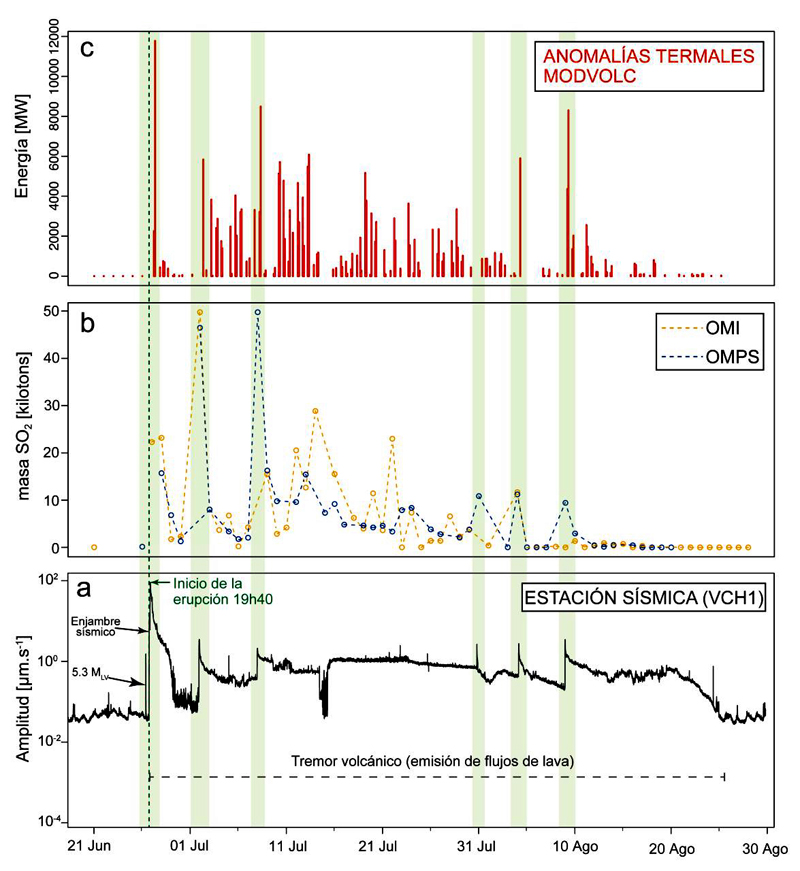 |
Figure 30. Multiple parameters of data from the eruption of Sierra Negra from 21 June to 30 August 2018. The dashed green line marks the start of the eruption, while the pale green vertical bars indicate the different eruptive pulses recorded throughout the eruption. a) Seismic energy data (RSAM) recorded by station VCH1, in a window between 1-8 Hz (location shown in figure 31); b) Time series of degassing of SO2 recorded by the OMI and OMPS satellites instruments; c) thermal anomalies recorded by MODVOLC. Courtesy of IGEPN (Informe Especial N°18 – 2018, Volcán Sierra Negra, Islas Galápagos, "Terminación de episodio ruptive actual", Quito, 31 de Agosto del 2018), also published in Vasconez et al (2018). |
In a summary report on 31 August 2018, IG reported that the eruption was divided into two main phases. The first and most energetic phase lasted one day (26 June) and was characterized by the opening of five fissures (table 2) located on the rim and N and NW flanks, and creation of lava flows that traveled as far as 7 km from the vents (figure 31). Lava was only active from all five fissures during the first day of the eruption, covering an area greater than 17 km2. During the rest of the eruption from 27 June-23 August, about 13 km2 of lava was produced from fissure 4, with lava reaching the sea on 6 July and expanding the coastline by 1.5 km2. Detailed descriptions of the fissures provided by IGEPN are given in the following section. By 25 August the lava flows covered an area of 30.6 square kilometers. Activity continued to decline the last week of August with decreased seismicity, gas emission, and no surficial activity visible.
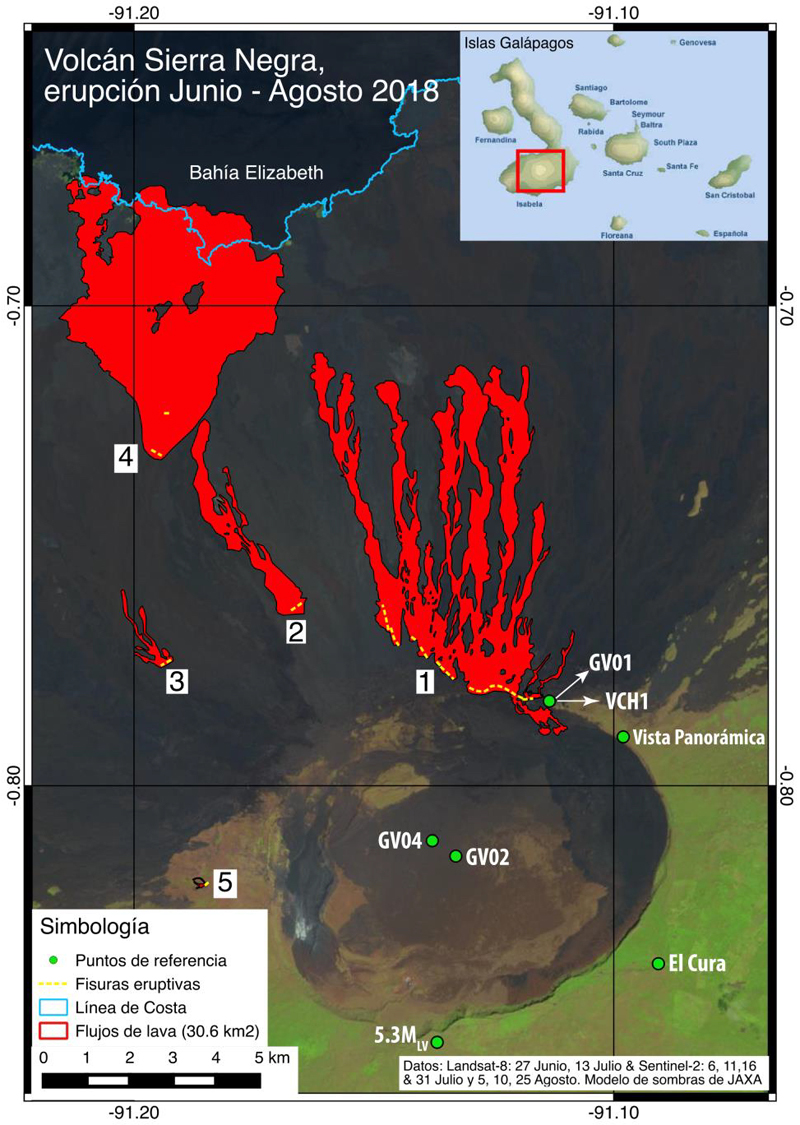 |
Figure 31. Map of the 26 June-August 2018 eruption of Sierra Negra volcano. The eruptive fissures are numbers and shown in yellow and described in detail in the next section. The coastline with Elizabeth Bay is shown in blue, and the lava flows appear in red. The green points include GPS and seismic stations, the epicenter of the earthquake of 5.3 MLV on 26 June, El Cura (control station of the Galápagos National Park) and the panoramic vista visited by tourists. Courtesy of IGEPN (Informe Especial N°18 – 2018, Volcán Sierra Negra, Islas Galápagos, "Terminación de episodio ruptive actual", Quito, 31 de Agosto del 2018), also published in Vasconez et al (2018). |
Table 2. Descriptions of the five fissures active during the June-August 2018 eruption of Sierra Negra (see figure 31 for locations). Courtesy of IGEPN (Informe Especial N°18 – 2018, Volcán Sierra Negra, Islas Galápagos, "Terminación de episodio ruptive actual", Quito, 31 de Agosto del 2018)
| Feature | Location | Description |
| Fissure 1 | Edge of the caldera in the Volcán Chico area, trending WNW, tangential to the edge of the caldera. | Four kilometers in length with lava flows that moved toward both the interior of the caldera and down the flank from the beginning of the eruption until 27 June, covering an area of 14.6 km2. The flows deposited outside the crater traveled 7 km downhill, without reaching the sea, while those inside it reached a maximum distance of 1.1 km. |
| Fissure 2 | NW of the caldera about 3 km below its edge of the caldera at an elevation of 700 m. | Approximately 250 m long and produced 4-km-long lava flows from the beginning of the eruption until 27 June, covering an area of 2.2 km2; its lava did not reach the sea. |
| Fissure 3 | WNW of the caldera about 4 km below its edge at an elevation of 550 m. | Approximately 250 m long and active from the beginning of the eruption until 27 June, emitting lava flows that covered an area of about 0.4 km2. The lava flows had a length of about 2 km and did not reach the sea. |
| Fissure 4 | NW flank at an elevation of 100 m between 7 and 8 km below the rim of the caldera. | Continuously emitting lava flows throughout the eruption. It was located on the On 6 July the lava flows from this fissure reached the ocean and modified the coastline of Isla Isabela by 1.5 km2. By 25 August when active flow ceased, its lavas had covered an area of approximately 13.3 km2. |
| Fissure 5 | Western flank at an elevation of 840 m, 1.5 km downhill from the inner edge of the caldera. | Length of 170 m and covered 0.026 km2. |
References: Davidge L, Ebinger C, Ruiz M, Tepp G, Amelung F, Geist D, Cote D, Anzieta J, 2017, Seismicity patterns during a period of inflation at Sierra Negra volcano, Galápagos Ocean Island Chain. Earth and Planetary Science Letters. 462. DOI: 10.1016/j.epsl.2016.12.021.
Geist D, Naumann T R, Standish J J, Kurz M D, Harpp K S, White W M , Fornari D, 2005, Wolf Volcano, Galapagos Archipelago: Melting and magmatic evolution at the margins of a mantle plume. Journal of Petrology 46:2197-2224.
Vasconez F, Ramón P, Hernandez S, Hidalgo S, Bernard B, Ruiz M, Alvarado A., La Femina P, Ruiz G, 2018, The different characteristics of the recent eruptions of Fernandina and Sierra Negra volcanoes (Galápagos, Ecuador), Volcanica 1(2): 127-133. DOI: 10.30909/vol.01.02.127133.
Information Contacts: Instituto Geofísico (IG), Escuela Politécnica Nacional, Casilla 17-01-2759, Quito, Ecuador (URL: http://www.igepn.edu.ec ); Washington Volcanic Ash Advisory Center (VAAC), Satellite Analysis Branch (SAB), NOAA/NESDIS OSPO, NOAA Science Center Room 401, 5200 Auth Rd, Camp Springs, MD 20746, USA (URL: www.ospo.noaa.gov/Products/atmosphere/vaac, archive at: http://www.ssd.noaa.gov/VAAC/archive.html); MIROVA (Middle InfraRed Observation of Volcanic Activity), a collaborative project between the Universities of Turin and Florence (Italy) supported by the Centre for Volcanic Risk of the Italian Civil Protection Department (URL: http://www.mirovaweb.it/); Hawai'i Institute of Geophysics and Planetology (HIGP) - MODVOLC Thermal Alerts System, School of Ocean and Earth Science and Technology (SOEST), Univ. of Hawai'i, 2525 Correa Road, Honolulu, HI 96822, USA (URL: http://modis.higp.hawaii.edu/); NASA Goddard Space Flight Center (NASA/GSFC), Global Sulfur Dioxide Monitoring Page, Atmospheric Chemistry and Dynamics Laboratory, 8800 Greenbelt Road, Goddard, Maryland, USA (URL: https://so2.gsfc.nasa.gov/); Nature Galápagos (Twitter: @natureGalápagos, https://twitter.com/natureGalápagos).
2018: June
| July
| August
2005: October
IG reported that the eruption at Sierra Negra that began on 26 June was divided into two main phases. The first and most energetic phase lasted one day (26 June) and was characterized by the opening of five fissures and lava flows traveling as far as 7 km from the vents. Lava was only produced from fissure 4 during the 57-day-long second phase (27 June-23 August), with lava reaching the sea on 6 July and expanding the coastline. By 25 August the lava flows in total covered an area of 30.6 square kilometers. Activity continued to decline the last week of August with decreased seismicity, gas emission, and no surficial activity visible.
Source: Instituto Geofísico-Escuela Politécnica Nacional (IG-EPN)
IG reported that during 20-21 August both steam-and-gas emissions and incandescence from lava flows were visible on the Sierra Negra webcam. No activity was noted when the weather was clear during 22-28 August.
Source: Instituto Geofísico-Escuela Politécnica Nacional (IG-EPN)
IG reported that lava effusion at Sierra Negra continued at variable intensities. The most intense pulses, recorded on 4 and 9 August, were accompanied by major episodes of seismic tremor; activity slightly declined after 9 August. On 15 August satellite images showed lava from Fissure 4 continuing to enter the ocean.
Source: Instituto Geofísico-Escuela Politécnica Nacional (IG-EPN)
IG reported that the eruption at Sierra Negra continued during 7-14 August. Incandescence from active NNW lava flows was visible almost nightly. A steam-and-gas plume rose 1.8 km a.s.l. and drifted W on 7 August.
Source: Instituto Geofísico-Escuela Politécnica Nacional (IG-EPN)
IG reported that the eruption at Sierra Negra continued during 1-7 August. Incandescence from active lava flows was visible daily. An increase of tremor began at 2220 on 3 August and lasted two hours, signifying a new pulse of activity on the N flank. Small gas emissions were visible on 4 August, and steam-and-gas emissions were noted on 6 August.
Source: Instituto Geofísico-Escuela Politécnica Nacional (IG-EPN)
IG reported that the eruption at Sierra Negra continued during 25-31 July. Sulfur dioxide flux was as high as about 1,400 tons per day (on 28 July), and daily counts of volcano-tectonic and long-period events were 24-65 and 3-32, respectively. Nightly incandescence from advancing lava flows was visible. Gas plumes rose more than 1.8 km above the vents and drifted N, NW, and W.
Source: Instituto Geofísico-Escuela Politécnica Nacional (IG-EPN)
IG reported that the eruption at Sierra Negra continued through 23 July, and continued to vary in intensity. Four fissures had initially opened on 26 June, at the start of the eruption. Fissure 1 is 4 km long and located at the edge of the caldera in the area of Volcán Chico. Lava flows from this fissure traveled 7 km down the flanks, and 1.7 km within the interior of the caldera, covering an area of 16.1 square kilometers. Fissure 2 is about 250 m long, located NW of the caldera, and produced lava flows that traveled 3 km and covered an area of 2.3 square kilometers. Fissure 3, located W of the caldera, is 250 m long and produced lava flows that descended the flanks 2 km, covering an area of 0.3 square kilometers. Fissures 1-3 were active until 27 June. Fissure 4, 250 m long and located on the NW flank, continued to be active. Lava from this fissure reached the ocean between 9 and 10 July, and by 16 July had covered an area of 11.6 square kilometers (30.4 square kilometers was covered by lava from all four fissures).
Source: Instituto Geofísico-Escuela Politécnica Nacional (IG-EPN)
Based on satellite data and wind model data, the Washington VAAC reported that on 11 July gas-and-ash plumes from Sierra Negra rose 3.7 km (12,000 ft) a.s.l. and drifted almost 85 km W. Gas plumes on 13 July drifted N, NW, and SW. On 16 July gas plumes with minor amounts of ash rose 2.4 km (8,000 ft) a.s.l. and drifted SW. Incandescence was visible in webcam images.
Source: Washington Volcanic Ash Advisory Center (VAAC)
IG reported that a new magmatic intrusion at Sierra Negra was heralded by a M 5.2 earthquake recorded at 1830 on 4 July, and followed by 68 events between M 1.1 and 3.9. Seismic tremor began to be recorded at 1700 on 7 July by a station on the NE edge of the caldera. At the same time satellite data showed an increase in the intensity of the thermal anomaly on NW flank (it had decreased the previous day). Parque Nacional Galápagos staff confirmed strong incandescence in an area near the beach. A weak plume of water vapor and ash rose as high as 3.3 km (10,800 ft) a.s.l. and drifted SW and W. Tremor continued to be registered on 8 July, though the amplitude gradually decreased. Vapor-and-ash plumes reported by the Washington VAAC rose about 2 km (6,600 ft) a.s.l. and drifted SW, and the thermal anomaly remained intense. Gas clouds drifted 115 km W.
The current eruption at Sierra Negra began on 26 June and, according to news articles, prompted tourist restrictions and the evacuation of 50 residents.
Sources: Instituto Geofísico-Escuela Politécnica Nacional (IG-EPN); BBC News
Based on video and photos shared by Parque Nacional Galápagos staff, IG reported that the eruption at Sierra Negra that began at 1340 on 26 June originated from several fissures on the N flank and one within the caldera. The flank flows reached the sea between Elizabeth Bay and Punta Morena. A gas-and-ash plume rose about 10.5 km and drifted W. Seismic and acoustic data indicated a gradual decrease but continuing activity on 27 June. A small seismic event was recorded at 1552 on 1 July, followed by at least four hours of tremor. At 1600 national park staff observed lava flows on the NW flank.
Source: Instituto Geofísico-Escuela Politécnica Nacional (IG-EPN)
On 22 June IG reported increased seismic activity at Sierra Negra on the S end of Isabela Island; the largest event, a M 4.2, was recorded at 0624 and felt in El Cura and San Joaquín, NE of the volcano. A M 5.3 earthquake was detected at 0315 on 26 June, occurring at a depth of 5.3 km below Sierra Negra. The event was strongly felt on the upper flanks and in Puerto Villamil (23 km SE). Several aftershocks and subsequent tremor were recorded. An earthquake swarm began at 1117, characterized by events located 3-5 km depth. A M 4.2 earthquake was recorded at 1338, and followed by increasing amplitudes of seismic and infrasound signals. Parque Nacional Galápagos staff heard noises described as bellows coming from Volcán Chico fissure vent, and coupled with the seismicity and infrasound data, suggested the start of an eruption. An IG report posted 20 minutes later described a thermal anomaly identified in satellite images in the N area of the caldera, near Volcán Chico. Park staff observed lava flowing towards the crater’s interior as well as towards the N flank.
Source: Instituto Geofísico-Escuela Politécnica Nacional (IG-EPN)
On 8 June IG reported a continuing high level of seismicity at Sierra Negra, characterized by a larger number and magnitude of earthquakes, indicating magma movement. The number of events per day had been significantly increasing since mid-2016. In the previous 10 days there was an average of 42 local events/day; on 25 May there were 104 events, the largest number of earthquakes per day recorded since 2015. In addition, in a 24-hour period during 7-8 June there were a total of 48 volcano-tectonic events, two long-period events, and three hybrid earthquakes; a M 4.8 long-period earthquake was recorded at 0715 on 8 June. The earthquake epicenters were mainly located on the edges of the crater, in two NE-SW trending lineaments; the first covered the N and W edges of the crater and the second went from the NE part around to the S edge. Data showed very large deformation at the caldera’s center, compared with lower levels of deformation outside of the caldera.
Source: Instituto Geofísico-Escuela Politécnica Nacional (IG-EPN)
According to IG, an eruption began at Sierra Negra on the S end of Isabela Island on 22 October at 1730 when an explosion was heard by many people in the town of Villamil, 20 km SE of the volcano. The eruption was preceded by a seismic event on 22 October at 1438, and by earthquakes on 19 October and 2 weeks earlier. The Washington VAAC recorded an ash cloud on satellite imagery at 1745 at a height of ~15.2 km (50,000 ft) a.s.l. moving SW, and a very large hotspot. The ash cloud may have reached a height of 20 km (65,600 ft) a.s.l. Extensive lava fountains were seen rising to heights of 200-300 m along a segment of the Sierra Negra rim. Incandescent lava flowed several kilometers down the outer NW flank of the volcano's edifice and tourists reported seeing two lava flows descending the N flank. The exact orientation of flows on the volcano's flanks was not clear from early reports. Scientists did not see active lava flows in this area or evidence of flows entering the sea during an overflight on 23 October.
During a visit to Sierra Negra on 23 October, scientists saw that the eruption originated from four adjacent craters aligned along a 500-m-long fracture at the base of the inner wall of the volcano's caldera in the NE sector. Lava traveled from four principal vents southwards with exceptional force, volume, and speed downslope in several main channels. Based on observations, the main lava river traveled nearly 20 m/sec as it left its source vents. Two vents mainly supplied lava to the many lava rivers flowing southward over the northern caldera bench and then down onto the caldera floor. The feeding fracture apparently extended westward along the inner wall, but then climbed up onto the caldera rim itself where its trace was not obvious. However, small vents with fountaining and incandescent lava were observed on the rim along this general fracture system, implying that the active fracture extended for about 2 km W of the main vents.
By 23 October around 1530, the lava formed one large flow that was 1-1.5 km wide and had progressed ~7 km southeastward along the base of the eastern interior wall of the caldera, then westward along the southern wall reaching a point almost halfway across the caldera. The volume of lava ejected at this time was estimated at 25 million cubic meters. On 26 October, there were reports that lava was no longer emitted from one of the four principal vents. No populated areas on the island were threatened by the eruption.
Source: Instituto Geofísico-Escuela Politécnica Nacional (IG-EPN)
A large eruption began at Sierra Negra on 22 October. According to the Washington VAAC, the eruption began around 1645, sending an ash cloud to ~12.8 km (42,000 ft) a.s.l. that drifted SW. A large hotspot was visible on satellite imagery. On 23 October around 0215 the cloud appeared to be at ~6.1 km (20,000 ft) a.s.l. on satellite imagery. Another eruption occurred on 23 October around 0700, and it's cloud also rose to ~12.8 km (42,000 ft) a.s.l. according to a pilot's report. By 1215, the cloud height was estimated to be at ~7.6 km (25,000 ft) a.s.l. based on satellite imagery. Although ash was no longer visible on satellite imagery on 24 October at 1215, a hotspot was seen. 25 October satellite imagery through 1315 showed the ash plume extending 220 km SW of the summit. A news article reported that three lava flows were emitted during the eruption.
Sources: Washington Volcanic Ash Advisory Center (VAAC); Associated Press
Reports are organized chronologically and indexed below by Month/Year (Publication Volume:Number), and include a one-line summary. Click on the index link or scroll down to read the reports.
14-km-high cloud; lava flows to sea
An eruption began on 13 November at Sierra Negra, the only historically active volcano in the Galápagos Islands that is presently inhabited. The location was Volcán Chico, a circumferential fissure zone 1 km N of, and 100-200 m below, the caldera rim of Sierra Negra. Volcán Chico was also the site of the last two eruptions from this volcano, in 1963 and 1953, and has been described by Delaney and others (1973). At the time of the last report lava was still flowing down the volcano's uninhabited N slope 3 weeks after it began. The residents of the S slope, evacuated on the first day of the eruption, had returned to find damaged crops and livestock.
At 0730 on 13 November a local earthquake was registered on the CDRS seismograph (90 km E of Sierra Negra on Isla Santa Cruz), part of the WWSSN maintained by the USGS [see also 4:12]. A second, larger, earthquake followed in 20 minutes, and at 0845 the first explosion was heard by people living on the S flank. Within 20 minutes of the first explosion, tephra (including scoria and Pele's hair) fell on the villages of Santo Tomás and Villamil, 13 and 26 km SE of the eruption site. Residents of Santo Tomás began evacuation to the coastal village of Villamil.
The eruptive cloud was large enough to be seen on NOAA's SMS-1 weather satellite, which transmits images of the whole hemisphere every 30 minutes from its equatorial geostationary orbit. The cloud first appeared on the 0930 image and grew rapidly to an area estimated to be 220 x 130 km within 2 hours. The cloud soon separated into two lobes and measurements on the infrared imagery by Arthur F. Krueger indicate a maximum elevation of at least 14 km for the main lobe at 1500. This lobe moved SE at 25 km/hour while the other lobe, estimated to be about 8 km high, moved SW at 30 km/hour. By 2200, the main lobes were quite diffuse, but a low, thin plume (near the 4-8 km resolution of the imagery) extended about 50 km S from Sierra Negra. No prominent eruptive clouds were visible on SMS-1 imagery during the following days.
A CDRS team (including P. Ramón, J. Budris, and T. & A. Moore) reached Volcán Chico 24 hours after the eruption began. Upon arrival at Villamil, they noted a thin coating of tephra with some light scoria fragments to 5 cm in diameter. Tephra at the caldera rim was 2-3 cm thick, with some 15-20-cm bombs, but nothing larger than 1 cm was falling at the time. Up to 20 vents were active along the 1-2-km [8 km, see 5:1] circumferential fissure and individual fountains reached 100-m heights. As many as 13 lava flows coalesced downslope to the N and probably reached the sea on the first day. Billowing clouds were visible at the coast of Elizabeth Bay on the morning of 15 November, and two biological groups were reported to be investigating the lava/sea interface.
At 1500 on 14 November, a higher resolution NOAA satellite, VHRR Tiros 6, returned an infrared image showing the lava flow on the N flank and a high vapor plume heading S. The CDRS seismograph recorded 8 local events on 14 November and 6 on the following day. Observers at the site felt many tremors, but noted that eruptive intensity seemed to decrease after a peak around 2200-2300 on 14 November. Local haze increased during the next 2 days and vent activity declined steadily. Only four vents were active and fountaining had almost stopped by sunset on 16 November. At 0400 the next morning, however, observers were awakened by the largest explosion of their 5 days at the site. Fountaining increased immediately and continued to build to a peak around 5 hours later. That same night the wind changed, carrying haze ENE over Isla Santa Cruz and reducing visibility there to 2 km on 19 November.
Activity at the vents remained low on 18 and 19 November, when the group left. The flows continued, however, and on the morning of 19 November, NASA's Landsat C satellite returned a high-resolution near-infrared image clearly showing the main flow as a 100 m band bearing 030° for about 12 km from the vent area (figure 1). On that same day, tephra fragments to 5 mm in diameter were collected on the ship Delfin, over 100 km E of the volcano.
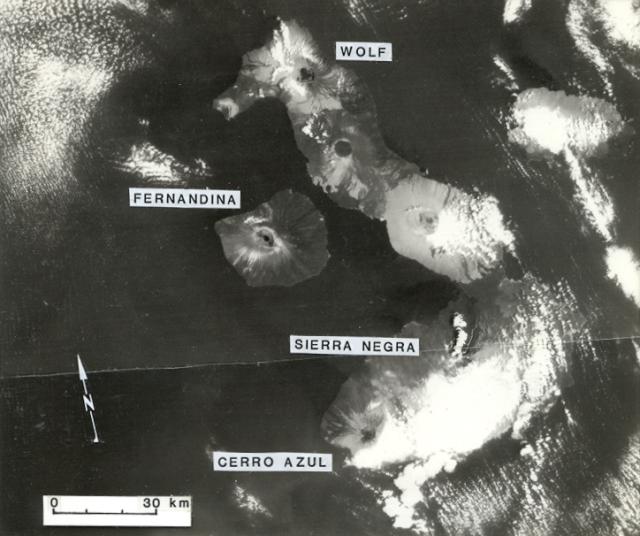 |
Figure 1. Western Galapagos Islands on 19 November 1979, the 7th day of the Sierra Negra eruption. A 130 x 165 km area is shown (a joined pair of Landsat C images). The large cloud near the base of the figure obscures the summit and S flank of Sierra Negra, but a prominent white eruptive cloud trends NNE from the eruption site near the volcano's N rim and a lava flow appears just E of the cloud as a thin white band trending NE for 12 km. The near-infrared image (Band 7) shows the vegetated portions of these volcanic islands as light gray, in contrast to the dark young lavas. Summit calderas of most volcanoes are visible. Images provided by NASA/GSFC (ID's: PAO file E-931-225BN and E-932-225BN). |
As the CDRS group left the volcano, they noted an average tephra thickness of 3-5 cm on the caldera rim and serious damage to the biota on the upper SE flank. Acid rain and haze killed much vegetation and the group noted dead birds and rats. Residents of the S flank, who returned to their farms after the eruption's first day, reported damage to crops and livestock.
H. Hoeck was on the volcano 1-2 December and reported that the vegetation was beginning to recover. One large lava flow continued down the N slope, and several vents were steaming. Six small vapor vents were observed on the S floor of the caldera nearly 10 km S of the eruptive fissure. This caldera, the widest (10 x 7 km) and shallowest in the Galápagos, was not otherwise affected by the eruption, and Arnaldo Tupiza (CDRS representative on Isabela and very familiar with the volcano) recognizes these six vents as new.
None of the eruption earthquakes have yet been located on the WWSSN [but see 4:12], but a magnitude 5.0 event was located in the Galápagos at 1006 on 28 October. Its preliminary epicenter determination is 60 km NW of the eruption site.
Information Contacts: P. Ramón, J. Budris, H. Hoeck, P. López, and J. Villa, CDRS, Galápagos; M. Hall, Escuela Politécnica, Quito; A. Krueger, NOAA/NESS; C. Wood, NASA/GSFC; B. Presgrave, USGS/NEIS, Denver, CO.
Eruption ends; additional earthquakes located
The fissure eruption was continuing on 5 December. LANDSAT imagery on 7 December, however, showed no thermal anomaly like the lava flow on the 19 November LANDSAT image (figure 1), although a vapor cloud similar to that of 19 November was present. When Arnaldo Tupiza visited the eruption site on 29 December, the lava flow had ceased, but the vents continued to steam and the solfataric area had grown. The new fumaroles on the S caldera floor remained active.
Two earthquakes connected with this eruption have been located by USGS/NEIS. The first, at 0751 on 13 November [4:11], was magnitude 4.4 and its hypocenter (0.89°S, 91.23°W) was located 18 km SW of the eruption site. This was followed at 0817 by another earthquake that wrote a very similar, and only slightly smaller, record on the CDRS seismograph 90 km to the E. This event has not been located by NEIS, but was followed in less than 30 minutes by the first explosion recognized on the island. Seismicity increased on the eruption's second afternoon, and at 1858 on 15 November, a magnitude 4.8 event was recorded. Its hypocenter (0.96°S, 91.25°W) was located by NEIS 24 km SSW of the eruption site. These hypocenters are in the area of the February 1979 flank eruption of Cerro Azul [4:1-2], but study of the 1968 caldera collapse earthquakes from Fernandina (Filson et al., 1973), where true epicenters were known, showed that hypocenter mislocations for events of this magnitude range averaged about 50 km.
Reference. Filson, J., Simkin, T., and Leu, L.-K., 1973, Seismicity of a caldera collapse: Galápagos Islands 1968: JGR, v. 78, no. 35, p. 8591-8622.
Information Contacts: A. Tupiza and H. Hoeck, CDRS, Galápagos; USGS/NEIS, Denver, CO.
Last month's eruption obituary was premature
On 14 January the new lava delta, formed at Bahia Elizabeth by the 13 November eruption, was visited for the first time in 2 months. Hendrik Hoeck, inspecting the flow at night with binoculars, saw red spots along the flow length and some active feeding at vents 12 km inland. Motion was not visible along the 1-1.5-km flow front in daylight, but water temperatures of 50-60°C at distances of 30 m from the shore provide further evidence that the flow remains active. Pelicans and Franklin's gulls were concentrated in the area, presumably feeding on killed marine organisms, and two dead green turtles were observed. A pack of feral dogs appears to have been cut off by the new flows from more vegetated parts of Sierra Negra, and it is feared that they may cross the barren older lava flows to reach volcán Alcedo to the N. Alcedo has not been threatened with feral dogs and it is the home of the largest population of giant tortoises in the Galápagos.
Arnaldo Tupiza walked about 6 km inland on 14 January, noting flow thickness of 3-5 m, two 10 m-diameter "pools" of molten lava, and another major flow diverging toward the NE. The most active vents were farther W, along the circumferential fissure, than any previously reported, and it is not yet clear whether activity has resumed after migrating westward or whether the westerly vents were not recognized during previous observations from the vigorously steaming E end of the fissure system. The mid-January observations indicate an active fissure length of 8 km.
Information Contacts: H. Hoeck and A. Tupiza, CDRS, Galápagos.
12 June-29 August 2004, GPS data indicate 77 cm of caldera-floor uplift
Sierra Negra volcano contains a six-station, continuously monitored GPS network. The instruments were installed in collaboration with a research consortium (UNAVCO) in May 2002 (figure 2).
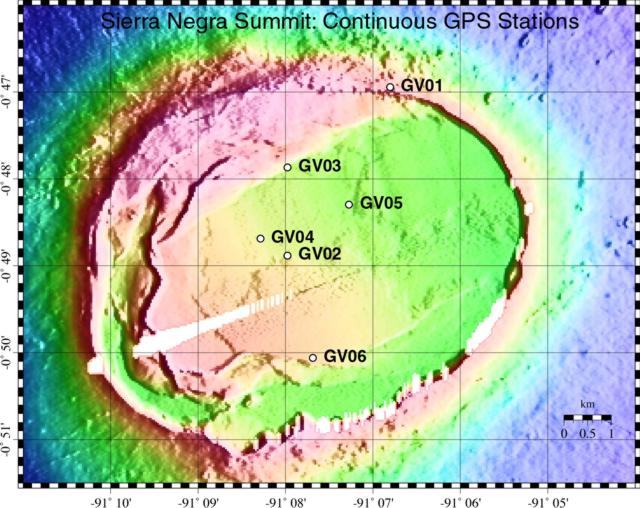 |
Figure 2. The summit of Sierra Negra has this dedicated GPS system continuously monitoring deformation. The shading reflects ground surface elevations; although a key to elevations was not provided, the map makes evident the caldera's broad floor and circular form. Courtesy of Geist, Chadwick, and Johnson. |
Starting on 12 June 2004 and continuing through at least 29 August 2004, the rate of uplift of the caldera floor, as measured by this network, had accelerated to 77 cm/year (table 1). This rate was comparable to that inferred from InSAR data in the late 1990s (Amelung and others, 2000). That late 1990's uplift was attributed to trap-door faulting of the caldera floor along its southern margin, a process presumably driven by a shallow (< 2 km) intrusion of magma. Deflation occurred during 2001-2002, and slower uplift of about 12 cm/y prevailed during March 2003-May 2004 (table 1). The 12 June-29 August interval was noteworthy for the high rates of uplift (table 1).
Table 1. A summary of the geophysically derived movement of the caldera floor at Sierra Negra. Courtesy of Dennis Geist, William Chadwick, and Dan Johnson.
| Interval | Comments | Measurement Technique |
| 1992-1998 | 240 cm of uplift punctuated by trapdoor uplift in 1997 or 1998 | InSAR (Amelung and others, 2000) |
| 1998-1999 | Inflation at 65 cm/year | InSAR (Amelung and others, 2000) |
| 2000-2001 | Deceleration of uplift to 7 cm/year | Campaign GPS (Geist and others, submitted) |
| 2001-Feb 2003 | Deflation of ~9 cm/year | Campaign and continuous GPS |
| Mar 2003-May 2004 | Inflation at ~12 cm/year | Continuous GPS |
| 12 Jun-29 Aug 2004 | Inflation at 77 cm/year | Continuous GPS |
The Instituto Geofísico in Quito, Ecuador monitors seismic activity in the Galápagos, using a network that includes a single station on Sierra Negra. Unfortunately, that network was down for the past year, in need of a variety of hardware, including the seismometer at Sierra Negra. Thus, for the interval of interest, seismic data were absent. Hugo Yepes estimated that to repair the Galápagos system would require about $9,000 (USD) in equipment and $4,000 (USD) in personnel transport and field expenses. He also said that the region requires more stable long-term logistical support.
The 12 June-29 August 2004 uplift was symmetrical about the caldera's center. The pattern and rate of uplift was well modeled as a 2.1 km deep sill intruded by about 12 x 106 m3 of magma since June 2004.
Sierra Negra last erupted in 1979, when nearly 1 km3of lava erupted from a circumferential fissure near the summit, covering its N flank./p>
References. Amelung, F., Jonsson, S., Zebker, H., Segall, P., 2000. Widespread uplift and "trapdoor" faulting on Galápagos volcanoes observed with radar interferometry. Nature 407, 993-998.
Geist, D., Chadwick, W.W., and Johnson, D., Results from new GPS and gravity monitoring networks at Fernandina and Sierra Negra volcanoes, Galápagos, 2000-2002 (submitted to the Journal of Volcanology and Geothermal Research in 2004).
Information Contacts: Dennis J. Geist, Department of Geological Sciences, University of Idaho, Moscow, Idaho 83844-3022 USA; William W. Chadwick, Jr., Cooperative Institute for Marine Resources Studies (CIMRS), NOAA Pacific Marine Environmental Laboratory (PMEL), 2115 SE OSU Drive, Newport, OR 97365 USA; Daniel J. Johnson, University of Puget Sound, Department of Geology, 1500 N. Warner, Tacoma, WA 98416, USA; Hugo Yepes, Geophysical Institute (IG), Escuela Politécnica Nacional, Apartado 17-01-2759, Quito, Ecuador (URL: http://www.igepn.edu.ec/).
Caldera erupts starting 22 October 2005 at fissure on caldera's inner N wall
At about 1730 on 22 October 2005 Sierra Negra began erupting. This shield volcano with a large oval-shaped caldera is located at the S end of Isabela Island. Circumferential fractures define the northern edge of the caldera. Volcán Chico, noted for its 1963 and 1979 eruptions, is comprised of a series of scoria cones and other vents aligned along several prominent fractures on the outer slope of the N caldera rim. The present activity is not related to the Volcán Chico fracture system, but is venting from fractures along the N inner caldera wall. The most prominent fracture can be traced westward ~3 km where it lies along the rim. This initial report was provided by a scientific team from the Instituto Geofísico.
The eruption was preceded by a seismic event at 1438 on 22 October, felt in the coastal village of Villamil (20 km SE of the caldera border) and by Park Wardens on Cerro Azul. Others reported single earthquakes on 19 October and two weeks earlier. At 1730 the eruption began with an explosion heard by many people in the Villamil area. Hikers in the area of the subsequent lava emission in the mid-afternoon of both 21 and 22 October witnessed no unusual activity. By 1745 the eruption column had reached an estimated altitude of 5 km, and the setting sun illuminated the light gray eruption column. At 1815 the team observed the column after sunset from Point (Punto) Ayora, Santa Cruz Island (80 km E) and estimated its height at 10 km. The still-rising column was 4-6 km wide, not spreading laterally, and a small lenticular cloud was beginning to form a cap over the column. As night fell, the western sky above the caldera was a burgundy red, suggesting that lava had covered an extensive area of the caldera floor. Satellite imagery of the eruption at 1745 showed an eruption cloud at an estimated altitude of at least 15 km moving SW. A very large hotspot in the multispectral imagery was also observed and continued on 27 October.
Observations at 1945 from the Santa Cruz highlands (75 km away) employing a camcorder with night vision capabilities confirmed extensive lava fountaining estimated to be 200-300 m high along a segment of the caldera rim, as well as the incandescence from a lava flow several kilometers long descending the NW outer flank. Although the complete eruption column was not visible, it may have reached an altitude close to 20 km and had spread out. Tourist boats between Isabela and Fernandina Island reported seeing two lava flows descending the N flank.
During an overflight between 0715 and 0900 on 23 October the team did not witness active lava flows or evidence of lava having entered the sea. A thin khaki-colored ash cloud layer was observed, between about 1,200 and 1,500 m altitude, that had spread out laterally and extended E as far as St. Cruz Island and N to Santiago Island. Later in the day the plume was directed NNW in agreement with satellite information. From the plane the team confirmed that the main eruption was venting from four craters along a 500-m-long fracture at the base of the NNE inner caldera wall. The highest lava fountaining (up to 200 m high) was being generated at the two middle vents, while the end vents were feeding many lava flows S onto the caldera floor. The fracture apparently extended W along the inner wall, but then climbed to the caldera rim where its trace was not obvious. However, small vents with fountaining and incandescent lava were observed on the rim along this general fracture system, implying that the active fracture extended ~ 2 km W of the main vents.
During the mid-day hours of 23 October the team ascended the S flank, followed the E rim of the caldera, and reached a point ~ 800 m from the active vents, from which the following description was made. From the four principal vents the lava flowed S with exceptional force, volume, and speed downslope in three main channels (figures 3 and 4). Based on the apparent speed of the lava, and the more than 10-m height of the waves in the stream of passing lava, the team estimated that the main lava flow was traveling nearly 20 m/second as it left its vent. The W channels, some 30-50 m wide, maintained their red incandescent color and high speeds, albeit less than that near the vent.
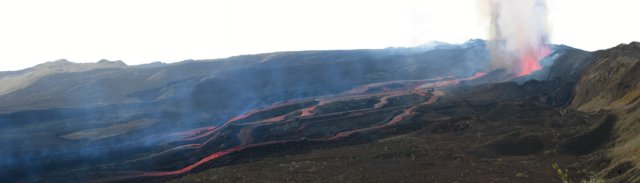 |
Figure 3. View looking W from the NE rim of Sierra Negra's caldera (right) on 23 October 2005. The caldera floor is to the left. The four active vents are superimposed in this photo, aligned along the E-W fracture that lies at the base of the inner caldera wall. Numerous lava flows descended southwards to the left where they joined to form one single flow of a'a lava ~ 1 km wide and 7 km long that had already reached the southern inner wall of the caldera on 23 October. Courtesy of M. Hall. |
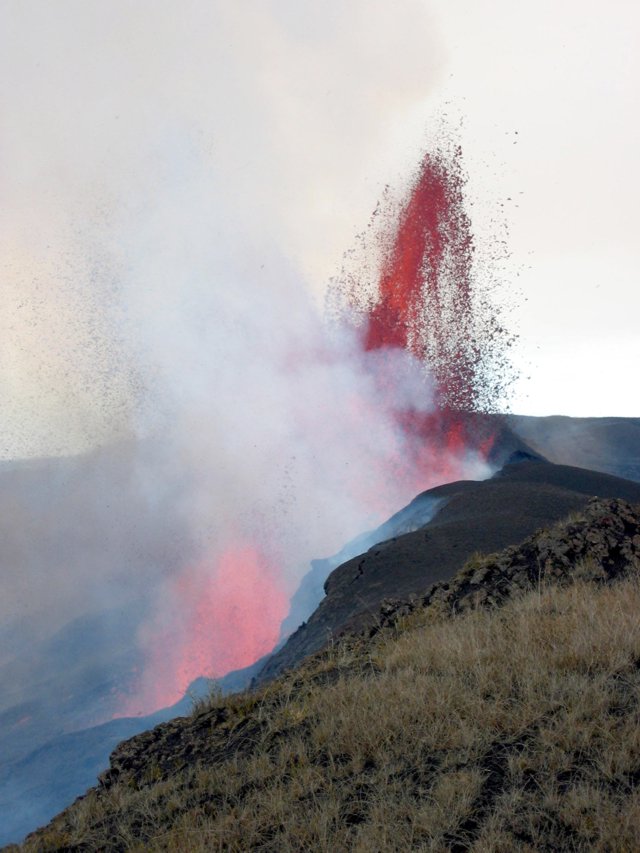 |
Figure 4. A 150-m-high lava fountain rises on 23 October 2005 from one of four active vents that define the active fracture system at the base of the northern inner wall of Sierra Negra's caldera. From these four principal vents lava flows moved southwards at velocities estimated at close to 20 m/second on 23 October. Courtesy of M. Hall. |
By 1500 the E channel was slowing and cooling to a gray surface color; this thin solid veneer was subsequently fragmented when the flow went over the edge of the bench and cascaded to the caldera floor. On the caldera floor the incandescent lavas of all three channels disappeared under the black solidified a'a lava that already covered about 12% of the caldera. In the 22 hours since the eruption had begun, the lavas had formed one large flow 1-1.5 km wide that traveled SE along the base of the E interior caldera wall, then W along the S wall reaching a point almost halfway across the caldera. As such it had traveled a total distance of 7 km and had started small brush fires on the floor and interior walls of the caldera. With an estimated thickness of no more than 3 m, the volume of the lava ejected by 1530 on 23 October was calculated at about 25 million cubic meters.
Along the trail leading to the vent area an increasing amount of scoria fragments was observed on the rim's edge. Fragments ~ 1 cm in size were first observed ~ 4 km SE of the active vents, and they increased in size (up to 15 cm) and abundance towards the vents. Very little fine ash was in the air or on the ground along the E caldera rim. The scoria was black, exceedingly vesiculated, with vesicles from millimeter to many centimeters in diameter; it seemed comparable in density to popcorn. No crystals were observed in the glassy scoria material. At their closest approach to the vent, scoria fragments formed a deposit 3-5 cm thick.
An explosion heard at 1900 on 25 October was accompanied by a dark eruptive column and minor ashfall along the E rim of the caldera and probably elsewhere. By early 26 October the Park Wardens were reporting that one of the four principal vents had shut down. Observations made late on 26 October indicated that the a'a flow on the caldera floor had slowed and was still several kilometers from the sulfur mine area. Civil Defense officials also reported that apparently less lava was leaving the vents and that lava extrusion might have shifted to the outer N flank, possibly to the Volcán Chico fracture system.
The only inhabited areas include the small town of Villamil, located 20 km SE of the caldera's border on the S coast, plus several other small populated areas about halfway between the caldera and Villamil. There was no immediate threat to those residents, given the fact that in order to spill out of the caldera and descend the S flanks the entire 100-m depth of the caldera would have to fill with lava. The southern caldera border has not been active in the recent geologic past.
Information Contacts: Minard Hall and Patricio Ramón, Instituto Geofísico, Escuela Politécnica Nacional, Apartado 17-01-2759, Quito, Ecuador (URL: http://www.igepn.edu.ec/); Washington Tapia and Oscar Caravajal, Parque Nacional Galápagos, Pto. Ayora, Santa Cruz Island, Ecuador.
Eruption ends 30 October; some lava on NE flank, more on E caldera floor
Our last report (BGVN 30:09) described the first five days of this eruption, and was taken largely from a valuable joint report of Ecuador's Instituto Geofísico and Parque Nacional Galápagos. Here we report information from several sources on these topics: (a) initial observations of the eruption, (b) caldera-floor deformation prior to the eruption, (c) observations of the eruption's progress during 26 to 30 October (when it ended), and (d) satellite infrared observations of thermal fluxes associated with the eruption.
Eruption's start and subsequent plumes. As noted previously (BGVN 30:09), the eruption began around 1730 on 22 October 2005, when an explosion was heard by many residents of the volcano's S flank. Satellite images showed no activity at 1715, but revealed a large eruption at 1745 local time (2345 UTC). The eruption cloud reached an estimated altitude of at least 15 km (50,000 ft) and was moving SW.
At about this time, passengers and crew on Lindblad Expeditions' 80 passenger vessel M/N Polaris had an excellent view of the eruptive plume (figure 5). Lucho Verdesoto, the expedition leader, reported that the ship was then at Cerro Dragon, Santa Cruz island. Sunset was at 1753. As night fell they sailed to a position ~ 18 km NE of the volcano, where they had clear views of flows descending the volcano's upper NE flank (figure 6).
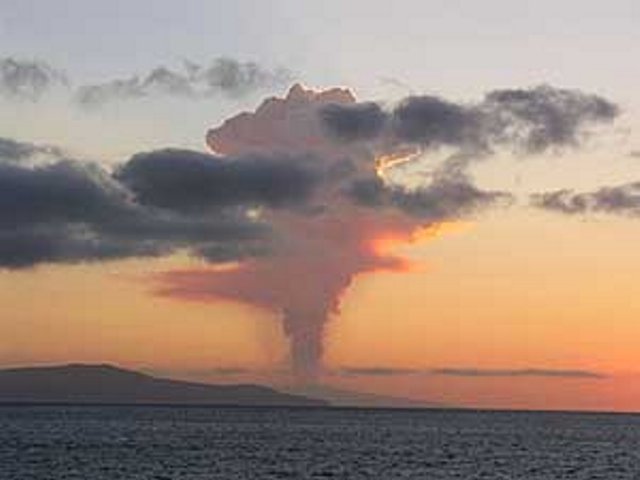 |
Figure 5. Early photo of the Sierra Negra plume from the cruise ship Polaris, anchored off NW Santa Cruz island around sunset on 22 October 2005. Courtesy of Lucho Verdesoto. |
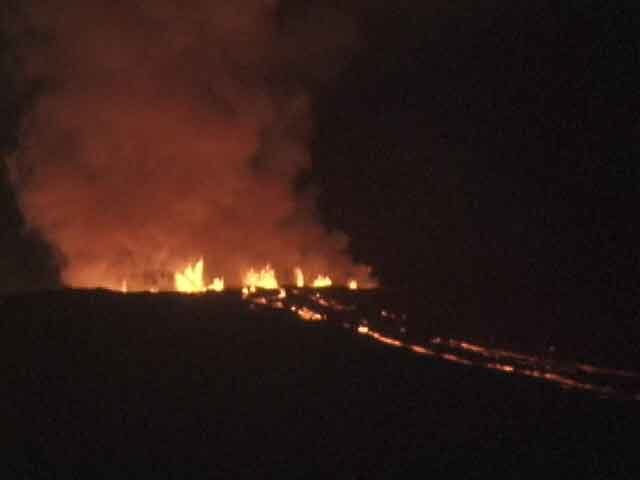 |
Figure 6. Lava spews skyward from circumferential fissure vents near the N rim of Sierra Negra caldera as flows descend the upper N flank. The photos were taken on 22 October, during the first few hours of the eruption, from the Polaris. Courtesy of Lucho Verdesoto. |
Naturalist Carman Guzman wrote, "After sunset the show was fascinating so we decided to move the Polaris to a much closer location. After dinner, we were only eleven miles from the eruption itself. What a thrill! The darkness of the night enhanced the beauty of the fiery reds and oranges that were seen at the top of the caldera. We spent several hours enjoying this rare and fantastic event. Rivers of lava were running down the slopes of the volcano and enormous flames were lighting up the sky."
According to NASA MODIS imagery and VAAC/NOAA reports, on 25 October 2005 a large plume of gases and steam was observed in GOES 12 imagery for 1545 local time (2145 UTC). The plume extended ~ 460 km W and SW of the summit at an altitude of ~ 4.6 km. Figure 7 shows the average concentration of SO2 over the Sierra Negra plume as imaged by NASA's Aura satellite for the period 23 October-1 November.
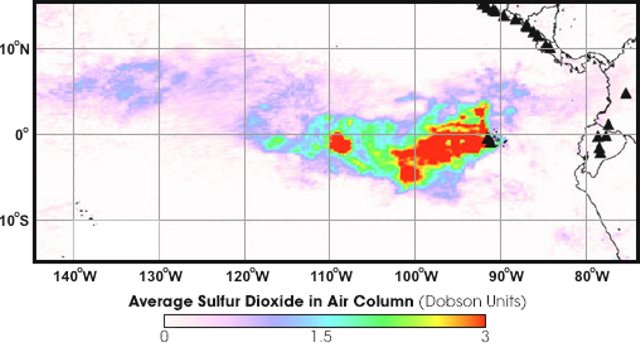 |
Figure 7. The average concentration of sulfur dioxide (SO2) over Sierra Negra from 23 October-1 November measured by the Ozone Monitoring Instrument (OMI) on NASA's Aura satellite. In agreement with reports from the ground, OMI stopped seeing measurable sulfur dioxide coming from the volcano on 31 October. The column abundances of SO2 appear on the associated key (in Dobson Units, DU, a product of concentration and pathlength that reflects the number of SO2 molecules in a unit area of the atmospheric column). Courtesy of NASA Earth Observatory/Natural Hazards website. |
Deformation monitoring. In the early stages of this eruption, Bill Chadwick (NOAA) submitted a report on pre-eruption deformation (figure 8). The plot shows both Synthetic Aperture Radar (InSAR) and GPS data on vertical deformation of the caldera floor. Chadwick wrote that he, Dennis Geist (University of Idaho), and Dan Johnson (University of Puget Sound, recently deceased) installed a 27 station GPS network at Sierra Negra in 2000, that was reoccupied in 2001 and 2002 (Geist and others, in press). With help from UNAVCO (a consortium supporting high-precision deformation measurements), the group then added a 6-station, continuous GPS network in 2002. Since then, there occurred a change from caldera subsidence to caldera uplift in March 2003. During this uplift, an M 4.6 earthquake on 16 April 2005 marked trapdoor faulting. The continuous GPS network measured a surface displacement of 85 cm within 10 seconds. Both this event and the previous case of trapdoor faulting in 1997-8-documented by satellite measurements using Interferometric Synthetic Aperture Radar (InSAR) (Amelung and others, 2000)-were preceded by over a meter of inflation (Jónsson and others, 2005). Both the 1997-98 and 2005 trapdoor movements occurred along the caldera floor's S side.
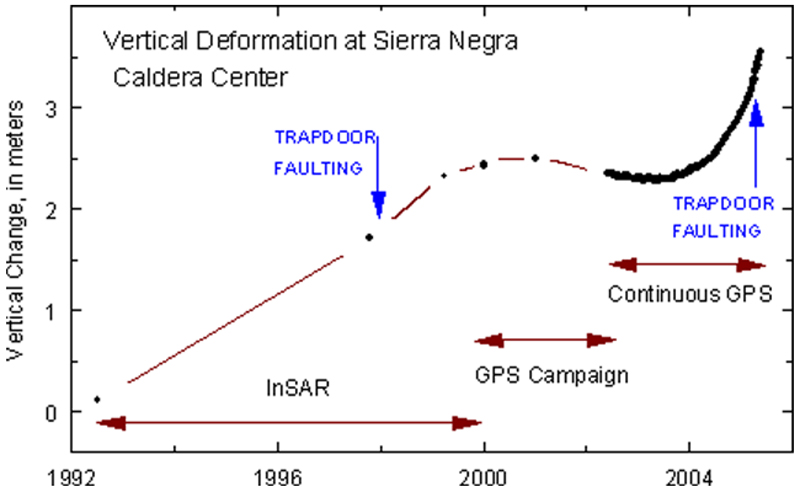 |
Figure 8. Recent history of uplift at the center of Sierra Negra's caldera. The data plotted are only through April 2005 when the trapdoor faulting event occurred. Although not plotted, GPS data since April has continued to indicate robust deformation. Courtesy Bill Chadwick, NOAA. |
Aside from its immediate affects, the April 2005 earthquake left the later inflation rate unchanged. Caldera-centered uplift has continued since then without pause at about the same high rate. During the interval from March 2002 to April 2005 there was about ~ 1.2 m of uplift. Rates after the April 2005 earthquake are not plotted but were roughly the same as those during the interval March 2002-April 2005. The only other large earthquakes at Sierra Negra in the last year were an M 4.0 on 23 February 2005, which was associated with a small (2 cm) displacement near the trapdoor fault, an M 4.6 on 19 September 2005 that caused no obvious displacements, and an M 5.5, just 3 hours before the 22 October eruption started. The GPS data has not yet been processed.
Field descriptions of the eruption. The eruption began on 22 October with venting along a 2-km fissure near the caldera's N rim (figure 6). The fissure descended the caldera's inner wall at its E end. Flows were fed both northward down the outer N flank and southward onto the NE caldera floor. Although flows reached 5 km down the outer flank, flow into the caldera soon dominated, with strong channels descending inner caldera slopes before combining to form a wide aa flow banked against the caldera's E wall and moving steadily southward (see figures and discussion, BGVN 30:09).
Figure 9 is a photo taken by Greg Estes on 24 October. It highlights the vigorous venting and intracaldera flows at that point in the eruption. Figure 10, a post-eruption satellite photo, illustrates the broad pattern of still-cooling, erupted lavas (which appear as light colored areas on this 2 November thermal-infrared image). Although this may represent the best overview of the new lavas at this time, some of the thinnest flows or chilled flow features may not appear on this image.
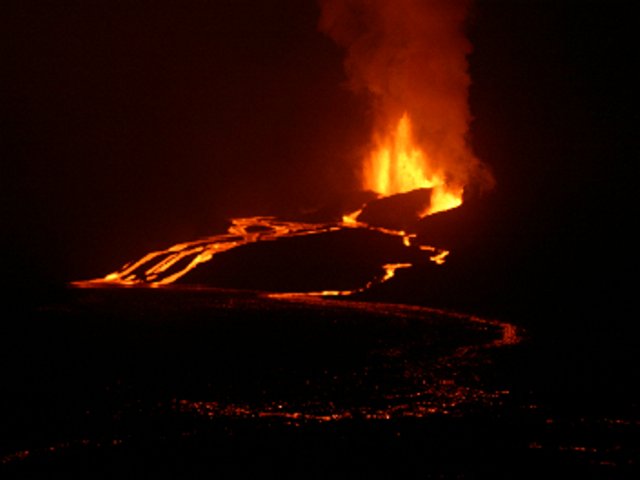 |
Figure 9. The Sierra Negra eruption setting as viewed from the E caldera rim. The fissure vent was vigorously emitting fountains, and there were several anastomosing lava flows pouring into the caldera. Photo was taken at night on 24 October 2005, day 3 of the eruption. The scattered glow in the foreground was due to ponded lava covering the caldera's E floor. Courtesy of Greg Estes (Galápagos resident and Park Guide). |
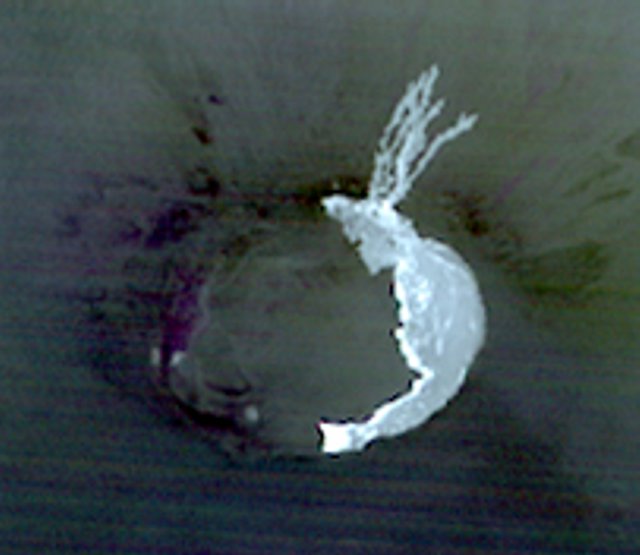 |
Figure 10. The Sierra Negra eruption setting as viewed from space in a false color ASTER (Advanced Spaceborne Thermal Emission and Reflection Radiometer) infrared image taken at night on 2 November, ~ 3 days after the eruption ended. N is towards the top. Caldera is 7 x 10.5 km across. Note the extra-caldera, N-flank lava flows, the lunate zone of ponded lavas along the E caldera. NASA image created by Jesse Allen, Earth Observatory, using data provided courtesy of Eric Fielding (NASA/JPL), the NASA/GSFC/METI/ERSDAC/JAROS, and U.S./Japan ASTER Science Team. |
By 26 October, fissure activity had narrowed to one major vent very near the N rim, but at 0830 on the 27th, eyewitness Godfrey Merlin reported that a second vent opened downslope and SE of the first. This new vent did not diminish the activity of the first, meaning that the total flux of erupting lava nearly doubled.
By about 1400 on the 27th, a team including Dennis Geist (University of Idaho), Terry Naumann (University of Alaska), and Karen Harpp (Colgate University) had arrived at the E caldera rim and began sending back a series of valuable reports. Their first report noted a major vent immediately below GPS station SN12 on the rim NE of the caldera's center. This vent emitted a large intracaldera aa flow.
Some active N-flank vents stood about 300-400 m NW of a station (GV01) on the caldera's N rim . There, two major vents fed lava fountains up to 50 m high. Most lava being erupted was flowing into the caldera, although some of the scoria from the fountains was falling outside the caldera and then forming a short, sluggish flow. Lava inside the caldera was cascading from the vents down the slope on the N edge of the caldera in 3 main channels, each 30-40 m across, with lava flowing at ~10 m/s (36 km/h) and in some cases over 10 m/s, and coalescing into a major aa flow to the S. On the caldera floor these channels merged into one big aa channel about 100 m wide that flowed more slowly both to the S, clockwise along the base of the E caldera wall, and into the moat along the S edge of the caldera floor. Pahoehoe outbreaks occurred along the margins of the major aa flow. New aa lava covered an estimated one-third of the caldera floor.
The report for 28 October noted that the eruption was still going strong. There were no significant new events on this day, but it appeared that the lava flux had increased because the vents looked wider and there seemed to be a lot more gas emitted. The lava continued to feed from the vents to the caldera floor in two large streams, each ~ 20 m across with lava traveling at 5-10 m/s, adding up to probably hundreds of millions of cubic meters of lava per day. The aa field continued to grow. The group reached the caldera floor and were able to sample both lava and tephra.
By 0700 on the 29th some of the vents had shut down and the two lava channels to the W (previously fed by the upper vent) stopped moving. The lower vent still emitted lava and fed one channel E of the others. The team estimated the channel to be ~10 m wide and moving ~5 m/s. Assuming a 2-m depth, the lava flux was 5 to 10 million cubic meters per day, about half that seen the morning of the 29th.
The emission rate continued to diminish throughout the 29th and by the evening it was only 10-20% of that seen on the 28th. In addition, the amount of gases emitted decreased such that the gas plume only rose ~1 km, whereas earlier plumes had risen to several kilometers. The lower vent was no longer fountaining continuously as it had on the 28th; instead the fountaining came in bursts at intervals of about 1-30 seconds. A lava lake sloshed around in the lower vent's crater; some lava escaped this crater along a breach in the crater rim. The upper vent (the one that shut off) was still incandescent with a lot of gas coming out, so it was possible that there was a lava lake there too.
The eruption appeared to end on the 30th. Glow was observed at 0200, but had ceased by 0400. The vents still emitted gas, but not fresh lava. However, it was possible that there was still N-flank activity. There were reports of lava flows there, and while it was certain that at least some of these flows were clastogenic (composed of spatter from fire fountains that accumulated and then began to flow), it was uncertain whether there were also actively erupting flank vents. The team remained separated from this area by hot lava, thwarting reconnaissance. Initial estimates of the coverage of the caldera floor were an area of ~14 km2. Assuming a 3-4 m average flow thickness, this was ~0.05 km3 (50,000,000 m3) of lava. There were obviously high error bars on this estimate, but it was clearly much less than the ~1 km3 extruded in the 1979 eruption.
MODVOLC Thermal Alerts. A large set of thermal hotspots in multispectral imagery was observed beginning late 22 October (local time and date) and continuing through 16 November 2005 (figure 11). Although MODVOLC data were missing for some days and reduced for others (presumably due to cloud cover screening the radiation from the satellite) these hot-spot pixels dramatically document the course of the eruption. Data on figure 11 appear consistent with in situ observations, in that by the second day, lava was at least 5 km down the outer N slope and covering much of the E caldera floor. By the 8th day (30 October), the outer slope flows had cooled significantly, but flows inside the caldera had continued their clockwise advance, filling all low points to the extreme SW corner of the caldera. Ten days later (9 November), the eruption had ended and only flows from the vents to the SE caldera floor were still emitting detectable heat. The last pixels observed, two above the original vent area on the N rim, were on 16 November.
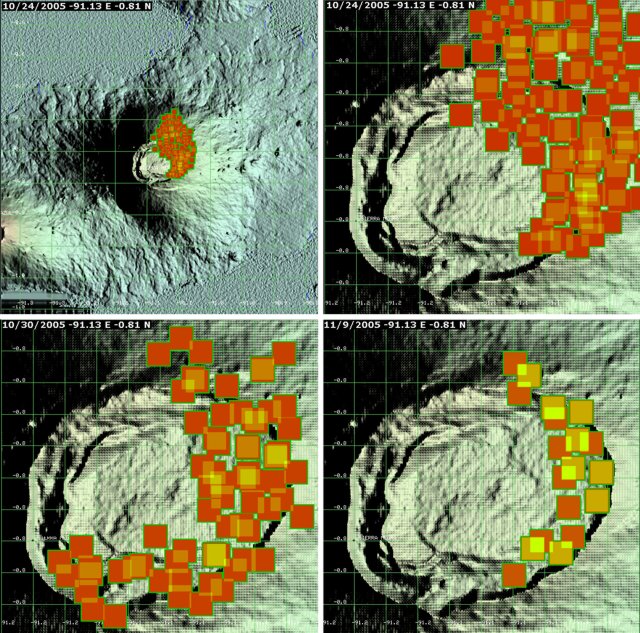 |
Figure 11. Selected images of MODVOLC thermal anomalies for Sierra Negra measured from satellite (MODIS) data at three days during and after the 2005 eruption. Part A presents an overview of the region (smaller scale than the other images) on 24 October. Parts B-D give a zoom-in on the 7 x 10.5 km caldera. Part B represents 24 October; Part C, 30 October; and part D, 9 November 2005. Since the eruption ended 30 October, the latter two images must thus portray the post-eruptive thermal inertial of the cooling lavas. Courtesy of Hawai`i Institute of Geophysics and Planetology, University of Hawai`i. |
References. Amelung, F., Jónsson, S., Zebker, H., and Segall, P., 2000, Widespread uplift and 'trapdoor' faulting on Galápagos volcanoes observed with radar interferometry: Nature, v. 407, p. 993-996.
Geist, D.J., Chadwick, W.W., Jr., and Johnson, D.J., in press, Results from new GPS monitoring networks at Fernandina and Sierra Negra volcanoes, Galápagos, 2000-2002: Journal of Volcanology and Geothermal Research (in press).
Jónsson, S., H. Zebker, and F. Amelung, 2005, On trapdoor faulting at Sierra Negra volcano, Galápagos; Journal of Volcanology and Geothermal Research, v. 144, p. 59-71.
Information Contacts: Lucho Verdesoto and Carman Guzman, M/NPolaris, Galápagos Islands, Ecuador; Francisco Dousdebes, Galápagos Expedition Manager, Metropolitan Touring, Ecuador; Lindblad Expeditions (URL: http://www.expeditions.com/); U.S. National Aeronautical and Space Administration (NASA) (URL: http://earthobservatory.nasa.gov/); Bill Chadwick, Cooperative Institute for Marine Resources Studies (CIMRS), National Oceanic and Atmospheric Agency (NOAA) Pacific Marine Environmental Laboratory (PMEL), Oregon State University, 2115 SE OSU Drive, Newport, OR 97365, USA; Dennis Geist, Department of Geological Sciences, University of Idaho, Moscow, ID 83844-3022 USA; Terry Naumann, Department of Geology, University of Alaska at Anchorage, Anchorage, AK 99598, USA (URL: https://www.uaa.alaska.edu/academics/college-of-arts-and-sciences/departments/geology/); Karen Harpp, Department of Geology, Colgate University, 408 Lathrop Hall, Hamilton, NY 13346, USA (URL: http://www.colgate.edu/facultysearch/FacultyDirectory/karen-harpp); MODVOLC Alerts Team, Hawaii Institute of Geophysics and Planetology (HIGP), University of Hawaii at Manoa, 1680 East-West Road, Post 602, Honolulu, HI 96822, USA (URL: http://modis.higp.hawaii.edu/).
Fissure opens on NNE caldera rim 26 June 2018, NW-flank lava flows reach the sea
Sierra Negra shield volcano on the Galápagos Island of Isabela has erupted six times since 1948, most recently in 2005. The eruptions of 2005, 1979, 1963, and 1953 were located in the area known as 'Volcán Chico' near the NNE rim of the summit caldera, which extends about 9 km E-W and 7 km N-S (figure 12). The lava flows generated in these eruptions were directed mainly towards the N and NE flanks of Sierra Negra, in some cases reaching Elizabeth Bay to the N and in others filling the interior of the caldera (figure 13). A new effusive eruption that occurred from 26 June through August 2018 is covered in this report with information provided primarily by Instituto Geofísico, Escuela Politécnica Nacional (IG-EPN). Additional information comes from the Washington Volcanic Ash Advisory Center (VAAC), and several sources of satellite information.
|
Figure 12. Sierra Negra is located on the southern part of Isabela Island in the Galápagos National Park, Ecuador. Courtesy of IG (Informe Especial Nº 2, Volcán Sierra Negra- Islas Galápagos: Descripción del estado de agitación interna y posibles escenarios eruptivos, 12 January 2018). |
|
Figure 13. The Sierra Negra caldera with the locations of GPS stations and the fissures, vents, and flows from the 2005 eruption. From Geist et al. (2005), courtesy of IG (Informe Especial Nº 2, Volcán Sierra Negra- Islas Galápagos: Descripción del estado de agitación interna y posibles escenarios eruptivos, 12 January 2018). |
Beginning in 2017, the Geophysical Institute of the National Polytechnic School (IGEPN) installed a surveillance network of six broadband seismic stations for the Galápagos volcanoes. One station is located on the NE edge of the Sierra Negra caldera and another on the SE flank. After 12 years of little activity, an increase in seismicity beneath and around the caldera became evident by July 2017 (figure 14). On 19 October 2017 (local time) the seismic monitors detected a 16-km-deep M 3.8 earthquake with an epicenter on the NE border of the caldera in the vicinity of Volcán Chico. Four additional similar earthquakes occurred within the next hour. Another earthquake of similar size occurred on 22 October; between 15 and 16 November, three earthquakes with M 3.0 or greater were recorded. The frequency of seismic activity increased significantly in December 2017, with over 550 events recorded during the first three weeks of December 2017; at least three had magnitudes greater than 3. GPS receivers showed uplift of the caldera floor of 80 cm between 2013 and 2017. InSAR interferometry data indicated substantial inflation of the caldera floor of about 70 cm between December 2016 and late November 2017, reaching a level higher than that which preceded the eruption of 2005 (figure 15).
|
Figure 14. The number of daily seismic events at Sierra Negra between 13 May 2015 and 23 November 2017 show a distinct increase in activity by July 2017. The colors represent different types of earthquakes; red is VT or volcanotectonic, orange is LP or Long Period, and blue is HB or Hybrid. Courtesy of IG (Informe Especial Sierra Negra N.- 2, Actividad reciente del volcán Sierra Negra – Isla Isabela, 23 November 2017). |
|
Figure 15. Inflation of the caldera floor at Sierra Negra between December 2016 and November 2017 exceeded 70 cm. The left graph shows the displacement plotted in centimeters versus time, and the right image is the spatial deformation from the InSAR data showing inflation at the caldera (center) and on the SW coast of Isla Isabela. Figures courtesy of Falk Amelung (RSMAS) and IG (Informe Especial Sierra Negra N.- 2, Actividad reciente del volcán Sierra Negra – Isla Isabela, 23 November 2017). |
By early January 2018, inflation over the preceding 12 months was close to 1 m, with a total inflation exceeding that prior to the 2005 eruption. Seismic activity, focused on two fracture zones trending NE-SW across the summit caldera, continued to increase until 26 June 2018 when a fissure opened near Volcán Chico on the NNE caldera rim. Over the next 24 hours four fissures opened on the N rim and the NW flank. Three of the fissures were active only for this period, but the fourth, on the NW flank about 7 km below the caldera rim, continued to effuse lava for all of July and most of August 2018. Lava flows reached the sea in early July. Several pulses of increased effusive activity corresponded with increased seismic, thermal, and gas-emission activity recorded by both ground-based and satellite instrumentation. By the last week of August active flows were no longer observed, although the cooling flows continued to emit thermal signals for several weeks.
Activity during January-early June 2018. Elevated seismicity continued into 2018 with a M 3.8 event recorded on 6 January 2018 that was felt by tourists, guides, and Galápagos National Park officials. Tens of additional smaller events continued throughout the month, reaching more than 100 seismic events per day a few times; the earthquakes were located below the caldera at a depth of less than 8 km. A M 4.1 event on 10 January was located at a depth of 7 km. By 12 January, the total inflation of the caldera since the beginning of 2017 was 98 cm (figure 16).
|
Figure 16. Seismicity and deformation at Sierra Negra between 13 May 2015 and 28 December 2017. The orange line represents the cumulative VT earthquakes, and the blue points record the inflation in cm of the floor accumulated since the beginning of 2015. A change in slope of both curves is evident at the end of 2017 indicating the rate of increase of inflation and seismicity. Courtesy of IG (Informe Especial Nº 2, Volcán Sierra Negra- Islas Galápagos: Descripción del estado de agitación interna y posibles escenarios eruptivos, 12 January 2018). |
IG reported 14 seismic events with magnitudes ranging from 3.0-4.6 between 1 January and 19 March 2018. A M 4.4 event on 18 January was located less than 1 km below the surface with an epicenter on the S rim of the caldera. A M 4.1 event on 27 February was also located less than 1 km below the surface. A M 4.6 event on 14 March was the largest to date at Sierra Negra and was located only 0.3 km below the surface. Measurements of CO2, SO2, and H2S made at the Azufral fumarole field (figure 17) on the W rim of the caldera in early February did not have values significantly different compared to May 2014 and September 2017. With the continued increase in frequency and magnitude of shallow seismic activity, IG noted the increased risk of renewed eruptive activity, and noted that most of the active flows of the last 1,000 years were located on the N flank (figure 18).
|
Figure 17. A fumarole field near Azufral on the W rim of the Sierra Negra caldera on 6 February 2018 remained unchanged after several months of increased seismicity in the area. Photo by M. Almeida, courtesy of IG-EPN (Informe Especial del Volcán Sierra Negra (Islas Galápagos) -2018 - Nº 3, Actualizado del estado de agitación interna y posibles escenarios eruptivos, 19 March 2018). |
|
Figure 18. Simplified geologic map of Sierra Negra with lava flows colored as a function of relative age (modified from Reynolds et al., 1995), courtesy of IG (Informe Especial del Volcán Sierra Negra (Islas Galápagos) -2018 - Nº 3, Actualizado del estado de agitación interna y posibles escenarios eruptivos, 19 March 2018). |
Increases in seismicity continued into early June. IG noted that on 25 May 2018, 104 seismic events were recorded, the largest number in a single day since 2015. A M 4.8 event on 8 June was accompanied by over 40 other smaller earthquakes. The earthquake epicenters were mainly located on the edges of the crater in two NE-SW trending lineaments; the first covered the N and W edges of the crater and the second trended from the NE edge to the S edge. Deformation data indicated the largest displacements were at the caldera's center, compared with lower levels of deformation outside of the caldera.
Eruption of 26 June-late August 2018. IG reported an increase in seismicity and a M 4.2 earthquake on 22 June 2018. A larger M 5.3 earthquake was detected at 0315 on 26 June, 5.3 km below the caldera. The event was felt strongly on the upper flanks and in Puerto Villamil (23 km SE). About 8 hours later, at 1117, an earthquake swarm characterized by events located at 3-5 km depth was recorded. A M 4.2 earthquake took place at 1338 and was followed by increasing amplitudes of seismic and infrasound signals. Parque Nacional Galápagos staff then reported noises described as bellows coming from the Volcán Chico fissure vent, which, coupled with the seismicity and infrasound data, suggested the start of an eruption. About 20 minutes later IG described a thermal anomaly identified in satellite images in the N area of the caldera near Volcán Chico and Park staff observed lava flowing towards the crater's interior as well as towards the N flank in the direction of Elizabeth Bay (figure 19).
|
Figure 19. Lava flows descended from the N flank of Sierra Negra to Elizabeth Bay on 26 June 2018 from four distinct fissure vents (numbered). Fissure 1 was located near Volcan Chico on the caldera rim, and fissures 2, 3, and 4 were located on the N flank. Details of the fissures are discussed later in the report. Video of the flow was captured by Nature Galápagos. Photo courtesy of AFP and BBC News, annotated and reprinted by IG (Informe Especial N° 16 – 2018, Volcán Sierra Negra, Islas Galápagos, Actualización de la Actividad Eruptiva, Quito, 23 de Julio del 2018). |
The Washington VAAC reported an ash plume visible in satellite imagery late on 26 June at 10.6 km altitude drifting SW. By the following morning, a plume of ash mixed with SO2 was drifting W at 8.2 km altitude. IG reported a new ash emission late on 27 June drifting NW at 6.1 km altitude. A substantial SO2 plume emerged on 27 June and was recorded by the OMI and OMPS satellite-based instruments drifting SW that day and the next (figure 20). The MODVOLC thermal alert system confirmed the beginning of the eruption with over 100 alert pixels recorded on 27 June and over 50 the following day. The MIROVA system recorded an abrupt, very high thermal signal beginning on 26 June (figure 21). Seismic and acoustic data indicated a gradual decrease of activity after the initial outburst, but effusive lava flows continued on 27 June.
|
Figure 20. A large plume of SO2 was emitted from Sierra Negra on 27 June 2018 at the beginning of the latest eruptive episode. It drifted SW the following day, as seen in these images captured by the OMPS instrument on the Suomi NPP satellite. Courtesy of NASA Goddard Space Flight Center. |
|
Figure 21. The MIROVA project graph of thermal energy at Sierra Negra from 31 January 2018 through September 2108 shows the start of the lava flows on 27 June 2018 (UTC). Pulses of high thermal energy continued through late August when flow activity ceased; cooling of the flows continued into September 2018. Courtesy of MIROVA. |
During 27 and 28 June, IG scientists were able to make a site visit to capture thermal, photographic, and physical evidence of the new lava flows (figure 22). A composite thermal image showed the extent of flows that traveled down the N flank as well as into the caldera (figure 23). A temperature of 580°C was measured near the eruptive fissure, and the surface temperatures averaged about 60°C, although some flows were measured as high as 200°C. The temperature inside a fracture on a lava flow was measured at 975°C (figure 24). Pelée hair and "spatter" bombs were visible around the eruptive fissures.
|
Figure 22. The lava flows of 26 June 2018 at Sierra Negra emerged from a fissure on the N flank of the caldera rim and other fissures on the N flank and flowed N. N is to the right. Photo by Benjamin Bernard, courtesy of IG (Volcán Sierra Negra, Informe de campo 27-28 junio2018, Termografía, Cartografía, y muestreo de los nuevos flujos de lava, sector de Volcán Chico). |
|
Figure 23. Composite thermal images of the new lava flows at Sierra Negra taken on 27 June 2018 reveal the flows that emerged from the Volcán Chico fissure zone; most flows traveled N down the flank, a few (on the left) traveled down into the caldera. Images by Silvia Vallejo, courtesy of IGEPN (Volcán Sierra Negra, Informe de campo 27-28 junio2018, Termografía, Cartografía, y muestreo de los nuevos flujos de lava, sector de Volcán Chico). |
|
Figure 24. The temperature of incandescent lava within a fresh flow at Sierra Negra was measured at 975°C on 27 June 2018. Left image by Francisco Vásconez; thermal image by Silvia Vallejo, courtesy of IGEPN (Volcán Sierra Negra, Informe de campo 27-28 junio2018, Termografía, Cartografía, y muestreo de los nuevos flujos de lava, sector de Volcán Chico). |
Pahoehoe and aa flows along with lava tunnels were visible in drone images. The visible fissures were slightly arcuate and aligned in a general ENE direction, similar to the fissures of 1979 and 2005 in the vicinity of Volcán Chico. The largest flow was more than 150 m long; they reached up to 130 m wide in the flat areas, but only between 25 and 35 m wide where they were channeled on the steeper slope. In the flatter areas they had characteristics of pahoehoe with a smooth surface, a sometimes rounded texture and lava tunnels (figure 25), while in the channelized areas with a steeper slope they had a rougher surface and were characterized as aa (figure 26). The flows averaged 0.5-1 m thick and in several places the lava filled fissures or previous depressions. The samples of pahoehoe that were collected were all aphanitic with no crystals, strongly iridescent, and vesiculated with fluid textures that indicated a high gas content and low viscosity.
|
Figure 25. Pahoehoe flows, spatter, and a collapsing lava tunnel were visible near fissure 1 (above 'Spatter') at Sierra Negra when imaged by a drone during a field visit on 27-28 June 2018 shortly after the new eruptive episode began. This image covers the area near the top center of the image in figure 22 close to the fissure. Photos were taken by a drone flying 60 m above the flows by Benjamin Bernard, courtesy IGEPN (Volcán Sierra Negra, Informe de campo 27-28 junio2018, Termografía, Cartografía, y muestreo de los nuevos flujos de lava, sector de Volcán Chico). |
|
Figure 26. Aa flows formed as lava traveled down the steeper parts of the N flank of Sierra Negra on 26 June 2018, seen in this drone image taken during a field visit on 27-28 June. This image general location can be seen in the bottom right area in figure 22. Photos were taken by a drone flying 60 m above the flows by Benjamin Bernard, courtesy IGEPN (Volcán Sierra Negra, Informe de campo 27-28 junio2018, Termografía, Cartografía, y muestreo de los nuevos flujos de lava, sector de Volcán Chico). |
A small seismic event followed by several hours of tremor was recorded at 1552 on 1 July; a short while later National Park staff observed active lava flows on the NW flank. On 4 July, IG reported a M 5.2 earthquake that was 5 km deep; it was followed by 68 smaller seismic events. On 7 July seismic tremor activity indicating another pulse of magmatic activity was recorded by a station on the NE edge of the caldera at 1700. At the same time, satellite data showed an increase in the intensity of the thermal anomaly on the NW flank; Parque Nacional Galápagos staff confirmed strong visible incandescence in an area near the beach. Tremor activity continued on 8 July, although the amplitude gradually decreased.
The Washington VAAC reported an ash plume visible in satellite imagery on 2 July at 6.1 km altitude drifting SW. Later in the day a concentrated plume interpreted to be primarily steam and gas extended about 260 km SW. On 8 July ash could be seen moving both W and SW in satellite imagery at 2.7-3.0 km altitude. Later that day ash was visible extending about 115 km SW from the summit and other gases extended 370 km W. That evening the ash plume extended about 190 km SW at 3.7 km altitude. Gas-and-ash plumes were observed continuously drifting SW for the next three days (9-11 July) at 3.7 km altitude to a distance of about 80 km. On 13 July, two areas of ash and gas were seen in satellite imagery moving 25 km NW from the summit and up to 45 km SW at altitudes of 3.9 and 2.4 km respectively. A low-level ash plume on 16 July extended 30 km SW from the summit at 2.4 km altitude; incandescence was also visible in the webcam. The next day ash and gas emissions extended about 120 km SW at a similar altitude. Ongoing steam, gas, and ash emissions were seen in satellite imagery and in the webcam extending 110 km NW from the summit on 19 July at 3.4 km altitude. The Washington VAAC reported an ash plume on 30 July that rose to 3.4 km altitude and drifted SW. Strong SO2 emissions were recorded by both the OMPS and OMI satellite instruments throughout July 2018 (figure 27).
|
Figure 27. SO2 plumes from Sierra Negra exceeded 2 Dobson Units (DU) nearly every day during July 2018. Data gathered by the OMPS satellite instrument showed a large plume drifting SW on 2 July (top left), and a more narrow stream of SO2 drifting SW on 3 July (top right). The OMI satellite instrument captured large W-drifting plumes on 12 (bottom left) and 14 (bottom right) July. Courtesy of NASA Goddard Space Flight Center. |
In a report issued by IGEPN covering activity through 23 July 2018, they noted that at least four fissures had initially opened on 26 June at the start of the eruption (see numbers in figure 19 at the beginning of this report, and figure 31 at the end). Fissure 1, the longest at 4 km, was located at the edge of the caldera in the area of Volcán Chico; lava flows from this fissure traveled 7 km down the flanks, and over 1 km within the interior of the caldera. NW-flank fissures 2, 3, and 4 were much smaller (about 250 m long). Fissures 1-3 were active only until 27 June; fissure 4 continued to be active throughout July. Lava from this fissure reached the ocean on 6 July.
Gas and possible volcanic ash extended 35 km SW of the summit on 4 August at 1.5 km altitude; this was the last report of an ash plume by the Washington VAAC for the eruption. Daily reports from IGEPN indicated that nightly incandescence from advancing flows continued into August. Occasional low-level steam and gas plumes were also visible. Pulses of lava effusion on 4 and 9 August were accompanied by major episodes of seismic tremor activity and substantial SO2 plumes (figure 28). On 15 August satellite images showed lava from fissure 4 continuing to enter the ocean. The area where the lavas entered the sea were far from any human population or agricultural activities and only accessible by boats.
|
Figure 28. At Sierra Negra, large SO2 plumes were recorded by the OMPS instrument on the Suomi NPP satellite at the same time that an increase in seismic activity and effusion were noted on both 4 (left) and 9 (right) August 2018. Courtesy of NASA Goddard Space Flight Center. |
Throughout the ongoing eruption, pulses of thermal activity detected by MODIS infrared satellite sensors correlated with increases in seismic activity and observed flow activity. The MIROVA plot showed a high level of heat flow from the onset of the eruption on 26 June gradually decreasing in intensity through mid-August (figure 21). This was followed by a significant drop in heat flow and gradual cooling thereafter. After the initial fissure activity near the crater rim on 26-27 June, all subsequent activity was concentrated farther down the N flank at fissure 4 and is reflected in the number of pixels concentrated in that area of the MODVOLC plot of thermal alerts from June-September 2018 (figure 29).
|
Figure 29. MODVOLC thermal alert locations corresponded to the locations of the observed flow activity at Sierra Negra, showing the sustained thermal activity from the mid-flank fissure 4 that lasted from late June through mid-September 2018. Courtesy of HIGP - MODVOLC Thermal Alerts System . |
The number of seismic events recorded during the eruptive episode had increased between 26 June and 30 July 2018 to an average of 265 per day. The peak was recorded on 29 June with 940 earthquakes. Between 31 July and 23 August, the average number was 121 per day, still higher than the level of 38 per day prior to the beginning of the eruption on 26 June. IG reported a continuous decline in activity during the last two weeks of August 2018. After the initial burst of effusive activity during 26-27 June, five additional pulses of increased thermal, seismic, and gas-emission activity were observed in multiple sources of data on 1-2, 7-8, and 31 July, and 4 and 9 August (figure 30).
|
Figure 30. Multiple parameters of data from the eruption of Sierra Negra from 21 June to 30 August 2018. The dashed green line marks the start of the eruption, while the pale green vertical bars indicate the different eruptive pulses recorded throughout the eruption. a) Seismic energy data (RSAM) recorded by station VCH1, in a window between 1-8 Hz (location shown in figure 31); b) Time series of degassing of SO2 recorded by the OMI and OMPS satellites instruments; c) thermal anomalies recorded by MODVOLC. Courtesy of IGEPN (Informe Especial N°18 – 2018, Volcán Sierra Negra, Islas Galápagos, "Terminación de episodio ruptive actual", Quito, 31 de Agosto del 2018), also published in Vasconez et al (2018). |
In a summary report on 31 August 2018, IG reported that the eruption was divided into two main phases. The first and most energetic phase lasted one day (26 June) and was characterized by the opening of five fissures (table 2) located on the rim and N and NW flanks, and creation of lava flows that traveled as far as 7 km from the vents (figure 31). Lava was only active from all five fissures during the first day of the eruption, covering an area greater than 17 km2. During the rest of the eruption from 27 June-23 August, about 13 km2 of lava was produced from fissure 4, with lava reaching the sea on 6 July and expanding the coastline by 1.5 km2. Detailed descriptions of the fissures provided by IGEPN are given in the following section. By 25 August the lava flows covered an area of 30.6 square kilometers. Activity continued to decline the last week of August with decreased seismicity, gas emission, and no surficial activity visible.
|
Figure 31. Map of the 26 June-August 2018 eruption of Sierra Negra volcano. The eruptive fissures are numbers and shown in yellow and described in detail in the next section. The coastline with Elizabeth Bay is shown in blue, and the lava flows appear in red. The green points include GPS and seismic stations, the epicenter of the earthquake of 5.3 MLV on 26 June, El Cura (control station of the Galápagos National Park) and the panoramic vista visited by tourists. Courtesy of IGEPN (Informe Especial N°18 – 2018, Volcán Sierra Negra, Islas Galápagos, "Terminación de episodio ruptive actual", Quito, 31 de Agosto del 2018), also published in Vasconez et al (2018). |
Table 2. Descriptions of the five fissures active during the June-August 2018 eruption of Sierra Negra (see figure 31 for locations). Courtesy of IGEPN (Informe Especial N°18 – 2018, Volcán Sierra Negra, Islas Galápagos, "Terminación de episodio ruptive actual", Quito, 31 de Agosto del 2018)
| Feature | Location | Description |
| Fissure 1 | Edge of the caldera in the Volcán Chico area, trending WNW, tangential to the edge of the caldera. | Four kilometers in length with lava flows that moved toward both the interior of the caldera and down the flank from the beginning of the eruption until 27 June, covering an area of 14.6 km2. The flows deposited outside the crater traveled 7 km downhill, without reaching the sea, while those inside it reached a maximum distance of 1.1 km. |
| Fissure 2 | NW of the caldera about 3 km below its edge of the caldera at an elevation of 700 m. | Approximately 250 m long and produced 4-km-long lava flows from the beginning of the eruption until 27 June, covering an area of 2.2 km2; its lava did not reach the sea. |
| Fissure 3 | WNW of the caldera about 4 km below its edge at an elevation of 550 m. | Approximately 250 m long and active from the beginning of the eruption until 27 June, emitting lava flows that covered an area of about 0.4 km2. The lava flows had a length of about 2 km and did not reach the sea. |
| Fissure 4 | NW flank at an elevation of 100 m between 7 and 8 km below the rim of the caldera. | Continuously emitting lava flows throughout the eruption. It was located on the On 6 July the lava flows from this fissure reached the ocean and modified the coastline of Isla Isabela by 1.5 km2. By 25 August when active flow ceased, its lavas had covered an area of approximately 13.3 km2. |
| Fissure 5 | Western flank at an elevation of 840 m, 1.5 km downhill from the inner edge of the caldera. | Length of 170 m and covered 0.026 km2. |
References: Davidge L, Ebinger C, Ruiz M, Tepp G, Amelung F, Geist D, Cote D, Anzieta J, 2017, Seismicity patterns during a period of inflation at Sierra Negra volcano, Galápagos Ocean Island Chain. Earth and Planetary Science Letters. 462. DOI: 10.1016/j.epsl.2016.12.021.
Geist D, Naumann T R, Standish J J, Kurz M D, Harpp K S, White W M , Fornari D, 2005, Wolf Volcano, Galapagos Archipelago: Melting and magmatic evolution at the margins of a mantle plume. Journal of Petrology 46:2197-2224.
Vasconez F, Ramón P, Hernandez S, Hidalgo S, Bernard B, Ruiz M, Alvarado A., La Femina P, Ruiz G, 2018, The different characteristics of the recent eruptions of Fernandina and Sierra Negra volcanoes (Galápagos, Ecuador), Volcanica 1(2): 127-133. DOI: 10.30909/vol.01.02.127133.
Information Contacts: Instituto Geofísico (IG), Escuela Politécnica Nacional, Casilla 17-01-2759, Quito, Ecuador (URL: http://www.igepn.edu.ec ); Washington Volcanic Ash Advisory Center (VAAC), Satellite Analysis Branch (SAB), NOAA/NESDIS OSPO, NOAA Science Center Room 401, 5200 Auth Rd, Camp Springs, MD 20746, USA (URL: www.ospo.noaa.gov/Products/atmosphere/vaac, archive at: http://www.ssd.noaa.gov/VAAC/archive.html); MIROVA (Middle InfraRed Observation of Volcanic Activity), a collaborative project between the Universities of Turin and Florence (Italy) supported by the Centre for Volcanic Risk of the Italian Civil Protection Department (URL: http://www.mirovaweb.it/); Hawai'i Institute of Geophysics and Planetology (HIGP) - MODVOLC Thermal Alerts System, School of Ocean and Earth Science and Technology (SOEST), Univ. of Hawai'i, 2525 Correa Road, Honolulu, HI 96822, USA (URL: http://modis.higp.hawaii.edu/); NASA Goddard Space Flight Center (NASA/GSFC), Global Sulfur Dioxide Monitoring Page, Atmospheric Chemistry and Dynamics Laboratory, 8800 Greenbelt Road, Goddard, Maryland, USA (URL: https://so2.gsfc.nasa.gov/); Nature Galápagos (Twitter: @natureGalápagos, https://twitter.com/natureGalápagos).
|
|
||||||||||||||||||||||||||
There is data available for 18 confirmed eruptive periods.
2018 Jun 26 - 2018 Aug 23 Confirmed Eruption (Explosive / Effusive) VEI: 2
| Episode 1 | Eruption (Explosive / Effusive) | Summit crater and NNW flank, Volcan Chico fissure vent | ||||||||||||||||||||||||||||||||||||||||||||||||||||||||||||||||||||||||||||||||||||||||||||||||||||||||||||||||||||||||||||||||||||||||||||||||||||||||||||||||||||||||||||||||||||||||||||||||||||||||||||||||||||||||||
|---|---|---|---|---|---|---|---|---|---|---|---|---|---|---|---|---|---|---|---|---|---|---|---|---|---|---|---|---|---|---|---|---|---|---|---|---|---|---|---|---|---|---|---|---|---|---|---|---|---|---|---|---|---|---|---|---|---|---|---|---|---|---|---|---|---|---|---|---|---|---|---|---|---|---|---|---|---|---|---|---|---|---|---|---|---|---|---|---|---|---|---|---|---|---|---|---|---|---|---|---|---|---|---|---|---|---|---|---|---|---|---|---|---|---|---|---|---|---|---|---|---|---|---|---|---|---|---|---|---|---|---|---|---|---|---|---|---|---|---|---|---|---|---|---|---|---|---|---|---|---|---|---|---|---|---|---|---|---|---|---|---|---|---|---|---|---|---|---|---|---|---|---|---|---|---|---|---|---|---|---|---|---|---|---|---|---|---|---|---|---|---|---|---|---|---|---|---|---|---|---|---|---|---|---|---|---|---|---|---|---|---|---|---|---|---|---|---|---|---|
| 2018 Jun 26 - 2018 Aug 23 | Evidence from Observations: Reported | ||||||||||||||||||||||||||||||||||||||||||||||||||||||||||||||||||||||||||||||||||||||||||||||||||||||||||||||||||||||||||||||||||||||||||||||||||||||||||||||||||||||||||||||||||||||||||||||||||||||||||||||||||||||||||
|
List of 42 Events for Episode 1 at Summit crater and NNW flank, Volcan Chico fissure vent
|
|||||||||||||||||||||||||||||||||||||||||||||||||||||||||||||||||||||||||||||||||||||||||||||||||||||||||||||||||||||||||||||||||||||||||||||||||||||||||||||||||||||||||||||||||||||||||||||||||||||||||||||||||||||||||||
2005 Oct 22 - 2005 Oct 30 Confirmed Eruption (Explosive / Effusive) VEI: 3
| Episode 1 | Eruption (Explosive / Effusive) | North caldera rim | |||||||||||||||||||||||||||||||||||||||||||||||||||||||||||||||
|---|---|---|---|---|---|---|---|---|---|---|---|---|---|---|---|---|---|---|---|---|---|---|---|---|---|---|---|---|---|---|---|---|---|---|---|---|---|---|---|---|---|---|---|---|---|---|---|---|---|---|---|---|---|---|---|---|---|---|---|---|---|---|---|---|
| 2005 Oct 22 - 2005 Oct 30 | Evidence from Observations: Reported | |||||||||||||||||||||||||||||||||||||||||||||||||||||||||||||||
|
List of 11 Events for Episode 1 at North caldera rim
|
||||||||||||||||||||||||||||||||||||||||||||||||||||||||||||||||
1979 Nov 13 - 1980 Jan 14 (on or after) Confirmed Eruption (Explosive / Effusive) VEI: 3
| Episode 1 | Eruption (Explosive / Effusive) | Upper NW and NE flanks (Volcán Chico) | ||||||||||||||||||||||||||||||||||||||||||||||||||||||||||||||||||||
|---|---|---|---|---|---|---|---|---|---|---|---|---|---|---|---|---|---|---|---|---|---|---|---|---|---|---|---|---|---|---|---|---|---|---|---|---|---|---|---|---|---|---|---|---|---|---|---|---|---|---|---|---|---|---|---|---|---|---|---|---|---|---|---|---|---|---|---|---|---|
| 1979 Nov 13 - 1980 Jan 14 (on or after) | Evidence from Observations: Reported | ||||||||||||||||||||||||||||||||||||||||||||||||||||||||||||||||||||
|
List of 12 Events for Episode 1 at Upper NW and NE flanks (Volcán Chico)
|
|||||||||||||||||||||||||||||||||||||||||||||||||||||||||||||||||||||
1963 Apr 13 - 1963 May 16 ± 15 days Confirmed Eruption (Explosive / Effusive) VEI: 2
| Episode 1 | Eruption (Explosive / Effusive) | Volcán Chico area & NW caldera rim | ||||||||||||||||||||||||||||||||||||||||||||||||||||||||||||||||||||
|---|---|---|---|---|---|---|---|---|---|---|---|---|---|---|---|---|---|---|---|---|---|---|---|---|---|---|---|---|---|---|---|---|---|---|---|---|---|---|---|---|---|---|---|---|---|---|---|---|---|---|---|---|---|---|---|---|---|---|---|---|---|---|---|---|---|---|---|---|---|
| 1963 Apr 13 - 1963 May 16 ± 15 days | Evidence from Observations: Reported | ||||||||||||||||||||||||||||||||||||||||||||||||||||||||||||||||||||
|
List of 12 Events for Episode 1 at Volcán Chico area & NW caldera rim
|
|||||||||||||||||||||||||||||||||||||||||||||||||||||||||||||||||||||
1957 Jul 2 ± 182 days Confirmed Eruption (Explosive / Effusive)
| Episode 1 | Eruption (Explosive / Effusive) | Volcano Uncertain: Isabela Island | |||
|---|---|---|---|---|
| 1957 Jul 2 ± 182 days - Unknown | Evidence from Unknown | |||
1954 Nov 9 Confirmed Eruption (Explosive / Effusive) VEI: 2
| Episode 1 | Eruption (Explosive / Effusive) | Volcano Uncertain: originally Alcedo | ||||||||||||||||||||||||||||
|---|---|---|---|---|---|---|---|---|---|---|---|---|---|---|---|---|---|---|---|---|---|---|---|---|---|---|---|---|---|
| 1954 Nov 9 - Unknown | Evidence from Unknown | ||||||||||||||||||||||||||||
|
List of 4 Events for Episode 1 at Volcano Uncertain: originally Alcedo
|
|||||||||||||||||||||||||||||
1953 Aug 27 - 1954 Jan 16 ± 15 days Confirmed Eruption (Explosive / Effusive) VEI: 3 (?)
| Episode 1 | Eruption (Explosive / Effusive) | Volcán Chico area & NW caldera rim | |||||||||||||||||||||||||||||||||||||||||||
|---|---|---|---|---|---|---|---|---|---|---|---|---|---|---|---|---|---|---|---|---|---|---|---|---|---|---|---|---|---|---|---|---|---|---|---|---|---|---|---|---|---|---|---|---|
| 1953 Aug 27 - 1954 Jan 16 ± 15 days | Evidence from Observations: Reported | |||||||||||||||||||||||||||||||||||||||||||
|
List of 7 Events for Episode 1 at Volcán Chico area & NW caldera rim
|
||||||||||||||||||||||||||||||||||||||||||||
1948 Aug - 1949 Feb (?) Confirmed Eruption (Explosive / Effusive) VEI: 2
| Episode 1 | Eruption (Explosive / Effusive) | |||||||||||||||||||||||||||||
|---|---|---|---|---|---|---|---|---|---|---|---|---|---|---|---|---|---|---|---|---|---|---|---|---|---|---|---|---|---|
| 1948 Aug - 1949 Feb (?) | Evidence from Observations: Reported | ||||||||||||||||||||||||||||
|
List of 4 Events for Episode 1
|
|||||||||||||||||||||||||||||
1911 Dec 31 ± 365 days Confirmed Eruption (Explosive / Effusive)
| Episode 1 | Eruption (Explosive / Effusive) | ||||
|---|---|---|---|---|
| 1911 Dec 31 ± 365 days - Unknown | Evidence from Observations: Reported | |||
1860 Confirmed Eruption (Explosive / Effusive) VEI: 2
| Episode 1 | Eruption (Explosive / Effusive) | Volcano Uncertain: Isabela Island | ||||||||||||||||||
|---|---|---|---|---|---|---|---|---|---|---|---|---|---|---|---|---|---|---|---|
| 1860 - Unknown | Evidence from Unknown | ||||||||||||||||||
|
List of 2 Events for Episode 1 at Volcano Uncertain: Isabela Island
|
|||||||||||||||||||
1844 Confirmed Eruption (Explosive / Effusive) VEI: 0
| Episode 1 | Eruption (Explosive / Effusive) | Volcano Uncertain: Isabela Island | ||||||||||||||||||
|---|---|---|---|---|---|---|---|---|---|---|---|---|---|---|---|---|---|---|---|
| 1844 - Unknown | Evidence from Unknown | ||||||||||||||||||
|
List of 2 Events for Episode 1 at Volcano Uncertain: Isabela Island
|
|||||||||||||||||||
1817 Confirmed Eruption (Explosive / Effusive)
| Episode 1 | Eruption (Explosive / Effusive) | Volcano Uncertain: Isabela Island | |||
|---|---|---|---|---|
| 1817 - Unknown | Evidence from Unknown | |||
1813 Jul 13 Confirmed Eruption (Explosive / Effusive) VEI: 2 (?)
| Episode 1 | Eruption (Explosive / Effusive) | Volcano Uncertain: South end of Isabela Island | |||||||||||||||||||||||
|---|---|---|---|---|---|---|---|---|---|---|---|---|---|---|---|---|---|---|---|---|---|---|---|---|
| 1813 Jul 13 - Unknown | Evidence from Unknown | |||||||||||||||||||||||
|
List of 3 Events for Episode 1 at Volcano Uncertain: South end of Isabela Island
|
||||||||||||||||||||||||
1350 ± 500 years Confirmed Eruption (Explosive / Effusive) VEI: 0
| Episode 1 | Eruption (Explosive / Effusive) | |||||||||||||||||||
|---|---|---|---|---|---|---|---|---|---|---|---|---|---|---|---|---|---|---|---|
| 1350 ± 500 years - Unknown | Evidence from Isotopic: Cosmic Ray Exposure | ||||||||||||||||||
|
List of 2 Events for Episode 1
|
|||||||||||||||||||
1060 ± 500 years Confirmed Eruption (Explosive / Effusive) VEI: 0
| Episode 1 | Eruption (Explosive / Effusive) | |||||||||||||||||||
|---|---|---|---|---|---|---|---|---|---|---|---|---|---|---|---|---|---|---|---|
| 1060 ± 500 years - Unknown | Evidence from Isotopic: Cosmic Ray Exposure | ||||||||||||||||||
|
List of 2 Events for Episode 1
|
|||||||||||||||||||
0370 ± 1100 years Confirmed Eruption (Explosive / Effusive) VEI: 0
| Episode 1 | Eruption (Explosive / Effusive) | |||||||||||||||||||
|---|---|---|---|---|---|---|---|---|---|---|---|---|---|---|---|---|---|---|---|
| 0370 ± 1100 years - Unknown | Evidence from Isotopic: Cosmic Ray Exposure | ||||||||||||||||||
|
List of 2 Events for Episode 1
|
|||||||||||||||||||
1250 BCE ± 100 years Confirmed Eruption (Explosive / Effusive) VEI: 0
| Episode 1 | Eruption (Explosive / Effusive) | SE flank | ||||||||||||||||||
|---|---|---|---|---|---|---|---|---|---|---|---|---|---|---|---|---|---|---|---|
| 1250 BCE ± 100 years - Unknown | Evidence from Isotopic: 14C (uncalibrated) | ||||||||||||||||||
|
List of 2 Events for Episode 1 at SE flank
|
|||||||||||||||||||
8250 BCE ± 1600 years Confirmed Eruption (Explosive / Effusive) VEI: 0
| Episode 1 | Eruption (Explosive / Effusive) | |||||||||||||||||||
|---|---|---|---|---|---|---|---|---|---|---|---|---|---|---|---|---|---|---|---|
| 8250 BCE ± 1600 years - Unknown | Evidence from Isotopic: Cosmic Ray Exposure | ||||||||||||||||||
|
List of 2 Events for Episode 1
|
|||||||||||||||||||
This compilation of synonyms and subsidiary features may not be comprehensive. Features are organized into four major categories: Cones, Craters, Domes, and Thermal Features. Synonyms of features appear indented below the primary name. In some cases additional feature type, elevation, or location details are provided.
Synonyms |
||||
| Grande, Volcan | Santo Tomas, Volcan | ||||
Cones |
||||
| Feature Name | Feature Type | Elevation | Latitude | Longitude |
| Agua, Cerro | Pyroclastic cone | |||
| Ballena, Cerro | Tuff cone | |||
| Barahona, Cerro | Pyroclastic cone | |||
| Cazuel, Cerro | Pyroclastic cone | |||
| Muro de las Lagrimas | Pyroclastic cone | |||
| Pelado, Cerro | Pyroclastic cone | |||
| Pipon, Cerro | Pyroclastic cone | |||
| Quatro Hermanos, Los | Tuff cone | |||
| Tortuga, Isla | Tuff cone | |||
Craters |
||||
| Feature Name | Feature Type | Elevation | Latitude | Longitude |
| Chico, Volcán | Fissure vent | |||
Thermal |
||||
| Feature Name | Feature Type | Elevation | Latitude | Longitude |
| Azufre, Volcán de | Thermal | |||
| Mina Azufral | Thermal | |||
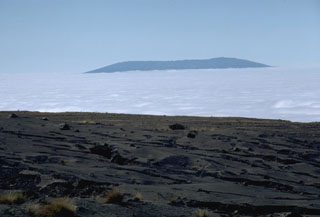 The broad shield volcano of Sierra Negra at the southern end of Isabela Island rises above a sea of clouds across from the tephra-mantled caldera rim of Fernandina volcano. Sierra Negra is the largest, but lowest-angle shield volcano on Isabela. The summit of the volcano contains a shallow 7 x 10.5 km caldera that is the largest of the Galápagos Islands. Sierra Negra is one of the most active of the Isabela Island volcanoes.
 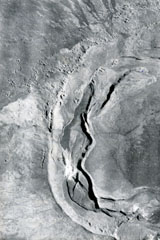 A dramatic sinuous N-S-trending ridge extends across the western side of the summit caldera of Sierra Negra volcano, forming the border of a graben lying between it and the caldera wall to the left. Volcán Azufre, the largest fumarolic area in the Galápagos Islands, is located in this part of the 7 x 10.5 km wide caldera. An arcuate line of small vents parallel to the caldera wall were produced by eruptions from circumferential fissures parallel to the caldera walls and fed lava flows that primarily traveled down the outer flanks of the volcano.
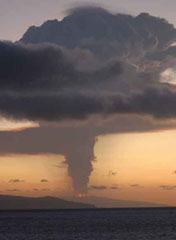 Incandescent lava fountains and eruption column from Sierra Negra are seen from Cerro Dragon on Santa Cruz Island sometime after the onset of the eruption at about 1700 hrs on October 22, 2005. Satellite imagery indicated that the eruption plume reached at least 15 km altitude. The lava fountains were estimated to be about 200-300 m high.
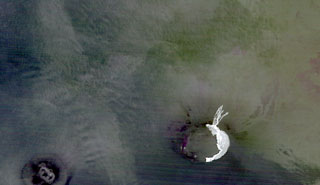 The light-colored area at the lower right in this false color ASTER infrared image shows the extent of lava flows from the October 2005 eruption of Sierra Negra volcano. The image, taken at night on November 2, about 3 days after the eruption ended, shows thin lava flows that descended the north flank and the lunate zone of ponded lavas on the eastern-to-southern caldera floor deflected by caldera wall. Neighboring Cerro Azul volcano on SW Isabela Island is visible at the lower left.
 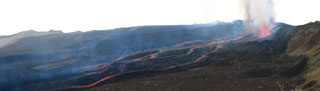 This composite view looks west from the NE rim of Sierra Negra's caldera (right) on October 23, 2005. The caldera floor is to the left. Four active vents are superimposed in this photo, aligned along the E-W fracture that lies at the base of the inner caldera wall. Numerous lava flows descended southwards to the left where they joined to form one single flow of a'a lava ~ 1 km wide and 7 km long that had already reached the southern inner wall of the caldera on the 23rd.
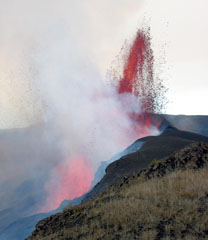 A 150-m-high lava fountain rises on October 23, 2005 from one of four active vents that define the active fracture system at the base of the northern inner wall of Sierra Negra's caldera. An eruption began on October 22, 2005 from a 2-km-long, roughly E-W-trending fissure vent along the north caldera rim, initially producing a 15-km-high eruption column. Some lava flows traveled down the north flank, but the bulk of the lava flows traveled into the caldera and followed its east wall before being deflected by the southern caldera wall to the west.
 Lava fountaining of the Sierra Negra eruption is viewed from the east caldera rim on the night of October 24, the 3rd day of the eruption. Vigorous lava fountains rise from several locations along the fissure vent, feeding several anastomosing lava flows that poured into the caldera. The scattered glow in the foreground was due to ponded lava covering the caldera's eastern floor.
 An aerial view of the SW caldera floor of Sierra Negra volcano shows El Azufre fumarolic field and the trap-door fault to the left. This sinuous 14-km-long, N-S-trending ridge occupies the west part of the caldera floor, which lies only about 100 m below its rim. El Azufre, the largest fumarolic area in the Galápagos Islands, lies within a graben between this ridge and the west caldera wall. The broad shield volcano of Sierra Negra at the southern end of Isabela Island contains a shallow 7 x 10.5 km caldera that is the largest in the Galápagos Islands.
 The following 14 samples associated with this volcano can be found in the Smithsonian's NMNH Department of Mineral Sciences collections, and may be availble for research (contact the Rock and Ore Collections Manager). Catalog number links will open a window with more information.
| Catalog Number | Sample Description | Lava Source | Collection Date |
|---|---|---|---|
| NMNH 118119-72 | Basalt | -- | -- |
| NMNH 118119-73 | Basalt | -- | -- |
| NMNH 118119-74 | Basalt | -- | -- |
| NMNH 118119-75 | Basalt | -- | -- |
| NMNH 118119-76 | Basalt | -- | -- |
| NMNH 118119-77 | Basalt | -- | -- |
| NMNH 118119-78 | Igneous Rock | -- | -- |
| NMNH 118119-79 | Sulfur | -- | -- |
| NMNH 118119-80 | unknown Rock | -- | -- |
| NMNH 118119-81 | Basalt | -- | -- |
| NMNH 118119-82 | Basalt | -- | -- |
| NMNH 118119-83 | Basalt | -- | -- |
| NMNH 118119-84 | Basalt | -- | -- |
| NMNH 118119-85 | Basalt | -- | -- |
| Copernicus Browser | The Copernicus Browser replaced the Sentinel Hub Playground browser in 2023, to provide access to Earth observation archives from the Copernicus Data Space Ecosystem, the main distribution platform for data from the EU Copernicus missions. |
| MIROVA | Middle InfraRed Observation of Volcanic Activity (MIROVA) is a near real time volcanic hot-spot detection system based on the analysis of MODIS (Moderate Resolution Imaging Spectroradiometer) data. In particular, MIROVA uses the Middle InfraRed Radiation (MIR), measured over target volcanoes, in order to detect, locate and measure the heat radiation sourced from volcanic activity. |
| MODVOLC Thermal Alerts | Using infrared satellite Moderate Resolution Imaging Spectroradiometer (MODIS) data, scientists at the Hawai'i Institute of Geophysics and Planetology, University of Hawai'i, developed an automated system called MODVOLC to map thermal hot-spots in near real time. For each MODIS image, the algorithm automatically scans each 1 km pixel within it to check for high-temperature hot-spots. When one is found the date, time, location, and intensity are recorded. MODIS looks at every square km of the Earth every 48 hours, once during the day and once during the night, and the presence of two MODIS sensors in space allows at least four hot-spot observations every two days. Each day updated global maps are compiled to display the locations of all hot spots detected in the previous 24 hours. There is a drop-down list with volcano names which allow users to 'zoom-in' and examine the distribution of hot-spots at a variety of spatial scales. |
|
WOVOdat
Single Volcano View Temporal Evolution of Unrest Side by Side Volcanoes |
WOVOdat is a database of volcanic unrest; instrumentally and visually recorded changes in seismicity, ground deformation, gas emission, and other parameters from their normal baselines. It is sponsored by the World Organization of Volcano Observatories (WOVO) and presently hosted at the Earth Observatory of Singapore.
GVMID Data on Volcano Monitoring Infrastructure The Global Volcano Monitoring Infrastructure Database GVMID, is aimed at documenting and improving capabilities of volcano monitoring from the ground and space. GVMID should provide a snapshot and baseline view of the techniques and instrumentation that are in place at various volcanoes, which can be use by volcano observatories as reference to setup new monitoring system or improving networks at a specific volcano. These data will allow identification of what monitoring gaps exist, which can be then targeted by remote sensing infrastructure and future instrument deployments. |
| Volcanic Hazard Maps | The IAVCEI Commission on Volcanic Hazards and Risk has a Volcanic Hazard Maps database designed to serve as a resource for hazard mappers (or other interested parties) to explore how common issues in hazard map development have been addressed at different volcanoes, in different countries, for different hazards, and for different intended audiences. In addition to the comprehensive, searchable Volcanic Hazard Maps Database, this website contains information about diversity of volcanic hazard maps, illustrated using examples from the database. This site is for educational purposes related to volcanic hazard maps. Hazard maps found on this website should not be used for emergency purposes. For the most recent, official hazard map for a particular volcano, please seek out the proper institutional authorities on the matter. |
| IRIS seismic stations/networks | Incorporated Research Institutions for Seismology (IRIS) Data Services map showing the location of seismic stations from all available networks (permanent or temporary) within a radius of 0.18° (about 20 km at mid-latitudes) from the given location of Sierra Negra. Users can customize a variety of filters and options in the left panel. Note that if there are no stations are known the map will default to show the entire world with a "No data matched request" error notice. |
| UNAVCO GPS/GNSS stations | Geodetic Data Services map from UNAVCO showing the location of GPS/GNSS stations from all available networks (permanent or temporary) within a radius of 20 km from the given location of Sierra Negra. Users can customize the data search based on station or network names, location, and time window. Requires Adobe Flash Player. |
| DECADE Data | The DECADE portal, still in the developmental stage, serves as an example of the proposed interoperability between The Smithsonian Institution's Global Volcanism Program, the Mapping Gas Emissions (MaGa) Database, and the EarthChem Geochemical Portal. The Deep Earth Carbon Degassing (DECADE) initiative seeks to use new and established technologies to determine accurate global fluxes of volcanic CO2 to the atmosphere, but installing CO2 monitoring networks on 20 of the world's 150 most actively degassing volcanoes. The group uses related laboratory-based studies (direct gas sampling and analysis, melt inclusions) to provide new data for direct degassing of deep earth carbon to the atmosphere. |
| Large Eruptions of Sierra Negra | Information about large Quaternary eruptions (VEI >= 4) is cataloged in the Large Magnitude Explosive Volcanic Eruptions (LaMEVE) database of the Volcano Global Risk Identification and Analysis Project (VOGRIPA). |
| EarthChem | EarthChem develops and maintains databases, software, and services that support the preservation, discovery, access and analysis of geochemical data, and facilitate their integration with the broad array of other available earth science parameters. EarthChem is operated by a joint team of disciplinary scientists, data scientists, data managers and information technology developers who are part of the NSF-funded data facility Integrated Earth Data Applications (IEDA). IEDA is a collaborative effort of EarthChem and the Marine Geoscience Data System (MGDS). |

