Report on Kelud (Indonesia) — March 2008
Bulletin of the Global Volcanism Network, vol. 33, no. 3 (March 2008)
Managing Editor: Richard Wunderman.
Kelud (Indonesia) Comparatively passive 2007 lava-dome emplacement in a crater lake
Please cite this report as:
Global Volcanism Program, 2008. Report on Kelud (Indonesia) (Wunderman, R., ed.). Bulletin of the Global Volcanism Network, 33:3. Smithsonian Institution. https://doi.org/10.5479/si.GVP.BGVN200803-263280
Kelud
Indonesia
7.935°S, 112.314°E; summit elev. 1730 m
All times are local (unless otherwise noted)
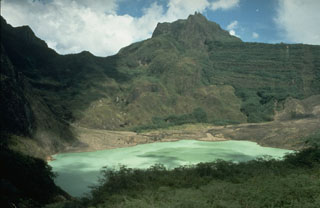
The extrusion of a substantial dome into the center of the active crater lake at Kelut (also spelled Kelud) started in early November 2007. The volcano and lake are among the most historically active and dangerous in Indonesia (Thouret and others, 1998). They were studied by members of the Volcanological Survey of Indonesia (VSI), Alain Bernard, and colleagues. During about 15 years prior to the eruption, the crater lake showed considerable hydrothermal influence, with temperatures several degrees above the ambient air temperature of 19°C, but with near-neutral pH. Prior to this eruption, the lake was ~ 34 m deep, ~ 350 m in diameter, and it held ~ 2.1 x 10⁶ m3 of water (Bernard and Mazot, 2004).
Lava was clearly seen emerging from the center of the lake on 4 November 2007. The activity was passive, even at the contact between the dome and lake. Neither water nor substantial ash were thrown forcefully out of the lake and onto the flanks. The dome rose rapidly above the lake, building a steep construct surrounded by a placid but dwindling lake. A well-defined depression crossed the dome's center, dividing its top surface in two. A few undated photos showed a mildly explosive phase. During 29-30 November the still-erupting dome was stable. As of early May 2008, tentative reports suggested that dome extrusion had ceased or paused. A lake still existed at that point.
Setting, historical lahars, and morphology. The volcano resides in a densely populated part of Java (1,800 people/km2) and could threaten over 3 million residents (Bernard, 2000). Bernard (2000) also noted that Kelut's approximately 30 historical eruptions have caused over 15,000 deaths since 1500 AD. Kelut's last eruption occurred in 1990 (BGVN 15:01). One of the most detailed VSI reports on Kelud's pre-eruptive behavior was issued 30 October 2007 (Surono, 2007).
Although lahars were absent during the 2007 eruption, lahars were associated with eruptions in 1919 and 1966; post-1996 lahars came in response to rainfall (figure 2). To control lahars and related problems, decades before engineers had driven a complex series of drainage tunnels through the edifice's walls, draining much of the lake.
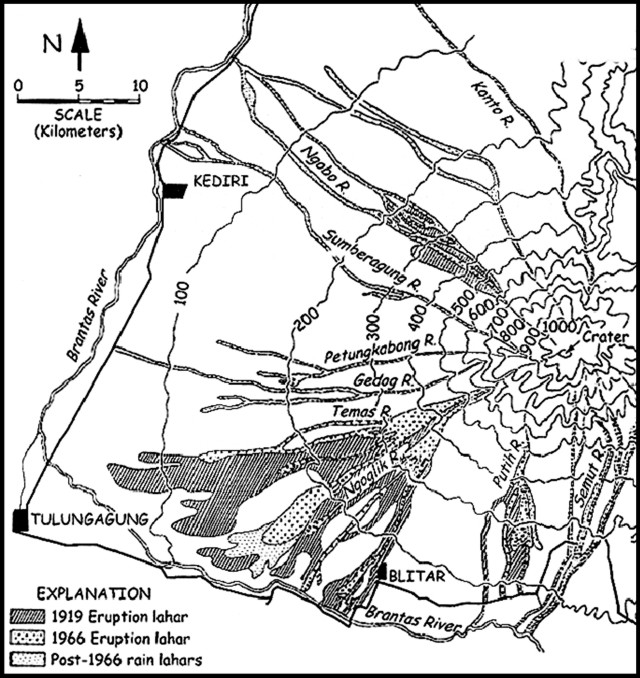 |
Figure 2. Map of Kelut showing prominent drainages on the W side and key settlements such as Kediri, Tulungagung, and Blitar (respective populations, 252,000, 970,000 and 1,200,000), and three sets of lahars. Heavy (often straight) lines indicate some local political boundaries. The 2007 eruption did not trigger lahars. After Rodolfo (1999). |
Lake chemistry. Active crater lakes such as Kelut's trap some fraction of the heat and fluids escaping the magmatic and hydrothermal system (Delmelle and Bernard, 1999), and their study has led to breakthroughs in eruption prediction. One example of this kind of study (figure 3) presents various heat and mass-balance factors in a model of Kelut's lake (Bernard and Mazot, 2004). Heat is derived from the enthalpy (E) of hydrothermal fluids (Ebrine + steam) and from solar and atmospheric radiation (Erad). Heat is lost by evaporation (Eevap), conduction (Econd), radiation (Erad), and by the overflow (Eover) of hot waters through the drainage tunnel.
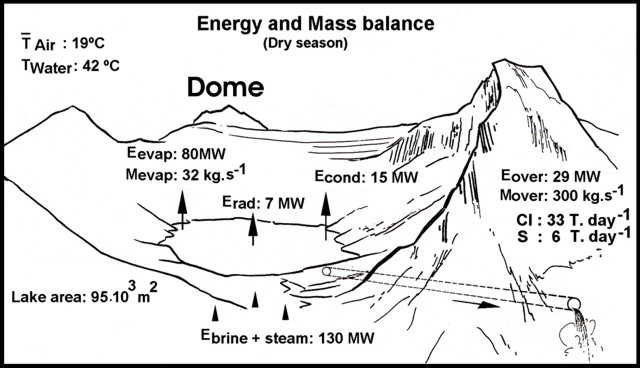 |
Figure 3. A sketch of Kelut's summit crater made prior to the 2007 eruption, looking E. The 2007 eruption built a dome in the lake's center. The irregular high area on the far wall of the crater (labeled "dome") is called Gunung Kelut, and is but one of many domes at the complex. The arrows are explained in the text. The dashed 'drainage tunnel' through the edifice walls is schematic, the actual tunnels consist of a network built in successive stages. Diagram after Bernard and Mazot (2004). |
Monitoring instrumentation is in place on and around the lake (figure 4). Fieldwork is also performed to measure the flux of CO2 emitted at the lake surface (figure 5). Numerous CO2-bearing gas bubbles rising to the surface were seen in July 2006. Bubbles were also widespread on bathymetric soundings (eg. detected at 50 and 200 kHz) in July 2007, and in some cases observers witnessed frequent discontinuous gas releases (puffing) from bottom fumaroles.
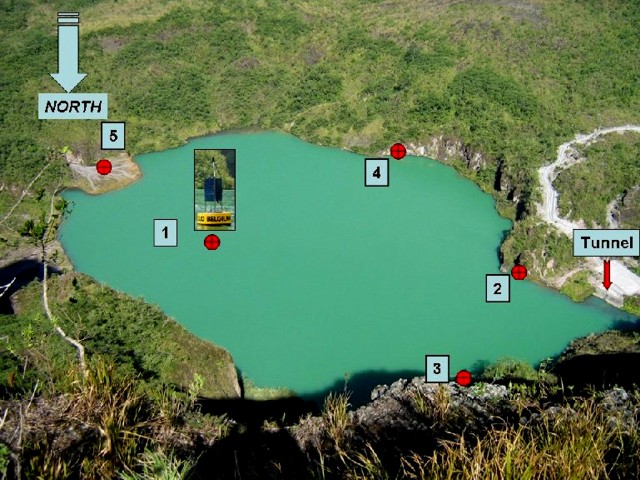 |
Figure 4. A pre-eruption photo showing Kelut's lake from a high point on the rim. Numbered sites are monitoring stations, as follows: 1) temperature and conductivity at 15 m depth and meteorological conditions (air temperature, relative humidity, and wind velocity), 2-4) lake level sensors, where the pressure difference between stations 3 and 4 functions as a N-S tilt meter), and 5) a radon sensor. Instrumentation also monitors the runoff volume in the drainage tunnel. A buoy (at 1) was one of three ultimately installed in the lake. A service road down the crater wall leads to the lake end of a drainage tunnel. Courtesy of A. Bernard. |
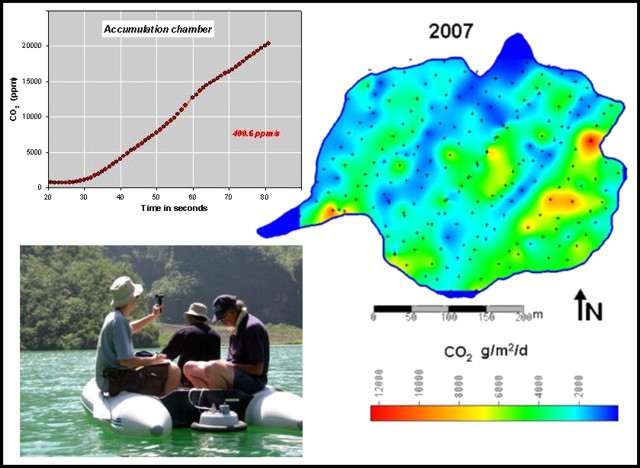 |
Figure 5. (bottom left) A July 2006 photo at Kelut of the team taking a CO2 flux measurement at a sample site. The team consisted of (left to right) Loic Peiffer, Khirul Huda from VSI, and Alain Bernard. The team used a floating accumulation chamber connected by tubing to a dedicated spectrometer residing in the boat. (top left) A graph of 2007 spectrometer data from a sampling cycle with the accumulation chamber. After a lag time of ~ 30 seconds, the accumulation rate was stable at a slope of ~ 400 ppm/s. (right) Resulting map of lake surface showing CO2 flux per unit area (in the units of grams per square meter per day, g/(m2/d)). The map resulted from 230 spot measurements taken between 30 July and 2 August 2007. Courtesy of Alain Bernard. |
The CO2 flux from the lake's surface was measured by IR spectrophotometry using a Dr?ger Polytron instrument. Bernard's team modified a technique initially developed for monitoring the flux of gases in soil (Chiodini and others, 1996), applying this method by means of the floating accumulation chamber at multiple sites.
According to the VSI report, carbon dioxide (CO2) concentrations measured during 30 July to 2 August 2007 ranged from below 500 g/m2/d to hotspots of 12,000 g/m2/d, especially in the E portion of the lake. The overall flux of CO2 from the lake reached more than 500 tons/day on 11 September 2007, about ten times greater than measurements made in 2005 and 2006 (figure 6).
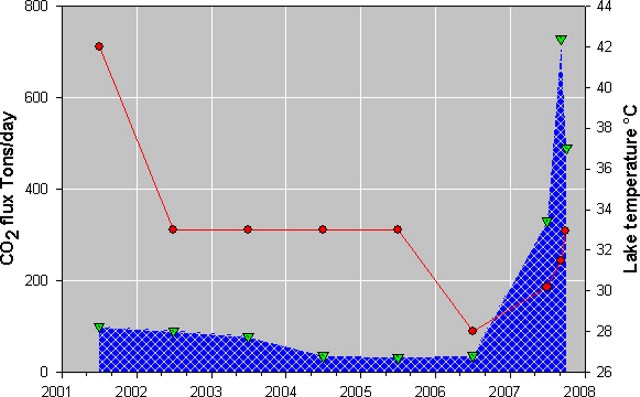 |
Figure 6. A plot for Kelut from 2001 through 2 August 2007 showing water temperature and total CO2 flux from the lake. The total CO2 flux was estimated by normalizing the data to the relevant lake area at Kelut, 103,600 m2). The latest CO2 field measurements were made during 30 July to 2 August 2007. The line shows lake temperature readings (taken at uncertain depth and location, but presumably more consistently measured than temperature data shown on table 2. Unfortunately, these plotted temperature data do not extend into late 2007 when table 2 suggests lake temperatures rose more than 50°C higher, to ~ 78°C). |
Data on lake chemistry (table 2) was compiled by Surono (2007) and Bernard (2000). The water chemistry of the active crater lake showed both stable and variable parameters. Comparatively stable ones included pH and during various time periods (including 2007), some chemical species. Among the largest perturbations were a sudden, almost two-fold rise in SO2 during September-October 2007; and a rapid increase in lake water temperature during November 2007. Soluble Cl stood over 1,000 ppm during 1993 and dropped sharply reaching a low of 67 ppm on 20 August 2007. It climbed after that, reaching 354 ppm in the last (11 November) measurement, a value taken about a week after the dome broke the lake surface.
Table 2. A compilation for Kelut's lake water showing temperature, pH, and chemical concentration data from VSI for 2007 (Surono, 2007) and Alain Bernard (2000) during 1993 to 2005. Some of the data presented here were rounded and the number of significant figures reduced. The 23 October 2007 Cl value was variously reported. Some of the original data were presumably collected at different locations and depths; and some of the original data included additional parameters such as total dissolved solids (see cited publications). Eruptions began on 3 November 2007, and the dome emerged above the lake surface on 4 November.
| Date | Temp (°C) | pH | Na | K | Ca | Mg | HCO3 | Cl | SO4 | B |
| 18 Dec 1993 | 42.8 | 5.9 | 700 | 92 | 105 | 55 | 238 | 1,297 | 631 | 11 |
| 01 Aug 1994 | 42.1 | 6.3 | 1,024 | 102 | 130 | 67 | 207 | 1,289 | 692 | 14 |
| 24 Sep 2002 | 33.2 | 6.5 | 342 | 39 | 135 | 80 | 435 | 289 | 670 | 4 |
| 04 Sep 2003 | 30.7 | 6.5 | 271 | 30 | 147 | 78 | 472 | 202 | 679 | 2.5 |
| 27 Apr 2005 | 32.2 | 6.6 | 198 | 23 | 121 | 71 | 330 | 139 | 571 | 2 |
| 20 Aug 2007 | 31.5 | 6.9 | 104 | 14 | 166 | 48 | 221 | 66.5 | 538 | 0.8 |
| 16 Sep 2007 | 33.2 | 6.4 | 106 | 16 | 184 | 52 | 294 | 120 | 1,083 | 1.1 |
| 25 Sep 2007 | 33.4 | 5.9 | 109 | 17 | 178 | 51 | 279 | 133 | 1,121 | 1.3 |
| 29 Sep 2007 | 36.1 | 5.9 | 109 | 17 | 179 | 45 | 279 | 137 | 1,121 | 1.5 |
| 23 Oct 2007 | 38.4 | 5.8 | 257 | 22 | 186 | 56 | 297 | 210 (173) | 1,119 | 1.3 |
| 28 Oct 2007 | 39.2 | 5.6 | 117 | 20 | 190 | 48 | 303 | 179 | 1,151 | 1.4 |
| 02 Nov 2007 | ~50 | -- | -- | -- | -- | -- | -- | -- | -- | -- |
| 06 Nov 2007 | 77.5 | 6.7 | 124 | 21 | 200 | 48 | 170 | 294 | 542 | 1.7 |
| 11 Nov 2007 | 77.8 | 6.2 | 130 | 21 | 223 | 45 | 26.3 | 354 | 615 | 2.1 |
Monitoring, hazards status, and dome extrusion. Visual monitoring was carried out by means of a closed-circuit video monitor installed on Mount Lirang, as well as from photographs taken in or near the crater. During 15-28 September, gas emissions from the crater lake increased and spread over a zone within a radius of ~ 5 m.
According to Surono (2007), pre-eruption CO2 fluxes from the lake were typically 50 metric tons/day. During August 2007 they rose to 333 tons/day; during late August to early September they reached 500 tons/day.
During 2006, the Darwin Volcanic Ash Advisory Center (VAAC) reported a pilot observation. An ash plume on 18 May 2006 allegedly reached an altitude of 5.5 km.
On 17 October 2007 Kelut was the subject of further VAAC reports, first noting the elevation of the hazard status to 4 (the highest level, indicating an eruption imminent). On 23 October there was a brief noting evidence from a satellite of a eruption (to ~ 6 km altitude) but ground observers suggested that it was a meteorological cloud. A VAAC report on 4 November noted "ash not identifiable on satellite imagery." On 8 November an advisory noted the continued absence of identifiable ash.
Seismicity rose suddenly on 10 September 2007 (figure 7). It peaked on 16 October at all four seismic stations on or adjacent the volcano, at 510 events. The next day, the number of earthquakes still stood quite high, 151.
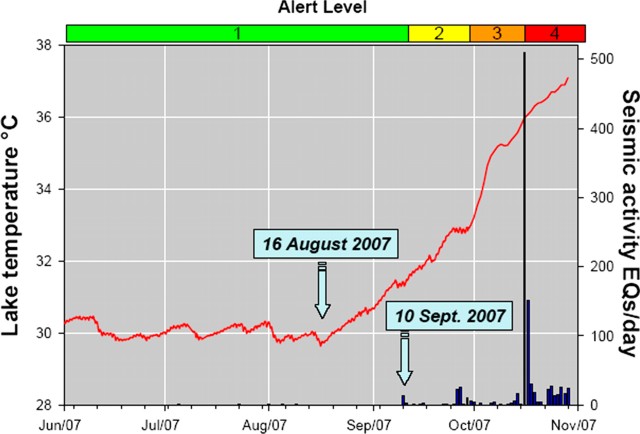 |
Figure 7. Kelut seismicity, lake-water temperature, and Alert Levels registered during June to early November October 2007. After plots by Surono (2007) and Bernard. |
Cross sections showing hypocenters for 10-11 and 26-29 September 2007 depicted them broadly centered below the edifice but distributed around 2.5 km depth; they were initially absent in a zone about 2-3 km below the summit . During mid-October the hypocenters became more closely packed along a narrow vertical band beneath the edifice. They then filled a zone 0.7-1.2 km beneath the summit, with a few other hypocenters centered ~ 2 km below the summit. During 24-29 October, many hypocenters clustered ~ 6 km below the summit, but others strung out on or about a vertical line intersecting near the summit. The shallowest events plotted were then ~ 1 km below the summit. Reports also noted tremor was common during 24 October through 4 November.
VSI issued a series of increases in Kelut's hazard status (a scale of 1-4, figure 7). On 11 September 2007, VSI raised the status from 1 to 2. This corresponded to the CO2 flux mentioned above, a sudden jump in seismicity on 10 September (figure 7), and changes in both lake temperature and color, which shifted from its usual green, becoming yellow in some areas and blue-white in others. On 29 September, the status went from 2 to 3 based on visual observations, increased seismicity, deformation measurements, and further changes of crater lake water chemistry and temperature.
VSI brought the status to 4 on 16 October (figure 7). Factors included the sudden rise in seismicity, and the summit's inflation during 13-16 October. Before the crisis of 16 October the lake water was whitish green; after the crisis, dominantly green. VSI to recommend that villagers within a 10-km radius evacuate. According to a United Nations report, local authorities evacuated ~ 117,000 people within this radius. The UN report cited Indonesian media as stating that an eruption could affect as many as ~ 290,000 people (figure 8).
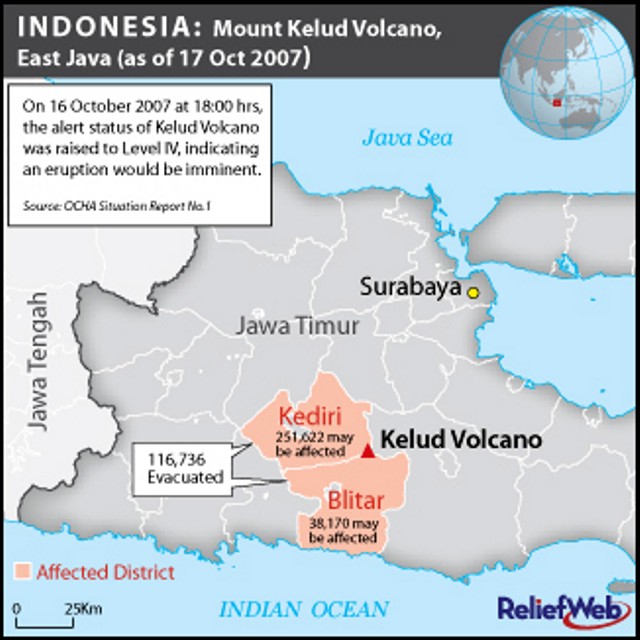 |
Figure 8. A map of a portion of E Java that indicates the location of Kelut (sometimes written as "Kelud," as is the case here) and the major city Surabaya (~ 85 km NE; population, ~ 4 million). The map was issued after the alert status was raised to the highest level ("4"; at 1800 on 16 October) and indicates the number of people in two adjacent jurisdictions that could be affected by its eruption. Courtesy of Relief Web (United Nations); boundaries and names shown and the designations used on this map do not imply official endorsement or acceptance by the United Nations. |
According to a news article, thousands returned to their homes on 17 October to tend to crops and animals, and to retrieve food. On 8 November the status fell to 3 and residents were allowed to return home. On 29 November the status fell from 3 to 2 following both decreased seismicity and a lack of deformation. At this stage, people were advised to remain at least 1.5 km from the lake.
During 24-31 October, a series of regional earthquakes occurred, dominated by shallow events and tremor. Seismicity intensified during 2-3 November, but then decreased on 4 November.
Dome emerges during 3-4 November 2007. On 3 November, VSI and news media mentioned plumes, and possibly some evidence of erupted solids entering the lake. Also, their buoy ceased functioning. On 4 November, white plumes rose to an altitude of 2.2 km and drifted N.
Plumes on the 4th came from a fresh black lava dome, protruding from the then turbid green lake. Monitoring cameras showed copious steam obscuring the dome. The exposed mass grew quickly. Although steaming continued, relative calm usually prevailed at both the dome and the lake. Although the dome steadily displaced the lake, the water did not undergo violent broad-scale boiling.
According to VSI, the temperature at the surface of the crater lake on 6 November had climbed to over 75°C. The newly exposed dome surface was 150-210°C. Plumes generally inhibited clear views.
On 8 November, VSI reported a decrease in seismicity, and deformation-monitoring suggested greater stability. An infrared camera (FLIR) captured images of the dome on 9 November as it emerged from the lake. The images revealed considerable radiant heat in the FLIR-sensitive wavelengths (figure 9).
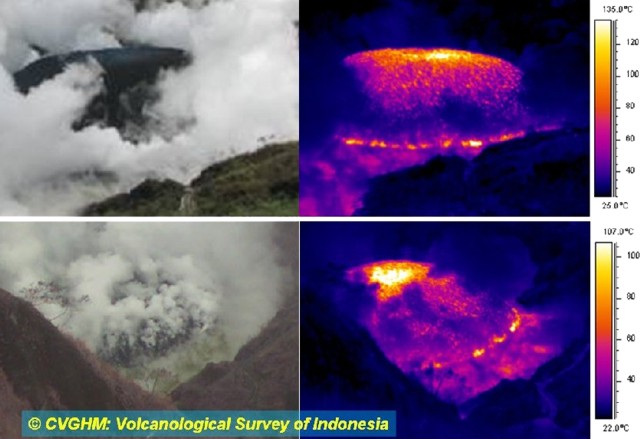 |
Figure 9. On 9 November 2007, scientists looking at Kelut's new dome took these two photos, and at right, coinciding infrared (FLIR) images. The scale bars on the FLIR images indicate that the highest temperatures were on the order of 135°C. The hottest zones occurred both over a large area at the dome's top and along a band following the dome near the lake surface. Courtesy of VSI and taken from Bernard (2007). |
According to a news article by Agence France Presse on 12 November, a volcanologist reported that the lava dome had reached 250 m in diameter and was 120 m above the lake surface.
November photos and videos. On 11 November, a plume rose to an altitude of 3.7 km and ashfall was reported in several areas. News accounts indicated that tremors continued and that Kelut was spewing ash and lava. More photos of the dome, particularly during 10-29 November, would be useful for understanding activity in this period.
An undated video provides views of a short-lived avalanche down from the new dome's upper walls. Based on the size of the dome then, the scene was probably captured in mid- to late November (it was posted on 7 December; Masdjawa, 2007). The avalanche initially contained on the order of 5-20 m3 of loose material, much of it incandescent in daylight. A large portion of this material bounced downslope into the steaming lake. When sufficient fragmental material entered the lake an intense phreatic eruption took place. The clouds rose vertically; they were initially jet black, but within tens of seconds became dominantly white steam, hiding the dome for ~ 1-2 minutes.
Daniel Brazilier visited during 25-26 November and saw mildly to moderately explosive activity; his photos appeared in Societe de Volcanologie Geneve reports (SVG, 2007). Many of his photos were taken during daylight from ~ 1.5 km away; they showed several explosions with billowing white-to-tan clouds. The foreground, the W crater wall, contained small amounts of tephra and some bombs. The billowing clouds appeared to contain minor ash; they vented from the dome upper area or side, and accompanied numerous steaming bombs, which from their arcing trails, seemed destined to land within the crater. Night photos disclosed large areas of incandescence on the W side.
Tom Pfeiffer took a series of remarkable photos on 29-30 November 2007, documenting a surprisingly large and clearly fast-growing dome. He posted over 60 photos on the Volcano Discovery website and elsewhere, and several of them appear here (figures 10, 11, and 12).
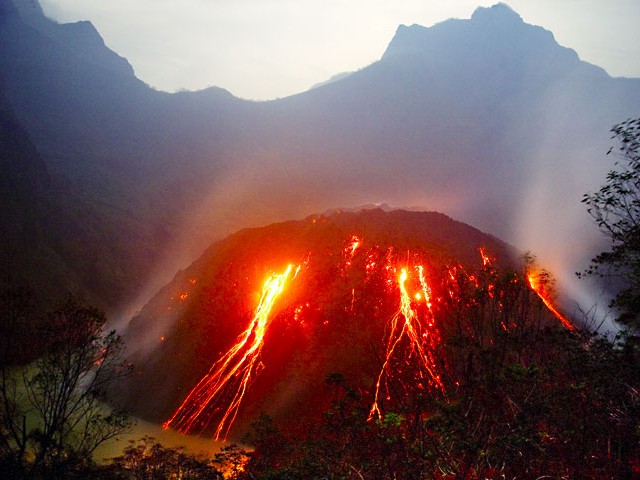 |
Figure 10. Kelut's dome seen in low-light conditions on 29 or 30 November 2007 in a view looking towards the E. Myriad incandescent fragments detached from the dome, leaving incandescent scars in the middle to upper dome area. The dome's summit area and much of its lower skirt are chiefly dark, except in the latter case for the trails of material bouncing and falling past. The much reduced lake was calm and wrapping around the dome's left (N) side. The segment of the crater rim towering above the new dome's right side is the older dome mentioned in figure 3. Copyrighted photo by Tom Pfeiffer (Volcano Discovery). |
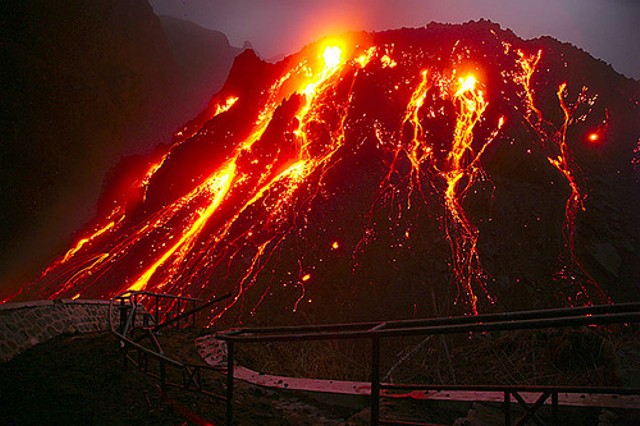 |
Figure 11. A NE view under dark conditions of Kelut's growing dome at a time on 29 or 30 November when dome incandescence was particularly high. In the foreground is the pathway leading to the lake. Comparatively few bombs littered the curbing along the pathway, but pelting from bombs had apparently damaged the steel hand-rail in a few places. Copyrighted photo by Tom Pfeiffer (Volcano Discovery). |
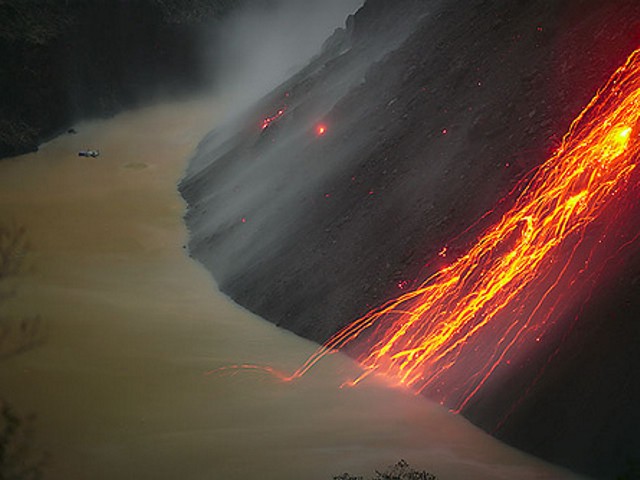 |
Figure 12. Kelut's new lava dome had reduced the crater lake to a narrow band by 29-30 November 2007. This low-light photo looking NE captured the shrinking lake and its contact with the new dome. At right is a prominent avalanche chute choked with the incandescent trails of bouncing blocks. Upon entry into the lake some of the trails made a second bounce. Copyrighted photo by Tom Pfeiffer (Volcano Discovery). |
Note that Pfeiffer's photos are night-time shots with long exposures and thus the impression of large glowing areas implies more activity than really occurred at any one time. The dome had clearly crowded out the then green or brownish lake, which in the field of view had been reduced to an arcuate sliver. The extent of the lake on the dome's W and SW sides was unclear from his perspective.
Particularly on figures 10 and 11, the dome was rife with abundant glowing zones and numerous red traces due to incandescent dome rocks bouncing downslope. Abundant were glowing avalanche trails, and large rockfall scars. The photos also suggest possible lava seeps and narrow lava flows, although Tom Pfeiffer attributed most of the incandescence to mobile and solidified material, rather than narrow zones occupied by fluid moving lava.
A few of the glowing traces in the photos terminate upon entering the crater lake (figure 12). After their first contact with the water, some of those descending traces also seemingly shattered and bounced, producing one or more secondary arcs (akin to a skipping stone).
Pfeiffer described the scene as "filled with the noises of cracking lava, falling debris, and chilled lava blocks that splashed into the lake." He went on to note the lack of "explosions, or major ash emissions attached to the activity. The lava dome was simply growing quietly and not doing anything else than what is visible on the photos." He was struck by the observation "that the lake was simply there and NOT boiling. A sign how well rock insulates. Also, the upper 10 meters of the dome, its very top, were rather inactive, like the top of a mushroom being lifted up. The most active zones were just underneath that upper crust . . .."
References. Bernard A., and Mazot A., 2004, Geochemical evolution of the young crater lake of Kelud volcano in Indonesia: Proceedings of the Eleventh International Symposium on Water-Rock Interaction, Saratoga Springs, New York, USA, v. 1, p. 87-90.
Bernard, A., 2000, Geochemistry of the crater lake of Kelut volcano, Indonesia: Essay labeled "in preparation" on the http://www.ulb.ac.be/ website.
Bourdier, J. L., Pratomo, I., Thouret, J.C., Boudon, G. and Vincent, P.M., 1997. Observations, stratigraphy and eruptive processes of the 1990 eruption of Kelut volcano, Indonesia: J. Volcanol. Geotherm. Res., v. 79, p. 181-203.
Delmelle, P., and Bernard, A., 1999, Volcanic lakes, in Encyclopedia of volcanoes, H. Sigurdsson (ed.): Academic Press, p. 877-895.
Masdjawa, 2007, Kelud-Kubah Lava: Kelud_03.mpg (23.2 Mb), 2 min 20 sec; http://masdjawa.multiply.com/video/item/4
Rodolfo, K. S., 1999, The hazard from lahars and Jökulhaups, in Encyclopedia of volcanoes, H. Sigurdsson (ed.): Academic Press, p. 973-995.
Surono, 2007, Pusat Vulkanologi Dan Mitigasi Bencana Geologi, Pos Pengamatan Gunungapi Kelut (Hasil evaluasi tingkat kegiatan G. Kelut): Departemen Energi Dan Sumber Daya Mineral, Republik Indonesia, Badan Geologi, Nomor, 112/GK/X/2007, 30 Oktober 2007.
Thouret, J. C., Abdurachman, K. E., and Bourdier, J. L., 1998, Origin, characteristics, and behavior of lahars following the 1990 eruption of Kelud volcano, eastern Java (Indonesia): Bull. Volcanol., v. 59, p. 460-480.
Geological Summary. The relatively inconspicuous Kelud stratovolcano contains a summit crater lake that has been the source of some of Indonesia's most deadly eruptions. A cluster of summit lava domes cut by numerous craters has given the summit a very irregular profile. Satellitic cones and lava domes are also located low on the E, W, and SSW flanks. Eruptive activity has in general migrated in a clockwise direction around the summit vent complex. More than 30 eruptions have been recorded since 1000 CE. The ejection of water from the crater lake during the typically short but violent eruptions has created pyroclastic flows and lahars that have caused widespread fatalities and destruction. After more than 5,000 people were killed during an eruption in 1919, an engineering project to drain the crater lake lowered the surface by more than 50 m. The 1951 eruption deepened the crater by 70 m, leaving 50 million cubic meters of water after the damaged drainage tunnels were repaired. Following more than 200 deaths in the 1966 eruption, a new deeper tunnel was constructed, and the lake's volume before the 1990 eruption was only about 1 million cubic meters.
Information Contacts: Volcanological Survey of Indonesia, Center of Volcanology and Geological Hazard Mitigation, Saut Simatupang, 57, Bandung 40122, Indonesia (URL: http://vsi.esdm.go.id/); Alain Bernard, Free University of Brussels, CP 160/02, 50, avenue F, Roosevelt, 1050 Brussels, Belgium (URL: http://www.ulb.ac.be/sciences/cvl/); Relief Web, United Nations Office for the Coordination of Humanitarian Affairs, Resident Coordinator's Office, Jakarta, Indonesia (URL: https://reliefweb.int/, http://www.unocha.org/); Darwin Volcanic Ash Advisory Center, Bureau of Meteorology, Northern Territory Regional Office, PO Box 40050, Casuarina, Northern Territory 0811, Australia (URL: http://www.bom.gov.au/info/vaac/); Tom Pfeiffer, Volcano Discovery (URL: http://www.VolcanoDiscovery.com/); Daniel Brazilier, France.