Report on Ijen (Indonesia) — February 2009
Bulletin of the Global Volcanism Network, vol. 34, no. 2 (February 2009)
Managing Editor: Richard Wunderman.
Ijen (Indonesia) Visual, geochemical, and geophysical observations during mid-2008
Please cite this report as:
Global Volcanism Program, 2009. Report on Ijen (Indonesia) (Wunderman, R., ed.). Bulletin of the Global Volcanism Network, 34:2. Smithsonian Institution. https://doi.org/10.5479/si.GVP.BGVN200902-263350
Ijen
Indonesia
8.058°S, 114.242°E; summit elev. 2769 m
All times are local (unless otherwise noted)
Our previous report on Ijen (BGVN 32:09) discussed the findings of a field visit during 6 July-2 August 2007 by researchers from Simon Fraser University, McGill University, and the Institut Teknologi Bandung (ITB). During their visit, this team documented degassing and increasing fumarole temperatures.
This team again conducted fieldwork at Ijen during 18 July-7 August 2008. This report discusses their findings. The East Java volcano is the scene of sulfur mining and a highly acidic lake.
Fumarole mound. In comparison to 2007, the fumarole mound of Kawah Ijen had changed substantially. The sulfur mining company had installed new pipes and constructed supporting walls. Combined with frequent spraying of water to cool the pipes, this has completely changed the surface coating of the mound. Furthermore, changes at the dome were noted. One area was flat in 2007, but sub-vertical in 2008, indicating an uplift of approximately 1 m. Uplift was also apparent in other areas, but could not be quantified.
Temperatures of the fumaroles were similar to those recorded in 2007. The exit temperature at the pipes varied between 150 and 230°C, with the highest values at pipes in flaming fumaroles (occasional flaming at pipe exits was observed when wind speed was low). Fumarole temperatures varied from 300°C (white fumes) to more than 580°C (flaming), but were highly variable with the weather conditions.
New fumarolic activity was observed W of the fumarole mound, both on the slope leading down to the lake and on the flank of the escarpment bordering the mound on the W (figure 9). According to the sulfur miners, these fumaroles appeared at the end of summer 2007. Temperatures were between 90 and 96°C and the fumaroles were coated in sulfur needles (figure 9). The location suggests a westward migration of the system.
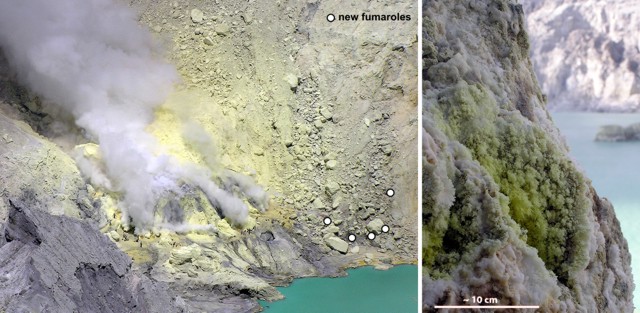 |
Figure 9. (left) Overview of the Kawah Ijen fumarole mound showing the locations of the new fumaroles (small dots). (right) Close up (with scale) of one of the new fumaroles on the flank of the escarpment bordering the mound on the W. Courtesy of the McGill University, Simon Fraser University, and the Institut Teknologi Bandung (ITB) research team. |
Giggenbach-bottles, condensates, silica tubes, and rock samples were collected on the fumarole mound. Measurements of SO2, CO2, and H2O in the fumes at the foot of the fumarole mound were also made using a multi-gas instrument (Shinohara, 2005).
Gas ratios and flux measurements. The ratios of H2O/CO2/SO2 gases in the fumarole gases were measured using a portable multi-gas sensor built at Simon Fraser University. A Licor IR spectrometer measured CO2 concentrations, an InterScan electochemical cell sensor measured SO2 contents, and a Vaisala P-T-RH weather station measured the H2O content of the plume. When compared to magmatic gas ratios estimated from undegassed melt inclusion data, the fumarole gases appear to span a range from relatively dry (H20-poor) and CO2-enriched compositions to H2O-enriched, CO2-poor compositions. All gas compositions were highly depleted in SO2.
Giggenbach gas samples from previous surveys (VSI unpublished data, Delmelle and Bernard, 2000) confirm that the gases from the mound have variable H2O/CO2 ratios. This trend cannot be explained by mixing of the gases with various amounts of atmosphere because nitrogen contents in the gas phase do not correlate. The Giggenbach data also confirms that the gases were depleted in total sulfur (SO2 + H2S + minor species) relative to magmatic ratios. These observations were consistent with the precipitation of sulfur-bearing compounds in the lake (Delmelle and Bernard, 2000).
The total flux of SO2 gas from the fumarole mound was measured using a FLYSPEC (portable UV spectrometer) and averages 200 tons/day. This translates to an average of 720 tons/day of CO2 and 3,900 tons/day of H2O released into the atmosphere. Combining the SO2 flux with the Stotal/element ratios in the gas measured with the Giggenbach bottles, the authors estimated the flux of certain metals and halogens into the atmosphere to be 10 tons/day Cl, 25 g/day Hg, and 1,000 g/day Se.
Lake and Banyu Pahit river. Crater lake conditions were the same as last year. Lake level was approximately 10 cm higher, water temperature at the foot of the fumaroles was 37-39°C and pH and electrical conductivity (EC) were -0.01 and 312.6 mS/cm, respectively. The acid spring in the valley next to the fumarole mound was also unchanged, with a temperature of 50°C, pH of 1.72, and EC of 20.1 mS/cm. Measurements of the gas bubbling up from the springs indicated that it contained more than 100 ppm SO2 and 2 wt. % CO2.
The team conducted a transect along the Banyu Pahit river from the dam on the western end of the lake, to where it meets the Paltuding-Pelalangan road. This revealed that the actual source of the river is a set of springs about halfway along this transect (figure 10), with the water emerging from a cliff on the E flank of the valley from between two lava flows. Two sets of earlier springs are present, one immediately below the dam with abundant gypsum deposits, and another where the first valley from the E merges with the Banyu Pahit (valley A in figure 10).
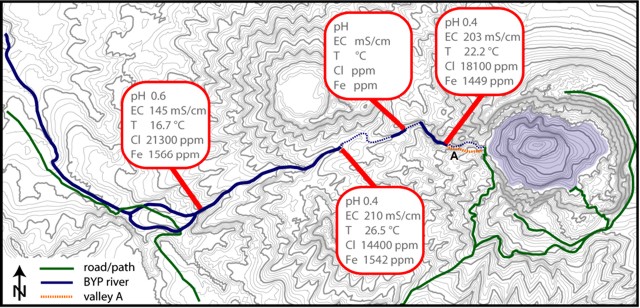 |
Figure 10. Overview map of Ijen showing the upstream part of the Banyu Pahit river, including locations of various springs as well as the pH, temperature (T), and EC of the water. The Cl and Fe content was determined by colorimetry. Courtesy of the McGill University, Simon Fraser University, and the Institut Teknologi Bandung (ITB) research team. |
Mapping along this transect revealed a thick sequence of phreatic, phreatomagmatic, and lahar deposits, as well as three distinct lava flows. Tracing these deposits upstream shows that they descended the Banyu Pahit valley, except for the most upstream part, where they follow valley A instead. This valley is blocked by a lava flow where it meets the lake, indicating that this flow postdates the deposits in the valley and that the section of the Banyu Pahit river immediately below the dam is relatively recent. The position of the second set of springs at the end of valley A may indicate that fluids are still making use of this original valley.
The team collected numerous samples of spring water, Banyu Pahit water, rocks and sediments along this part of the river to determine its sources and pathways. Preliminary field measurements are shown in figure 10.
Geophysical changes, summer 2006-2008. The gravity and differential GPS network of nine stations spread around the active crater, one at Paltuding and one at the volcanic observatory outside Ijen caldera were re-occupied each year. While no significant vertical deformation was observed on any of the stations, the dynamic gravity shows very strong variations between each year (figure 11). The mean error on gravity data was around 20 microGal, while the largest error was always less than 80 microGal. Between 2006 and 2007, the gravity change was of ~ 1,200 microGal (~ 1.2 mGal) and at the summit between 2007 and 2008 at ~ 300 microGal. This is in contrast to the "typical" gravity change of tens to hundreds microGal seen on active volcanoes (e.g., Rymer and others, 2005). At Ijen these changes are attributed to underground and surface water. Three arguments support this hypothesis, as follows.
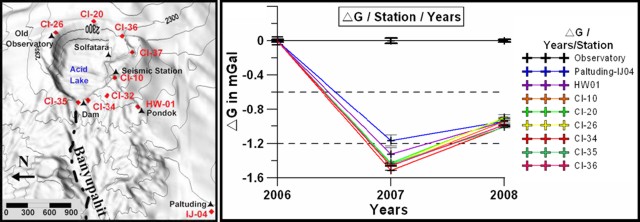 |
Figure 11. (left) Gravity survey stations from summer 2006 to summer 2008 on Kawah Ijen. The observatory station is the reference station, which was located outside the Ijen caldera at the volcanic observatory (SE corner of map). Stations labeled CI are around the crater rim. (right) Changes in gravity (DG, in milliGals) at for nine stations with respect to the years 2006-2008. Courtesy of the McGill University, Simon Fraser University, and the Institut Teknologi Bandung (ITB) research team. |
First, Kawah Ijen hosts a large and deep lake (~30 x 106 m3) (Takano and others, 2004), whose surface level changes over the years. While the survey was made during the dry season each year, there was still some change visible on shoreline of the lake. No accurate measurements were made until summer 2008.
Second, the water table, located on the E flank, flows towards the lake. No data of water depth existent for this water table, but the water flow generates a natural electrical current, which were measured each year by self-potential. As with the gravity variation, similar changes were observed on the electrical profile around the active crater. Between 2006 and 2007, a significant decrease of the SP anomalies (~ 120 mV) on the N and E crater rim was observed. (BGVN 32:09), while between 2007 and 2008, these anomaly increased (~ 70 mV) to an intermediate level, between 2006 and 2008.
Third, no significant deformation was observed since 2006 on the summit of Kawah Ijen.
The geophysical survey indicated that both gravity (figure 11) and self-potential (BGVN 32:09) show compatible variations during 2006-2008. There was a decrease of both gravity and self-potential between 2006 and 2007, followed by an increase between 2007 and 2008. This finding suggests that these variations were due to changes of the lake and fresh groundwater flowing from Gunung Merapi toward Kawah Ijen lake.
References. Delmelle, P., and Bernard, A., 2000, Downstream composition changes of acidic volcanic waters discharged into the Banyupahit stream, Ijen caldera, Indonesia:Journal of Volcanology and Geothermal Research, v. 97, p. 55–75.
Rymer, H., Locke, C.A., Brenes, J., and Williams-Jones, G., 2005, Magma plumbing processes for persistent activity at Poás Volcano, Costa Rica: Geophysical Research Letters, v. 32, p.. L08307, doi:10.1029/2004GL022284.
Shinohara, H., 2005, A new technique to estimate volcanic gas composition: plume measurements with an estimate of volcanic gas composition: plume measurements with a portable multi-sensor system: Journal of Volcanology and Geothermal Research, v. 143, p. 319-333.
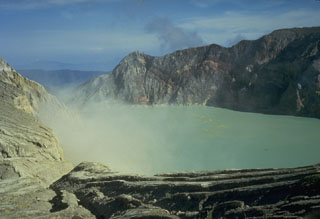
Geological Summary. The Ijen volcano complex at the eastern end of Java consists of a group of small stratovolcanoes constructed within the 20-km-wide Ijen (Kendeng) caldera. The north caldera wall forms a prominent arcuate ridge, but elsewhere the rim was buried by post-caldera volcanoes, including Gunung Merapi, which forms the high point of the complex. Immediately west of the Gunung Merapi stratovolcano is the historically active Kawah Ijen crater, which contains a nearly 1-km-wide, turquoise-colored, acid lake. Kawah Ijen is the site of a labor-intensive mining operation in which baskets of sulfur are hand-carried from the crater floor. Many other post-caldera cones and craters are located within the caldera or along its rim. The largest concentration of cones forms an E-W zone across the southern side of the caldera. Coffee plantations cover much of the caldera floor; nearby waterfalls and hot springs are tourist destinations.
Information Contacts: Vincent van Hinsberg, Stephanie Palmer, Julia King, and Willy (A.E.) Williams-Jones, Department of Earth and Planetary Sciences, McGill University, Montreal, Quebec, Canada (URL: http://www.mcgill.ca/eps/); Nathalie Vigouroux, Guillaume Mauri, and Glyn Williams-Jones, Department of Earth Sciences, Simon Fraser University, Burnaby, BC V5A 1S6, Canada (URL: http://www.sfu.ca/earth-sciences.html); Arif Susanto and Asnawir Nasution, Department of Geology, Institut Teknologi Bandung, Bandung, Indonesia (URL: http://www.itb.ac.id/).