Report on Gaua (Vanuatu) — December 2009
Bulletin of the Global Volcanism Network, vol. 34, no. 12 (December 2009)
Managing Editor: Richard Wunderman.
Gaua (Vanuatu) Significant ashfall through early January 2010
Please cite this report as:
Global Volcanism Program, 2009. Report on Gaua (Vanuatu) (Wunderman, R., ed.). Bulletin of the Global Volcanism Network, 34:12. Smithsonian Institution. https://doi.org/10.5479/si.GVP.BGVN200912-257020
Gaua
Vanuatu
14.281°S, 167.514°E; summit elev. 729 m
All times are local (unless otherwise noted)
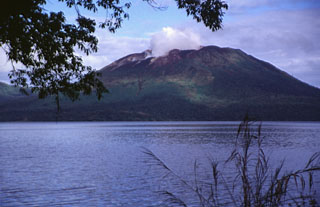
Beginning on 29 September 2009, Gaua produced a series of eruptions from Mount Garat, a cone in the SW portion of its caldera. The eruptions generated a small pyroclastic flow, thick ash plumes, and elevated sulfur dioxide (SO2) levels. Our last report (BGVN 34:10) described these events through November 2009. This new report carries events into February 2010, and discusses ongoing eruptions and stress on residents. We also present a December 2009 hazard map created by the Vanuatu Department of Geology, Mines and Water Resources (DGMWR) and the New Zealand GNS Science.
A news article on 29 November (Radio New Zealand International) quoted Brad Scott (New Zealand GNS), "Downwind ashfall is falling on the forest, it's falling on the villages, it's falling on the gardens. In some places it's already started to create a desert, in other places it's only light ashfall. But people are suffering from sore eyes, throat inflammation, and [intestinal] problem[s] ...."
The health aspects of the eruption were also noted in the Vanuatu Daily Post on 24 November 2009, stating that the drinking water in the affected area was "contaminated with ash and many of the villagers depend only on spring water by the sea for cooking and drinking. Island cabbages and other greens must be thoroughly washed before they are cooked."
According to the DGMWR and Brad Scott, Gaua continued to erupt in December 2009 and early January 2010, with even stronger explosions than those previously described (BGVN 34:10). According to DGMWR, this eruptive phase was different from previous Gaua eruptions, with denser and darker plumes (figure 12). The Alert Level remained at 2 (on a scale of 0-4).
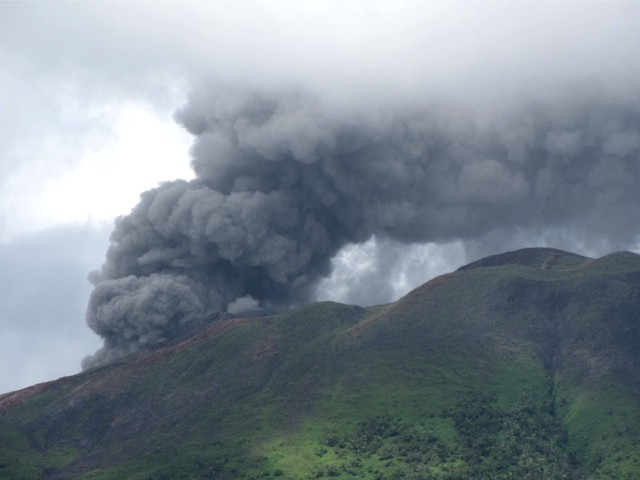 |
Figure 12. Photo of an ash plume from Gaua taken on 31 December 2009, viewed from the caldera rim. Courtesy of Vanuatu Department of Geology, Mines and Water Resources (DGMWR). |
Ash emissions and ashfall were significant (figure 13). Beginning on 14 December and continuing at least through 8 January 2010, the emission of fine ash from Gaua had been continuous, with ashfall blown W (figure 14). Chemical analysis of the ashfall carried out by York University in England found high concentrations of toxic chemicals. As a result of the ashfall, 257 people were relocated to the upwind side of the island during the last week of November.
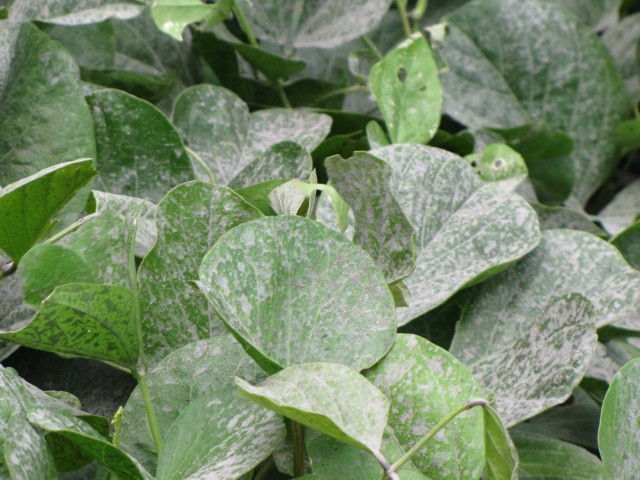 |
Figure 13. Ash from Gaua on 29 December 2009 that fell on plants in Quetekaveau village. Courtesy of DGMWR. |
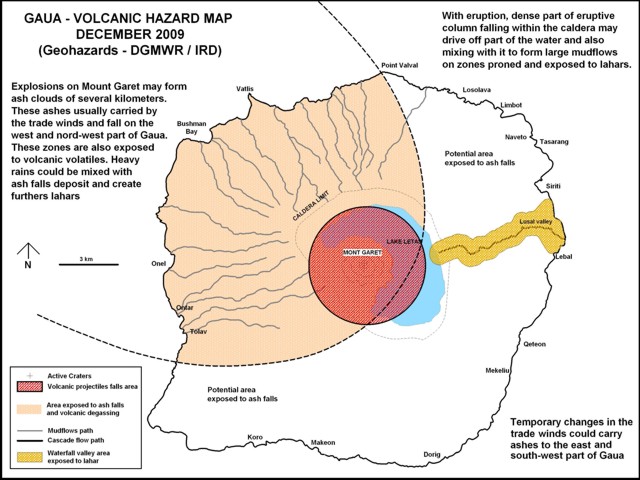 |
Figure 14. Volcanic hazards map of Gaua illustrating the caldera's topographic margin, the active inner cone (Mount Garet), and Lake Letas, which curves around the N to E to S sides of the caldera floor. The zones 1 (red), 2 (orange), 3 (yellow), and 4 (white or unshaded) are discussed in text. Modified from DGMWR Bulletin Number 4 (14 December 2009). |
The 3-km inner circle centered on the active vent (figure 14) represents the area of greatest risk (1, red zone), a region where volcanic projectiles are likely and access is officially banned. A second area of risk lies inside a curve around Mount Garet and surrounding the island's NW side (2, orange zone), a region so delineated because of likely distribution of ongoing plumes by trade winds. This zone is considered exposed to ash and gas; with heavy rains, the water could mix with tephra to create lahars.
A third area of risk (3, yellow zone) trends E-W and forms an elongate region that follows the caldera lake's established drainage along the Lussal valley. Floods and lahars are indicated here. Note the settlements of Lebal (on the E coast directly S of the river mouth) and Siriti (~3 km N of Lebal). A sudden eruption could send material into the lake, and the resulting displaced water or water-and-ash mixture would surge down the Lussal river drainage. The villages on the other part of the island (4, white or unshaded) could receive light ashfall, should the wind direction temporarily change.
An 18 January 2010 satellite image (taken by the ozone monitoring instrument) quantifying emissions from Gaua showed the persistence of significant gas flux (figure 15). These emissions became more frequent in December, although the daily SO2 gas flux stayed steady around 3,000 metric tons per day.
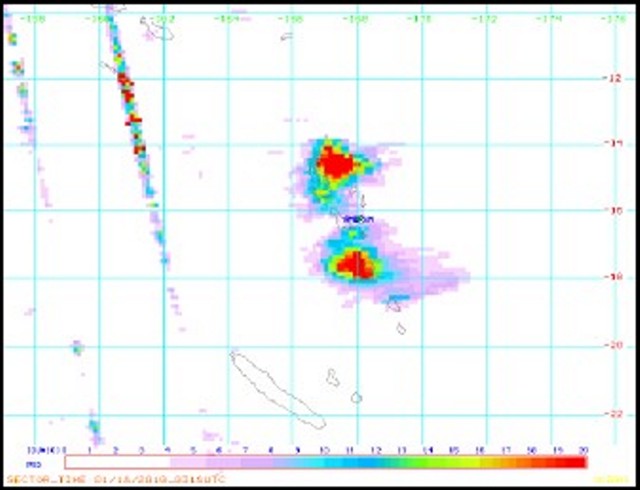 |
Figure 15. OMI satellite data showing SO2 degassing over Ambrym and Gaua volcanoes on 18 January 2010. Courtesy of OMI Sulfur Dioxide Group and DGMWR. |
Based on analyses of satellite imagery and pilot observations, the Wellington VAAC reported that at 1300 on 21 January an ash plume rose to an altitude of 3 km and drifted S. They also detected another ash cloud on MODIS satellite imagery on 26 January blowing SE at 3 km altitude.
DGMWR Bulletin Number 7 (dated 29 January 2010) reported that more gas had been emitted since 16 January 2010, followed by multiple explosions with thicker and darker ash plumes. These plumes rose to more than 3 km high and blew towards surrounding villages in the S and W (figures 15 and 16). On 24 January 2010 villagers witnessed strong Strombolian activity.
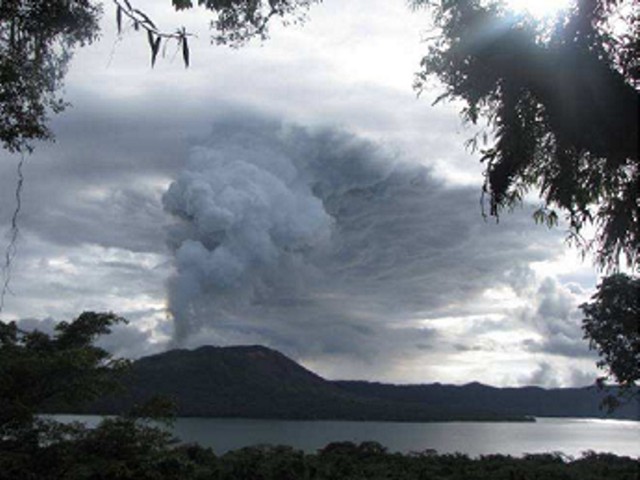 |
Figure 16. Ash and gas cloud emission directed to the S part of Gaua Island on 23 January 2009. Courtesy of DGMWR. |
The Wellington VAAC reported that on 27 January an ash cloud was seen on satellite imagery. Strong explosions were seen and heard from East Gaua on 29 January. According to the VAAC, the Vanuatu Geohazards Observatory reported that gas-and-ash plumes to altitudes of 3 km altitude that drifted S and W on 29 January and 4 February.
As of 1 February 2010, the hazard status was at Level 2 on the Vanuatu Volcano Alert Level (VVAL) (table 1), but the activity was still increasing. Visitors were advised to avoid approaching the volcano.
Table 1. The hazard status of the crisis on Gaua is addressed with a five-stage scale called the Vanuatu Volcanic Alert Level (VVAL). Courtesy of Vanuatu Geohazards Observatory.
| Hazard Level | Description |
| Level 0 | Normal low-level activity. |
| Level 1 | Increased activity, danger near crater only. |
| Level 2 | Moderate eruptions, danger close to the volcano vent, within parts of Volcanic Hazards Map Red Zone. |
| Level 3 | Large eruption, danger in specific areas within parts of Volcanic Hazards Map Red and Yellow Zones. |
| Level 4 | Very large eruption, island-wide danger (including areas within Red, Yellow and Green Zones). |
The MODIS/MODVOLC satellite thermal alerts website showed a 1-pixel alert at 2225 on 21 January 2010, the only alert during the previous year.
Geological Summary. The roughly 20-km-diameter Gaua Island, also known as Santa Maria, consists of a basaltic-to-andesitic stratovolcano with an 6 x 9 km summit caldera. Small vents near the caldera rim fed Pleistocene lava flows that reached the coast on several sides of the island; littoral cones were formed where these lava flows reached the ocean. Quiet collapse that formed the roughly 700-m-deep caldera was followed by extensive ash eruptions. The active Mount Garet (or Garat) cone in the SW part of the caldera has three pit craters across the summit area. Construction of Garet and other small cinder cones has left a crescent-shaped lake. The onset of eruptive activity from a vent high on the SE flank in 1962 ended a long period of dormancy.
Information Contacts: E. Garaebiti, S. Todman, C. Haruel, D. Charley, D. Nakedau, J. Cevuard, and A. Worwor, Department of Geology, Mines and Water Resources (DGMWR), Geohazards Unit, Vanuatu (URL: http://www.vmgd.gov.vu/vmgd/); Brad Scott, Volcano Surveillance, GNS Science, Wairakei Research Centre, Private Bag 2000, Taupo 3352, New Zealand (URL: http://www.gns.cri.nz/); OMI (Ozone Monitoring Instrument) Sulfur Dioxide Group, Joint Center for Earth Systems Technology, University of Maryland Baltimore County (UMBC), 1000 Hilltop Circle, Baltimore, MD 21250, USA (URL: https://so2.gsfc.nasa.gov/); Vanuatu Daily Post (URL: http://www.dailypost.vu/); Radio New Zealand International (URL: http://www.mzi.com/); Wellington Volcanic Ash Advisory Centre, Meteorological Service of New Zealand Limited, 30 Salamanca Road, Kelburn, PO Box 722, Wellington, New Zealand(URL: http://vaac.metservice.com/vaac/); Hawai'i Institute of Geophysics and Planetology (HIGP) Thermal Alerts System, School of Ocean and Earth Science and Technology (SOEST), Univ. of Hawai'i, 2525 Correa Road, Honolulu, HI 96822, USA (URL: http://modis.higp.hawaii.edu/).