Report on Momotombo (Nicaragua) — February 2012
Bulletin of the Global Volcanism Network, vol. 37, no. 2 (February 2012)
Managing Editor: Richard Wunderman.
Edited by Julie A. Herrick.
Momotombo (Nicaragua) Summit explosion on 12 June 2006; ~10 seismic swarms detected during 2003-2011
Please cite this report as:
Global Volcanism Program, 2012. Report on Momotombo (Nicaragua) (Herrick, J.A., and Wunderman, R., eds.). Bulletin of the Global Volcanism Network, 37:2. Smithsonian Institution. https://doi.org/10.5479/si.GVP.BGVN201202-344090
Momotombo
Nicaragua
12.423°N, 86.539°W; summit elev. 1270 m
All times are local (unless otherwise noted)
In our last report on Momotombo volcano, we reviewed recent seismic activity and fumarole characteristics in September 2003 (BGVN 28:09). Here we extract and review material chiefly from recently available reports from the Instituto Nicaragüense de Estudios Territoriales (INETER). Events included a 2004 seismic swarm and details of a small 2006 summit explosion. We present a review of seismicity from 2003 to 2011, fumarole data from October 2000 to November 2011, and a cloud-free false-color satellite image from 2006. Aviation reports of plumes from Momotombo were absent during 2003-2011. The summit explosion on 12 June 2006 was too small to register in satellite imagery.
INETER reported one seismic swarm in May 2003 (BGVN 28:09) with several events strong enough to shake the geothermal facility located on the shore of Lake Managua (star near lake on figure 11). Low seismicity and low-amplitude tremor prevailed in September 2003 (BGVN 28:09). These conditions continued through year's end with significant, located earthquakes that were consistently shallow, 1-12 km below sea level (table 5).
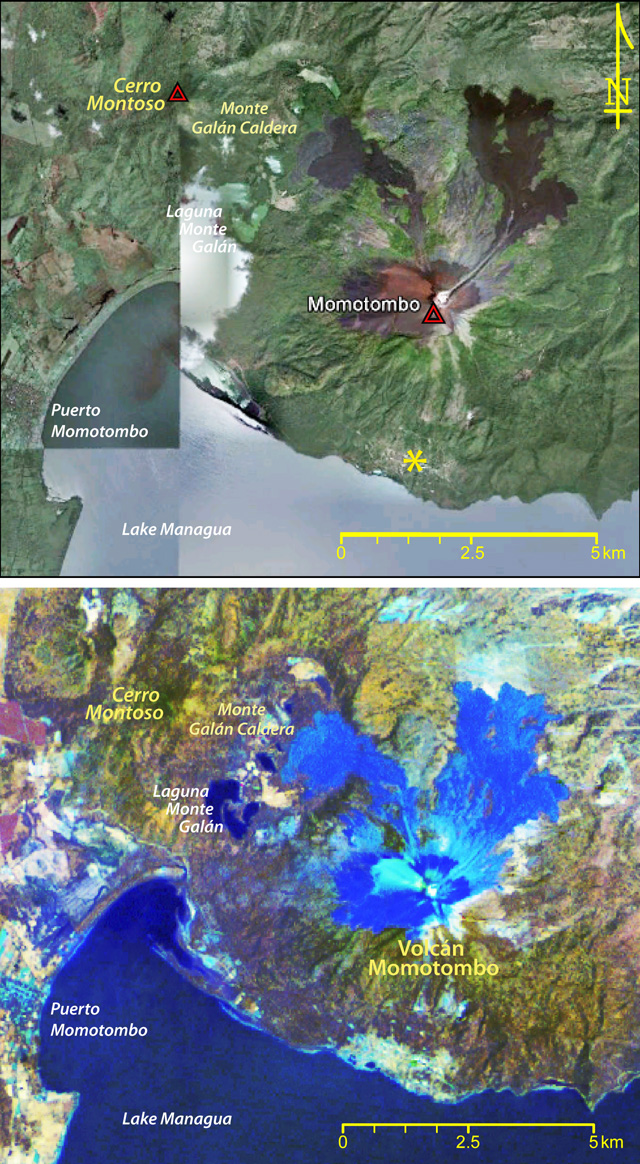 |
Figure 11. Two satellite images of Momotombo illustrating the setting and geology. (Top) This Google Earth image shows visible bands (3,2,1) from Digital Globe's QuickBird satellite and from GeoEye (at left). Both were collected in 2012. The yellow asterisk marks the location of a geothermal plant S of Momotombo volcano. (Bottom) This is a false-color composite of thermal and mid-infrared bands (5,7,6) from Landsat 7 ETM+ data (NASA Landsat Program, 2003). GVP processed this Landsat image acquired on 15 September 2006. |
Table 5. Located earthquakes recorded near Momotombo from 2003 through 2011. For each year, the table lists the number of located earthquakes, the range of their local magnitudes (ML), the range of their focal depths, and their most frequently occurring depths. Courtesy of INETER.
| Year | Earthquakes | ML | Range of focal depths (km) | Most frequent focal depths (km) |
| 2003 | 26 | 0-3.4 | 1-12 | 6 |
| 2004 | 108 | 0.7-3.4 | 1-16 | 2 |
| 2005 | 26 | 0.5-3.3 | 1-10 | 2 |
| 2006 | 40 | 0.7-3.6 | 1-53 | 6 |
| 2007 | 64 | 1.1-3.3 | 0-24 | 3 |
| 2008 | 63 | 1.2-3.7 | 2-25 | 2 |
| 2009 | 23 | 1.5-3.7 | 1-17 | 6 |
| 2010 | 21 | 0.8-3.4 | 0-12 | 2 |
| 2011 | 43 | 0.6-2.8 | 1-19 | 4 |
Remote sensing highlights volcano morphology. Figure 11 (top) contains a natural-color image of Momotombo found on Google Earth in a view that incorporates two images, the one at right containing cloud cover over a portion of the lake. Despite the mosaic issue, the image depicts land-use, vegetation, the location of Puerto Momotombo, and Holocene lava flows. The narrow, NE-trending lineation represents channelized lava flows from Momotombo's breached summit. Downslope, the lava flows separate into several lobes. This unvegetated rock dates from the 1905 effusive events that also deposited tephra on the flanks (close-up photos and captions are available in the GVP Photo Archive).
Figure 11 (bottom) presents a false-color image; visible bands were omitted. In this image, only thermal and mid-infrared data are presented (bands 5,7,6). This band combination emphasizes geology as well as surface texture. Water is navy blue; towns, roads, and some lithologies are cyan. Lava from Momotombo appears blue and cyan. Note the elongate, N-trending, dark ravines in the lower right-hand corner and the striations and meanders on the surface of the young lava flows (blue). Pink and orange areas represent various soil types where darker brown is high-moisture soil (geometric areas are agricultural fields). There are numerous small lakes (navy blue) within the Monte Galán caldera, a 2.5 x 4.0 km depression NW of Momotombo. These lakes appear pale green in the natural color image from QuickBird (top, figure 11). Blue and cyan-colored lava from Momotombo flowed over the E edge of Monte Galán caldera and ponded on the caldera floor.
Seismic swarm in 2004. According to INETER, through most of 2004, no major changes were observed or recorded at Momotombo. Tremor was recorded throughout the year with frequencies in the 5.0-15 Hz range. Field investigations in April 2004 determined that conditions at the summit crater had not changed since the last visit by INETER in July 2003. INETER measured temperature at three fumaroles located near the S flank seismic station, obtaining values of 95-97°C. Measurements from the summit fumaroles yielded temperatures within the range of previous data. A total of 18 sites have been measured reliably for many years (BGVN 22:07) with steady temperatures between ~200°C and ~700°C. During the April 2004 field visit, 10 of the 18 sites were measured. The highest values were recorded from fumaroles 7, 8, and 9, reaching over 550°C (figure 12).
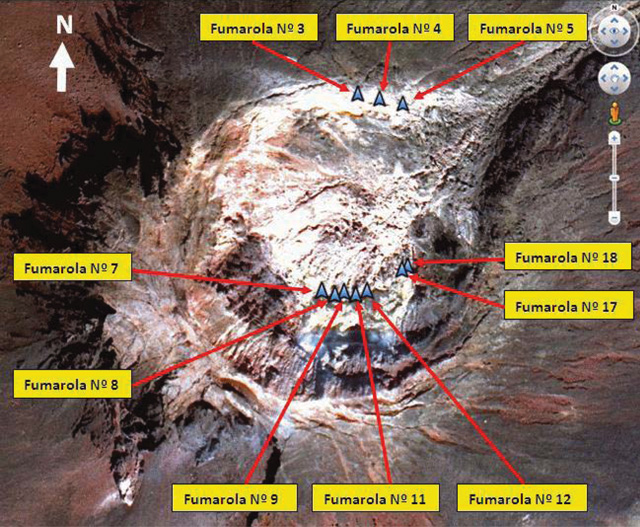 |
Figure 12. Locations of major fumarole sites within Momotombo's summit crater (which is breached to the NE). GPS coordinates for these sites including temperature measurements are provided in a table below. Courtesy of INETER. |
Seismicity began increasing slowly in September 2004, and in November, a small seismic swarm occurred. That month, more than 80 earthquakes were recorded and were classified as tornillos with dominant frequencies of 6.0-16 Hz. A total of 50 earthquakes were located, and one event was large enough to be felt. On 15 November 2004 an ML 3.4 earthquake shook the area; this was a shallow event (1.5 km below sea level). Approximately 56 earthquakes occurred in December, which were assessed as mostly volcano-tectonic (VT). No significant earthquakes were located in January or February of 2005.
INETER reviewed Momotombo's significant seismic swarms in a special report accompanying the November 2004 swarm notice. They noted that previous swarms had occurred in 1996, 1998, 1999, and 2000. Seismic swarms were generally short-lived, lasting several days at most. Based on INETER's plots of earthquake counts versus time, data binned by month suggested that one to two months of increased seismicity preceded these swarms.
Epicenters from the November 2004 swarm clustered along the W edge and S side of the Monte Galán caldera, less than 7 km NW of Momotombo's summit. Focal mechanisms were calculated from these events and suggested inverse, E-W faulting. The highest-quality events of the swarm were aligned with a shallow, SE-trending fault that is known to run between Monte Galán caldera and Momotombo. Seismicity occurred at or above 7 km depth, and the fault plane was defined as steeply dipping W.
Tornillo earthquakes and rare VT events recorded in 2005. According to INETER, activity at Momotombo was limited to variable seismicity; no visible changes were observed and thermal measurements (from satellite remote sensing) did not indicate change at the summit fumaroles. Tremor was recorded from the volcano throughout the year and consistently measured at 5 RSAM. Volcano-tectonic events (VT) were rarely recorded, and appeared only in records from February, March, and May.
Tornillo-type events dominated the 2005 record, which chiefly consisted of microseismicity. Earthquakes had dominant frequencies of 5-15 Hz and were most frequently recorded during February-April, when an average of ~2,700 events were recorded each month. In May, the station located S of Momotombo's summit was intermittent, thwarting normal monitoring capabilities. Microseismicity remained low through the rest of the year but reached ~1,000 events in December.
Two seismic swarms and an explosion in 2006. Throughout 2006, INETER reported that tremor again remained constant at 5 RSAM. Registered earthquakes were variable; 447 registered in January; 62 events in June, but during most of the year, less than 10 earthquakes per month were recorded. Two small earthquake swarms occurred during the year. One swarm, lasting from 1 to 2 June, comprised 62 events. Hypocenters were calculated for nine of these events and clustered SE of the summit.
The above-mentioned June seismic swarm preceded a gas explosion at Momotombo's summit. At ~0815 on 12 June a small, low plume was captured via a web camera (figure 13). This camera had been installed that year on the roof of the Universidad Nacional Autónoma de Nicaragua (UNAN), León, 40 km W of the volcano. Gas emissions persisted for 40 minutes. The explosion did not appear as a thermal anomaly in satellite data. In their 2006 annual report (available online), INETER released composite plots of RSAM (Momotombo's daily average seismicity) and thermal anomaly temperatures as recorded by NOAA's Advanced Very High Resolution Radiometer (AVHRR) satellite.
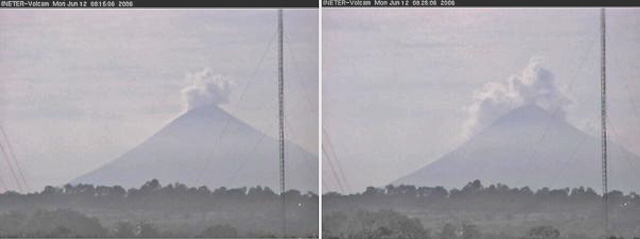 |
Figure 13. A web camera in the city of León captured this small gas explosion from Momotombo's summit on 12 June 2006 in a sequence of emissions that lasted 40 minutes. The view at 0815 (left) shows a low plume directly above the summit; 10 minutes later (right) the plume expanded to cover the upper slopes. Courtesy of INETER. |
No additional web camera images were available following the 12 June 2006 event, and the camera was officially offline from 2008 through 2011.
INETER staff visited the volcano on 12 November 2006. They found significant rockfalls had taken place at the crater, including meter-sized boulders that had fallen into the crater, especially close to fumarole 9 (figure 12). At the 10 fumaroles where INETER measured temperature they found a minimum temperature of 75°C and a maximum of 681°C (the latter was recorded at fumarole 5). These values were similar but slightly lower than those measured during previous years.
A second swarm in 2006 occurred in late December. During 27-30 December, 52 earthquakes were recorded, 17 of which were located with ML 1.4-3.5.
One earthquake swarm and new summit features observed in 2007. Activity at Momotombo in 2007 was characterized by minor seismicity. Few events were located and low-level tremor was recorded throughout the year. A small seismic swarm occurred in late January when 90 events were recorded. On 31 January the largest events of the swarm registered ML 2.2-3.1 and depths of five earthquakes were calculated.
INETER staff visited the summit on 29 June 2007. Fumarole temperatures were recorded within the crater at four sites. The central site was the hottest location, 160°C, consistent with previous measurements, although significantly lower than recorded in past years. The lowest temperature was recorded from the westernmost point in the crater, 89°C.
During the ascent, the field team made observations of ground cracks and fissures that cross Momotombo's edifice. INETER described a route following the S flank to reach the summit, from which they saw well-established fissures emitting vapor. Large, loose blocks were broken along these fissures, and cracks near the summit were noticeably wider compared to previous visits by INETER investigators.
Three seismic swarms and a field visit in 2008. INETER reported three small seismic swarms in 2008. They recorded low amplitude tremor and an absence of earthquakes in January. The first seismic swarm occurred less than 3 km below Momotombo's summit, beginning on 5 February. The small swarm was characterized by events of ML 1.2-1.9.
The second seismic swarm of 2008 occurred just weeks after the first. On 24 March 2008, a swarm with slightly larger events, ML 2.2-2.9, was located less than 4 km deep.
The swarm recorded on 5 September was larger compared to the previous 2008 swarms. Approximately 30 events were recorded with a larger range of magnitudes, ML 1.6-2.6. Two of the earthquakes were large enough to be felt, ML 1.4 on 5 September and ML 2.5 the following day. Workers at the geothermal plant on Momotombo's S flank (yellow asterisk in figure 11) reported shaking, as did workers at a cement company located 10 km S of the volcano.
One other earthquake was reported by local residents in the area of Momotombo. That was when a shallow, ML 2.9 event shook the area on 26 October 2008.
Field investigations were conducted by INETER on 20 August 2008. The team did not reach the summit of Momotombo but visited the local seismic station (on the S flank) and a cluster of fumaroles nearby. Three sites were measured with a digital thermometer yielding ~100°C values.
Relative quiescence during 2009-2010. INETER reported that tremor occasionally reached 40-50 RSAM during 2009-2010; these high values were primarily recorded in December 2010. Few earthquakes were located and during those two years they recorded ~40 relatively shallow events (no deeper than 17 km; table 5). Small seismic swarms were recorded on 28 February 2009 as well as one that started on 16 July 2010. The swarm in 2009 included one earthquake that was felt by people near the volcano associated with an ML 3.7 event. This was both the largest and one of the shallowest earthquakes from the swarm.
The seismic swarm that started on 16 July 2010 was more significant and sustained; the largest event was ML 3.4, large enough to instigate reports from the local population but smaller than the event from 2009. While only 7 events were located in 2009, 13 locations were calculated from the swarm in 2010. INETER reported that this later episode entailed VT seismicity that lasted for 10 days.
2011 elevated seismicity and two field investigations. INETER reported elevated tremor during most of 2011. From January through April 2011, tremor was reported as high as 50 RSAM. From September to November, tremor ranged from 40 to 45 RSAM. Two significant earthquakes generated interest from local residents near Momotombo and were the subject of ~70 emails sent to the INETER office on 3 June 2011. Only 1 km deep, the two events were ML 0.8 and 1.4 and occurred within ~20 minutes of each other.
INETER visited the summit twice in 2011 along with international collaborators. On 25 March two students from Heidelberg University, Germany, joined INETER scientists. The team recorded observations of the crater morphology (figure 14) and measured fumarole temperatures from 10 of the established 18 sites (figure 12). Temperatures ranged between 283-761°C; four of the fumaroles had values over 550°C. These measurements were consistent with previous summit temperatures, which also revealed higher values in the central sites. In their March 2011 report, INETER stated that fumarole characteristics distinguish Momotombo from other volcanoes in Nicaragua; no other volcano exhibits such high temperatures without displaying incandescence.
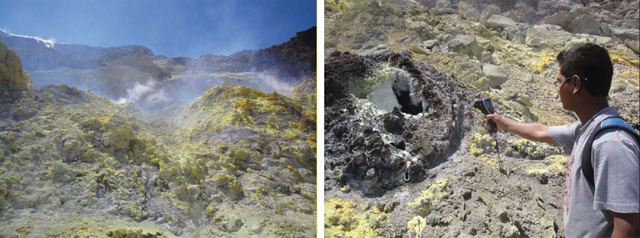 |
Figure 14. A view of sulfur deposits within Momotombo's summit crater (left) and INETER volcanologist Greyving Argüello (right) measuring temperatures with a hand-held probe at one of the well-established fumaroles. Note the pervasive yellow and white crystalline surfaces concentrated around the fumaroles. Photos taken on 25 March 2011. Courtesy of INETER. |
A field investigation with European Union participants was conducted on 26 November 2011. Significant emissions were visible escaping from the crater. In their November report, INETER suggested that meteorological conditions may have contributed to the conspicuous steam; the winds were light at the summit; humidity was relatively low that day. The team also noted that significant cracks were visible in the SE, S, and E sides of the crater rim.
Temperatures from the summit fumaroles were slightly higher than previously measured. A summary of fumarole temperatures measured during the last six site visits was provided in INETER's November 2011 report (table 6). INETER reported values in the range of 317-890°C and they explained that, in general, a gradually increasing trend was present in the data. Since October 2000, rockfalls have covered some of the previously reliable fumaroles. Some additional measurements, requiring a close approach with a thermocouple probe, were hampered by dangerously high temperatures or unstable ground.
Table 6. Temperatures measured from Momotombo's summit fumaroles from 2000 to 2011. Ten of the fumarole sites labeled in figure 12 appear here with coordinates. Courtesy of INETER.
| UTM Coordinates | Fumarole IDs | Site Visits and Temperatures (°C) | |||||||
| Easting | Northing | Oct 2000 | Dec 2000 | Mar 2001 | Jul 2003 | Nov 2005 | Mar 2011 | Nov 2011 | |
| 0550149 | 1373642 | 1 | 152 | 167 | -- | -- | 260 | -- | -- |
| 0550162 | 1373634 | 2 | 309 | 315 | 410 | -- | 320 | -- | -- |
| 0550174 | 1373645 | 3 | 263 | 250 | 380 | -- | 681 | 305 | 317 |
| 0550190 | 1373641 | 4 | 371 | 357 | 473 | 273 | 344 | 488 | 520 |
| 0550211 | 1373640 | 5 | 735 | 720 | 760 | 431 | 273 | 547 | 588 |
| 0550130 | 1373488 | 6 | 606 | 612 | 590 | 590 | 551 | -- | -- |
| 0550141 | 1373480 | 7 | 596 | 583 | 554 | 687 | 680 | 607 | 676 |
| 0550151 | 1373477 | 8 | 598 | 378 | 571 | 737 | 612 | 642 | 656 |
| 0550158 | 1373478 | 9 | 543 | 533 | 594 | 273 | -- | 748 | 820 |
| -- | -- | 10 | 604 | 588 | -- | 497 | -- | -- | -- |
| 0550167 | 1373477 | 11 | -- | -- | -- | -- | -- | 341 | 390 |
| 0550176 | 1373480 | 12 | -- | -- | -- | -- | -- | 761 | 890 |
| 0550202 | 1373497 | 17 | -- | -- | -- | -- | -- | 283 | 352 |
| 0550210 | 1373500 | 18 | -- | -- | -- | -- | -- | 459 | 795 |
References. NASA Landsat Program (2003) Landsat ETM+ scene 7dk20060915, SLC-Off, USGS, Sioux Falls, Sept. 15, 2006.
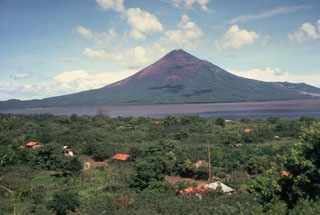
Geological Summary. Momotombo is a young stratovolcano that rises prominently above the NW shore of Lake Managua, forming one of Nicaragua's most familiar landmarks. Momotombo began growing about 4500 years ago at the SE end of the Marrabios Range and consists of a somma from an older edifice that is surmounted by a symmetrical younger cone with a 150 x 250 m wide summit crater. Young lava flows extend down the NW flank into the 4-km-wide Monte Galán caldera. The youthful cone of Momotombito forms an island offshore in Lake Managua. Momotombo has a long record of Strombolian eruptions, punctuated by occasional stronger explosive activity. The latest eruption, in 1905, produced a lava flow that traveled from the summit to the lower NE base. A small black plume was seen above the crater after a 10 April 1996 earthquake, but later observations noted no significant changes in the crater. A major geothermal field is located on the south flank.
Information Contacts: Instituto Nicaragüense de Estudios Territoriales (INETER), Apartado Postal 2110, Managua, Nicaragua (URL: http://www.ineter.gob.ni/); Global Land Cover Facility (URL: http://http://www.glcf.umiacs.umd.edu/); Washington Volcanic Ash Advisory Center (VAAC), Satellite Analysis Branch (SAB), NOAA/NESDIS E/SP23, NOAA Science Center Room 401, 5200 Auth Rd, Camp Springs, MD 20746, USA (URL: http://www.ospo.noaa.gov/Products/atmosphere/vaac/).