The Washington VAAC reported that on 14 March a possible ash emission was visible in webcam and satellite data just above Momotombo. Ash was not visible in a subsequent satellite image captured around six hours later.
Source: Washington Volcanic Ash Advisory Center (VAAC)
Numerous explosions with ash plumes and lava flow, December 2015-April 2016
Between 1996 and 2011 there were about 14 seismic swarms at Momotombo, along with fumarolic activity, and an explosion in 2006 (BGVN 37:02). According to the Instituto Nicaragüense de Estudios Territoriales (INETER), explosive activity that generated ash plumes resumed on 1 December 2015 and ended on 8 April 2016. The number of daily explosions increased beginning on 12 February 2016, with very high counts in the first half of March (figure 15).
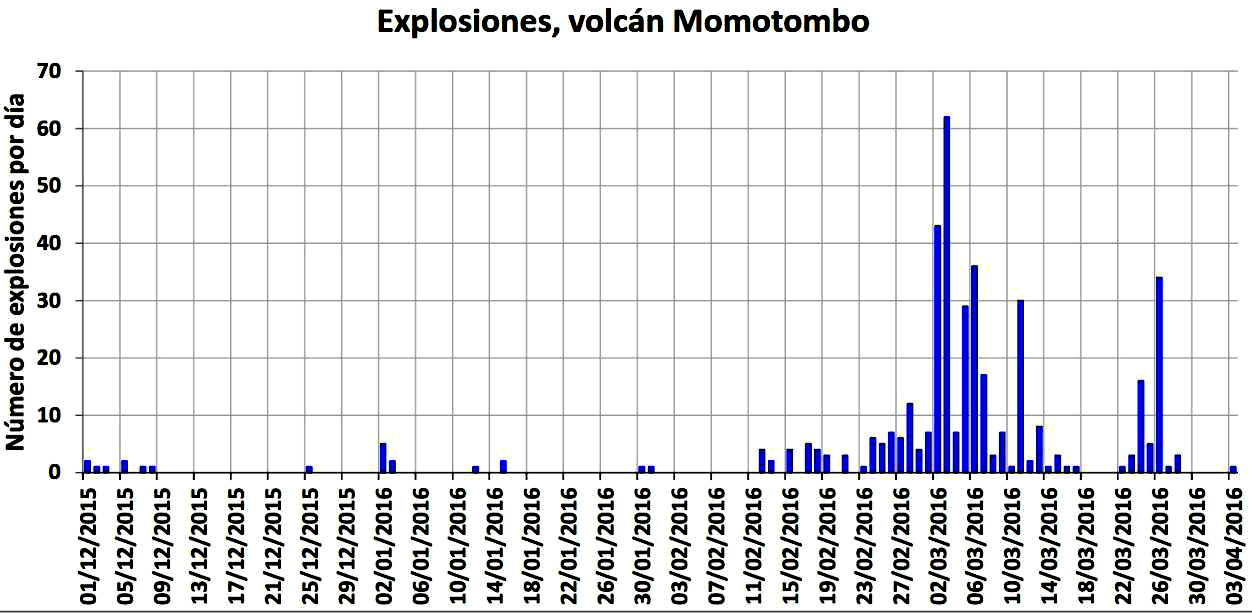 |
Figure 15. Histogram of number of daily explosions between 1 December 2015 and 3 April 2016. The total number of explosions with ash emissions was 409 (438 overall), with 314 reported in March 2016 alone (76 percent of total); 88 explosions were detected during 1 December 2015-1 March 2016. The graph does not show the few small explosions during the week subsequent to 3 April 2016. Courtesy of INETER. |
Activity during December 2015-January 2016. According to the Instituto Nicaragüense de Estudios Territoriales (INETER), an explosion at 0749 on 1 December 2015 generated a gas-and-ash plume that rose 1 km above the crater and drifted SW. Additional explosions at 0817, 0842, and 0855 generated ash plumes that rose 300 m. Gas emissions were visible the rest of the day. The Sistema Nacional para la Prevención, Mitigación y Atención de Desastres (SINAPRED) reported that during 1-2 December, explosions ejected incandescent tephra, and a slow-moving lava flow on the N flank was observed. According to a news report (La Prensa) that interviewed INETER officials, ashfall was reported in nearby communities to the W and SW, including La Concha (40 km SSE), Los Arcos, Flor de la Piedra, La Paz Centro, and Leóin. Some families in La Paz Centro (17 km SW) self-evacuated.
Based on satellite and webcam observations, and seismic data, the Washington Volcanic Ash Advisory Center (VAAC) reported that during 2-3 December 2015, ash plumes rose to an altitude of 2.4 km and drifted 90-225 km NW and WNW.
According to INETER and SINAPRED reports, activity continued through 10 December 2015. Fieldwork revealed a small, incandescent, circular crater halfway up the E flank that was fuming during the morning of 6 December. An explosion on 7 December destroyed part of the crater. On 10 December, SINAPRED reported that material had been accumulating in the crater since the beginning of the eruption on 1 December. Seismicity during 9-14 December was low and stable.
INETER reported that during 29-30 December 2015, no explosions were detected, though Real-time Seismic-Amplitude Measurements (RSAM) continued at moderate-to-high levels.
Three gas-and-ash explosions on 2 January 2016 (at 1333, 1426, and 1434) were noted in INETER and SINAPRED reports which excavated the remaining parts of the lava dome that had been emplaced about a month earlier. An ash plume rose 500 m above the crater, drifted S and SW, and caused ashfall in Puerto Momotombo (9 km WSW). Possible ash plumes from an explosion at 2129 were hidden by darkness. At 0420 on 3 January, an explosion ejected lava bombs 2 km away and caused ashfall in La Paz Centro. Lava flows had advanced as far as 2 km down the NE flank.
INETER reported that at 1209 on 12 January 2016, a large explosion ejected incandescent material onto the flanks and generated an ash plume that rose 4 km above the crater. Tephra was deposited on the E, NE, N, and NW flanks. Ash plumes drifted downwind and caused ashfall in the communities of Flor de Piedra, Amatistán, Guacucal (40 km N), La Palma, Puerto Momotombo (10 km WSW), La Sabaneta, Mira Lago, Asentamiento Miramar, Pancasán, René Linarte, Raúl Cabezas, and Betania. At around 0500 on 15 January, strong volcanic tremor was accompanied by small explosions in the crater; ejected ash and incandescent tephra were deposited on the W flank. Seismicity decreased during 16-17 January.
According to INETER, during 20-21 January both RSAM values and emissions were low. Volcanic tremor increased at 0900 on 22 January, causing RSAM values to rise to high levels. There were no emission changes. INETER recommended that the public stay at least 6 km away from the volcano.
INETER reported that during 26-29 January, RSAM values were at low to moderate levels, and gas emissions were at moderate levels. Crater incandescence from high-temperature gas emissions was observed at night during 26-27 January. A Strombolian explosion at 0344 on 30 January ejected tephra onto the E, NE, N, and NW flanks, and produced gas emissions. At 0529 on 31 January, another explosion also ejected gas, ash, and incandescent material. Ashfall was reported in the nearby communities of Boqueron, Puerto Momotombo, and La Sabaneta. Moderate levels of gas emissions drifted SW towards Puerto Momotombo.
Activity during February-April 2016. During 4-5 and 7-8 February, both RSAM values were low to moderate and emissions were at moderate levels. INETER reported moderate levels of gas emissions on 10 February; volcanic tremor and gas emissions increased to moderate-to-high levels the next day. An explosion on 12 February produced small ash emissions and ejected incandescent material onto the N and SE flanks. An explosion at 1305 on 15 February generated an ash plume that rose 2 km above the crater and ejected incandescent tephra onto the N and NE flanks.
INETER reported that during 16-17 February, two explosions accompanied by tremor produced ash emissions and ejected incandescent material onto the flanks. The first and largest explosion (at 0344) ejected incandescent tephra 800 m above the crater. RSAM values were at low-to-moderate levels. Based on webcam views and satellite images, the Washington VAAC reported that on 19 February, ash emissions rose to an altitude of 3.6 km and drifted SW and WSW. The next day, ash emissions drifted SW. On 21 February ash plumes drifted about 80 km W and 25 km E.
During 19 February-1 March, explosions were detected daily. Explosions produced ash plumes and ejected incandescent material onto the N, NE, E, and SE flanks. Ash plumes rose 1.7-2.3 km above the crater and drifted SW during 21-22 February; gas-and-ash plumes rose 1.8 km on 24 February; an ash plume rose 1 km on 25 February and a small gas-and-ash plume rose 300 m on 26 February. A pyroclastic flow traveled 3.5 km down the N and NW flanks during 23-24 February. Explosions on 27 February ejected tephra 300 m above the crater.
At 0646 on 1 March, explosions ejected gas and incandescent tephra, and an ash plume that rose 1.2 km lasted 16 minutes, causing the plume to widen and darken the sky. According to INETER, 53 small explosions during 2-3 March generated weak gas plumes that rose 300 m above the crater. On 3 March, some explosions produced ash plumes that drifted W and SW. RSAM values were at low to moderate levels. SINAPRED reported that during 5-6 March, there were 78 explosions for a total of 279 explosions detected since 1 December 2015. One of the most significant explosions occurred on 6 March. The next day gas-and-ash plumes rose as high as 1 km above the crater.
On 28 March, SINAPRED reported that 38 explosions, detected over a period of 24 hours, ejected gas-and-ash plumes and incandescent tephra. The strongest event occurred at 1140 on 27 March and generated a plume that rose 1 km.
SINAPRED reported that on 2 April, explosions produced gas-and-ash plumes and ejected incandescent tephra. According to INETER, three explosions during 5-6 April ejected incandescent material onto the flanks and produced gas-and-ash plumes that rose 500 m above the crater. During 6-7 April there were 27 small explosions. The explosions ejected some incandescent material and generated ash plumes that rose 200 m and drifted SW. RSAM values were low during 5-12 April.
Monthly INETER reports did not indicate any explosive activity after 8 April 2016. The August 2016 report indicated that seismicity was low, with only five volcano-tectonic earthquakes. The RSAM in August was a low 30 units.
Thermal anomalies during the 2015-16 eruption. Many thermal anomalies, based on MODIS satellite instruments analyzed using the MODVOLC algorithm, were observed between 2-6 December 2015, primarily on the ENE flank. Subsequently, one anomaly was observed on 1 February, 2 February, and 15 February 2016. A weak possible hotspot on the E flank was also observed on 19 February, but it was slightly S of the previous hotspots.
The Mirova (Middle InfraRed Observation of Volcanic Activity) system, also based on analysis of MODIS data, detected several anomalies within 5 km of the crater during March 2016, but none thereafter through 2016. The heat radiated by the volcanic activity (or Volcanic Radiative Power, as measured in watts) was mostly less than 0.5 watts.
Before this latest activity, a weak hotspot was also detected by MODVOLC on 7 March 2012 near the N rim of the crater, and on 19 June 2014, somewhat further down the E flank than most of the other events; neither event may have been associated with volcanism; no volcanic activity was reported on those days.
Information Contacts: Instituto Nicaragüense de Estudios Territoriales (INETER), Apartado Postal 2110, Managua, Nicaragua (URL: http://webserver2.ineter.gob.ni/vol/dep-vol.html); Sistema Nacional para la Prevención, Mitigación y Atención de Desastres (SINAPRED), Edificio SINAPRED, Rotonda Comandante Hugo Chávez 50 metros al Norte, frente a la Avenida Bolívar, Managua, Nicaragua (URL: http://www.sinapred.gob.ni/); Washington Volcanic Ash Advisory Center (VAAC), Satellite Analysis Branch (SAB), NOAA/NESDIS OSPO, NOAA Science Center Room 401, 5200 Auth Rd, Camp Springs, MD 20746, USA (URL: http://www.ospo.noaa.gov/Products/atmosphere/vaac/, archive at: http://www.ssd.noaa.gov/VAAC/archive.html); Hawai'i Institute of Geophysics and Planetology (HIGP), MODVOLC Thermal Alerts System, School of Ocean and Earth Science and Technology (SOEST), Univ. of Hawai'i, 2525 Correa Road, Honolulu, HI 96822, USA (URL: http://modis.higp.hawaii.edu/); MIROVA (Middle InfraRed Observation of Volcanic Activity), a collaborative project between the Universities of Turin and Florence (Italy) supported by the Centre for Volcanic Risk of the Italian Civil Protection Department (URL: http://www.mirovaweb.it/); La Prensa (Nicaragua) (URL: https://www.laprensani.com/).
2021: March
2020: July
2016: January
| February
| March
| April
2015: November
| December
The Washington VAAC reported that on 14 March a possible ash emission was visible in webcam and satellite data just above Momotombo. Ash was not visible in a subsequent satellite image captured around six hours later.
Source: Washington Volcanic Ash Advisory Center (VAAC)
SINAPRED reported that a seismic swarm at Momotombo began at 0657 on 6 July and by the next day a total of 51 earthquakes had been recorded. The largest event was an M 2.6 located 9 km SE of the volcano, beneath Lake Managua, at a depth of 3 km. INETER noted that the earthquakes were located along a fault and not directly related to the volcano.
Source: Sistema Nacional para la Prevención, Mitigación y Atención de Desastres (SINAPRED)
INETER reported that three explosions at Momotombo during 5-6 April ejected incandescent material onto the flanks and produced gas-and-ash plumes that rose 500 m above the crater. During 6-7 April there were 27 small explosions for a total of 438 explosions detected since 1 December 2015. The explosions ejected some incandescent material, and generated ash plumes that rose 200 m and drifted SW. RSAM values were low during 5-12 April.
Source: Instituto Nicaragüense de Estudios Territoriales (INETER)
SINAPRED reported that on 2 April explosions at Momotombo produced gas-and-ash plumes and ejected incandescent tephra.
Source: Sistema Nacional para la Prevención, Mitigación y Atención de Desastres (SINAPRED)
On 28 March SINAPRED reported that 38 explosions were detected at Momotombo over a period of 24 hours, which ejected gas-and-ash plumes and incandescent tephra. The strongest event occurred at 1140 on 27 March and generated a plume that rose 1 km.
Source: Sistema Nacional para la Prevención, Mitigación y Atención de Desastres (SINAPRED)
During 2-3 March INETER reported that 53 small explosions at Momotombo generated low-energy gas plumes that rose 300 m above the crater. On 3 March some of the explosions produced ash plumes that drifted W and SW. RSAM values were at low to moderate levels. SINAPRED reported that during 5-6 March there were 78 explosions for a total of 279 explosions detected since 1 December 2015. One of the most significant explosions occurred on 6 March. The next day gas-and-ash plumes rose as high as 1 km above the crater.
Sources: Instituto Nicaragüense de Estudios Territoriales (INETER); Sistema Nacional para la Prevención, Mitigación y Atención de Desastres (SINAPRED)
INETER reported that during 19 February-1 March explosions at Momotombo were detected daily; 88 explosions were detected during 1 December 2015-1 March 2016. Explosions produced ash plumes, and ejected incandescent material onto the N, NE, E, and SE flanks. Ash plumes rose 1.7-2.3 km above the crater and drifted SW during 21-22 February; gas-and-ash plumes rose 1.8 km on 24 February; an ash plume rose 1 km on 25 February; and a small gas-and-ash plume rose 300 m on 26 February. A pyroclastic flow traveled 3.5 km down the N and NW flanks during 23-24 February. Explosions on 27 February ejected tephra 300 m above the crater. At 0646 on 1 March explosions ejected gas and incandescent tephra; an ash plume rose 1.2 km and drifted W and SW. The gas-and-ash emissions lasted 16 minutes, causing the plume to widen and darken the sky.
Source: Instituto Nicaragüense de Estudios Territoriales (INETER)
INETER reported that during 16-17 February two explosions at Momotombo were accompanied by tremor, and produced ash emissions and ejected incandescent material onto the flanks. The first and largest explosion (recorded at 0344) ejected incandescent tephra 800 m above the crater. RSAM values were at low-to-moderate levels. Based on webcam views and satellite images, the Washington VAAC reported that on 19 February ash emissions rose to an altitude of 3.6 km (12,000 ft) a.s.l. and drifted SW and WSW. The next day ash emissions drifted SW. On 21 February ash plumes drifted about 80 km W and 25 km E.
Source: Instituto Nicaragüense de Estudios Territoriales (INETER)
INETER reported moderate levels of gas emissions at Momotombo on 10 February; volcanic tremor and gas emissions increased to moderate-to-high levels the next day. An explosion on 12 February produced small ash emissions and ejected incandescent material onto the N and SE flanks. An explosion at 1305 on 15 February generated an ash plume that rose 2 km above the crater and ejected incandescent tephra onto the N and NE flanks.
Source: Instituto Nicaragüense de Estudios Territoriales (INETER)
INETER reported that during 4-5 and 7-8 February both RSAM values at Momotombo were low to moderate and emissions were at moderate levels.
Source: Instituto Nicaragüense de Estudios Territoriales (INETER)
INETER reported that during 26-29 January RSAM values at Momotombo were at low to moderate levels, and gas emissions were at moderate levels. Crater incandescence from high-temperature gas emissions was observed at night during 26-27 January. A Strombolian explosion at 0344 on 30 January ejected tephra onto the E, NE, N, and NW flanks, and produced gas emissions. At 0529 on 31 January another explosion also ejected gas, ash, and incandescent material. Ashfall was reported in nearby areas including the communities of Boqueron, Puerto Momotombo (10 km WSW), and La Sabaneta. Moderate levels of gas emissions drifted SW towards Puerto Momotombo.
Source: Instituto Nicaragüense de Estudios Territoriales (INETER)
INETER reported that during 20-21 January both RSAM values and emissions at Momotombo were low. Volcanic tremor increased at 0900 on 22 January, causing RSAM values to rise to high levels. There were no changes to emissions. INETER recommended to the public to stay at least 6 km away from the volcano.
Source: Instituto Nicaragüense de Estudios Territoriales (INETER)
INETER reported that at 1209 on 12 January a large explosion at Momotombo ejected incandescent material onto the flanks and generated an ash plume that rose 4 km above the crater. Tephra was deposited on the E, NE, N, and NW flanks. Ash plumes drifted downwind and caused ashfall in the communities of Flor de Piedra, La Concha (40 SSE), Amatistán, Guacucal (40 km N), La Palma, Puerto Momotombo (10 km WSW), La Sabaneta, Mira Lago, Asentamiento Miramar, Pancasán, René Linarte, Raúl Cabezas, and Betania. At around 0500 on 15 January strong volcanic tremor was accompanied by small explosions in the crater; ejected ash and incandescent tephra were deposited on the W flank. Seismicity decreased during 16-17 January.
Source: Instituto Nicaragüense de Estudios Territoriales (INETER)
INETER reported that during 29-30 December no explosions at Momotombo were detected, though Real-time Seismic-Amplitude Measurements (RSAM) continued to be at moderate-to-high levels. Based on INETER and SINAPRED reports, three gas-and-ash explosions on 2 January, at 1333, 1426, and 1434, excavated the remaining parts of the lava dome which was emplaced about a month ago. An ash plume rose 500 m above the crater, drifted S and SW, and caused ashfall in Puerto Momotombo (9 km WSW). Possible ash plumes from an explosion at 2129 were hidden by darkness. At 0420 on 3 January an explosion ejected lava bombs 2 km away and caused ashfall in La Paz Centro (18 km SW). Lava flows had advanced as far as 2 km down the NE flank.
Sources: Sistema Nacional para la Prevención, Mitigación y Atención de Desastres (SINAPRED); Instituto Nicaragüense de Estudios Territoriales (INETER)
Based on INETER and SINAPRED reports, activity at Momotombo continued through 10 December. Fieldwork revealed a small, incandescent, circular crater halfway up Momotombo's E flank that was fuming during the morning on 6 December. An explosion on 7 December destroyed part of the crater. On 10 December SINAPRED reported that material had been accumulating in the crater since the beginning of the eruption on 1 December. Seismicity during 9-14 December was low and stable.
Sources: Sistema Nacional para la Prevención, Mitigación y Atención de Desastres (SINAPRED); Instituto Nicaragüense de Estudios Territoriales (INETER)
Based on satellite and webcam observations, and seismic data, the Washington VAAC reported that during 2-3 December ash plumes from Momotombo rose to an altitude of 2.4 km (8,000 ft) a.s.l. and drifted 90-225 km NW and WNW.
Source: Washington Volcanic Ash Advisory Center (VAAC)
INETER reported that at 0749 on 1 December an explosion at Momotombo generated a gas-and-ash plume that rose 1 km above the crater and drifted SW. Explosions at 0817, 0842, and 0855 generated ash plumes that rose 300 m. Gas emissions were visible the rest of the day. SINAPRED reported that during 1-2 December explosions ejected incandescent tephra and a slow-moving lava flow on the N flank was observed. Ashfall was reported in nearby communities to the W and SW, including La Concha, Los Arcos, Flor de la Piedra, La Paz Centro, and Leóin. Some families in La Paz Centro self-evacuated.
Sources: Instituto Nicaragüense de Estudios Territoriales (INETER); La Prensa (Nicaragua); Sistema Nacional para la Prevención, Mitigación y Atención de Desastres (SINAPRED)
Reports are organized chronologically and indexed below by Month/Year (Publication Volume:Number), and include a one-line summary. Click on the index link or scroll down to read the reports.
Fumarole temperatures measured
Temperatures of 465-780°C were measured in summit crater fumaroles in June. However, there was little gas emission.
Information Contacts: R. Stoiber, S. Williams, Dartmouth College; M. Carr and J. Walker, Rutgers Univ.; A. Creusot, Instituto Nicaraguense de Energía.
Summit crater fumaroles remain hot; night glow from crater
The summit crater fumaroles remained very hot in late 1980 with temperatures measured up to 735°C and reported to > 900°C. A small vapor plume continued and remote sensing revealed very low rates of SO2 emission. Portions of the crater were seen to glow red and orange when observed at night, with the highest temperatures on the steep S wall of the crater. No seismic activity has occurred recently at Momotombo.
Information Contacts: R. Stoiber, S. Williams, H.R. Naslund, L. Malinconico, and M. Conrad, Dartmouth College; A. Aburto Q. and D. Fajardo B., Instituto de Investigaciones Sísmicas.
Small continuous vapor plume
"A small, continuous vapor plume was visible in early 1981. No shallow seismicity was observed around Momotombo."
Information Contacts: R. Stoiber and S. Williams, Dartmouth College; D. de Jerez, IRENA, Managua; D. Fajardo B., Instituto de Investigaciones Sísmicas.
Small continuous plume
A small continuous plume continued to be released in early 1981. No new measurements were made. No significant seismicity has occurred recently.
Information Contacts: R. Stoiber and S. Williams, Dartmouth College; D. de Jerez, IRENA, Managua; D. Fajardo B., Instituto de Investigaciones Sísmicas.
Medium-to-high temperature gases collected
Between 14 June and 11 July, personnel from PIRPSEV, CNRS, and the volcano observation section of IPG sampled medium-to-high temperature gases from Momotombo (table 1). Maximum gas temperatures measured were 640°C.
Table 1. Analytical mean of four mid-1981 gas samples (dry, HCl excluded) from Momotombo. Courtesy of H. DeLorme and J. Cheminée.
| Component | Mean Value |
| SO2 | 24.02% |
| CO2 | 64.86% |
| H2 | 4.89% |
| H2S | 6.15% |
| N2 | 4.93% in air |
| CO | 0.07% |
| CH4 | 21 ppm |
| He | 18 ppm |
| COS | 18 ppm |
Information Contacts: H. DeLorme, Univ. de Paris; J. Cheminée, IPG, Paris.
Small continuous vapor plume
"A very small continuous vapor plume was observed in late November. Summit fumarole temperatures seemed lower than in March 1981."
Information Contacts: R. Stoiber, S. Williams, H.R. Naslund, J.B. Gemmell, and D. Sussman, Dartmouth College; D. Fajardo B., Instituto de Investigaciones Sísmicas.
Constant small plume
"A very small plume was continuously emitted in late December and early January."
Information Contacts: R. Stoiber and S. Williams, Dartmouth College; D. Fajardo B., Instituto de Investigaciones Sísmicas.
High temperatures at crater fumaroles
"Temperatures of the crater fumaroles, measured on 13 March, were as high as 800°C. Heating has occurred since December 1981, but it was not apparent whether this was a result of dry-season effects or was a true increase in heat. A small gas plume was continuously emitted."
Further Reference. Menyailov, I.A., Nikitina, L.P., Shapar, V.N., Grinenko, V.A., Buachidze, G.I., Stoiber, R., and Williams, S., 1986, The chemistry, metal content, and isotope composition of fumarolic gases from Momotombo volcano, Nicaragua, in 1982: Volcanology and Seismology, no. 2, p. 60-70.
Information Contacts: S. Williams and R. Stoiber, Dartmouth College; I. Menyailov and V. Shapar, IVP, Kamchatka; D. Fajardo B., INETER.
Small vapor plume and incandescence in summit crater
A small vapor plume was still being emitted in August and incandescence could be seen in the summit crater. The maximum fumarole temperature was 825°C . . . . Tremor and small-magnitude discrete earthquakes continued.
Information Contacts: D. Fajardo B., INETER; R. Parnell Jr., Dartmouth College.
Continued heating of the fumarole field
Continued heating of the entire fumarole field has been observed in late 1982. No significant volume change has occurred in the small plume of volcanic gas released continuously. Seismic activity remained at low levels.
Information Contacts: S. Williams and R. Stoiber, Dartmouth College; G. Hodgson V. and D. Fajardo B., INETER.
Fumarole temperatures continue to increase
Fumarolic activity increased over that of 1981, especially in the S part of the crater. Temperatures continued to increase, reaching 855°C in March . . . . Seismographs recorded magmatic movement but no discrete earthquakes.
Information Contacts: D. Fajardo B., INETER.
Fumarole chemistry changes and temperature drops after tremor ends
"In mid-March 1983 a joint Soviet-Nicaraguan team began a 3-month program of continuous observations of fumarolic activity in Momotombo's summit crater. The observations included temperature measurements and gas sampling from the highest temperature fumarole (N 9; figure 1). Immediately after sampling, the gas samples were analyzed in a field chemical laboratory near the volcano. CH2, O2, and N2 contents were determined and the S/Cl, F/Cl, and H2S/SO2 ratios were calculated, as well as the analyses shown in figure 2.
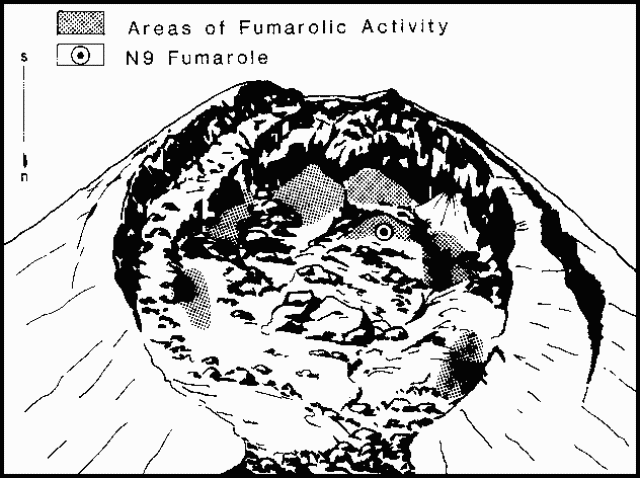 |
Figure 1. Sketch of the summit area of Momotombo, March 1983. Areas of fumarolic activity are shown by a stipple pattern. Temperatures were measured and gases sampled at the hottest fumarole (N 9), marked. |
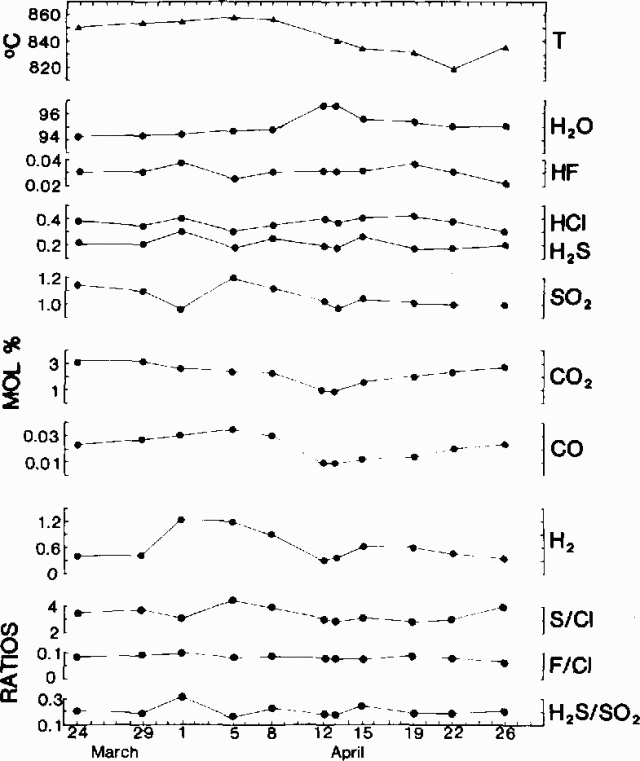 |
Figure 2. Temperature in °C (top), gas concentrations in mole % (center), and gas concentration ratios (bottom), at Momotombo's fumarole N 9, 24 March-26 April 1983. |
"During the initial period of observations (27 March-5 April) a gradual temperature rise from 851° to 858°C was noted, as well as a negligible increase in H2O and a more appreciable increase in reduced gases (H2S, H2, and CO). The seismic station registered volcanic tremor that appeared 17 March and stopped 4 April. When the tremor disappeared the temperature of fumarole N 9 immediately fell sharply, dropping 15°C in 4 days and continuing downward to 815°C by 22 April (figure 2). Simultaneous with the falling temperature, an increase in H2O content from 94.1 to 96.7 mole % and decreasing proportions of CO2, H2, CO, and other gases were registered. After 15 April the H2O content gradually decreased, reaching previous values at the end of April. The concentrations of other gases also reached previous values by that time.
"Although the variations in the temperature and gas compositions of N 9 fumarole were very appreciable, the S/Cl, F/Cl, and H2S/SO2 ratios fluctuated inside very narrow ranges of values. This fact gave us the chance to assume that no eruptive activity occurred at Momotombo during the period of observations."
Information Contacts: I. Menyailov, V. Shapar, L. Gartzeva, and V. Pilipenko, IVP, Kamchatka; R. Argeñal, D. Fajardo B., and R. Espinoza, INETER; I. Vallecillo, Proyecto Geotérmico.
Continued high fumarole temperatures
Summit fumarole temperatures have remained high, with small fluctuations probably related to seasonal rainfall variations. The maximum temperature in 1984 was 895°C in August; the same fumarole had a temperature of 875°C when measured in 1985.
Information Contacts: D. Fajardo B., INETER.
Fumarole temperatures during 1985
On 30 May Momotombo was monitored with three sensitive portable seismographs. Three microearthquakes were recorded, one of which was detected by all three instruments, and was located at 12.455°N, 86.547°W at 1.27 km depth. Fumarole temperatures remained high (table 2), but were slightly lower than the 895°C measured in August 1984.
Table 2. Fumarole temperatures at Momotombo, January-October 1985. Courtesy of INETER.
| Month | Temperature (°C) |
| January | 870 |
| February | 870 |
| March | 875 |
| April | 879 |
| May | 882 |
| June | 875 |
| July | 875 |
| August | 875 |
| September | 874 |
| October | 874 |
Further Reference. Menyailov, I.A., Nikitina, L.P., Shapar, V.N., and Pilipenko, V.P., 1986, Temperature increase and chemical change of fumarolic gases at Momotombo volcano, Nicaragua, in 1982-1985: Are these indicators of a possible eruption?: JGR, v. 91, no. B12, p. 12199-12214.
Information Contacts: D. Fajardo B., INETER.
Fumarole temperatures decline after heavy rains
Heavy rains fell along the entire Pacific coast of Nicaragua from 30 October to 3 November 1985. Of the three highest-temperature fumaroles, the temperature of one (#9) dropped 33°C around the time of the heavy rains (figure 3), while temperatures of the other two continued to increase slightly. The temperature of fumarole ##9 had recovered by late December and continued to increase gradually through early April (table 3).
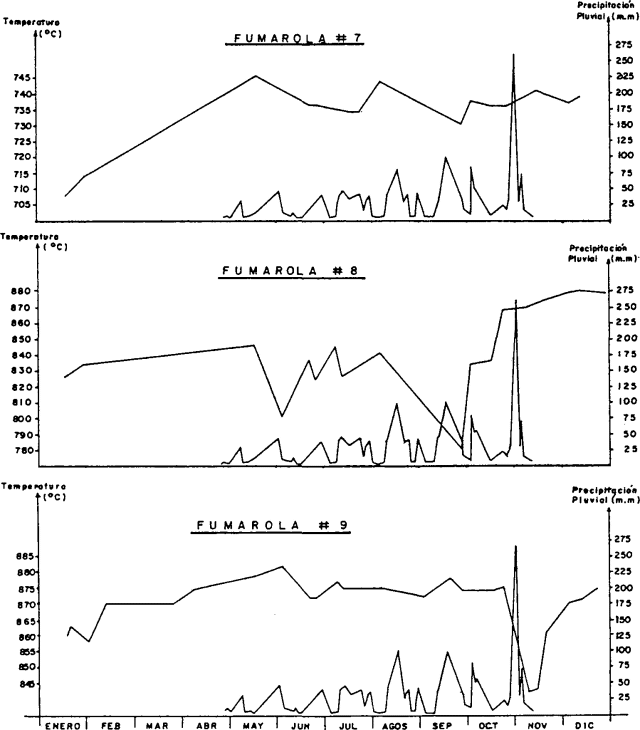 |
Figure 3. Temperature and precipitation data at three of Momotombo's fumaroles, January-December 1985. Rainfall data are from Nagarote Station, the nearest to Momotombo. Courtesy of INETER. |
Table 3. Temperatures (°C) at Momotombo's fumarole #9, October 1985-April 1986. Courtesy of INETER.
| Date | Temperature (°C) |
| 29 Oct 1985 | 875 |
| 11 Nov 1985 | 842 |
| 14 Nov 1985 | 843 |
| 20 Nov 1985 | 861 |
| 04 Dec 1985 | 869 |
| 11 Dec 1985 | 871 |
| 27 Dec 1985 | 875 |
| 15 Jan 1986 | 875 |
| 27 Jan 1986 | 880 |
| 20 Feb 1986 | 880 |
| 27 Feb 1986 | 876 |
| 06 Mar 1986 | 875 |
| 15 Mar 1986 | 880 |
| 23 Mar 1986 | 882 |
| 04 Apr 1986 | 885 |
| 10 Apr 1986 | 885 |
Information Contacts: Douglas Fajardo B. INETER.
Numerous incandescent fumaroles seen at night; large areas of hot ground
During a 4-5 March visit, incandescence from numerous fumaroles was visible at night. A maximum gas temperature of 873°C was measured by thermocouple. Surface temperatures measured by both infrared thermometers - Minolta Cyclops 33 (bandpass 8-14 µm, 1° field of view) and Cyclops 52 (bandpass 0.8-1.1 µm, 0.33° field of view) - dropped considerably beyond vent edges, but large areas of ground were hotter than 100°C. Temperatures are not corrected for emissivity and atmospheric absorption effects.
Information Contacts: C. Oppenheimer and D. Rothery, Open Univ; B. van Vyk de Vries, O. Castellon, and L. Urbina, INETER.
Burning gases from fumaroles
A maximum gas temperature of 880°C was measured (by a thermocouple) at fumarole ##9, inside the crater, on 15 April. Flames that extended up to 40 cm from vents were visible at night. Most were pale orange but some gases burned with a blue flame.
Information Contacts: C. Oppenheimer, Open Univ.
Fumarolic activity
When visited 21 and 27 April 1990, locations of fumarolic vents had changed little since a year earlier but gas temperatures had generally declined by 50-150°C. The highest recorded at vent F9 was 772°C (down from 880° on 15 April 1989) and temperatures at neighboring vents were 634° (779° in April 1989), 662° (716° in 1989), and 742° (844° in 1989). Other temperatures measured on 27 April 1990 were 575°C (F7), 702° (F8), and 439° (F12). Small dribbles, drops, or pools of amber-colored liquid sulfur were common at most fumaroles. Some very small multiple flows had smooth crusts of solid orange-brown sulfur, which turned bright yellow within minutes of removal from the hot surface. At F8, a tiny pool of liquid sulfur, a few mm deep, had a temperature of 137°C. Evidence for older, larger, sulfur flows included eroded remnants as much as 15 cm thick near F12, where up to 5 m of a pahoehoe type flow was preserved, including its front. The upper portion had apparently been eroded by water.
Information Contacts: C. Oppenheimer, Open Univ; Benjamin van Wyk de Vries, INETER.
Fumarolic activity declines
"Fumarolic activity showed a marked decrease in April. A group of French geologists has placed temperature and gas chemistry recording equipment, with a satellite link, in the crater. No data have yet been made available."
Information Contacts: B. van Wyk de Vries, O. Castellón, A. Murales, and V. Tenorio, INETER.
Small gas plume
A small gas plume was present on 6-7 January, with no apparent change from previous years.
Information Contacts: Andrea Borgia, Instituto Nazionale di Geofisica, via di Vigna Murata 605, 00143 Roma, Italy; B. van Wyk de Vries, Open Univ; Peter J. Baxter, Dept of Community Medicine, Cambridge, England.
Strong fumarolic activity but temperatures decline
Fumarolic activity in the crater remained strong and a large steam plume was observed continuously during the first week of September. Temperatures measured during a crater visit on 6 September ranged from 200-604°C. Fumarole temperatures are 100-300°C cooler that those reported in the 1980's. Native sulfur deposits were associated with low-to-moderate temperature fumaroles, while cavities of high-temperature vents were lined with a black mineral tentatively identified as magnetite. A strong SO2 odor permeated the air.
The trail to the crater had been cut by numerous rock avalanches during the past 18 months. Avalanche chutes, measuring tens of meters across and several meters deep, were most prominent near the summit, E of where the trail enters the crater. The crater can still be accessed by scrambling across these chutes, but there exists a strong potential for further avalanches of pyroclastic breccias from above. Nearby residents have recently reported deep rumblings from the volcano.
Information Contacts: Michael Conway and Andrew Macfarlane, FIU; Charles Connor, Southwest Research Institute; Oscar Leonel Urbina and Cristian Lugo, INETER.
Fumarolic activity continues to decrease
A crater inspection on the night of 27 October revealed a decrease in the fumarolic activity observed since August. Temperatures had declined at all measured locations in the three main fumarolic areas. The maximum temperature recorded was 562°C, a decrease of 33° since late September. Some small fissures with very weak incandescence were observed in the most active zone in the W crater wall. The maximum temperature was estimated at 580°C, based on the level of incandescence at measured locations.
Fumarole temperatures increased between 1976 and 1986, reaching >900°C in August 1986. Temperatures were in the 870-885°C range from January 1985 through April 1986 (SEAN 10:11 and 11:05). Similar temperatures were measured in March and April 1989 (SEAN 14:02 and 14:04), but had decreased 50-150°C by April 1990 (BGVN 15:04). Temperatures have now returned to the level observed in 1977.
Information Contacts: Alain Creusot, Instituto Nicaraguense de Energía, Managua, Nicaragua.
Voluminous plume from summit crater
The joint INETER and FIU team visited Momotombo on 13 March 1994, but did not gain access to the crater. At that time the plume rising from the summit crater was voluminous and visible for many kilometers. Temperatures of fumaroles located near the seismic station (just above the S base of the volcano) were similar to last year (though values were unreported in BGVN 18:03, 18:09, & 18:10).
Information Contacts: Cristian Lugo, INETER; Michael Conway, Andrew Macfarlane, and Peter LaFemina, Florida International Univ; John B. Murray, Ben van Wyk de Vries, and Adam Maciejewski, Open Univ.
Summit fumarole temperatures range from 238 to 655°C
Beginning on 11 June, scientists from FIU and INETER deployed a datalogger in the crater to continuously monitor fumarole temperatures and barometric pressure. The team entered the summit crater three times along a trail that crosses an active avalanche chute and leads around to the NE crater rim. Condensate and Giggenbach-type samples were collected from fumaroles along the SW crater wall. These fumaroles were very corrosive, as indicated by the destruction of the datalogger thermocouples, and had temperatures ranging from 238 to 655°C. A voluminous plume was rising from the crater on 13 March.
Information Contacts: Peter C. La Femina, Michael Conway, and Andrew MacFarlane, FIU; Christian Lugo M., INETER.
Fumarole chemistry and temperature data for 1983 and 1995
On 25 February 1995 Lucano Giannini and Orlando Vaselli (University of Florence) visited the crater of Momotombo to collect fumarolic gas samples. The chemical composition of the gases at the highest observed temperature is shown on table 4. Also shown for comparison are values obtained in 1983, when seismic activity, ground deformation, and subsurface basaltic magma emplacement took place. The temperature decrease and gas compositional changes were thought to mainly reflect the twelve years of cooling.
Table 4. Chemical analyses on Momotombo fumaroles, 1983 and 1995. Courtesy of Marino Martini, University of Florence.
| Component | 1983 | 1995 |
| Temperature (°C) | 835 | 660 |
| H2O (volume %) | 94.00 | 91.18 |
| CO2 (dry gas %) | 56.95 | 72.79 |
| SO2 (dry gas %) | 22.33 | 8.72 |
| H2S (dry gas %) | 5.00 | 3.87 |
| HCl (dry gas %) | 5.83 | 6.25 |
| HF (dry gas %) | 0.30 | 0.36 |
| B (dry gas %) | 0.081 | 0.018 |
| Br (dry gas %) | 0.0088 | 0.0073 |
| NH4 (dry gas %) | 0.0088 | 0.0038 |
| H2 (dry gas %) | 8.47 | 5.12 |
| N2 (dry gas %) | 0.78 | 2.73 |
| CO (dry gas %) | 0.25 | 0.12 |
Information Contacts: Marino Martini, University of Florence, Italy.
High seismicity and a black plume, but no crater changes
In the first days of April, strong seismic activity began beneath Momotombo. The seismic observations were made by the station located ~3 km from the crater and other stations of the national seismic network. A slight increase in activity had been observed during March. On 4 April the number of daily events reached ~100; seismicity remained high until 9 April with maximum magnitudes of about 3. On 9 and 10 April volcanic seismicity declined, but at 1510 on 10 on April a M 3.5 event occurred. Residents of La Paz Centro, ~15 km SW, saw a black cloud above the crater after the earthquake. The normal plume has a white color.
The 10 April earthquake was strongly felt at the geothermal power plant (30 MW), 5 km SW of the crater and <4 km from the epicenter. All but 12 people were evacuated from the power plant, which produces a considerable percentage of Nicaraguan electricity. Afterwards, until 0900 on 11 April, there were ~500 small events registered. On 11 April at 1600, some stronger events with magnitudes of about 3 were again recorded. All seismic events were impulsive, with frequencies of ~10 Hz, and very shallow. Small-amplitude tremor events lasted between some minutes and several hours. An overflight on 11 April to take photos and a video revealed no significant changes in the crater.
Crater fumarole temperatures reported by Alain Creusot have remained unchanged for the past year. During the last three inspections (25 February, 11 April, and 16 April) the maximum temperature was ~770°C. The six areas of fumarolic activity measured in April had temperatures ranging from 375 to 768°C (figure 4).
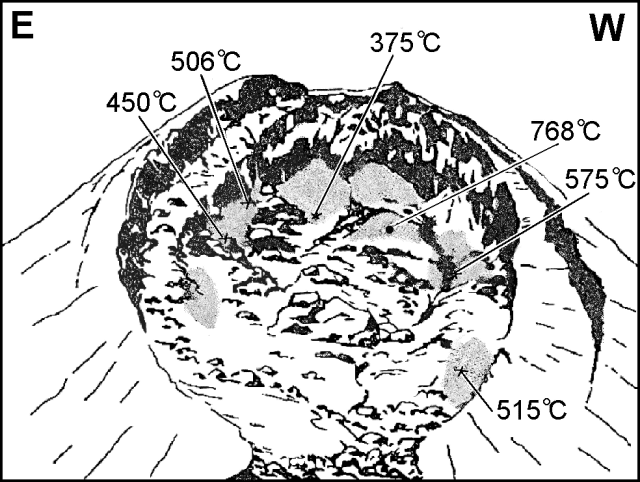 |
Figure 4. Sketch of the summit area of Momotombo showing fumarole temperatures, 16 April 1996. Areas of fumarolic activity are shown in gray. View is towards the S; the crater is ~150 m wide. Courtesy of Alain Creusot. |
Information Contacts: Wilfried Strauch and Martha Navarro, INETER, Apartado Postal 2110, Managua, Nicaragua; Alain Creusot, Instituto Nicaraguense de Energía, Managua, Nicaragua.
Seasonally varying fumarole temperatures
During summit area visits on 30 October and 29 November, measured fumarole temperatures ranged from 215 to 643°C and from 130 to 677°C, respectively (figure 5). Fumarole temperatures on 29 November were generally higher than those on 30 October but lower than those in April 1996 (BGVN 21:04). These fumarole temperature variations were mainly believed to be due to seasonal changes. An intense rainy season, especially in October, caused strong erosion of the crater, and might account for the lower fumarole temperatures measured on 30 October.
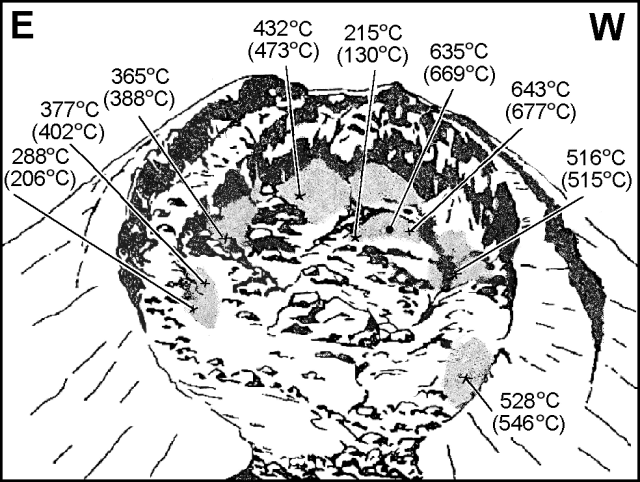 |
Figure 5. Sketch of the summit area of Momotombo showing fumarole temperatures on 30 October (top number) and 29 November 1996 (bottom number in parentheses). Areas of fumarolic activity are gray. View is towards the S; the crater is ~150 m wide. Courtesy of Alain Creusot. |
Information Contacts: Alain Creusot, Instituto Nicaraguense de Energía, Managua, Nicaragua.
June fumarole temperatures
Open University researchers provided the following report. "On 3 June we took gas samples from fumarole numbers 14, 9, and 7 (figure 6). There were many areas with fresh bright yellow sulfur flows, suggesting that temperatures had risen over the last few months thus causing the sulfur to melt. Near fumarole number 6 there were small (centimeter-wide) accumulations of clear, golden molten sulfur. After putting a gas condenser over fumarole number 9 the adjacent fumarolic area began to fracture and molten sulfur began to emerge from fissures there."
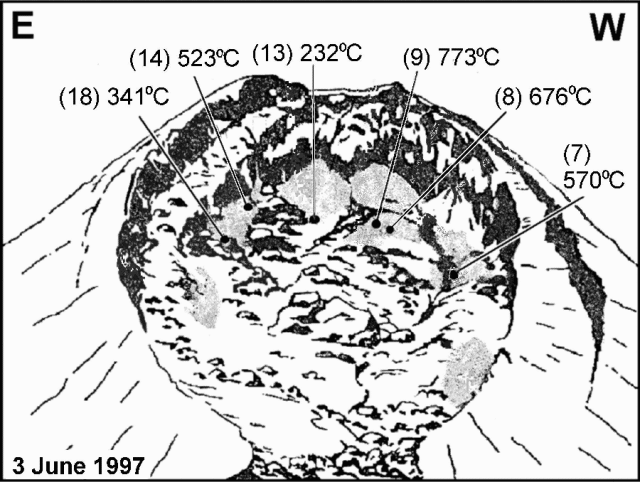 |
Figure 6. Sketch of the summit area of Momotombo showing fumarole temperatures on 3 June 1997. Numbers in parenthesis are "fumarole numbers;" areas of fumarolic activity are gray. View is towards the S; the crater is ~150 m wide. Courtesy of Alain Creusot and Benjamin van Wyk de Vries. |
Information Contacts: Benjamin van Wyk de Vries, Department of Earth Sciences, The Open University, Milton Keynes MK7 6AA, United Kingdom (URL: http://www.open.ac.uk/science/environment-earth-ecosystems/).
Higher-than-normal fumarole temperatures
Measurements during a 28 February visit revealed higher-than-normal fumarolic temperatures in the summit area. The high temperatures were associated with a recent period of aridity, during which time fumarolic activity increased. Temperatures ranged from 318-748°C (figure 7).
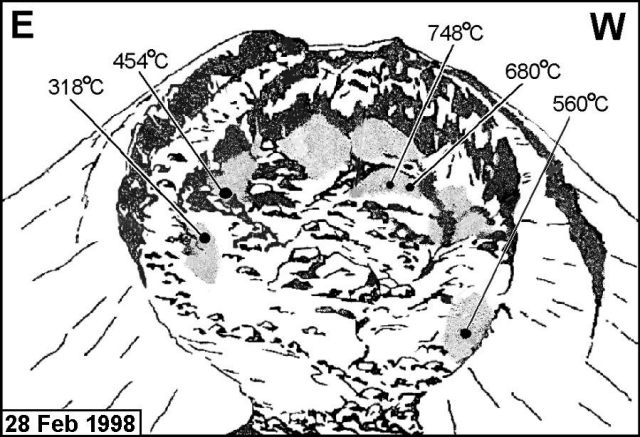 |
Figure 7. Sketch of Momotombo's active crater showing fumarole temperatures on 28 February. Areas of fumarolic activity are gray. View is towards the S; the crater is ~150 m wide. Courtesy of A. Creusot. |
Information Contacts: Alain Creusot, Instituto Nicaraguense de Energía, Managua, Nicaragua.
Fumarole temperatures remain high in April 1999
Fumarole temperatures have been rising on Momotombo since 1996. An April 1996 summit visit reported that temperatures were unchanged over the past year (BGVN 21:04), but by November of that year the temperatures had begun to fluctuate (BGVN 21:11). Fumarole temperatures in November 1996 registered between 130 and 677°C, higher than those recorded in October but lower than those in April. The flux was attributed to seasonal change; an intense rainy season and associated erosion accounted for the October lows. Temperatures had increased again by July 1997 to 232-773°C (BGVN 22:07).
In October 1997 higher than normal fumarole temperatures were attributed to arid conditions. During a 1 September visit to the summit area, fumarole temperatures were measured at their usual points and found escalated. The maximum temperature was 740°C. Because the temperature increase coincided with a dry spell, the heightened fumarolic activity was not deemed alarming.
Elevated temperatures were also reported in March 1998 (BGVN 23:03). Measurements during a 28 February visit revealed higher-than-normal fumarolic temperatures in the summit area. The high temperatures were again associated with a recent period of aridity, during which time fumarolic activity increased. Temperatures ranged from 318 to 748°C.
On 24 April 1999 the summit area was visited and temperatures again found inflated in the five areas of fumarolic activity. The maximum temperatures were, in the south area of the crater, 725°C and, in the north, 550°C. Significant changes in the crater morphology were noted and attributed to the strong erosion induced by Hurricane Mitch in October 1998.
Information Contacts: Alain Creusot, Instituto Nicaraguense de Energía, Managua, Nicaragua.
Very low seismicity during April-November 1999
Seismic activity registered at Momotombo stayed at consistently low levels during the seven months of April-November 1999, with a total of 81 small earthquakes, 30 of them in May and 26 in August. Only a few of these events were able to be located. RSAM (real-time seismic amplitude measurement) values never rose above two units. Starting in December, and continuing through March 2000, the seismic station only worked intermittently. Very few events were detected during this period, including two earthquakes when the station worked during 1-15 March.
Information Contacts: Wilfried Strauch and Virginia Tenorio, Dirección General de Geofísica, Instituto Nicaragüense de Estudios Territoriales (INETER), Apartado 1761, Managua, Nicaragua (URL: http://www.ineter.gob.ni/).
Increased seismic activity in June
Seismicity remained stable between November 1999 and April 2000. In May 2000 a seismic swarm began near the volcano, and in June there was heightened seismicity.
During 9-11 June the INETER seismic network registered over 500 earthquakes near Momotombo, 100 of which were located. Many of the earthquakes were between M 3.4 and 4.1 (figure 8), and occurred at depths less than 5 km. The small epicentral area was directly under a geothermal plant on the S slope of the volcano, between Momotombo's crater and the coast of Lake Managua. A similar area was the site of seismic swarms in past years, with the most recent occurrence in May 2000. Some of the earthquakes on 9 June were felt by the personnel of the geothermal plant 5 km SW of the crater and one was felt by several people in the town of Nagarote. INETER stated that an eruption could affect the geothermal plant's 96 employees, as well as residents of towns bordering the volcano. Continuous seismic tremor was also observed at the volcano, which was attributed to volcanic processes rather than movements at tectonic faults. The number of seismic events began to decrease on 11 June. From 12 to 13 June, 60 earthquakes occurred with seven epicenters located. In comparison, 150 earthquakes occurred from 9 to 10 June with 38 epicenters located. After 13 June the number of earthquakes gradually decreased to normal levels.
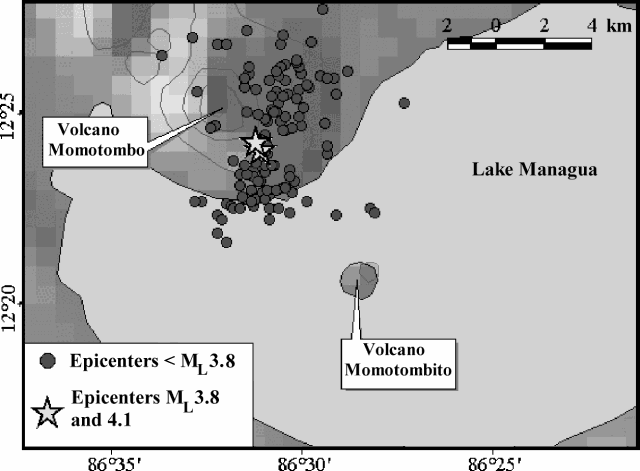 |
Figure 8. Locations of earthquake epicenters at Momotombo with magnitudes less than 3.8 (circles), and magnitudes between 3.8 and 4.1 (stars) from 9 to 16 June 2000. Courtesy of INETER. |
Julio Alvarez, Jorge Cross, Arming Saballos (all INETER/Vulcanología), and Eduardo Mayorga visited the volcano on 15 June to measure the temperature of fumaroles in the crater zone. Temperature measurements conducted at fumaroles in the volcano's dome yielded values between 255 and 933 °C (figure 9). The highest temperature was found near the N edge of the crater.
 |
Figure 9. Sketch of Momotombo's active crater showing fumarole temperatures on 15 June 2000. Areas of fumarolic activity are gray. View is towards the S; the crater is ~ 150 m wide. Courtesy of INETER. |
Information Contacts: Wilfried Strauch and Virginia Tenorio, Dirección General de Geofísica, Instituto Nicaragüense de Estudios Territoriales (INETER), Apartado 1761, Managua, Nicaragua (URL: http://www.ineter.gob.ni/).
Previously unreported low activity during March and April 2000
This report discusses previously unreported information about the activity during March and April 2000. This interval of low activity occurred prior to one with heightened seismicity during May and June 2000 (BGVN 25:06).
The seismic swarm that began in May 2000 reached its peak during 9-11 June when the INETER seismic network registered over 500 earthquakes (BGVN 25:06). Many of the earthquake magnitudes were between 3.4 and 4.1, and the small epicentral area was directly under a geothermal plant on the S slope of the volcano. INETER reported that prior to the seismic activity, in March 2000, seismicity was low, with only two seismic events during the month. They did not visit the volcano during March.
On 9 April, Pierre Delmelle of the Université de Montréal along with local guides visited the volcano's crater. According to Delmelle, the crater was horseshoe-shaped and recent landslides had occurred down the crater's walls. He also noted that the majority of the fumarolic activity took place in the bottom of the crater. Gas was released from the fumaroles with very weak pressure, and temperatures ranged from 100 to 460°C. INETER personnel made a previous trip to the crater interior in September 1998 and found a lack of fresh landslides down the crater walls; fumarolic gas temperatures were 79 to 235°C.
Information Contacts: Wilfried Strauch and Virginia Tenorio, Dirección General de Geofísica, Instituto Nicaragüense de Estudios Territoriales (INETER), Apartado 1761, Managua, Nicaragua (URL: http://www.ineter.gob.ni/); Pierre Delmelle, Département de Géologie, Université de Montréal, Montréal, Québec H3C 3J7, Canada.
Some seismic swarms and tornillos; stable fumarole temperatures
Instituto Nicaraguense de Estudios Territoriales (INETER) reports from March 2002 through September 2003 indicate that seismicity has generally been low. Occasional visits to the summit of Momotombo (figure 10) are made to sample gases and take temperature measurements.
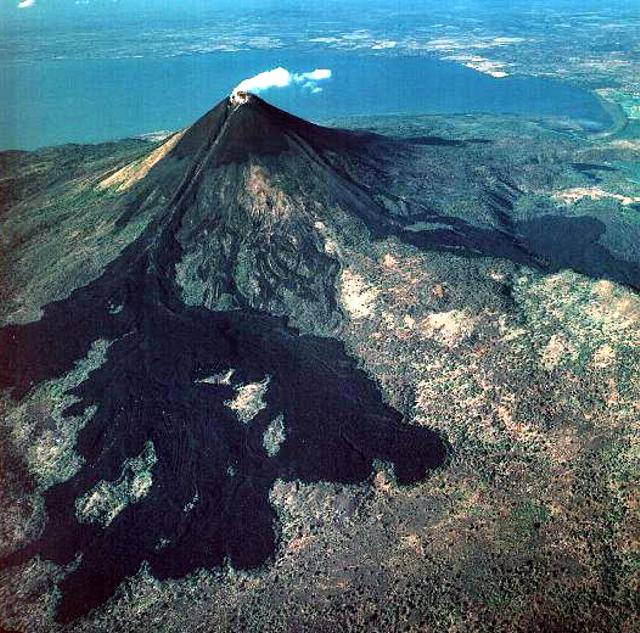 |
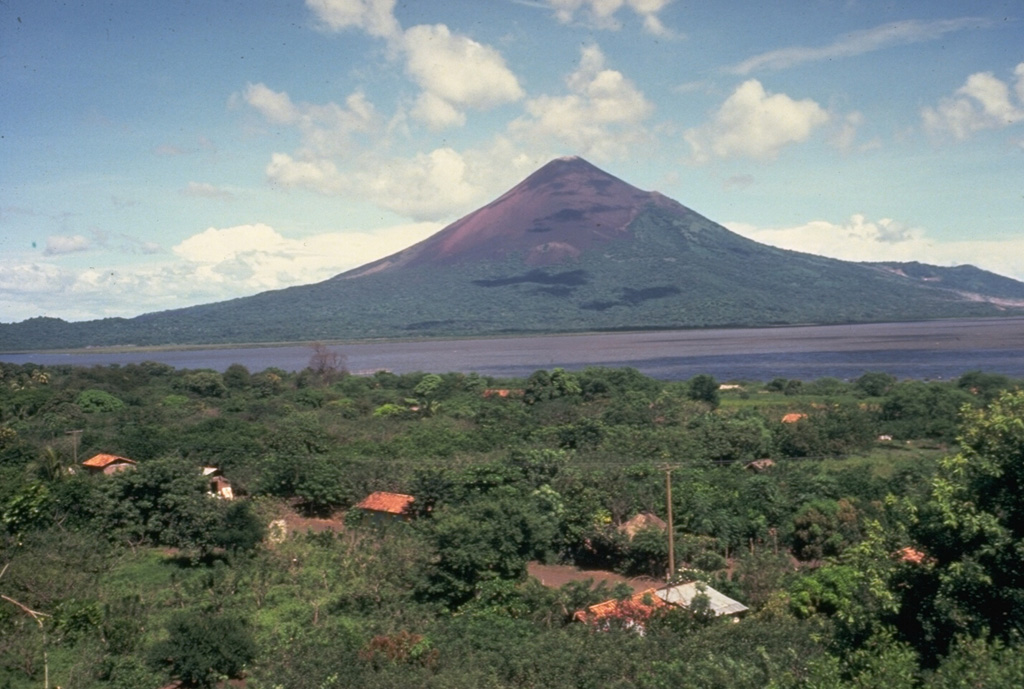
Figure 10. Photograph of Momotombo (unknown date) showing the E flank and the 1905 lava flows. Note that a small steam plume is rising from the crater fumaroles. Lake Managua is in the background. Courtesy of INETER. |
The first visit during this time period was on 13 April 2002. Temperature measurements in the crater fumaroles showed little variation from previous measurements, except for fumarole 14, which showed an increase from 434 to 583°C. There were no visits in May; seismic monitoring recorded only one earthquake.
Seismicity increased during the early part of June, with a seismic cluster from 1 to 11 June SW of Momotombo consisting of more than 120 earthquakes. Thirty of these earthquakes occurred on 9 June. An event on 8 June was felt at the geothermal plant W of the volcano. The majority of these events were volcano-tectonic earthquakes with frequencies between 15 and 20 Hz. The unusual tornillos (screw-type events) have continued to occur at Momotombo, usually lasting 2-5 seconds with a dominant frequency of 5 Hz.
Only 16 earthquakes were recorded in July, four of them on 12 July; none were located. Tornillos continued with a frequency of 7.5 Hz in both July and August. Seismicity increased in August with a small seismic cluster and 176 registered earthquakes, mainly volcano-tectonic. The majority of the activity took place on 1 and 2 August, including one event felt by staff at the geothermal plant. Seismicity dropped dramatically in September, October, and November, with 7 and 12 volcano-tectonic events in September and October, respectively, and none in November. Visits were made on 19, 20, 21, and 22 November for gas sampling and temperature measurements. Temperatures were measured in 12 fumaroles and around the seismic stations at the base of the volcano. The highest temperatures were found at fumaroles 3, 4, 5, 8, and 9, with the maximum temperature of 768°C at fumarole 9. Temperatures at the three fumaroles around the seismic station were 89.9°C, 99.1°C, and 90.2°C.
Seismicity increased again in December 2002 and January 2003. A seismic cluster of 88 events was recorded during 24-25 December. Locations determined for 18 of the events put them all very close to the volcano. In January 55 tectonic earthquakes were registered. After January, seismicity dropped considerably. No earthquakes were registered in February, and only one was recorded in March.
Site visits in February included walking around the crater; no morphological changes were observed. The visit also included gas sampling and temperature measurements. Fumaroles 8 and 9 measured 759°C and 762°C, respectively; more monitoring on 8 and 27 March showed that temperatures were staying relatively constant. No visits were made in April, May, or June, but seismic monitoring continued. Although only one volcano-tectonic earthquake registered in April, tornillos continued, with frequencies above 12 Hz. There were 35 volcano-tectonic events in May, including a three-hour-long cluster on 30 May. Six seismic events registered in June.
A visit was made to the volcano on 12 July 2003; temperatures were similar to the previous months, ranging from 243°C at fumarole 13 to 737°C at fumarole 9. Two earthquakes registered in August; seismicity stayed low through September.
Information Contacts: Martha Navarro, Emilio Talavera, and Virginia Tenorio, Instituto Nicaraguense de Estudios Territoriales (INETER), Dirección General de Geofísica, Apartado Postal 2110, Managua, Nicaragua (URL: http://www.ineter.gob.ni/).
Summit explosion on 12 June 2006; ~10 seismic swarms detected during 2003-2011
In our last report on Momotombo volcano, we reviewed recent seismic activity and fumarole characteristics in September 2003 (BGVN 28:09). Here we extract and review material chiefly from recently available reports from the Instituto Nicaragüense de Estudios Territoriales (INETER). Events included a 2004 seismic swarm and details of a small 2006 summit explosion. We present a review of seismicity from 2003 to 2011, fumarole data from October 2000 to November 2011, and a cloud-free false-color satellite image from 2006. Aviation reports of plumes from Momotombo were absent during 2003-2011. The summit explosion on 12 June 2006 was too small to register in satellite imagery.
INETER reported one seismic swarm in May 2003 (BGVN 28:09) with several events strong enough to shake the geothermal facility located on the shore of Lake Managua (star near lake on figure 11). Low seismicity and low-amplitude tremor prevailed in September 2003 (BGVN 28:09). These conditions continued through year's end with significant, located earthquakes that were consistently shallow, 1-12 km below sea level (table 5).
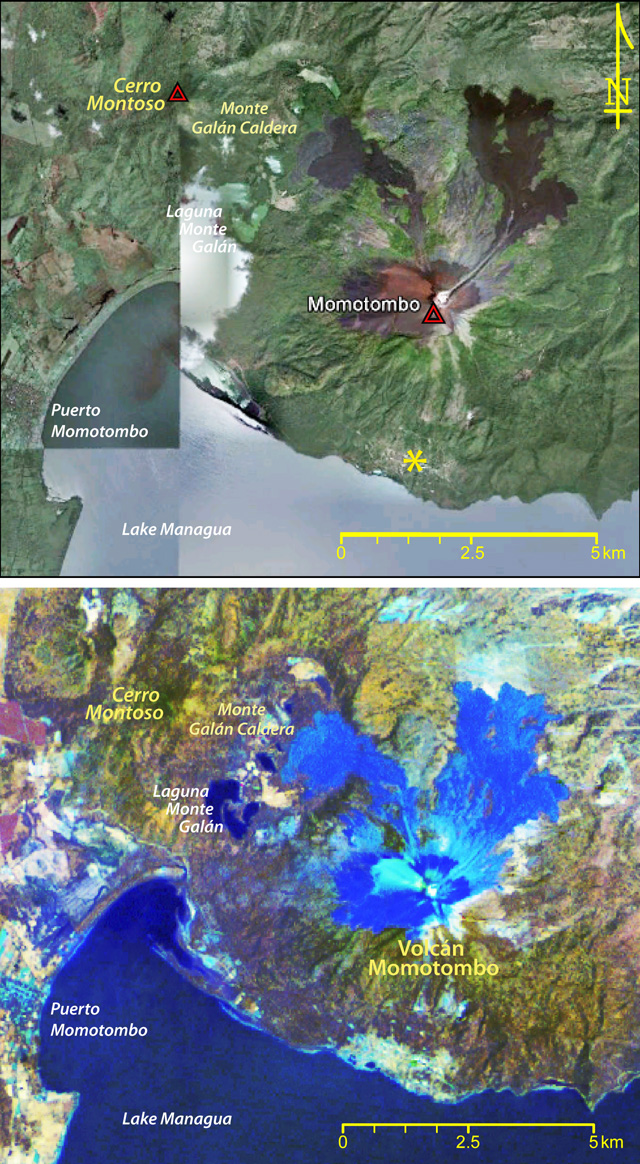 |
Figure 11. Two satellite images of Momotombo illustrating the setting and geology. (Top) This Google Earth image shows visible bands (3,2,1) from Digital Globe's QuickBird satellite and from GeoEye (at left). Both were collected in 2012. The yellow asterisk marks the location of a geothermal plant S of Momotombo volcano. (Bottom) This is a false-color composite of thermal and mid-infrared bands (5,7,6) from Landsat 7 ETM+ data (NASA Landsat Program, 2003). GVP processed this Landsat image acquired on 15 September 2006. |
Table 5. Located earthquakes recorded near Momotombo from 2003 through 2011. For each year, the table lists the number of located earthquakes, the range of their local magnitudes (ML), the range of their focal depths, and their most frequently occurring depths. Courtesy of INETER.
| Year | Earthquakes | ML | Range of focal depths (km) | Most frequent focal depths (km) |
| 2003 | 26 | 0-3.4 | 1-12 | 6 |
| 2004 | 108 | 0.7-3.4 | 1-16 | 2 |
| 2005 | 26 | 0.5-3.3 | 1-10 | 2 |
| 2006 | 40 | 0.7-3.6 | 1-53 | 6 |
| 2007 | 64 | 1.1-3.3 | 0-24 | 3 |
| 2008 | 63 | 1.2-3.7 | 2-25 | 2 |
| 2009 | 23 | 1.5-3.7 | 1-17 | 6 |
| 2010 | 21 | 0.8-3.4 | 0-12 | 2 |
| 2011 | 43 | 0.6-2.8 | 1-19 | 4 |
Remote sensing highlights volcano morphology. Figure 11 (top) contains a natural-color image of Momotombo found on Google Earth in a view that incorporates two images, the one at right containing cloud cover over a portion of the lake. Despite the mosaic issue, the image depicts land-use, vegetation, the location of Puerto Momotombo, and Holocene lava flows. The narrow, NE-trending lineation represents channelized lava flows from Momotombo's breached summit. Downslope, the lava flows separate into several lobes. This unvegetated rock dates from the 1905 effusive events that also deposited tephra on the flanks (close-up photos and captions are available in the GVP Photo Archive).
Figure 11 (bottom) presents a false-color image; visible bands were omitted. In this image, only thermal and mid-infrared data are presented (bands 5,7,6). This band combination emphasizes geology as well as surface texture. Water is navy blue; towns, roads, and some lithologies are cyan. Lava from Momotombo appears blue and cyan. Note the elongate, N-trending, dark ravines in the lower right-hand corner and the striations and meanders on the surface of the young lava flows (blue). Pink and orange areas represent various soil types where darker brown is high-moisture soil (geometric areas are agricultural fields). There are numerous small lakes (navy blue) within the Monte Galán caldera, a 2.5 x 4.0 km depression NW of Momotombo. These lakes appear pale green in the natural color image from QuickBird (top, figure 11). Blue and cyan-colored lava from Momotombo flowed over the E edge of Monte Galán caldera and ponded on the caldera floor.
Seismic swarm in 2004. According to INETER, through most of 2004, no major changes were observed or recorded at Momotombo. Tremor was recorded throughout the year with frequencies in the 5.0-15 Hz range. Field investigations in April 2004 determined that conditions at the summit crater had not changed since the last visit by INETER in July 2003. INETER measured temperature at three fumaroles located near the S flank seismic station, obtaining values of 95-97°C. Measurements from the summit fumaroles yielded temperatures within the range of previous data. A total of 18 sites have been measured reliably for many years (BGVN 22:07) with steady temperatures between ~200°C and ~700°C. During the April 2004 field visit, 10 of the 18 sites were measured. The highest values were recorded from fumaroles 7, 8, and 9, reaching over 550°C (figure 12).
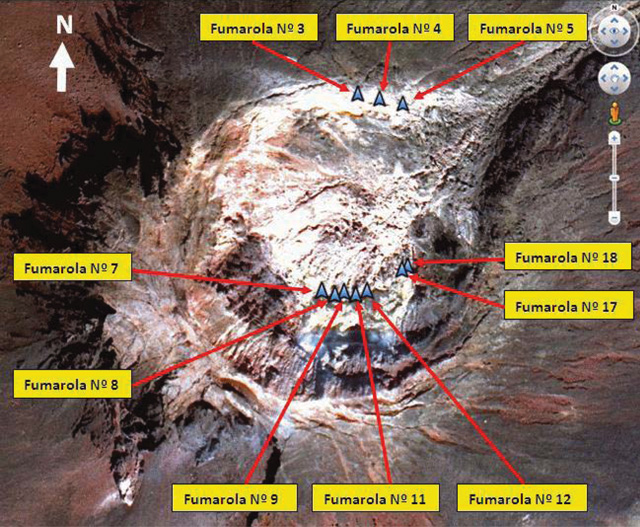 |
Figure 12. Locations of major fumarole sites within Momotombo's summit crater (which is breached to the NE). GPS coordinates for these sites including temperature measurements are provided in a table below. Courtesy of INETER. |
Seismicity began increasing slowly in September 2004, and in November, a small seismic swarm occurred. That month, more than 80 earthquakes were recorded and were classified as tornillos with dominant frequencies of 6.0-16 Hz. A total of 50 earthquakes were located, and one event was large enough to be felt. On 15 November 2004 an ML 3.4 earthquake shook the area; this was a shallow event (1.5 km below sea level). Approximately 56 earthquakes occurred in December, which were assessed as mostly volcano-tectonic (VT). No significant earthquakes were located in January or February of 2005.
INETER reviewed Momotombo's significant seismic swarms in a special report accompanying the November 2004 swarm notice. They noted that previous swarms had occurred in 1996, 1998, 1999, and 2000. Seismic swarms were generally short-lived, lasting several days at most. Based on INETER's plots of earthquake counts versus time, data binned by month suggested that one to two months of increased seismicity preceded these swarms.
Epicenters from the November 2004 swarm clustered along the W edge and S side of the Monte Galán caldera, less than 7 km NW of Momotombo's summit. Focal mechanisms were calculated from these events and suggested inverse, E-W faulting. The highest-quality events of the swarm were aligned with a shallow, SE-trending fault that is known to run between Monte Galán caldera and Momotombo. Seismicity occurred at or above 7 km depth, and the fault plane was defined as steeply dipping W.
Tornillo earthquakes and rare VT events recorded in 2005. According to INETER, activity at Momotombo was limited to variable seismicity; no visible changes were observed and thermal measurements (from satellite remote sensing) did not indicate change at the summit fumaroles. Tremor was recorded from the volcano throughout the year and consistently measured at 5 RSAM. Volcano-tectonic events (VT) were rarely recorded, and appeared only in records from February, March, and May.
Tornillo-type events dominated the 2005 record, which chiefly consisted of microseismicity. Earthquakes had dominant frequencies of 5-15 Hz and were most frequently recorded during February-April, when an average of ~2,700 events were recorded each month. In May, the station located S of Momotombo's summit was intermittent, thwarting normal monitoring capabilities. Microseismicity remained low through the rest of the year but reached ~1,000 events in December.
Two seismic swarms and an explosion in 2006. Throughout 2006, INETER reported that tremor again remained constant at 5 RSAM. Registered earthquakes were variable; 447 registered in January; 62 events in June, but during most of the year, less than 10 earthquakes per month were recorded. Two small earthquake swarms occurred during the year. One swarm, lasting from 1 to 2 June, comprised 62 events. Hypocenters were calculated for nine of these events and clustered SE of the summit.
The above-mentioned June seismic swarm preceded a gas explosion at Momotombo's summit. At ~0815 on 12 June a small, low plume was captured via a web camera (figure 13). This camera had been installed that year on the roof of the Universidad Nacional Autónoma de Nicaragua (UNAN), León, 40 km W of the volcano. Gas emissions persisted for 40 minutes. The explosion did not appear as a thermal anomaly in satellite data. In their 2006 annual report (available online), INETER released composite plots of RSAM (Momotombo's daily average seismicity) and thermal anomaly temperatures as recorded by NOAA's Advanced Very High Resolution Radiometer (AVHRR) satellite.
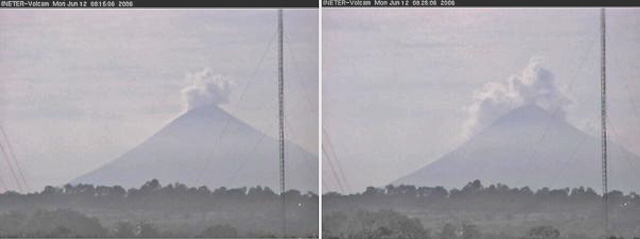 |
Figure 13. A web camera in the city of León captured this small gas explosion from Momotombo's summit on 12 June 2006 in a sequence of emissions that lasted 40 minutes. The view at 0815 (left) shows a low plume directly above the summit; 10 minutes later (right) the plume expanded to cover the upper slopes. Courtesy of INETER. |
No additional web camera images were available following the 12 June 2006 event, and the camera was officially offline from 2008 through 2011.
INETER staff visited the volcano on 12 November 2006. They found significant rockfalls had taken place at the crater, including meter-sized boulders that had fallen into the crater, especially close to fumarole 9 (figure 12). At the 10 fumaroles where INETER measured temperature they found a minimum temperature of 75°C and a maximum of 681°C (the latter was recorded at fumarole 5). These values were similar but slightly lower than those measured during previous years.
A second swarm in 2006 occurred in late December. During 27-30 December, 52 earthquakes were recorded, 17 of which were located with ML 1.4-3.5.
One earthquake swarm and new summit features observed in 2007. Activity at Momotombo in 2007 was characterized by minor seismicity. Few events were located and low-level tremor was recorded throughout the year. A small seismic swarm occurred in late January when 90 events were recorded. On 31 January the largest events of the swarm registered ML 2.2-3.1 and depths of five earthquakes were calculated.
INETER staff visited the summit on 29 June 2007. Fumarole temperatures were recorded within the crater at four sites. The central site was the hottest location, 160°C, consistent with previous measurements, although significantly lower than recorded in past years. The lowest temperature was recorded from the westernmost point in the crater, 89°C.
During the ascent, the field team made observations of ground cracks and fissures that cross Momotombo's edifice. INETER described a route following the S flank to reach the summit, from which they saw well-established fissures emitting vapor. Large, loose blocks were broken along these fissures, and cracks near the summit were noticeably wider compared to previous visits by INETER investigators.
Three seismic swarms and a field visit in 2008. INETER reported three small seismic swarms in 2008. They recorded low amplitude tremor and an absence of earthquakes in January. The first seismic swarm occurred less than 3 km below Momotombo's summit, beginning on 5 February. The small swarm was characterized by events of ML 1.2-1.9.
The second seismic swarm of 2008 occurred just weeks after the first. On 24 March 2008, a swarm with slightly larger events, ML 2.2-2.9, was located less than 4 km deep.
The swarm recorded on 5 September was larger compared to the previous 2008 swarms. Approximately 30 events were recorded with a larger range of magnitudes, ML 1.6-2.6. Two of the earthquakes were large enough to be felt, ML 1.4 on 5 September and ML 2.5 the following day. Workers at the geothermal plant on Momotombo's S flank (yellow asterisk in figure 11) reported shaking, as did workers at a cement company located 10 km S of the volcano.
One other earthquake was reported by local residents in the area of Momotombo. That was when a shallow, ML 2.9 event shook the area on 26 October 2008.
Field investigations were conducted by INETER on 20 August 2008. The team did not reach the summit of Momotombo but visited the local seismic station (on the S flank) and a cluster of fumaroles nearby. Three sites were measured with a digital thermometer yielding ~100°C values.
Relative quiescence during 2009-2010. INETER reported that tremor occasionally reached 40-50 RSAM during 2009-2010; these high values were primarily recorded in December 2010. Few earthquakes were located and during those two years they recorded ~40 relatively shallow events (no deeper than 17 km; table 5). Small seismic swarms were recorded on 28 February 2009 as well as one that started on 16 July 2010. The swarm in 2009 included one earthquake that was felt by people near the volcano associated with an ML 3.7 event. This was both the largest and one of the shallowest earthquakes from the swarm.
The seismic swarm that started on 16 July 2010 was more significant and sustained; the largest event was ML 3.4, large enough to instigate reports from the local population but smaller than the event from 2009. While only 7 events were located in 2009, 13 locations were calculated from the swarm in 2010. INETER reported that this later episode entailed VT seismicity that lasted for 10 days.
2011 elevated seismicity and two field investigations. INETER reported elevated tremor during most of 2011. From January through April 2011, tremor was reported as high as 50 RSAM. From September to November, tremor ranged from 40 to 45 RSAM. Two significant earthquakes generated interest from local residents near Momotombo and were the subject of ~70 emails sent to the INETER office on 3 June 2011. Only 1 km deep, the two events were ML 0.8 and 1.4 and occurred within ~20 minutes of each other.
INETER visited the summit twice in 2011 along with international collaborators. On 25 March two students from Heidelberg University, Germany, joined INETER scientists. The team recorded observations of the crater morphology (figure 14) and measured fumarole temperatures from 10 of the established 18 sites (figure 12). Temperatures ranged between 283-761°C; four of the fumaroles had values over 550°C. These measurements were consistent with previous summit temperatures, which also revealed higher values in the central sites. In their March 2011 report, INETER stated that fumarole characteristics distinguish Momotombo from other volcanoes in Nicaragua; no other volcano exhibits such high temperatures without displaying incandescence.
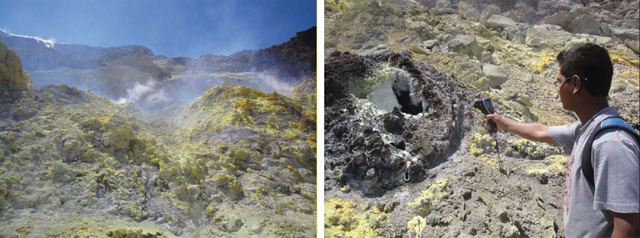 |
Figure 14. A view of sulfur deposits within Momotombo's summit crater (left) and INETER volcanologist Greyving Argüello (right) measuring temperatures with a hand-held probe at one of the well-established fumaroles. Note the pervasive yellow and white crystalline surfaces concentrated around the fumaroles. Photos taken on 25 March 2011. Courtesy of INETER. |
A field investigation with European Union participants was conducted on 26 November 2011. Significant emissions were visible escaping from the crater. In their November report, INETER suggested that meteorological conditions may have contributed to the conspicuous steam; the winds were light at the summit; humidity was relatively low that day. The team also noted that significant cracks were visible in the SE, S, and E sides of the crater rim.
Temperatures from the summit fumaroles were slightly higher than previously measured. A summary of fumarole temperatures measured during the last six site visits was provided in INETER's November 2011 report (table 6). INETER reported values in the range of 317-890°C and they explained that, in general, a gradually increasing trend was present in the data. Since October 2000, rockfalls have covered some of the previously reliable fumaroles. Some additional measurements, requiring a close approach with a thermocouple probe, were hampered by dangerously high temperatures or unstable ground.
Table 6. Temperatures measured from Momotombo's summit fumaroles from 2000 to 2011. Ten of the fumarole sites labeled in figure 12 appear here with coordinates. Courtesy of INETER.
| UTM Coordinates | Fumarole IDs | Site Visits and Temperatures (°C) | |||||||
| Easting | Northing | Oct 2000 | Dec 2000 | Mar 2001 | Jul 2003 | Nov 2005 | Mar 2011 | Nov 2011 | |
| 0550149 | 1373642 | 1 | 152 | 167 | -- | -- | 260 | -- | -- |
| 0550162 | 1373634 | 2 | 309 | 315 | 410 | -- | 320 | -- | -- |
| 0550174 | 1373645 | 3 | 263 | 250 | 380 | -- | 681 | 305 | 317 |
| 0550190 | 1373641 | 4 | 371 | 357 | 473 | 273 | 344 | 488 | 520 |
| 0550211 | 1373640 | 5 | 735 | 720 | 760 | 431 | 273 | 547 | 588 |
| 0550130 | 1373488 | 6 | 606 | 612 | 590 | 590 | 551 | -- | -- |
| 0550141 | 1373480 | 7 | 596 | 583 | 554 | 687 | 680 | 607 | 676 |
| 0550151 | 1373477 | 8 | 598 | 378 | 571 | 737 | 612 | 642 | 656 |
| 0550158 | 1373478 | 9 | 543 | 533 | 594 | 273 | -- | 748 | 820 |
| -- | -- | 10 | 604 | 588 | -- | 497 | -- | -- | -- |
| 0550167 | 1373477 | 11 | -- | -- | -- | -- | -- | 341 | 390 |
| 0550176 | 1373480 | 12 | -- | -- | -- | -- | -- | 761 | 890 |
| 0550202 | 1373497 | 17 | -- | -- | -- | -- | -- | 283 | 352 |
| 0550210 | 1373500 | 18 | -- | -- | -- | -- | -- | 459 | 795 |
References. NASA Landsat Program (2003) Landsat ETM+ scene 7dk20060915, SLC-Off, USGS, Sioux Falls, Sept. 15, 2006.
Information Contacts: Instituto Nicaragüense de Estudios Territoriales (INETER), Apartado Postal 2110, Managua, Nicaragua (URL: http://www.ineter.gob.ni/); Global Land Cover Facility (URL: http://http://www.glcf.umiacs.umd.edu/); Washington Volcanic Ash Advisory Center (VAAC), Satellite Analysis Branch (SAB), NOAA/NESDIS E/SP23, NOAA Science Center Room 401, 5200 Auth Rd, Camp Springs, MD 20746, USA (URL: http://www.ospo.noaa.gov/Products/atmosphere/vaac/).
Numerous explosions with ash plumes and lava flow, December 2015-April 2016
Between 1996 and 2011 there were about 14 seismic swarms at Momotombo, along with fumarolic activity, and an explosion in 2006 (BGVN 37:02). According to the Instituto Nicaragüense de Estudios Territoriales (INETER), explosive activity that generated ash plumes resumed on 1 December 2015 and ended on 8 April 2016. The number of daily explosions increased beginning on 12 February 2016, with very high counts in the first half of March (figure 15).
|
Figure 15. Histogram of number of daily explosions between 1 December 2015 and 3 April 2016. The total number of explosions with ash emissions was 409 (438 overall), with 314 reported in March 2016 alone (76 percent of total); 88 explosions were detected during 1 December 2015-1 March 2016. The graph does not show the few small explosions during the week subsequent to 3 April 2016. Courtesy of INETER. |
Activity during December 2015-January 2016. According to the Instituto Nicaragüense de Estudios Territoriales (INETER), an explosion at 0749 on 1 December 2015 generated a gas-and-ash plume that rose 1 km above the crater and drifted SW. Additional explosions at 0817, 0842, and 0855 generated ash plumes that rose 300 m. Gas emissions were visible the rest of the day. The Sistema Nacional para la Prevención, Mitigación y Atención de Desastres (SINAPRED) reported that during 1-2 December, explosions ejected incandescent tephra, and a slow-moving lava flow on the N flank was observed. According to a news report (La Prensa) that interviewed INETER officials, ashfall was reported in nearby communities to the W and SW, including La Concha (40 km SSE), Los Arcos, Flor de la Piedra, La Paz Centro, and Leóin. Some families in La Paz Centro (17 km SW) self-evacuated.
Based on satellite and webcam observations, and seismic data, the Washington Volcanic Ash Advisory Center (VAAC) reported that during 2-3 December 2015, ash plumes rose to an altitude of 2.4 km and drifted 90-225 km NW and WNW.
According to INETER and SINAPRED reports, activity continued through 10 December 2015. Fieldwork revealed a small, incandescent, circular crater halfway up the E flank that was fuming during the morning of 6 December. An explosion on 7 December destroyed part of the crater. On 10 December, SINAPRED reported that material had been accumulating in the crater since the beginning of the eruption on 1 December. Seismicity during 9-14 December was low and stable.
INETER reported that during 29-30 December 2015, no explosions were detected, though Real-time Seismic-Amplitude Measurements (RSAM) continued at moderate-to-high levels.
Three gas-and-ash explosions on 2 January 2016 (at 1333, 1426, and 1434) were noted in INETER and SINAPRED reports which excavated the remaining parts of the lava dome that had been emplaced about a month earlier. An ash plume rose 500 m above the crater, drifted S and SW, and caused ashfall in Puerto Momotombo (9 km WSW). Possible ash plumes from an explosion at 2129 were hidden by darkness. At 0420 on 3 January, an explosion ejected lava bombs 2 km away and caused ashfall in La Paz Centro. Lava flows had advanced as far as 2 km down the NE flank.
INETER reported that at 1209 on 12 January 2016, a large explosion ejected incandescent material onto the flanks and generated an ash plume that rose 4 km above the crater. Tephra was deposited on the E, NE, N, and NW flanks. Ash plumes drifted downwind and caused ashfall in the communities of Flor de Piedra, Amatistán, Guacucal (40 km N), La Palma, Puerto Momotombo (10 km WSW), La Sabaneta, Mira Lago, Asentamiento Miramar, Pancasán, René Linarte, Raúl Cabezas, and Betania. At around 0500 on 15 January, strong volcanic tremor was accompanied by small explosions in the crater; ejected ash and incandescent tephra were deposited on the W flank. Seismicity decreased during 16-17 January.
According to INETER, during 20-21 January both RSAM values and emissions were low. Volcanic tremor increased at 0900 on 22 January, causing RSAM values to rise to high levels. There were no emission changes. INETER recommended that the public stay at least 6 km away from the volcano.
INETER reported that during 26-29 January, RSAM values were at low to moderate levels, and gas emissions were at moderate levels. Crater incandescence from high-temperature gas emissions was observed at night during 26-27 January. A Strombolian explosion at 0344 on 30 January ejected tephra onto the E, NE, N, and NW flanks, and produced gas emissions. At 0529 on 31 January, another explosion also ejected gas, ash, and incandescent material. Ashfall was reported in the nearby communities of Boqueron, Puerto Momotombo, and La Sabaneta. Moderate levels of gas emissions drifted SW towards Puerto Momotombo.
Activity during February-April 2016. During 4-5 and 7-8 February, both RSAM values were low to moderate and emissions were at moderate levels. INETER reported moderate levels of gas emissions on 10 February; volcanic tremor and gas emissions increased to moderate-to-high levels the next day. An explosion on 12 February produced small ash emissions and ejected incandescent material onto the N and SE flanks. An explosion at 1305 on 15 February generated an ash plume that rose 2 km above the crater and ejected incandescent tephra onto the N and NE flanks.
INETER reported that during 16-17 February, two explosions accompanied by tremor produced ash emissions and ejected incandescent material onto the flanks. The first and largest explosion (at 0344) ejected incandescent tephra 800 m above the crater. RSAM values were at low-to-moderate levels. Based on webcam views and satellite images, the Washington VAAC reported that on 19 February, ash emissions rose to an altitude of 3.6 km and drifted SW and WSW. The next day, ash emissions drifted SW. On 21 February ash plumes drifted about 80 km W and 25 km E.
During 19 February-1 March, explosions were detected daily. Explosions produced ash plumes and ejected incandescent material onto the N, NE, E, and SE flanks. Ash plumes rose 1.7-2.3 km above the crater and drifted SW during 21-22 February; gas-and-ash plumes rose 1.8 km on 24 February; an ash plume rose 1 km on 25 February and a small gas-and-ash plume rose 300 m on 26 February. A pyroclastic flow traveled 3.5 km down the N and NW flanks during 23-24 February. Explosions on 27 February ejected tephra 300 m above the crater.
At 0646 on 1 March, explosions ejected gas and incandescent tephra, and an ash plume that rose 1.2 km lasted 16 minutes, causing the plume to widen and darken the sky. According to INETER, 53 small explosions during 2-3 March generated weak gas plumes that rose 300 m above the crater. On 3 March, some explosions produced ash plumes that drifted W and SW. RSAM values were at low to moderate levels. SINAPRED reported that during 5-6 March, there were 78 explosions for a total of 279 explosions detected since 1 December 2015. One of the most significant explosions occurred on 6 March. The next day gas-and-ash plumes rose as high as 1 km above the crater.
On 28 March, SINAPRED reported that 38 explosions, detected over a period of 24 hours, ejected gas-and-ash plumes and incandescent tephra. The strongest event occurred at 1140 on 27 March and generated a plume that rose 1 km.
SINAPRED reported that on 2 April, explosions produced gas-and-ash plumes and ejected incandescent tephra. According to INETER, three explosions during 5-6 April ejected incandescent material onto the flanks and produced gas-and-ash plumes that rose 500 m above the crater. During 6-7 April there were 27 small explosions. The explosions ejected some incandescent material and generated ash plumes that rose 200 m and drifted SW. RSAM values were low during 5-12 April.
Monthly INETER reports did not indicate any explosive activity after 8 April 2016. The August 2016 report indicated that seismicity was low, with only five volcano-tectonic earthquakes. The RSAM in August was a low 30 units.
Thermal anomalies during the 2015-16 eruption. Many thermal anomalies, based on MODIS satellite instruments analyzed using the MODVOLC algorithm, were observed between 2-6 December 2015, primarily on the ENE flank. Subsequently, one anomaly was observed on 1 February, 2 February, and 15 February 2016. A weak possible hotspot on the E flank was also observed on 19 February, but it was slightly S of the previous hotspots.
The Mirova (Middle InfraRed Observation of Volcanic Activity) system, also based on analysis of MODIS data, detected several anomalies within 5 km of the crater during March 2016, but none thereafter through 2016. The heat radiated by the volcanic activity (or Volcanic Radiative Power, as measured in watts) was mostly less than 0.5 watts.
Before this latest activity, a weak hotspot was also detected by MODVOLC on 7 March 2012 near the N rim of the crater, and on 19 June 2014, somewhat further down the E flank than most of the other events; neither event may have been associated with volcanism; no volcanic activity was reported on those days.
Information Contacts: Instituto Nicaragüense de Estudios Territoriales (INETER), Apartado Postal 2110, Managua, Nicaragua (URL: http://webserver2.ineter.gob.ni/vol/dep-vol.html); Sistema Nacional para la Prevención, Mitigación y Atención de Desastres (SINAPRED), Edificio SINAPRED, Rotonda Comandante Hugo Chávez 50 metros al Norte, frente a la Avenida Bolívar, Managua, Nicaragua (URL: http://www.sinapred.gob.ni/); Washington Volcanic Ash Advisory Center (VAAC), Satellite Analysis Branch (SAB), NOAA/NESDIS OSPO, NOAA Science Center Room 401, 5200 Auth Rd, Camp Springs, MD 20746, USA (URL: http://www.ospo.noaa.gov/Products/atmosphere/vaac/, archive at: http://www.ssd.noaa.gov/VAAC/archive.html); Hawai'i Institute of Geophysics and Planetology (HIGP), MODVOLC Thermal Alerts System, School of Ocean and Earth Science and Technology (SOEST), Univ. of Hawai'i, 2525 Correa Road, Honolulu, HI 96822, USA (URL: http://modis.higp.hawaii.edu/); MIROVA (Middle InfraRed Observation of Volcanic Activity), a collaborative project between the Universities of Turin and Florence (Italy) supported by the Centre for Volcanic Risk of the Italian Civil Protection Department (URL: http://www.mirovaweb.it/); La Prensa (Nicaragua) (URL: https://www.laprensani.com/).
|
|
||||||||||||||||||||||||||
There is data available for 19 confirmed eruptive periods.
2015 Dec 1 - 2016 Apr 7 Confirmed Eruption (Explosive / Effusive) VEI: 2
| Episode 1 | Eruption (Explosive / Effusive) | Summit crater and NW flank | |||||||||||||||||||||||||||||||||||||||||||||||||||||||||||||||||||||||||||||||||||||||||||||||||||||||||||||||||||||||||||||||||||||||||||||||||||||||||||||||||||||||||||||||||||||||||||||||||||||||||||||||||||||||||||||||||||||||||||||||||||||||||||||||||||||||||||||||||||||||||||||||||||||||||||||||||||||||||||||||||||||||||||||
|---|---|---|---|---|---|---|---|---|---|---|---|---|---|---|---|---|---|---|---|---|---|---|---|---|---|---|---|---|---|---|---|---|---|---|---|---|---|---|---|---|---|---|---|---|---|---|---|---|---|---|---|---|---|---|---|---|---|---|---|---|---|---|---|---|---|---|---|---|---|---|---|---|---|---|---|---|---|---|---|---|---|---|---|---|---|---|---|---|---|---|---|---|---|---|---|---|---|---|---|---|---|---|---|---|---|---|---|---|---|---|---|---|---|---|---|---|---|---|---|---|---|---|---|---|---|---|---|---|---|---|---|---|---|---|---|---|---|---|---|---|---|---|---|---|---|---|---|---|---|---|---|---|---|---|---|---|---|---|---|---|---|---|---|---|---|---|---|---|---|---|---|---|---|---|---|---|---|---|---|---|---|---|---|---|---|---|---|---|---|---|---|---|---|---|---|---|---|---|---|---|---|---|---|---|---|---|---|---|---|---|---|---|---|---|---|---|---|---|---|---|---|---|---|---|---|---|---|---|---|---|---|---|---|---|---|---|---|---|---|---|---|---|---|---|---|---|---|---|---|---|---|---|---|---|---|---|---|---|---|---|---|---|---|---|---|---|---|---|---|---|---|---|---|---|---|---|---|---|---|---|---|---|---|---|---|---|---|---|---|---|---|---|---|---|---|---|---|---|---|---|---|---|---|---|---|---|---|---|---|---|---|---|---|---|---|---|---|---|---|---|---|---|---|---|---|---|---|---|---|---|---|---|---|---|
| 2015 Dec 1 - 2016 Apr 7 | Evidence from Observations: Reported | |||||||||||||||||||||||||||||||||||||||||||||||||||||||||||||||||||||||||||||||||||||||||||||||||||||||||||||||||||||||||||||||||||||||||||||||||||||||||||||||||||||||||||||||||||||||||||||||||||||||||||||||||||||||||||||||||||||||||||||||||||||||||||||||||||||||||||||||||||||||||||||||||||||||||||||||||||||||||||||||||||||||||||||
|
List of 65 Events for Episode 1 at Summit crater and NW flank
|
||||||||||||||||||||||||||||||||||||||||||||||||||||||||||||||||||||||||||||||||||||||||||||||||||||||||||||||||||||||||||||||||||||||||||||||||||||||||||||||||||||||||||||||||||||||||||||||||||||||||||||||||||||||||||||||||||||||||||||||||||||||||||||||||||||||||||||||||||||||||||||||||||||||||||||||||||||||||||||||||||||||||||||||
[ 1918 Apr 16 ± 15 days ] Uncertain Eruption
| Episode 1 | Eruption (Explosive / Effusive) | ||||||||||||||||||||||||
|---|---|---|---|---|---|---|---|---|---|---|---|---|---|---|---|---|---|---|---|---|---|---|---|---|
| 1918 Apr 16 ± 15 days - Unknown | Evidence from Observations: Reported | |||||||||||||||||||||||
|
List of 3 Events for Episode 1
|
||||||||||||||||||||||||
1905 Jan 16 - 1905 Jan 21 Confirmed Eruption (Explosive / Effusive) VEI: 2
| Episode 1 | Eruption (Explosive / Effusive) | ||||||||||||||||||||||||||||||||||||||||||||
|---|---|---|---|---|---|---|---|---|---|---|---|---|---|---|---|---|---|---|---|---|---|---|---|---|---|---|---|---|---|---|---|---|---|---|---|---|---|---|---|---|---|---|---|---|
| 1905 Jan 16 - 1905 Jan 21 | Evidence from Observations: Reported | |||||||||||||||||||||||||||||||||||||||||||
|
List of 7 Events for Episode 1
|
||||||||||||||||||||||||||||||||||||||||||||
1902 Mar 31 ± 30 days Confirmed Eruption (Explosive / Effusive) VEI: 2 (?)
| Episode 1 | Eruption (Explosive / Effusive) | ||||||||||||||||||||||||
|---|---|---|---|---|---|---|---|---|---|---|---|---|---|---|---|---|---|---|---|---|---|---|---|---|
| 1902 Mar 31 ± 30 days - Unknown | Evidence from Observations: Reported | |||||||||||||||||||||||
|
List of 3 Events for Episode 1
|
||||||||||||||||||||||||
1886 May 19 (?) - 1887 (?) Confirmed Eruption (Explosive / Effusive) VEI: 2
| Episode 1 | Eruption (Explosive / Effusive) | ||||||||||||||||||||||||||||||||||||||||||||
|---|---|---|---|---|---|---|---|---|---|---|---|---|---|---|---|---|---|---|---|---|---|---|---|---|---|---|---|---|---|---|---|---|---|---|---|---|---|---|---|---|---|---|---|---|
| 1886 May 19 (?) - 1887 (?) | Evidence from Observations: Reported | |||||||||||||||||||||||||||||||||||||||||||
|
List of 7 Events for Episode 1
|
||||||||||||||||||||||||||||||||||||||||||||
[ 1885 Oct ] Uncertain Eruption
| Episode 1 | Eruption (Explosive / Effusive) | |||||||||||||||||||||||||||||
|---|---|---|---|---|---|---|---|---|---|---|---|---|---|---|---|---|---|---|---|---|---|---|---|---|---|---|---|---|---|
| 1885 Oct - Unknown | Evidence from Unknown | ||||||||||||||||||||||||||||
|
List of 4 Events for Episode 1
|
|||||||||||||||||||||||||||||
1882 Sep 9 Confirmed Eruption (Explosive / Effusive) VEI: 2 (?)
| Episode 1 | Eruption (Explosive / Effusive) | |||||||||||||||||||||||||||||
|---|---|---|---|---|---|---|---|---|---|---|---|---|---|---|---|---|---|---|---|---|---|---|---|---|---|---|---|---|---|
| 1882 Sep 9 - Unknown | Evidence from Observations: Reported | ||||||||||||||||||||||||||||
|
List of 4 Events for Episode 1
|
|||||||||||||||||||||||||||||
1878 Oct 14 (?) Confirmed Eruption (Explosive / Effusive) VEI: 2
| Episode 1 | Eruption (Explosive / Effusive) | |||||||||||||||||||||||||||||
|---|---|---|---|---|---|---|---|---|---|---|---|---|---|---|---|---|---|---|---|---|---|---|---|---|---|---|---|---|---|
| 1878 Oct 14 (?) - Unknown | Evidence from Observations: Reported | ||||||||||||||||||||||||||||
|
List of 4 Events for Episode 1
|
|||||||||||||||||||||||||||||
1870 Confirmed Eruption (Explosive / Effusive) VEI: 2 (?)
| Episode 1 | Eruption (Explosive / Effusive) | ||||||||||||||||||||||||||||||||||
|---|---|---|---|---|---|---|---|---|---|---|---|---|---|---|---|---|---|---|---|---|---|---|---|---|---|---|---|---|---|---|---|---|---|---|
| 1870 - Unknown | Evidence from Observations: Reported | |||||||||||||||||||||||||||||||||
|
List of 5 Events for Episode 1
|
||||||||||||||||||||||||||||||||||
1858 - 1866 Confirmed Eruption (Explosive / Effusive) VEI: 2
| Episode 1 | Eruption (Explosive / Effusive) | |||||||||||||||||||
|---|---|---|---|---|---|---|---|---|---|---|---|---|---|---|---|---|---|---|---|
| 1858 - 1866 | Evidence from Observations: Reported | ||||||||||||||||||
|
List of 2 Events for Episode 1
|
|||||||||||||||||||
1854 Feb - 1854 Mar Confirmed Eruption (Explosive / Effusive) VEI: 2
| Episode 1 | Eruption (Explosive / Effusive) | |||||||||||||||||||||||||||||
|---|---|---|---|---|---|---|---|---|---|---|---|---|---|---|---|---|---|---|---|---|---|---|---|---|---|---|---|---|---|
| 1854 Feb - 1854 Mar | Evidence from Observations: Reported | ||||||||||||||||||||||||||||
|
List of 4 Events for Episode 1
|
|||||||||||||||||||||||||||||
1852 Confirmed Eruption (Explosive / Effusive) VEI: 2
| Episode 1 | Eruption (Explosive / Effusive) | |||||||||||||||||||
|---|---|---|---|---|---|---|---|---|---|---|---|---|---|---|---|---|---|---|---|
| 1852 - Unknown | Evidence from Observations: Reported | ||||||||||||||||||
|
List of 2 Events for Episode 1
|
|||||||||||||||||||
1849 Confirmed Eruption (Explosive / Effusive) VEI: 2
| Episode 1 | Eruption (Explosive / Effusive) | |||||||||||||||||||
|---|---|---|---|---|---|---|---|---|---|---|---|---|---|---|---|---|---|---|---|
| 1849 - Unknown | Evidence from Observations: Reported | ||||||||||||||||||
|
List of 2 Events for Episode 1
|
|||||||||||||||||||
1764 Confirmed Eruption (Explosive / Effusive) VEI: 2
| Episode 1 | Eruption (Explosive / Effusive) | |||||||||||||||||||
|---|---|---|---|---|---|---|---|---|---|---|---|---|---|---|---|---|---|---|---|
| 1764 - Unknown | Evidence from Observations: Reported | ||||||||||||||||||
|
List of 2 Events for Episode 1
|
|||||||||||||||||||
1736 Confirmed Eruption (Explosive / Effusive) VEI: 2 (?)
| Episode 1 | Eruption (Explosive / Effusive) | |||||||||||||||||||
|---|---|---|---|---|---|---|---|---|---|---|---|---|---|---|---|---|---|---|---|
| 1736 - Unknown | Evidence from Observations: Reported | ||||||||||||||||||
|
List of 2 Events for Episode 1
|
|||||||||||||||||||
[ 1609 ] Uncertain Eruption
| Episode 1 | Eruption (Explosive / Effusive) | ||||||||||||||||||||||||
|---|---|---|---|---|---|---|---|---|---|---|---|---|---|---|---|---|---|---|---|---|---|---|---|---|
| 1609 - Unknown | Evidence from Unknown | |||||||||||||||||||||||
|
List of 3 Events for Episode 1
|
||||||||||||||||||||||||
1605 - 1606 Confirmed Eruption (Explosive / Effusive) VEI: 4
| Episode 1 | Eruption (Explosive / Effusive) | ||||||||||||||||||||||||||||||||||||||||||||
|---|---|---|---|---|---|---|---|---|---|---|---|---|---|---|---|---|---|---|---|---|---|---|---|---|---|---|---|---|---|---|---|---|---|---|---|---|---|---|---|---|---|---|---|---|
| 1605 - 1606 | Evidence from Observations: Reported | |||||||||||||||||||||||||||||||||||||||||||
|
List of 7 Events for Episode 1
|
||||||||||||||||||||||||||||||||||||||||||||
1578 Feb Confirmed Eruption (Explosive / Effusive) VEI: 2
| Episode 1 | Eruption (Explosive / Effusive) | |||||||||||||||||||||||||||||
|---|---|---|---|---|---|---|---|---|---|---|---|---|---|---|---|---|---|---|---|---|---|---|---|---|---|---|---|---|---|
| 1578 Feb - Unknown | Evidence from Observations: Reported | ||||||||||||||||||||||||||||
|
List of 4 Events for Episode 1
|
|||||||||||||||||||||||||||||
1524 Confirmed Eruption (Explosive / Effusive) VEI: 3
| Episode 1 | Eruption (Explosive / Effusive) | |||||||||||||||||||||||||||||
|---|---|---|---|---|---|---|---|---|---|---|---|---|---|---|---|---|---|---|---|---|---|---|---|---|---|---|---|---|---|
| 1524 - Unknown | Evidence from Observations: Reported | ||||||||||||||||||||||||||||
|
List of 4 Events for Episode 1
|
|||||||||||||||||||||||||||||
1100 ± 50 years Confirmed Eruption (Explosive / Effusive)
| Episode 1 | Eruption (Explosive / Effusive) | |||||||||||||||||||
|---|---|---|---|---|---|---|---|---|---|---|---|---|---|---|---|---|---|---|---|
| 1100 ± 50 years - Unknown | Evidence from Isotopic: 14C (uncalibrated) | ||||||||||||||||||
|
List of 2 Events for Episode 1
|
|||||||||||||||||||
0800 BCE ± 50 years Confirmed Eruption (Explosive / Effusive) VEI: 4
| Episode 1 | Eruption (Explosive / Effusive) | |||||||||||||||||||||||||||||
|---|---|---|---|---|---|---|---|---|---|---|---|---|---|---|---|---|---|---|---|---|---|---|---|---|---|---|---|---|---|
| 0800 BCE ± 50 years - Unknown | Evidence from Isotopic: 14C (uncalibrated) | ||||||||||||||||||||||||||||
|
List of 4 Events for Episode 1
|
|||||||||||||||||||||||||||||
2550 BCE ± 300 years Confirmed Eruption (Explosive / Effusive)
| Episode 1 | Eruption (Explosive / Effusive) | ||||||||||||||
|---|---|---|---|---|---|---|---|---|---|---|---|---|---|---|
| 2550 BCE ± 300 years - Unknown | Evidence from Isotopic: 14C (uncalibrated) | |||||||||||||
|
List of 1 Events for Episode 1
|
||||||||||||||
This compilation of synonyms and subsidiary features may not be comprehensive. Features are organized into four major categories: Cones, Craters, Domes, and Thermal Features. Synonyms of features appear indented below the primary name. In some cases additional feature type, elevation, or location details are provided.
Cones |
||||
| Feature Name | Feature Type | Elevation | Latitude | Longitude |
| Colorado, Cerro | Stratovolcano | 320 m | 12° 28' 19.00" N | 86° 36' 11.00" W |
| Momotombito, Volcán | Lava cone | 391 m | 12° 21' 4.00" N | 86° 28' 26.00" W |
| Montoso, Cerro | Stratovolcano | 531 m | 12° 27' 25.00" N | 86° 35' 10.00" W |
| Palomos, Cerro las | Cone | 333 m | 12° 27' 58.00" N | 86° 35' 53.00" W |
Craters |
||||
| Feature Name | Feature Type | Elevation | Latitude | Longitude |
| Galán, Monte | Caldera | 280 m | 12° 27' 0.00" N | 86° 34' 1.00" W |
Domes |
||||
| Feature Name | Feature Type | Elevation | Latitude | Longitude |
| Guatusa, Loma la | Dome | 476 m | 12° 23' 53.00" N | 86° 31' 5.00" W |
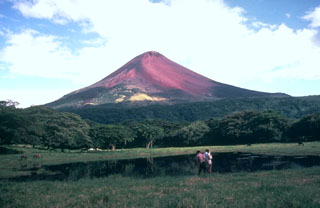 Oxidized, reddish-colored rocks form much of the summit cone of Momotombo volcano, seen here from the NW towering more than a kilometer above one of several small ponds on the floor of Monte Galán caldera. The 4-km-wide caldera was the source of a major ignimbrite about 50,000 years ago.
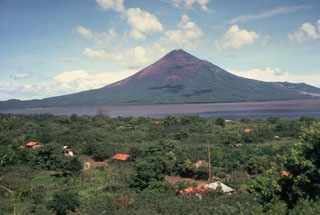 Momotombo is a young, 1297-m-high stratovolcano that rises prominently above the NW shore of Lake Managua, forming one of Nicaragua's most familiar landmarks. Seen here from the SW, Momotombo began growing about 4500 years ago and consists of a somma from an older edifice that is surmounted by a younger cone with a 150 x 250 m crater. Young lava flows from Momotombo have flowed down the NW flank into an unnamed, 4-km-wide caldera. Momotombo has a long record of strombolian eruptions, with occasional larger explosive activity.
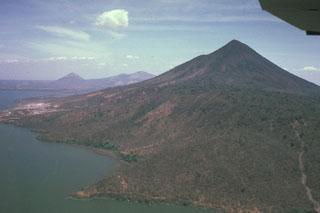 Momotombo volcano, seen here from the east, is a prominent youthful stratovolcano constructed along the shores of Lake Managua. The peninsula in the foreground is Punta del Diablo, and the light-colored area at the left is the site of the Momotombo geothermal plant. The young volcano is only 4500 years old and has a long record of strombolian eruptions, with occasional larger explosive activity. In the distance are the conical peak of Cerro Asososca and the broad summit of Las Pilas volcano.
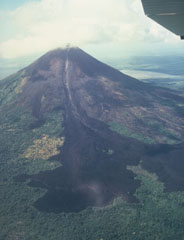 The 1905 lava flow originated from the breached summit crater and traveled down levees on the upper part of the cone before spreading laterally into forests at the NE base of Momotombo. A minor explosive eruption accompanied the lava flow, the latest of many flows that reached the base of the volcano.
 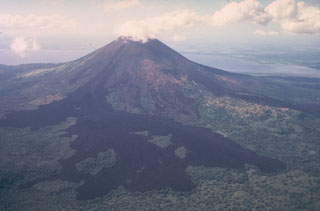 During the latest eruption of Momotombo volcano, in 1905, a large lava flow issued from the breached NE side of the summit crater and traveled 4.5 km onto the lower flanks. The brief, 5-day-long eruption began on January 16 and was accompanied by minor explosive activity. Several prominent "kipukas," (islands of older terrain) are visible in this view from the north with Lake Managua in the background.
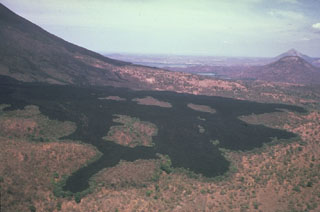 Successive lobes of the 1905 lava flow from Momotombo volcano in Nicaragua spread out on the flat slopes below the volcano, forming a broad terminus. This photo shows how lava flow direction is controlled by the topography, with individual lobes diverted around slightly higher areas of the pre-eruption surface, surrounding these prominent forested "islands" of older rock, known as kipukas.
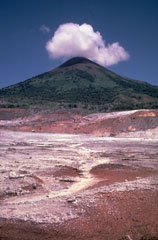 Hydrothermally altered ground in the foreground is part of 2 km2 geothermal field on the southern flank of Momotombo volcano. The Patricio Arguello Ryan geothermal plant at one point produced 25% of the electrical power of Nicaragua. Summit crater fumarolic activity increased following development of the geothermal field.
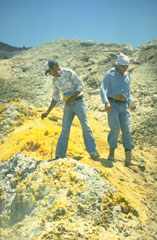 The summit crater of Momotombo is covered with areas of extensive hydrothermal alteration, including this area of sulfur deposition. Temperatures of 465-780° C were measured in summit crater fumaroles at the time of this visit in June 1980. Intense fumarolic activity occurs at the summit crater. The summit crater fumaroles remained very hot in late 1980 with temperatures measured up to 735°C and reported to > 900°C. Portions of the crater were seen to glow red and orange when observed at night.
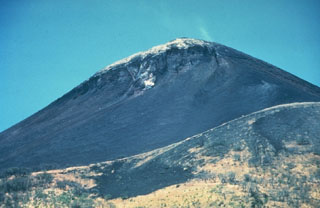 Light-colored fumarolic sublimates drape the 1297-m-high summit of Momotombo volcano, which displays strong fumarolic activity. Fumarolic temperatures (850 degrees C) and seismicity at the volcano increased following construction of the Momotombo geothermal plant.
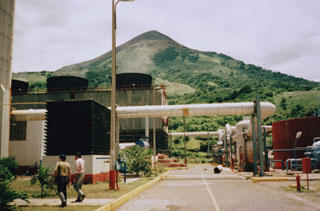 The Momotombo geothermal area, located near the shores of Lake Managua at the southern foot of the volcano, was identified and studied starting in the late 1960s. The first four wells were drilled in the early 1970s, culminating with the installation of a 35 MWe unit in 1983. Six years later, a second unit of 35 MWe went on line. After a period of declining output in the 1980s and 1990s due to overexploitation and lack of reinjection, the power output at Momotombo was restored to about 35 MWe by 2002.
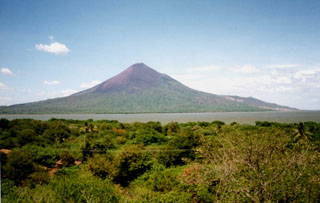 Momotombo volcano, seen here from the west near Puerto Momotombo, towers about 1250 m above Lake Managua. The volcano was constructed beginning about 4500 years ago SE of Monte Galán caldera, which lies out of view to the left. Geothermal exploration has occurred on its southern flank (the light-colored area at the right).
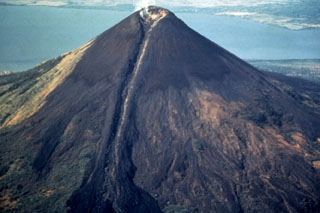 Dramatic levees flank the 1905 lava flow, which originated from the breached summit crater of Momotombo. The flow was confined in levees on the upper 1000 m of the cone before spreading laterally at the base of the volcano. Momotombo volcano towers to 1297 m above Lake Managua. The young cone forming the summit largely fills and overtops a 1.1 x 1.5 km wide crater produced during a major eruption about 2700-2800 years ago.
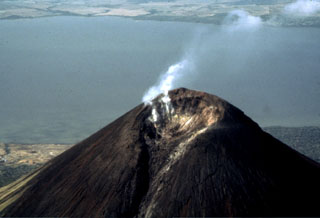 Fumaroles in the summit crater of Momotombo volcano emit vigorous vapor plumes. The 150 x 250 m wide crater of Momotombo is narrowly breached to the NE, where a lava flow emerged during the 1905 eruption. The geothermal field on the southern flank of Momotombo can be seen at the lower left along the shores of Lake Managua.
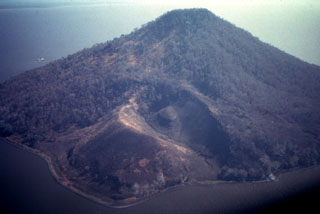 Isla Momotombito is a small 391-m-high island located immediately SE of Momotombo about 4 km off the coastline of Lake Managua. Punta Santa Ana, the peninsula in the foreground, consists of a young pyroclastic cone on the WSW side of the uninhabited, rattlesnake-infested island. Numerous archaeological sites have been found on the island.
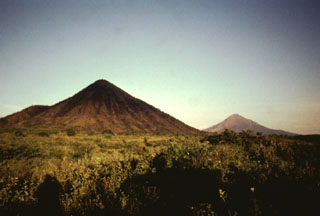 Two conical peaks of differing age rise to the east above the floor of the Nicaraguan depression. Cerro Asososca (left), part of Las Pilas volcanic complex, was constructed along a fissure extending south from Las Pilas. Erosional gullies cut the flanks of the 818-m-high cone. In the distance to the right is the younger Momotombo volcano, frequently active during historical time.
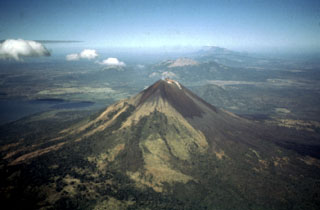 An aerial view to the NW looks down the spine of the Marrabios Range, which rises above the floor of the Nicaraguan depression. In the foreground is Momotombo volcano, which rises to 1297 m above the shores of Lake Managua (left). Monte Galán caldera lies beyond the right-hand flanks of Momotombo. Stretching across much of the photo beyond Momotombo is the N-S-trending Las Pilas complex, and the conical peak in the far distance is San Cristóbal volcano.
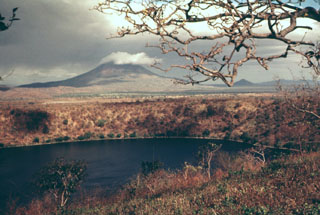 Laguna de Asososca in the foreground is a maar that was constructed along a fissure extending south from Las Pilas volcano. The maar is elongated N-S in the direction of the fissure system and is about 2 km long in that direction. Prevailing winds to the west constructed a higher rim on that side, the vantage point of this photo. The cloud-capped conical peak in the distance is Momotombo, and the much lower peak to its right is Momotombito, which forms an island in Lake Managua.
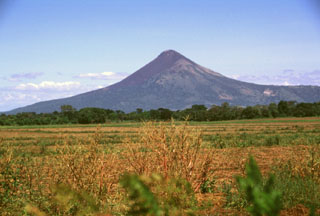 Momotombo volcano towers above the floor of the Nicaraguan depression. Following its birth about 4500 years ago, a catastrophic eruption of Old Momotombo volcano about 2700-2800 years ago produced large amounts of tephra and pyroclastic flows. As a result of this eruption a 1.5 x 1.1 km wide crater was formed at the summit. Subsequent eruptions beginning about 800-900 years ago created the Young Momotombo volcano, which filled much of this crater and forms the present summit.
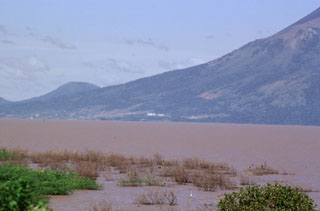 The buildings seen in the center of the photo along the shore of Lake Managua are part of the Patricio Arguello Ryan geothermal plant on the lower southern flank of Momotombo volcano. At one point the power plant produced 25% of electrical power generation for the country. In the distance on the left horizon is Cerro Montoso, a peak on the rim of Monte Galán caldera.
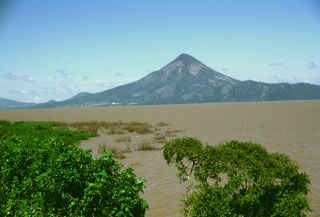 Conical Momotombo volcano rises above the shores of Lake Managua, its waters dirtied by floods associated with hurricane Mitch in 1998. Momotombo rises about 1250 m above the surface of the lake, which is only about 40 m above sea level. The dramatic volcano is one of Nicaragua's most prominent landmarks and is featured on many of the country's postage stamps.
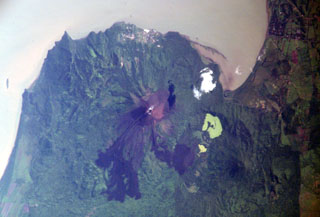 Fresh-looking, dark-colored lava flows from the 1905 eruption of Momotombo volcano are prominent in this NASA International Space Station image with north to the top. The NW-most flow cascaded into Monte Galán caldera, with the greenish Laguna Monte Galán near its southern rim. Laguna Las Piedras lies near the center of the caldera, near the toe of the NW lava flow. The light-colored developed area south of the summit along the shore of Lake Managua is the Momotombo geothermal field.
 Momotombo rises above the NW shore of Lake Managua and is in the center of this December 2019 Planet Labs satellite image monthly mosaic (N is at the top; this image is approximately 22 km across). Gas emissions emanating from the summit crater are dispersing to the SW. Lava has flowed into Monte Galán caldera on the NW flank towards Cerro Motoso, a cone on the NW caldera rim. The island to the SE is Volcán Momotombito and is part of the Momotombo complex. Lava flows in 2015 were emplaced down the NE flank on top of 1905 flows.
There are no samples for Momotombo in the Smithsonian's NMNH Department of Mineral Sciences Rock and Ore collection.
| Copernicus Browser | The Copernicus Browser replaced the Sentinel Hub Playground browser in 2023, to provide access to Earth observation archives from the Copernicus Data Space Ecosystem, the main distribution platform for data from the EU Copernicus missions. |
| MIROVA | Middle InfraRed Observation of Volcanic Activity (MIROVA) is a near real time volcanic hot-spot detection system based on the analysis of MODIS (Moderate Resolution Imaging Spectroradiometer) data. In particular, MIROVA uses the Middle InfraRed Radiation (MIR), measured over target volcanoes, in order to detect, locate and measure the heat radiation sourced from volcanic activity. |
| MODVOLC Thermal Alerts | Using infrared satellite Moderate Resolution Imaging Spectroradiometer (MODIS) data, scientists at the Hawai'i Institute of Geophysics and Planetology, University of Hawai'i, developed an automated system called MODVOLC to map thermal hot-spots in near real time. For each MODIS image, the algorithm automatically scans each 1 km pixel within it to check for high-temperature hot-spots. When one is found the date, time, location, and intensity are recorded. MODIS looks at every square km of the Earth every 48 hours, once during the day and once during the night, and the presence of two MODIS sensors in space allows at least four hot-spot observations every two days. Each day updated global maps are compiled to display the locations of all hot spots detected in the previous 24 hours. There is a drop-down list with volcano names which allow users to 'zoom-in' and examine the distribution of hot-spots at a variety of spatial scales. |
|
WOVOdat
Single Volcano View Temporal Evolution of Unrest Side by Side Volcanoes |
WOVOdat is a database of volcanic unrest; instrumentally and visually recorded changes in seismicity, ground deformation, gas emission, and other parameters from their normal baselines. It is sponsored by the World Organization of Volcano Observatories (WOVO) and presently hosted at the Earth Observatory of Singapore.
GVMID Data on Volcano Monitoring Infrastructure The Global Volcano Monitoring Infrastructure Database GVMID, is aimed at documenting and improving capabilities of volcano monitoring from the ground and space. GVMID should provide a snapshot and baseline view of the techniques and instrumentation that are in place at various volcanoes, which can be use by volcano observatories as reference to setup new monitoring system or improving networks at a specific volcano. These data will allow identification of what monitoring gaps exist, which can be then targeted by remote sensing infrastructure and future instrument deployments. |
| Volcanic Hazard Maps | The IAVCEI Commission on Volcanic Hazards and Risk has a Volcanic Hazard Maps database designed to serve as a resource for hazard mappers (or other interested parties) to explore how common issues in hazard map development have been addressed at different volcanoes, in different countries, for different hazards, and for different intended audiences. In addition to the comprehensive, searchable Volcanic Hazard Maps Database, this website contains information about diversity of volcanic hazard maps, illustrated using examples from the database. This site is for educational purposes related to volcanic hazard maps. Hazard maps found on this website should not be used for emergency purposes. For the most recent, official hazard map for a particular volcano, please seek out the proper institutional authorities on the matter. |
| IRIS seismic stations/networks | Incorporated Research Institutions for Seismology (IRIS) Data Services map showing the location of seismic stations from all available networks (permanent or temporary) within a radius of 0.18° (about 20 km at mid-latitudes) from the given location of Momotombo. Users can customize a variety of filters and options in the left panel. Note that if there are no stations are known the map will default to show the entire world with a "No data matched request" error notice. |
| UNAVCO GPS/GNSS stations | Geodetic Data Services map from UNAVCO showing the location of GPS/GNSS stations from all available networks (permanent or temporary) within a radius of 20 km from the given location of Momotombo. Users can customize the data search based on station or network names, location, and time window. Requires Adobe Flash Player. |
| DECADE Data | The DECADE portal, still in the developmental stage, serves as an example of the proposed interoperability between The Smithsonian Institution's Global Volcanism Program, the Mapping Gas Emissions (MaGa) Database, and the EarthChem Geochemical Portal. The Deep Earth Carbon Degassing (DECADE) initiative seeks to use new and established technologies to determine accurate global fluxes of volcanic CO2 to the atmosphere, but installing CO2 monitoring networks on 20 of the world's 150 most actively degassing volcanoes. The group uses related laboratory-based studies (direct gas sampling and analysis, melt inclusions) to provide new data for direct degassing of deep earth carbon to the atmosphere. |
| Large Eruptions of Momotombo | Information about large Quaternary eruptions (VEI >= 4) is cataloged in the Large Magnitude Explosive Volcanic Eruptions (LaMEVE) database of the Volcano Global Risk Identification and Analysis Project (VOGRIPA). |
| EarthChem | EarthChem develops and maintains databases, software, and services that support the preservation, discovery, access and analysis of geochemical data, and facilitate their integration with the broad array of other available earth science parameters. EarthChem is operated by a joint team of disciplinary scientists, data scientists, data managers and information technology developers who are part of the NSF-funded data facility Integrated Earth Data Applications (IEDA). IEDA is a collaborative effort of EarthChem and the Marine Geoscience Data System (MGDS). |

