Report on Akutan (United States) — March 2012
Bulletin of the Global Volcanism Network, vol. 37, no. 3 (March 2012)
Managing Editor: Richard Wunderman.
Akutan (United States) Steaming, seismically active
Please cite this report as:
Global Volcanism Program, 2012. Report on Akutan (United States) (Wunderman, R., ed.). Bulletin of the Global Volcanism Network, 37:3. Smithsonian Institution. https://doi.org/10.5479/si.GVP.BGVN201203-311320
Akutan
United States
54.134°N, 165.986°W; summit elev. 1303 m
All times are local (unless otherwise noted)
We report Akutan non-eruptive seismic activity after our mid-1996 report (BGVN 21:06) through December 2010. AVO (Alaska Volcano Observatory) reporting emphasized seismicity in 2000, 2007, 2008, 2009, and 2010, including seismicity during 2007 triggered by an M 8.2 earthquake in the Kurile islands.
Background. Akutan Island is home to indigenous people located in several coastal villages, and the base of a large fish processing facility. The island resides in the Aleutian arc, a string of islands projecting ~2,000 km into the Bering Sea from the Alaskan Peninsula (figure 2).
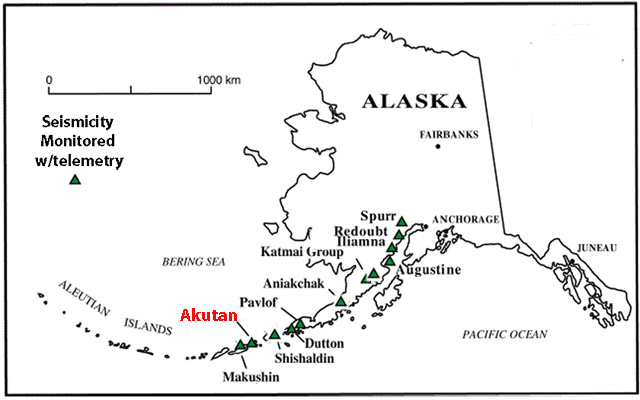 |
Figure 2. Akutan, an island ~32 km by ~20 km, lies on the E Aleutian arc in the Bering Sea near the coast of Alaska. Courtesy of Neal and McGimsey (1996), revised by GVP. |
Akutan Island (figure 3) has a vegetated coast line dotted with spectacular bridges and caves created by the erosion of numerous lava tubes. Waythomas and others (1998) presented a map showing that much of the coastline is susceptible to rockfall avalanches and points out that these may trigger local tsunamis. The authors also analyzed the likely path of lava flows.
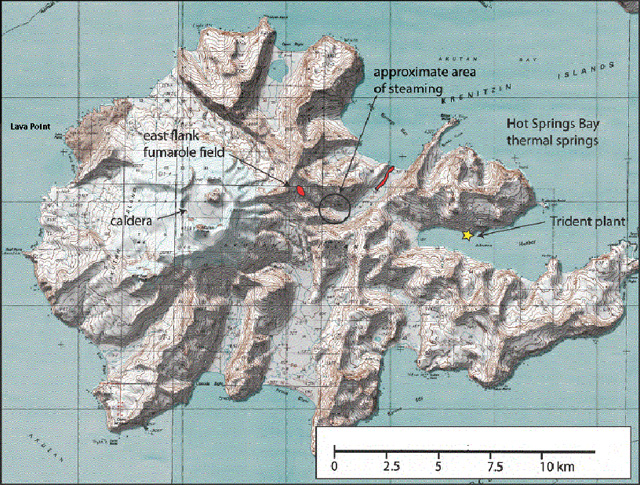 |
Figure 3. Akutan Island and its volcanic features, including fumaroles, hot springs, and a new steaming area. A cindercone resides in the NE quadrant of the generally circular caldera. The fumarole field, shown in red, is down slope on the E flank of the summit. The Trident seafood plant, shown as a yellow star, lays along the E coast. Courtesy of AVO, revised by GVP. |
A 2 km diameter caldera atop the 1,303 m high volcano is breached to the NW, and elsewhere encircled by crater walls 60 to 365 m high. The caldera contains a ~200 m high cinder cone, and a small lake. Fumeroles lay along the summit flank toward the E (Miller and others, 1998). The cinder cone has been the site of all historical eruptive activity (Richter and others, 1998; Waythomas and others, 1998).
The village of Akatan ( figure 4), ~ 13 km E of the volcano, hosts the Trident seafood plant, the largest such plant in North America, employing up to 900 seasonal workers (McGimsey, 2011). Akutan villagers and seafood plant employees fled the island during the 1996 seismic events (Li and others, 2000). The cited references provide many details omitted here.
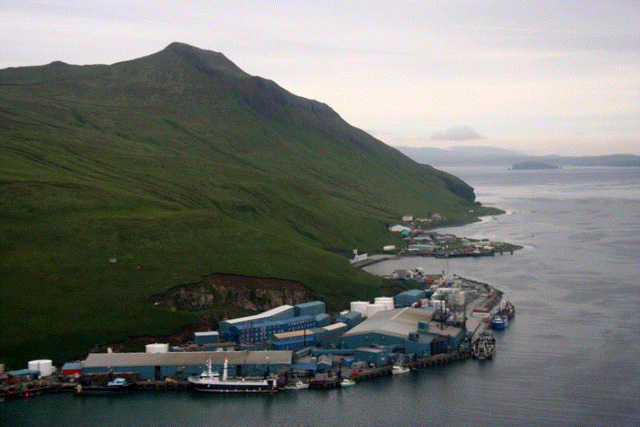 |
Figure 4. Akutan coastal image with seafood plant in foreground adjacent to Akutan village. Image courtesy of AVO, created by Helena Buurman. |
According to Diefenbach and others (2009), Akutan has been the most active of the volcanoes monitored by AVO, having over 20 eruptions since 1790; more than any other Alaskan volcano.
A 2009 report by AVO noted that 11 eruptions occurred at Akutan during 1980-1992, many lasting several months (table 5). The most recent eruption started in December 2009 but the eruption's end was not clearly constrained (table 5). A seismic swarm took place in 1996, an episode without a corresponding eruption.
Table 5. Akutan eruptions tabulated from January 1980 to 2009. Courtesy of Diefenbach and others (2009).
| Start Date | End Date | VEI |
| 08 Jul 1980 | 08 Jul 1980 | 2 |
| 07 Oct 1982 | May 1983 | 2 |
| 03 Feb 1986 | 14 Jun 1986 | 2 |
| 31 Jan 1987 | 24 Jun 1987 | 2 |
| 26 Mar 1988 | 20 Jul 1988 | 2 |
| 27 Feb 1989 | 31 Mar 1989 | 2 |
| 22 Jan 1990 | 22 Jan 1990 | 2 |
| 06 Sep 1990 | 01 Oct 1990 | 2 |
| 15 Sep 1991 | 28 Nov 1991 | 2 |
| 08 Mar 1992 | 31 May 1992 | 2 |
| 18 Dec 1992 | -- | 1 |
From 1980 to 2009, Alaskan eruptions made up to 77% of the total reported in the United States (Diefenbach and others, 2009). Note that, even though during 1980-2009 Akutan erupted more times than other US volcanoes, this distinction is only one of many that can be used for comparisons. For example, in the course of that interval and the 11 recorded eruptions at Akutan, it clearly emitted less material and the eruptive intervals spanned much less time than eruptions at either Kīlauea or Mt. St. Helens.
1996 seismicity. In March 1996, two strong earthquake swarms struck the island, causing minor damage and prompting some residents and dozens of plant employees to leave the island. The seismicity, reported in BGVN 21:06, was probably the result of a magmatic intrusion (Lu and others, 2000). They stated the following:
"In March 1996 an intense swarm of volcano-tectonic earthquakes (~3,000 felt by local residents, M max = 5.1, cumulative moment of 2.7 × 10¹⁸ N m) beneath Akutan Island in the Aleutian volcanic arc, Alaska, produced extensive ground cracks but no eruption of Akutan volcano. Synthetic aperture radar interferograms that span the time of the swarm reveal complex island-wide deformation: the western part of the island including Akutan volcano moved upward, while the eastern part moved downward. The axis of the deformation approximately aligns with new ground cracks on the western part of the island and with Holocene normal faults that were reactivated during the swarm on the eastern part of the island. The axis is also roughly parallel to the direction of greatest compressional stress in the region. No ground movements greater than 2.83 cm were observed outside the volcano's summit caldera for periods of 4 years before or 2 years after the swarm. We modeled the deformation primarily as the emplacement of a shallow, E-W trending, north dipping dike plus inflation of a deep, Mogi-type [spherical] magma body beneath the volcano. The pattern of subsidence on the eastern part of the island is poorly constrained. It might have been produced by extensional tectonic strain that both reactivated preexisting faults on the eastern part of the island and facilitated magma movement beneath the western part. Alternatively, magma intrusion beneath the volcano might have been the cause of extension and subsidence in the eastern part of the island."
The 11 March 1996 swarm involved more than 80 earthquakes of M 3.0 or greater with the largest measuring M 5.2. The 13 March swarm involved more than 120 events of M 3.0 or greater with the largest measuring M 5.3 (Waythomas and others, 1998).
As a result, new ground cracks developed ( figure 5) and Waythomas and others (1998) described them as follows: "Numerous fresh, linear ground cracks were discovered in three areas on Akutan Island during field studies in the summer of 1996. Ground breaks and cracks likely formed during the strong seismic swarms in March. The ground cracks extend discontinuously from the NE side of the island near Lava Point to the island's SE side [figure 5].
"The most extensive ground cracks are between Lava Point and the volcano summit [ figure 6]. In this area, the cracks are confined to a zone 300 to 500 m wide and 3 km long. Vertical displacement of the ground surface along individual cracks is 30 to 80 cm. The ground cracks probably formed as magma moved toward the surface between the two most recently active vents on the volcano. Ground cracks on the SE side of the island occur on known faults, indicating that they probably formed in response to motion along these preexisting structures. No ground cracks were found at the head of Akutan Harbor even though this was an area where numerous earthquakes occurred from March through July, 1996."
|
Figure 5. Location of ground cracks and seismometers on Akutan, as published in 1998. Three sets of ground cracks, shown as black lines, presumably formed during the March 1996 earthquake swarm. The most extensive breaks occurred on the NW flank of the volcano near Lava Point with the other two shorter sets to the SE in line with the first. On the map, the green triangles locate seven monitoring stations, one at the summit, and others spread throughout the island as well as one at the village. Courtesy of AVO, Waythomas and others (1998), annotated by GVP. |
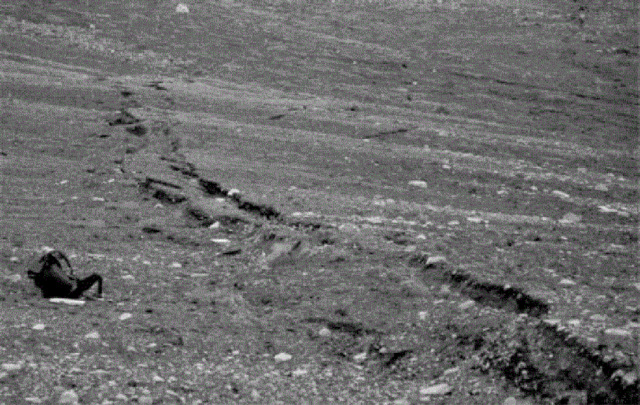 |
Figure 6. Ground breaks like this were found at Akutan in a zone about 300-500 m wide and ~ 3,000 m long on the NW flank of the volcano. Surface deposits offset by the cracks consist of course tephra and colluvium. The backpack in the lower left delineates scale (distant figures removed for clarity). Courtesy of AVO, Waythomas and others (1998). |
A permanent seismic network was installed during the summer of 1996 which currently consists of seven short-period stations and five broadband stations (figure 5).
Akutan seismicity, 2000 to 2010. According to AVO annual reports covering the interval 1997-2011, noteworthy seismicity occurred during the years 2000, 2007, 2008, 2009, and 2010.
On 19 January 2000, five earthquakes occurred in less than 30 minutes with epicenters 10-11 km E of the summit at hypocentral depths of ~5-6 km. This was the same region as the March 1996 volcanic swarm.
Akutan was one of several Alaska volcanoes with behavioral anomalies triggered by the M 8.2 earthquake generated in the Kurile Islands on 12 January 2007 at 0423 UTC (McGimsey, 2011). Seismologists located four of the seven largest triggered M 0.0-0.5 earthquakes at Akutan and found their depths in the range from +0.86 to -2.17 km (figure 7). The locations fell along the trend of intense seismicity and ground breakage that occurred in March 1996 at Akutan (Neal and others, 1997; Waythomas and others, 1998; Lu and others, 2005). The AVO Akutan seismic network recorded the triggered seismicity.
|
Figure 7. Epicenters at Akutan triggered by the 13 January 2007, M 8.2 Kurile Islands earthquake (the event occurred at 0423 UTC, 12 January 2007). The four largest events (red dots) lie along the same trend (blue line) as that of intense seismicity with accompanied ground breakage that occurred during dike intrusion in March 1996 (Waythomas and others, 1998). Open triangles mark locations of seismic stations. Plot of earthquake locations by John Power. Courtesy of AVO, McGimsey and others (2011). |
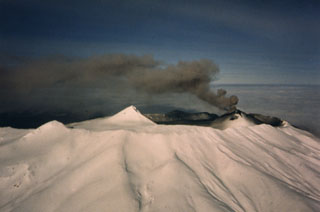
In early October 2007, AVO remote sensors detected signs of renewed inflation of the W flank during the previous month using GPS time series. This inflation was in the same area that inflated during the 1996 seismic crisis. A few days later, on 8 October 2007, the manager of the Trident seafood processing plant called to alert AVO of strong steaming near Hot Springs Bay (figure 8) at a spot significantly up slope from established hot springs in the valley. This plume location was considered "new" by local observers. The established lower-valley thermal springs rarely emit a concentrated, vertically rising steam plume and most earlier reports of steaming arose from the prominent fumarole field located at the 460 m elevation of the E flank at the headwaters of Hot Springs Bay valley. This is also the area of maximum deflation following the 1996 seismic swarms. No unusual seismic activity was noted for the period of W-flank inflation or the location of this steaming episode (McGimsey and others, 2011).
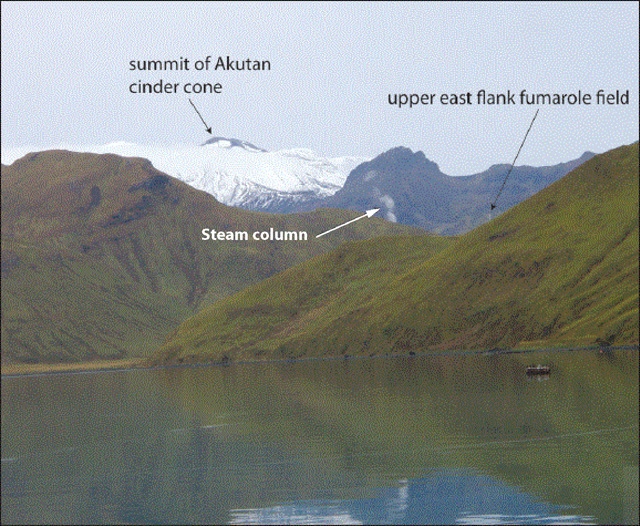 |
Figure 8. Midway up Akutan's Hot Springs Bay valley on the E flank of Akutan from a point well upslope of the previously active hot springs area, a steam column rises from a new site. AVO photo taken 8 October 2007 by David Abbasian. |
In 2008, over 100 seismic events were recorded. During the next two years, Akutan seismic events decreased to about half that number. During 2010 low frequency earthquakes doubled compared to 2009 (Table 6).
Table 6. Akutan seismic activity for 2008-2010 compiled from AVO/USGS annual reports. Total earthquakes (in the second column) summed those in the Volcano-tectonic and Low frequency columns. '--' indicates data not reported. Courtesy of AVO.
| Year | Total earthquakes | Volcano-tectonic | Low-frequency |
| 2008 | 105 | -- | -- |
| 2009 | 45 | 41 | 4 |
| 2010 | 42 | 34 | 8 |
According to AVO, Akutan seismic events during the years 2009 and 2010 were temporally spread roughly throughout the months except for a tight cluster of M 2 earthquakes reported at depths of between ~5 km to ~10 km during the first weeks of January 2010. The majority of earthquakes in 2010 were located within ~5 km of the crater along a N-trending line spanning 10 km. In 2009 the spread was longer, over 20 km.
References. Diefenbach, A.K., Guffanti, M., and Ewert, J.W., 2009, Chronology and references of volcanic eruptions and selected unrest in the United States, 1980-2008: U.S. Geological Survey Open-File Report 2009-1118, 85 p. [http://pubs.usgs.gov/of/2009/1118/].
Dixon, J.P., Stihler, S.D., Power, J.A., and Searcy, C.K., 2010, Catalog of Earthquake Hypocenters at Alaskan Volcanoes: January 1 through December 31, 2009: U.S. Geological Survey Data Series 531.
Dixon, J.P., Stihler, S.D., Power, J.A., and Searcy, C.K., 2011, Catalog of earthquake hypocenters at Alaskan Volcanoes: January 1 through December 31, 2010: U.S. Geological Survey Data Series 645.
Kent, T., 2011, Hydrothermal Alteration of Open Fractures in Prospective Geothermal Drill Cores, Akutan Island, Alaska, Fall Meeting of the American Geophysical Union, 2011, Abstract ##V13D-2637.
Lu, Z., Wicks Jr., C., Power, J.A., and Dzurisin, D., 2000, Ground deformation associated with the March 1996 earthquake swarm at Akutan volcano, Alaska, revealed by satellite radar interferometry, J. Geophys. Res., 105(B9), 21,483-21,495 (DOI:10.1029/2000JB900200).
Miller, T.P., McGimsey, R.G., Richter, D.H., Riehle, J.R., Nye, C.J., Yount, M.E., and Dumoulin, J.A., 1998, Catalog of the historically active volcanoes of Alaska: U.S. Geological Survey Open-File Report 98-582, 104 p. (Also available at http://www.avo.alaska.edu/downloads/catalog.php.)
McGimsey, R.G., Neal, C.A., Dixon, J.P., Malik, Nataliya, and Chibisova, M., 2011, 2007 Volcanic activity in Alaska, Kamchatka, and the Kurile Islands: Summary of events and response of the Alaska Volcano Observatory: U.S. Geological Survey Scientific Investigations Report 2010-5242, 110 p.
Neal, C.A. and McGimsey, R.G., 1997, 1996 Volcanic Activity In Alaska And Kamchatka: Summary Of Events And Response Of The Alaska Volcano Observatory: U.S. Geological Survey Open-File Report 97-433.
Richter, D.H., Waythomas, C.F., McGimsey, R.G., and Stelling, P.L., 1998, Geologic map of Akutan Island, Alaska: U.S. Geological Survey Open-File Report 98-135, 22 p., 1 plate.
Waythomas, C.F., Power, J.A., Richter, D.H., and McGimsey, R.G., 1998, Preliminary volcano-hazard assessment for Akutan Volcano east-central Aleutian Islands, Alaska: U.S. Geological Survey Open-File Report 98-0360, 36 p., 1 plate.
Geological Summary. Akutan contains a 2-km-wide caldera with a large cinder cone in the NE part of the caldera that has been the source of frequent explosive eruptions and occasional lava effusion that covers the caldera floor. An older, largely buried caldera was formed during the late Pleistocene or early Holocene. Two volcanic centers are located on the NW flank. Lava Peak is of Pleistocene age, and a cinder cone lower on the flank produced a lava flow in 1852 that extended the shoreline of the island and forms Lava Point. The 60-365 m deep younger caldera was formed during a major explosive eruption about 1,600 years ago and contains at least three lakes. A lava flow in 1978 traveled through a narrow breach in the north caldera rim almost to the coast. Fumaroles occur at the base of the caldera cinder cone, and hot springs are located NE of the caldera at the head of Hot Springs Bay valley and along the shores of Hot Springs Bay.
Information Contacts: Alaska Volcano Observatory (AVO), a cooperative program of a) U.S. Geological Survey, 4200 University Drive, Anchorage, AK 99508-4667, USA, b) Geophysical Institute, University of Alaska, PO Box 757320, Fairbanks, AK 99775-7320, USA, and c) Alaska Division of Geological & Geophysical Surveys.