Report on Fujisan (Japan) — March 2013
Bulletin of the Global Volcanism Network, vol. 38, no. 3 (March 2013)
Managing Editor: Richard Wunderman.
Fujisan (Japan) 2000-2001 epicenter migration; deep magma; 2011 M 6 aftershock at volcano
Please cite this report as:
Global Volcanism Program, 2013. Report on Fujisan (Japan) (Wunderman, R., ed.). Bulletin of the Global Volcanism Network, 38:3. Smithsonian Institution. https://doi.org/10.5479/si.GVP.BGVN201303-283030
Fujisan
Japan
35.361°N, 138.728°E; summit elev. 3776 m
All times are local (unless otherwise noted)
Fuji remains non-eruptive. Fujita and others (2013) investigate the likelihood that Fuji may erupt due to the 2011 E Shizuoka earthquake (M 6) centered on the volcano. Our previous reports of February 2001 (BGVN 26:02) and September 2001 (BGVN 26:09) described the 2000-2001 deep low-frequency (DLF) earthquake swarm under Fuji. In the first section below, we summarize work by Ukawa (2005) and Nakashimi and others (2004) who provide further details and analysis of DLF swarm activity, and discuss midcrustal, low-frequency earthquakes (MLFs) recorded during 1998-2003. Discussion in those papers noted likely molten material at depth below the volcano.
The next section reports the stress-field and pressure changes to Fuji's magmatic system due to the 11 March 2011 Tohoko megathrust, an MW 9 earthquake, which created the tsunami that devastated parts of costal NE Honshu including the Fukushima nuclear power plant. In addition, an MW 5.9 aftershock was centered below Fuji. Fujita and others (2013) assessed the possibility that the stress-field and pressure changes could enable magma to escape to the surface. Although they concluded that preexisting faults could rupture the chamber walls, the changes were seemingly insufficient to do so, suggesting no eruption was imminent.
Background. During the early 1980s, the National Research Institute for Earth Science and Disaster Prevention (NIED) installed the Kanto-Tokai seismic network in central Japan (figure 2). Later refinements included adding stations SSN and SHJ (not shown), and in the 1990s, stations, FJN, FJY, FJS and FJH, each with three component seismometers and two component tiltmeters at the bottom of 200-m-deep boreholes. In April 1995, Mt Fuji seismic data recording began using the constellation of stations.
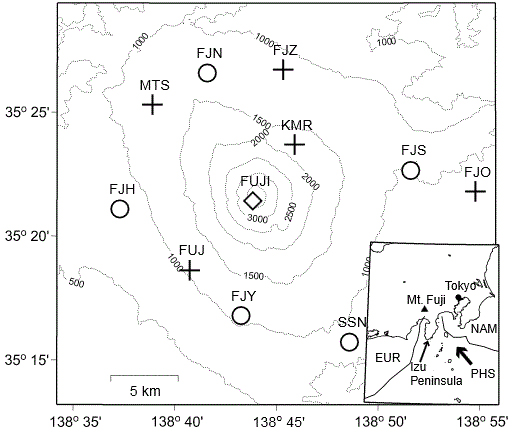 |
Figure 2. (Main map) Mt. Fuji seismic stations shown on a contour map with elevation contours at 500 m intervals. Symbols as follows: crosses, permanent stations maintained by ERI; diamond, Mt. Fuji summit Weather Station maintained since 1987 by JMA; and open circles, stations maintained by NIED. Stations FJH, FJN, FJS and FJY have borehole tiltmeters and 3-component short-period seismometers installed at 200 m depth. (inset map) Tectonic map, with solid lines indicating Eurasian (EUR), N American (NAM) and Philippine Sea (PHS) plate boundaries. Taken from Nakamichi and others, 2004. |
The Fuji DLF earthquake epicenters were located using 1987 to 2001 data from the early 1980 Kanto-Tokai seismic network and later data taken at the four Fuji stations installed in 1990 (figure 3). Nakamichi and others (2005) reexamined epicenter locations of Ukawa (2004). JMA updated safety and evacuation plans.
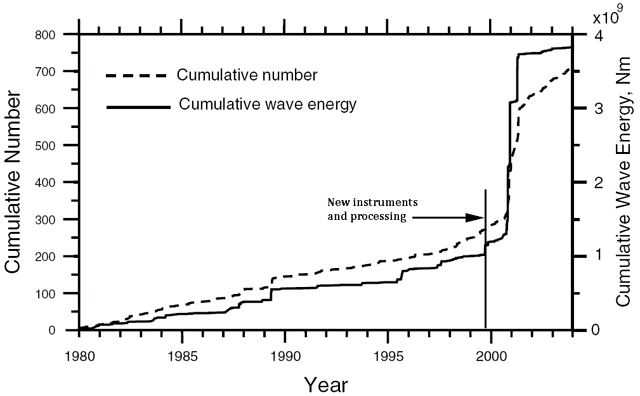 |
Figure 3. Cumulative number of DLF events (dotted curve) at Fuji during 1980-2004 and their cumulative wave energy (solid line). Note new instruments and processing accounted for some of the increase seen in 2000-2001 (right of the vertical line), however there was a clear marked increase in events there. After Ukawa (2005). |
DLFs during 2000-2001. Ukawa (2005) examined the 2000-2001 DLF swarm beneath Fuji. The typical activity here since the early 1980s was 10-20 earthquakes a year at midcrustal depth described as burst-like activity lasting from several minutes to 30 minutes.
The cumulative occurrence of DLF earthquakes their associated cumulative wave energy are plotted in figure FUJ2. The cumulative number rate, or the slope of the curve, is almost constant between 1980-1995, followed by several small slope changes before the later months of 2000 due to the improvements in the seismic network and the new data processing system. The sharp increase in 2000-2001 is far larger than the increase due to the enlarged seismic network. In total, 286 events were identified during the eight months from October 2000 to May 2001. The wave energy increased to approximately twice the average recorded during the prior years.
Regarding Fuji, Ukawa (2005) notes, "On the basis of the DLF earthquake observations by the NIED seismic network, we investigated the temporal change of their occurrence rate from 1980 to 2003 and the hypocenter locations from 1987 to May 2001. The occurrence rate and the seismic wave energy release rate show an abrupt increase from October 2000 to May 2001, suggesting a change in the environment. ...Relocation of hypocenters of the DLF earthquakes indicates that hypocenters of the DLF earthquakes cluster mainly in an elongated region measuring 5 km along the long axis in a NW-SE direction, the center of which is located about 3 km NE from the summit. In addition to the main cluster, hypocenters extend to the southwest from the summit. During the swarm activity in 2000 to 2001, activity in the primary hypocenter region on the northeastern side of Mount Fuji increased greatly. The focal depths of well located DLF events range from 10 to 20 km. The sharp increase of DLF earthquake activity at Mount Fuji began soon after magma discharge and intrusion events in the Miyake-jima and Kozu-shima region in July and August 2000. These events may have modified the state of the deep magmatic system beneath Mount Fuji, thus triggering the DLF earthquake swarm."
Figure 4 shows the three volcanoes mentioned above: Fuji, Miyake-jima, and Kozu-shima. Several more volcanoes also of Holocene age did not erupt.
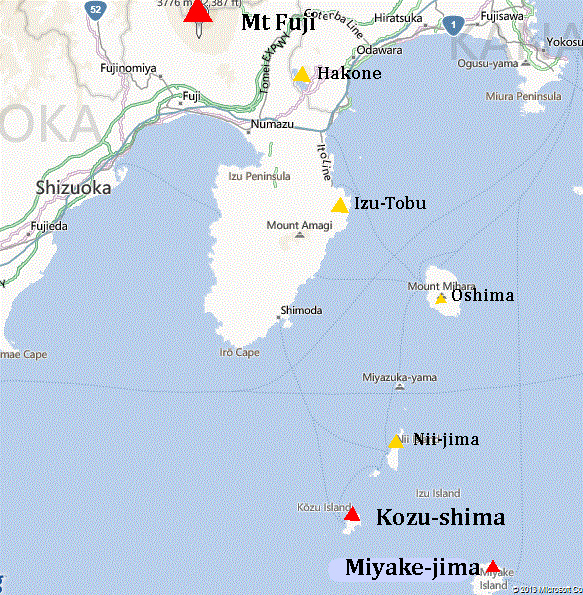 |
Figure 4. Ukawa (2005) noted the 2000-2001 DLF swarm beneath Fuji occurred soon after the July-August 2000 magma discharge and intrusion events located at Kozu-shima and Miyake-jima. Those two volcanoes are located in the Pacific ~135 km from Fuji. Fuji did not erupt. The yellow triangles show locations of other Holocene volcanoes listed in the GVP database. Like Fuji, these also did not erupt. Base map courtesy of the Microsoft Corporation with labels by BGVN editors. |
MLF earthquakes during 1998-2003. Nakamichi and others (2004) revisited Fuji MLF data, that like the DLFs of 2000-2001, they also clustered near the summit. "We have determined the hypocenter locations of MLFs using the hypoDD program [a double-difference algorithm; Waldhauser and Ellsworth, 2000] and repicked arrival times from the seismic networks of ERI, JMA and NIED in and around Mt. Fuji between 1998 and 2003 including the active periods from September 2000 to May 2001, [figure 5]".
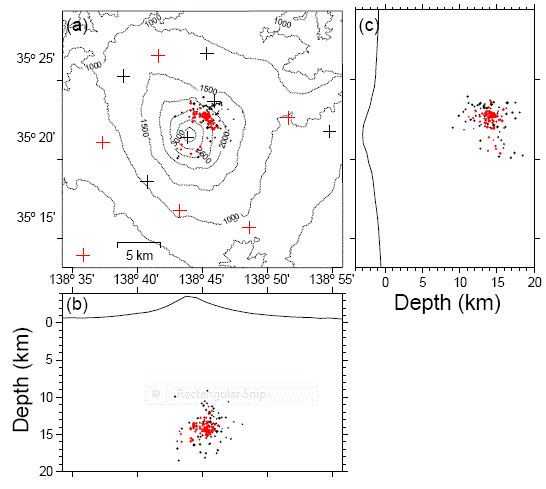 |
Figure 5. Comparison between the Fuji hypocenters of the MLFs by Nakamichi and others (2004) (red circles) and the routine processing at NIED (black circles). (a) Map view of hypocenters, (b) E-W cross-section, and (c) N-S cross-section. Taken from Nakamichi and others (2004). |
The authors summarized their results as follows: "(1) Hypocenters of MLFs define an ellipsoidal volume, 5 km in diameter ranging from 11 to 16 km in focal depth. (2) This volume is centered at 3 km NE of the summit and its long axis is trending NW. This orientation coincides with the major axis of tectonic compression around Mt. Fuji. (3) The center of the MLF epicenters migrated upward and 2-3 km from SE to NW in 1998-2001."
Nakamichi and others, (2004) continue, "We interpret that the hypocentral migration of MLFs reflects magma movement associated with a NW-SE oriented dike beneath Mt. Fuji, figure 6. The relative error ranges of the hypocenters relocated here are from 100 to 500 m horizontally and from 200 to 700 m vertically. No elongated structure in the direction of the observed NW- SE strike is observed in the simulations, indicating that the observed strike is not an artifact of the relocation procedure [seen in Figure 6b along the plane A-A']. The extent of this depth range is also supported by the spread in S-P readings for individual earthquakes. S-P arrival time differences for well-recorded MLFs at station KMR range from 1.9 to 2.4 s, verifying that MLFs beneath Mt. Fuji span a depth range of at least 4 km, and are not confined to a very small volume."
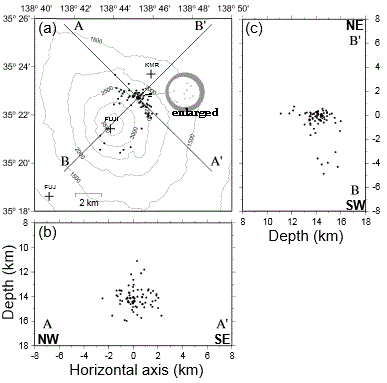 |
Figure 6. Hypocentral distributions of the Fuji MLFs, as determined by the hypoDD program. (a) Map view of relocated hypocenters. Hypocenters at the intersection of A-A' with B-B' shown enlarged as a circle above and to the right. (b) Cross-section A-A'. (c) Cross-section B-B'. Cross-sections A-A' and B-B' include earthquake hypocenters projected from up to 10 km on either side of the cross section line. Taken from Nakamichi and others, 2004. |
The MLFs also shifted with time. The spatial and temporal variations of MLF hypocenters plotted on figure 7. Nakamichi and others (2004) observed focal depths of MLFs in 1998- 1999 that were 12-16 km deep and "seemed to move deeper gradually."
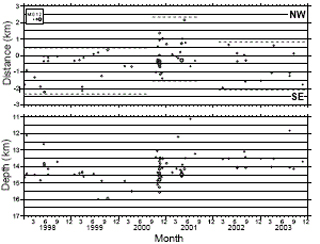 |
Figure 7. Spatial and temporal variations of the Fuji hypocenters of 1998-2003 MLFs. Top plot records distances from hypocenters on the NW-SE horizontal plane projected to zero on the line A-A' of Figure 6. Bottom plot records focal depths vs. time projected to the vertical plane through A-A'. Some or all these variations were interpreted as a manifestation of magma recharge and migration. Nakamichi and others, 2004. |
Two key points from Nakamichi and others (2004) were (1) the MLF processing indicated that the hypocenters migrated 2-3 km upward during 1998-2001, and (2) they interpreted the MLF hypocenter migration as reflecting magma movement associated with a NW-trending dike beneath Fuji.
2011 Fuji stress change after the MW 9 Tohoko earthquake. Fujita and others (2013) studied the Tohoko earthquake and aftershocks in order to see whether the changes in the stress field and pressure changes would cause the known active magma system to erupt. The Tohoku earthquake, MW~9, struck on 11 Mar 2011. Extension occurred over a wide region of the Japanese mainland (Fujita and others, 2013). Aftershocks included those at N Nagano (MW 6.3) on 12 March, at E Shizoka (MW 5.9) on 15 March, and at N Ibaraki (MW 5.8) on 19 March, figure 8. The E Shizuoka aftershock struck beneath Fuji's S flank above its magma system. Fujita and others (2013) selected parameters of the two highest magnitude Tohoko earthquakes from Ozawa et al. (2011) plus the E. Shizuoka earthquake to investigate the change below Fuji. Using seismic data and later modeling they found the change in static pressure below Fuji insufficient to cause an eruption.
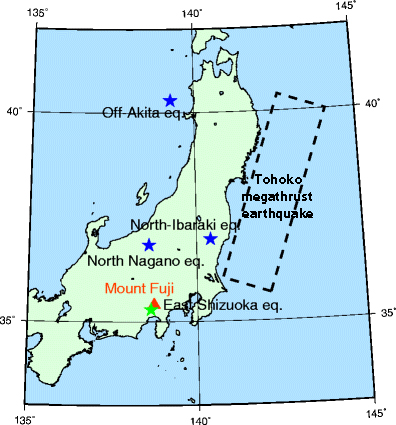 |
Figure 8. A map showing Fuji on Honshu Island with a 500 x 200 km box enclosing the epicenters in the main sequence of the Tohoko megathrust earthquake. Epicenters of key aftershocks are shown as blue stars and one green star. The later struck 15 March, 4 days after the main event at 7-12 km depth below Fuji. After Fujita and others, 2013. |
The fault parameters of the Tohoko earthquakes (Table 3) were estimated by Ozawa and others (2011). With regard to the E Shizouka earthquake, Fujita and others (2013) determined the East Shizuoka source fault using the method of Ueda and others (2005) and "determined the best-fit fault model to be almost strike-slip with some reverse components, located a few kilometers south of the summit trending from depths of 7-12 km." Note that on table 3 the "Depth (top)" value of 7 km locates the top of the fault.
Table 3. Fault parameters computed for two of the strongest Tohoku earthquakes and the E Shizuoka aftershock. Tohoku parameters are from Ozawa and others (2011); those for the E Shizuoka were obtained by applying the method of Ueda and others (2005). Taken from Fujita and others (2013).
| Parameters | Tohoku 1 | Tohoku 2 | East Shizuoka |
| Latitude | 38.80°N | 37.33°N | 35.3161°N |
| Longitude | 144.00°E | 142.80°E | 138.7130°E |
| Depth (top), km | 5.1 | 17 | 7 |
| Length, km | 186 | 194 | 6 |
| Width, km | 129 | 88 | 8 |
| Strike, degrees | 203 | 203 | 24 |
| Dip, degrees | 16 | 15 | 80 |
| Rake, degrees | 101 | 83 | 20 |
| Dislocation, m | 24.7 | 6.1 | 0.86 |
| Magnitude | 8.8 | 8.3 | 6.0 |
Figure 9 shows the distribution of hypocenters of both tectonic (blue) and DLP (red) earthquakes during 1996-2011. Tectonic earthquakes occurring during 1996-2011 (blue circles) cluster to the S at ~5-15 km depth and NE from ~17 km deep to below the 25 km scale limit with little temporal change in number until a detectable rate rise in early 2011. Hypocenters of DLFs occurring during 1996-2011 (red circles) cluster nearest the crater N at ~10-15 km depth with little temporal change in number until a detectable rate rise in early 2011. The largest event shown, the E Shizuoka tectonic earthquake (15 March 2011) occurred on the S flank of Mount Fuji at a depth of 12 km (table 3 lists the top of the fault at 7 km). Remote aftershocks were centered a few kilometers N of the summit. Taken from Fujita and others (2013).
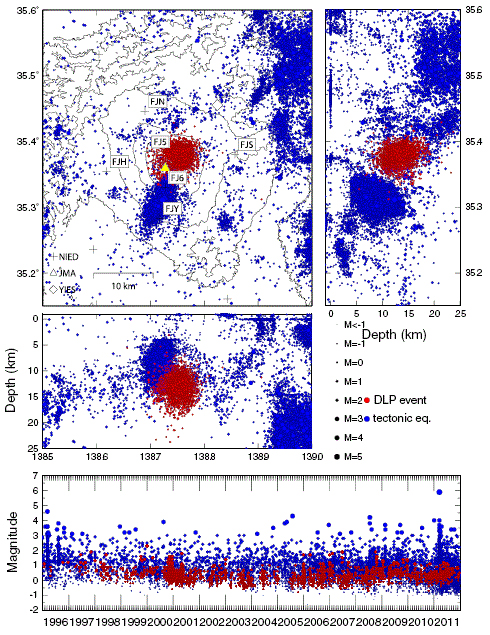 |
Figure 9. Mt Fuji summit, yellow triangle, shown with tectonic and DLF earthquakes during 1996 to 2011. Red circles correspond to hypocenters of Deep Long Period (DLP) events, and blue circles correspond to tectonic earthquakes. Note the DLP increase in 2000 and 2001, shortly after the Miyake-jima volcano eruption and huge ground deformation on Izu peninsula ~100 km SE of Mount Fuji. Courtesy of Fujita and others (2013). |
The relocated hypocenters computed by Fujita and others (2013) compared to the hypocenters of the same events routinely obtained by NIED (Ukawa, 2001), showed improvement in location accuracy (figure 10). The hypocenters by NIED are distributed in a larger volume and not along a particular plane while in this study they are much more concentrated and trending NNE. As seen on figure FUJ 9, Fujita and others (2013) noted "The dislocation was 86 cm toward the NNE with a strike of 240, dip of 800, and rake of 200." Aftershocks of the E Shizouka earthquake also occurred along this fault."
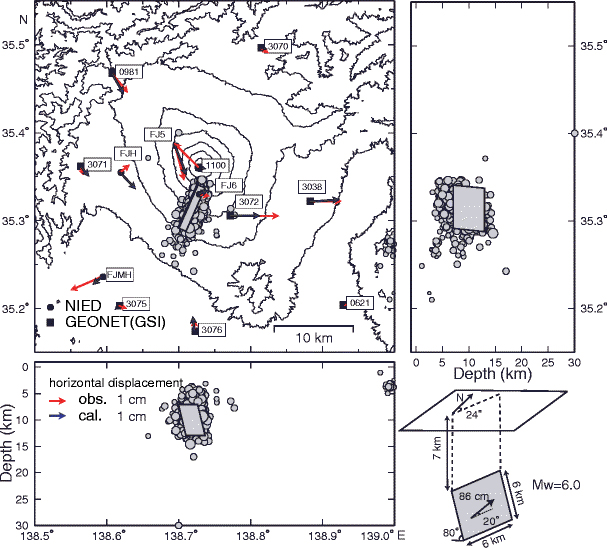 |
Figure 10. Topographic station location map of Fuji showing an estimated dislocation of 86 cm along a 6x6 km fault plane based on GPS data from NIED and Graphical Survey Institute (GEONET) data. Observed (red) and calculated (blue) displacement vectors are shown. Courtesy of Fujita and others (2013). |
The static stress change caused by the E Shizouka earthquake was on the order of 0.1-1 MPa, or 0.2%, at the boundary of the magma reservoir, which was theoretically sufficient to trigger an eruption (Walter and others 1997; Walter and others 2009).
The deformation of Fuji's magma system was based on finite-element modeling of the Japanese mainland and Fuji seismic tomography. At Fuji, the stress changes to the magma reservoir were on the order of 0.001-0.01 MPa for the Tohoku earthquake and 0.1-1 MPa for the East Shizuoka earthquake (Fujita and others, 2013). Were these static stress changes sufficient to promote new fractures at the magma reservoir wall and magma injection? Fujita and others, 2013 maintain, "This is less than the magnitude required to break new faults but could trigger some perturbation in unstable faults or in the hydrothermal and magmatic systems. However, the magma beneath Mount Fuji does not seem to have enough potential to erupt at this moment".
References. Fujita, E., Kozono, T., Ueda, H., Kohno, Y., Yoshioka, S., Toda, N., Kikuchi, A., and Ida, Y. 2013, Stress field change around the Mount Fuji volcano magma system caused by the Tohoku megathrust earthquake, Japan. Bulletin of Volcanology, 75(1), 1-14.
Koyama M., 2002, Mechanical coupling between volcanic unrests and large earthquakes: a review of examples and mechanics. J Geogr 111:222-232, in Japanese with English abstract.
Koyama M., 2007, Database of eruptions and other activities of Fuji Volcano, Japan, based on historical records since AD 781. Yamanashi Institute of Environmental Sciences, Fuji Volcano, pp 119- 136, in Japanese with English abstract.
Nakamichi H., Ukawa, M., Sakai S., 2004, Precise hypocenter locations of midcrustal low-frequency earthquakes beneath Mt. Fuji, Japan, Earth, Planets and Space, 56, e37-e4.
Nakamichi, H., Hamaguchi , H. Tanaka S., Ueki S., Nishimura T., Hasegawa A., 2003, Source mechanisms of deep and intermediate-depth low frequency earthquakes beneath Iwate volcano, northeastern Japan, Geophysical Journal International, 154, 811-828.
Nishimura T., Ozawa S., Murakami M., Sagiya T., Tada T., Kaidzu M., Ukawa M., 2001, Crustal deformation caused by magma migration in the northern Izu Islands, Japan. Geophysical Research Letters 28:3745-3748.
Ozawa S., Nishimura T., Suito H., Kobayashi T., Tobita M., Imakiire T., 2011, Coseismic and postseismic slip of the 2011 magnitude-9 Tohoku-Oki earthquake. Nature 475:373-377.
Ueda H., Fujita E., Ukawa M., Yamamoto E., Irawan M., Kimata F., 2005, Magma intrusion and discharge process at the initial stage of the 2000 activity of Miyakejima, Central Japan, inferred from tilt and GPS data. Geophysical Journal International 161:891-906.
Ukawa, M., 2005, Deep low-frequency earthquake swarm in the mid crust beneath Mount Fuji (Japan) in 2000 and 2001, Bulletin of Volcanology, 68 (2005), pp. 47-56.
Waldhauser, F. and W. L. Ellsworth, 2000, A double-difference earthquake location algorithm: Method and application to the northern Hayward fault, California, Bull. Seismol. Soc. Am., 90, 1353-1368.
Walter T., 2007, How a tectonic earthquake may wake up volcanoes: stress transfer during the 1996 earthquake-eruption sequence at the Karymsky Volcanic Group, Kamchatka. Earth and Planetary Science Letters 264:347-359.
Walter T., Amelung F., 2007, Volcanic eruptions following M≥9 megathrust earthquakes: implications for the Sumatra-Andaman volcanoes. Geology 35:539-542.
Walter, T., Wang, R., Zimmer, M., Grosser, H., Luhr, B., and Ratdomopurubo, A., 2007, Volcanic activity influenced by tectonic earthquake: static and dynamic stress triggering at Mt. Merapi. Geophysical Research Letters 34:L05304.
Walter, T., Wang, R., Acocella, V., Neri, M., Grosser, H., and Zschau, J., 2009, Simultaneous magma and gas eruptions at three volcanoes in southern Italy: an earthquake trigger? Geology 37:251-254.
Geological Summary. The conical form of Fujisan, Japan's highest and most noted volcano, belies its complex origin. The modern postglacial stratovolcano is constructed above a group of overlapping volcanoes, remnants of which form irregularities on Fuji's profile. Growth of the Younger Fuji volcano began with a period of voluminous lava flows from 11,000 to 8000 years before present (BP), accounting for four-fifths of the volume of the Younger Fuji volcano. Minor explosive eruptions dominated activity from 8000 to 4500 BP, with another period of major lava flows occurring from 4500 to 3000 BP. Subsequently, intermittent major explosive eruptions occurred, with subordinate lava flows and small pyroclastic flows. Summit eruptions dominated from 3000 to 2000 BP, after which flank vents were active. The extensive basaltic lava flows from the summit and some of the more than 100 flank cones and vents blocked drainages against the Tertiary Misaka Mountains on the north side of the volcano, forming the Fuji Five Lakes, popular resort destinations. The last confirmed eruption of this dominantly basaltic volcano in 1707 was Fuji's largest during historical time. It deposited ash on Edo (Tokyo) and formed a large new crater on the east flank.
Information Contacts: National Research Institute for Earth Science and Disaster Prevention (NIED), 3-1 Tennodai, Tsukuba-shi, Ibaraki-ken, 305, Japan (URL: http://www.bosai.go.jp); Japan Meteorological Agency (JMA), Volcanological Division, 1-3-4 Ote-machi, Chiyoda-ku, Tokyo 100, Japan (URL: http://www.jma.go.jp/); Volcano Research Center, Earthquake Research Institute (ERI), University of Tokyo, Yayoi 1-1-1, Bunkyo-ku, Tokyo 113-0032, Japan (URL: http://www.eri.u-tokyo.ac.jp/VRC/index_E.html).