Report on Colima (Mexico) — April 2013
Bulletin of the Global Volcanism Network, vol. 38, no. 4 (April 2013)
Managing Editor: Richard Wunderman.
Colima (Mexico) Microearthquakes leading to January 2013 explosions ending 18 month calm
Please cite this report as:
Global Volcanism Program, 2013. Report on Colima (Mexico) (Wunderman, R., ed.). Bulletin of the Global Volcanism Network, 38:4. Smithsonian Institution. https://doi.org/10.5479/si.GVP.BGVN201304-341040
Colima
Mexico
19.514°N, 103.62°W; summit elev. 3850 m
All times are local (unless otherwise noted)
One and a half years of calm at Colima volcano ended after explosive events starting on 6 January 2013. A sequence of January explosions cored out the previous dome and generated pyroclastic flows that reached 2.8 km W of the dome. As discussed in our previous report (BGVN 36:03) the 1998-2011 effusive-to-explosive eruption at Colima ended in June 2011, leaving in the crater an andesitic lava dome constructed during 2007-2011 extrusions stage (see BGVN 36:03). During the subsequent 1.5 years of calm, seismicity dropped and all visible signs of dome growth ceased.
We begin with an abstract that describes the end date of the previous eruptive 2007-2011 interval: 21 June 2011. Next we present a synthesis of a new series of eruption that started in 2013, sent to us in a report from the Colima Volcano Observatory, a report emphasizing both morphologic changes to the dome as a result of the January 2013 explosions and the seismic record associated with those explosions. We follow that submission with information from other sources including news coverage. Colima was the centerpiece at the recent Cities on Volcanoes meeting held in the city of Colima, Mexico in November 2012. At that stage the volcano still remained quiet.
2011 eruption's end date. The missing ingredient in many assessments of eruptions with declining, drawn out waning stages is often the last date of eruption prior to repose. Precise start dates are common, but end dates are not, restricting the precision of eruptive duration. Fortunately, increasing numbers of instrument- and satellite-aided techniques have emerged to help document eruption end dates. Salzer and others (2013) used satellite InSar deformation data coupled with a web camera to assess 21 June 2011 as Colima's final eruption in the 2007-2011 dome extrusion episode. They noted that "measuring deformation in the region of the crater is important to determine the rate of the ongoing eruption and the stability of the dome. The latter part of their abstract follows.
"The activity in the summit region has been recorded by a video monitoring system installed by the University of Colima volcano observatory. We have analysed the optical camera data obtained between February and June 2011 using spatial digital image correlation techniques. We show that the velocity of dome extrusion varies strongly on a daily basis, reaching up to 3m/day, and then systematically decreased over the following months. Deformation was barely above the detection threshold of 30cm/day in the weeks prior to June 21st, when a significant explosion occurred, removing part of the dome. Camera data recorded after this event does not show any displacements, possibly due to the low spatial resolution of the camera data.
"In order to analyse slower deformation processes, we have acquired TerraSAR-X data in spotlight mode for ascending and descending tracks over Colima, obtaining a high spatial resolution of up to 2 m, and a temporal resolution of up to 11 days. In combination with a high resolution digital elevation model, the InSAR data allow the detection of modifications of the dome at a resolution that is two orders of magnitude below the detection threshold of the cameras. The different temporal and spatial scales of deformation detectable by camera and radar monitoring (metre to centimetre, respectively), highlight the benefit of combining these methods to observe the full range of activites at Colima. The results reveal that explosions may occur suddenly after a period of declined dome growth."
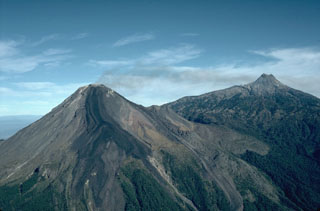
Eruptions resume in January 2013. Figure 101(A) shows the dome as seen on 9 March 2012 in the midst of the year and a half interval of quiet when all visible and available geophysical signs of dome growth remained absent. In contrast, figure 101(B) shows the scene after eruptions resumed, starting with explosions on 6 January 2013. There developed both a depression in the dome's summit and some large ejecta perched near that crater's rim. The photo was taken on 31 January after a sequence of explosive events on 6, 13, and 29 January.
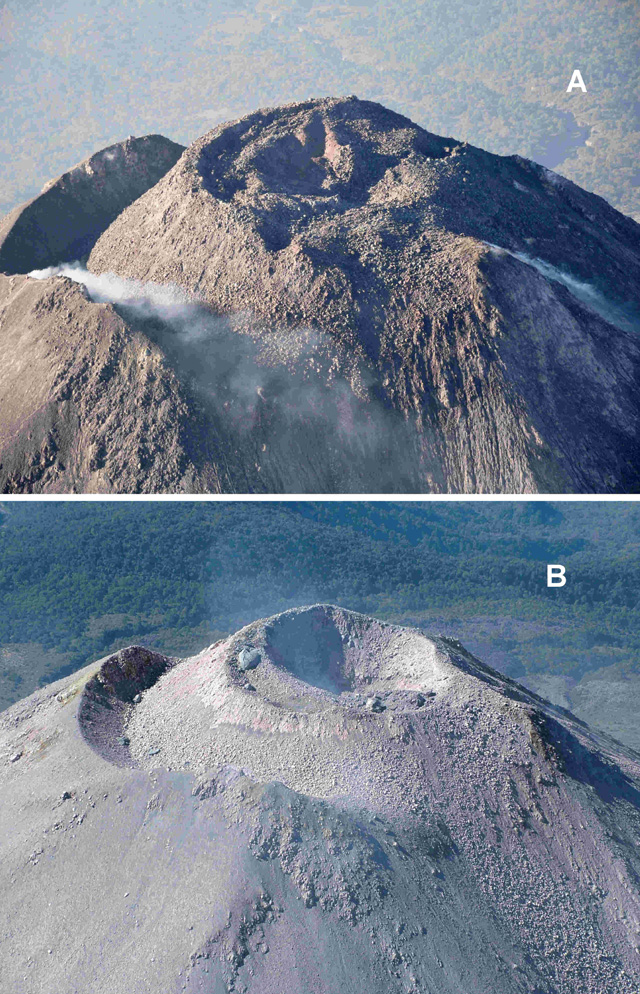 |
Figure 101. (a) The lava dome that was formed in the crater of Colima volcano during the 2007-2011 activity, as seen from the air on 9 March 2012. Few if any documented changes were seen here during June 2011 and prior to the 6 January 2013 explosion. (b) A photograph taken on 31 January 2013 from a perspective somewhat similar to the adjacent photo. The dome had resumed eruption by this time, resulting in a restructuring of the upper part of the dome's surface morphology and a more pronounced circular crater at the dome's crown. Large blocks prominent on the inner rim are from the new activity. Photos from (a) Facultad de Ciencias, Universitad de Colima, and (b) taken during a flight by the Civil Protection of Jalisco State and acquired by the Colima Volcano Observatory. |
The January explosions cored out and partly destroyed the 2007-2011 lava dome. Figure 101(B) shows the new crater that was formed within this old lava dome. The volume of this new crater was estimated at about 250,000 m3. During the explosions, a new lava dome began to grow in the new crater with an initial eruption of ˜0.14 m3/s. The January eruptions generated pyroclastic flows that reached 2.8 km W of the dome.
No precursory volcano-tectonic earthquakes or deformation signals were recorded prior to the January sequences. On the other hand, sequences of numerous microearthquakes (pulgas) occurred preceding the largest explosive events. This is shown in the 6 January seismic data presented in figure 102.
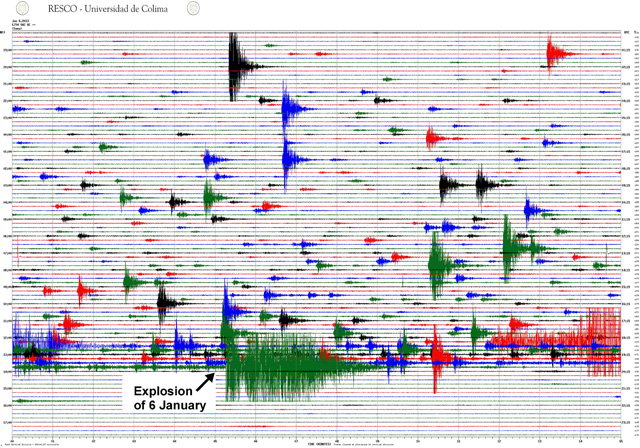 |
Figure 102. A seismogram containing the 24 hour interval of 6 January 2013 record from a short period instrument located 1.9 km from Colima's crater (vertical lines show 1 min time intervals; horizontal lines correspond to local time zone at left and UTC at right). Note the abundance of microearthquakes of many sizes prior to the explosion. After that explosion, microearthquakes in this amplitude range essentially ceased during the rest of the day. Courtesy of Colima Volcano Observatory. |
Figure 103 shows the 29 January explosion as viewed from video station Nevado installed 5.3 km N of Colima's crater.
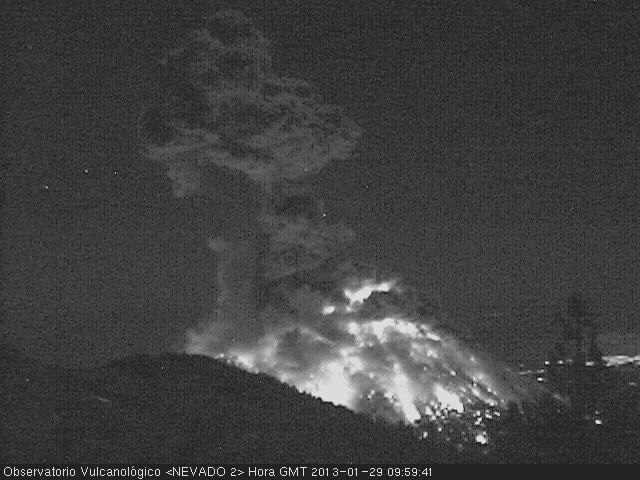 |
Figure 103. Image made during the explosion of 29 January 2013 from Nevado station N of the crater. Incandescent material has splashed over much of the visible dome surfaces. A dark cauliflower-shaped cloud rose above the summit. Courtesy of Colima Volcano Observatory. |
Seismic comparisons. The largest of the explosions in the January eruptive sequence can be compared from seismic records. As noted above, the associated eruptions generated small pyroclastic flows.
Table 19 shows the energy associated with each of the eruptive pulses (6, 13, and 29 January). These results were estimated from the broadband seismic record measured at a distance of 4 km from the crater using the methods described in (Zobin and others, 2009, 2010).
Table 19. Energy of Colima's three largest explosions during January 2013. Courtesy of Colima Volcano Observatory.
| Date | Energy, J |
| 06 Jan 2013 | 7.2 x 10¹⁰ |
| 13 Jan 2013 | 2.3 x 10¹⁰ |
| 29 Jan 2013 | 1.5 x 10¹¹ |
Figure 104 provides another look at Colima seismic data during January 2013. On the upper two of the three plots (A and B), dates of the three explosions (on the 6th, 13th, and 29th) are indicated as black downward pointing arrows and the key to the seismic signals is shown. Figure 104(A) shows the number of microearthquakes, with in all three cases numbers of events increasing with approach to the explosions. For the first two eruptions, the peaks in microearthquakes coincided with the eruption. For the third microearthquake, on the 29th, counts rose rapidly and peaked prior to the eruption. The counts decreased after the eruption (figure 104(B)).
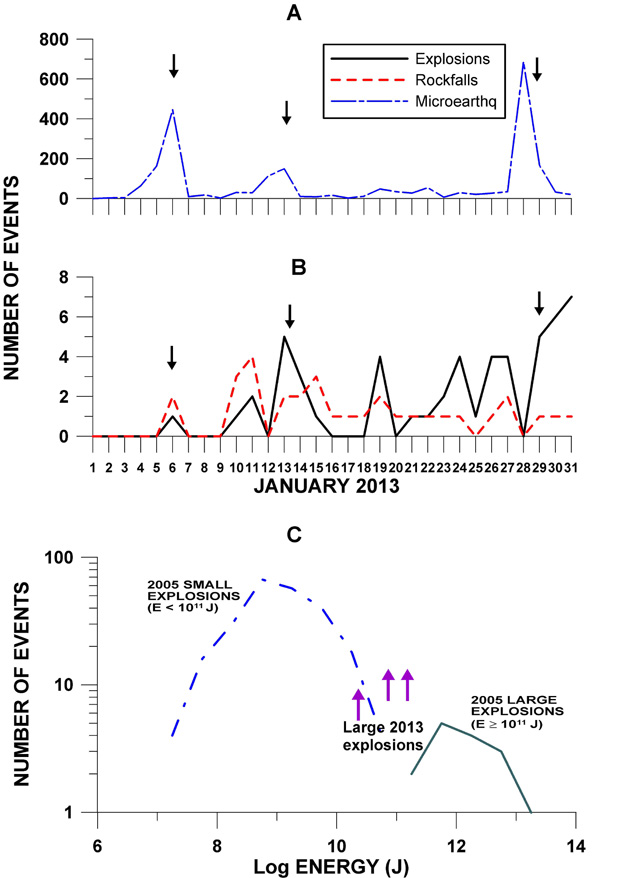 |
Figure 104. Plots of seismicity and energy associated with Colima's explosive sequence of January 2013. (A and B) Variations with time in the number of events recorded by a highly sensitive broadband station 1.9 km from the crater. Arrows in A and B show the appearance of three large explosions. (A) Microearthquakes plotted here resulted from processing, where the seismic records were filtered between 1 and 50 Hz to better see seismic events of high frequency and small amplitude. (B) The number of seismic signals indicative of small explosions, rock falls, and pyroclastic density currents. Several peaks occurred-some coincident and others not coincident with the three marked explosions. (C) A plot of log number of events versus log energy to compare the energy of the three largest explosions of the January 2013 sequence (colored, up-pointing arrows) with the computed energy distributions of the small and large explosive events recorded during the 2005 explosive stage. Courtesy of Colima Volcano Observatory. |
Figure 104(B) indicates that there were multiple seismically inferred explosions, on the three noted days, as well as on other days. For example, starting at left on Figure 104(B) one sees a progression from the 6th, 1 explosion; to the 10th and 11th, 1 and 2 explosions respectively. The largest number shown was associated with the arrow indicating the explosion on the 29th, 5 explosions, in a sequence escalating to 7 on the 31st (last data on the plot).
Figure 104(C) plots the energy of the three largest explosions of the January 2013 sequence (at the tips of the colored arrows aiming upwards). The two other fields on the plot show the energy distributions of small and large explosive events recorded during 2005 at Colima (Zobin and others, 2010). Thus, figure 104(C) shows that, for events assessed at Colima and in terms of seismically detected energy, the 2013 events may be considered as small to intermediate in size.
News reports. According to news articles, a scientific advisory committee reported the 6 January 2013 eruption from Colima, saying that it ejected tephra and an ash plume that rose ˜2 km above the crater. Ash fell on residents near Ciudad Guzmán, tens of kilometers NE of the volcano. Visitors were evacuated from the Nevado de Colima national park, which contains both Nevado de Colima and the active Volcan de Colima.
During the explosion of 29 January, residents up to 20 km away reported a loud noise, shaking ground, and rattling windows. Colima ejected incandescent material. According to the Washington Volcanic Ash Advisory Center (VAAC), on the 29th an ash plume rose ˜2.5 km above the crater. Based on analyses of satellite imagery, the VAAC reported that the ash plume drifted 55 km NE at an uncertain altitude to a distance of 150 km from the volcano.
References: Salzer , J, Walter , T, Legrand , D, Breton , M, and Reyes , G, 2013, Multiscale deformation monitoring at Colima Volcano using TerraSAR-X interferometry and camera observations, EGU General Assembly Conference Abstracts (2013), vol. 15, pp. 9290.
Zobin, VM, Reyes, GA, Guevara, E, 2, and Bretón, M, 2009, Scaling relationship for Vulcanian explosions derived from broadband seismic signals, J. Geophys. Res., vol. 114, B3, March 2009. DOI: 10.1029/2008JB005983.
Zobin, VM, Melnik, O E, González, M, Macedo, O and Bretón, M, 2010, Swarms of microearthquakes associated with the 2005 Vulcanian explosion sequence at Volcán de Colima, México. Geophysical Journal International, vol. 182, issue 2, pp. 808-828. doi: 10.1111/j.1365-246X.2010.04647.
Geological Summary. The Colima complex is the most prominent volcanic center of the western Mexican Volcanic Belt. It consists of two southward-younging volcanoes, Nevado de Colima (the high point of the complex) on the north and the historically active Volcán de Colima at the south. A group of late-Pleistocene cinder cones is located on the floor of the Colima graben west and east of the complex. Volcán de Colima (also known as Volcán Fuego) is a youthful stratovolcano constructed within a 5-km-wide scarp, breached to the south, that has been the source of large debris avalanches. Major slope failures have occurred repeatedly from both the Nevado and Colima cones, producing thick debris-avalanche deposits on three sides of the complex. Frequent recorded eruptions date back to the 16th century. Occasional major explosive eruptions have destroyed the summit (most recently in 1913) and left a deep, steep-sided crater that was slowly refilled and then overtopped by lava dome growth.
Information Contacts: Observatorio Vulcanologico de la Universidad de Colima (Colima Volcanological Observatory), Calle Manuel Payno, 209 Colima, Col., 28045 Mexico (URL: http://www.ucol.mex/volc/);Facultad de Ciencias, Universidad de Colima; Washington Volcanic Ash Advisory Center (VAAC), NOAA Science Center Room 401, 5200 Auth road, Camp Springs, MD 20746, USA (URL: http://www.ospo.noaa.gov/Products/atmosphere/vaac/).