Report on Reventador (Ecuador) — November 2017
Bulletin of the Global Volcanism Network, vol. 42, no. 11 (November 2017)
Managing Editor: Edward Venzke.
Edited by A. Elizabeth Crafford.
Reventador (Ecuador) Ongoing ash emissions, block avalanches, and pyroclastic flows through December 2016
Please cite this report as:
Global Volcanism Program, 2017. Report on Reventador (Ecuador) (Crafford, A.E., and Venzke, E., eds.). Bulletin of the Global Volcanism Network, 42:11. Smithsonian Institution. https://doi.org/10.5479/si.GVP.BGVN201711-352010
Reventador
Ecuador
0.077°S, 77.656°W; summit elev. 3562 m
All times are local (unless otherwise noted)
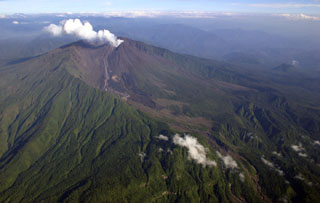
The andesitic Volcán El Reventador lies well east of the main volcanic axis of the Cordillera Real in Ecuador and has historical observations of eruptions with numerous lava flows and explosive events going back to the 16th century. The largest historical eruption took place in November 2002 and generated a 17-km-high eruption cloud, pyroclastic flows that traveled 8 km, and several lava flows. Eruptive activity has been continuous since 2008. From January-April 2016, monthly eruptive activity included ash plumes, pyroclastic flows, and ejected incandescent blocks (BGVN 42:07), along with a lava flow observed in January. Similar ongoing activity during May-December 2016 is described below with information provided by the Instituto Geofisico-Escuela Politecnicia Nacional (IG-EPN) of Ecuador, and the Washington Volcanic Ash Advisory Center (VAAC).
Ash emissions and incandescent blocks traveling down all the flanks of Reventador persisted throughout May-December 2016 (table 8, figure 56). Ash emissions averaged 12 or 13 per month, although they were only observed during clear days. Emission heights were generally less than 1,000 m above the 3,210-m-high summit, but they were reported at 2 km above the summit once in May, several times in November, and once in December. Incandescent blocks were mostly reported traveling 800-1,500 m down the flanks, although larger events during September sent them as far as 2.2 km. Pyroclastic flows were much less common, reported three times in May, twice in September, and twice in December. A single lava flow was noted in November 2016.
Table 8. Number of eruptive events at Reventador during May-December 2016. Reported events include ash emissions, observations of incandescent blocks traveling down the flanks, and pyroclastic flows. The number of clear days per month during which these observations were made is shown in the right hand column. Information from IG daily reports.
| Month | Ash Emissions | Incandescent Blocks | Pyroclastic Flows | Clear Days |
| May 2016 | 10 | 12 | 3 | 22 |
| Jun 2016 | 5 | 9 | 0 | 13 |
| Jul 2016 | 14 | 7 | 0 | 22 |
| Aug 2016 | 13 | 7 | 0 | 23 |
| Sep 2016 | 11 | 19 | 2 | 25 |
| Oct 2016 | 10 | 14 | 0 | 26 |
| Nov 2016 | 18 | 11 | 0 | 27 |
| Dec 2016 | 20 | 4 | 2 | 23 |
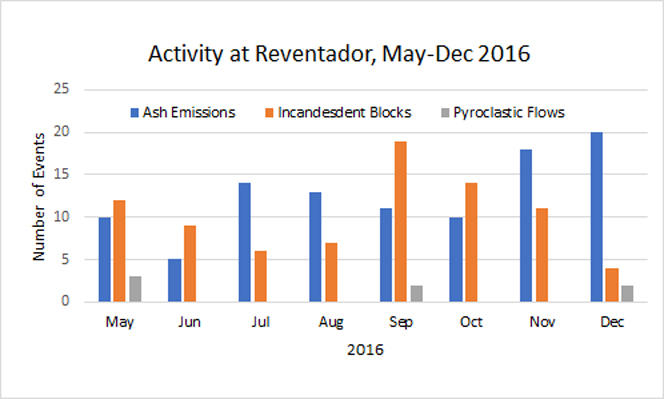 |
Figure 56. Chart showing numbers of emission events per month at Reventador, May-December 2016. Reported events include ash emissions (blue), incandescent blocks rolling down the flanks (orange) and pyroclastic flows (gray). Data from IG daily reports. Numbers include observations on clear days only, not every day of the month. Number of clear days per month are shown in table 8. |
Thermal anomalies recorded by the MIROVA system at Reventador showed that the nature of the ongoing eruptive activity during May-December 2016 included significant sources of heat (figure 57). Moderate to high heat levels of thermal anomalies were recorded numerous times every month during the period.
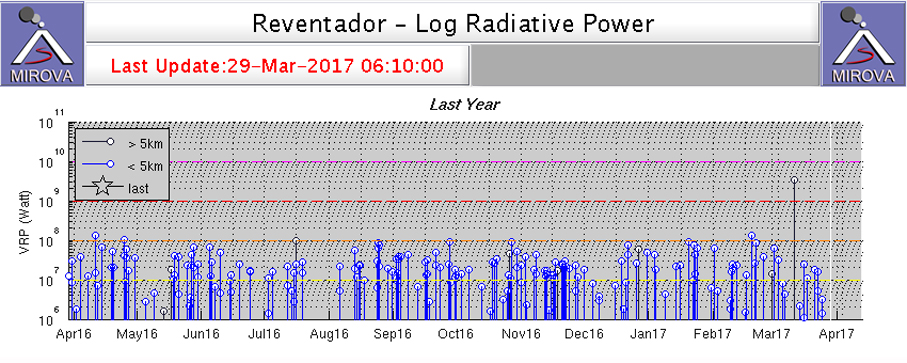 |
Figure 57. Thermal anomalies were persistent at Reventador for the year ending 29 March 2017. Activity was variable, but power output remained largely in the moderate to high value range with anomalies reported every week. Courtesy of MIROVA. |
Incandescent blocks descended the flanks on 12 days during May 2016, typically to distances between 1-1.5 km; the NE, S, and SE flanks were most affected. IG reported ash emissions during ten days of the month, rising 300-1,500 m above the summit crater, except for a 2,000-m-high plume reported on 25 May. The prevailing winds sent the plumes to the NW or SW. The Washington VAAC observed ash emissions in satellite imagery at 4.6 km altitude (1 km above the summit) on 27 May extending 10 km WNW from the summit. On 30 May, they observed ash emissions extending both N and S at 7 km altitude. Pyroclastic flows descended the flanks three times; 1.5 km down the SE flank on 18 May, 1 km down the SE flank on 24 May, and 2 km down the SW flank on 25 May.
During fieldwork from 8 to 10 June 2016, IG staff working near the base of Reventador witnessed persistent activity, noting a 2-km-high ash plume on 9 June (figure 58) and audible sounds. They also reported evidence of recent pyroclastic flows visible primarily on the N and S flanks, and fine gray ash covering vegetation within the E and NE sides of the summit caldera (figure 59).
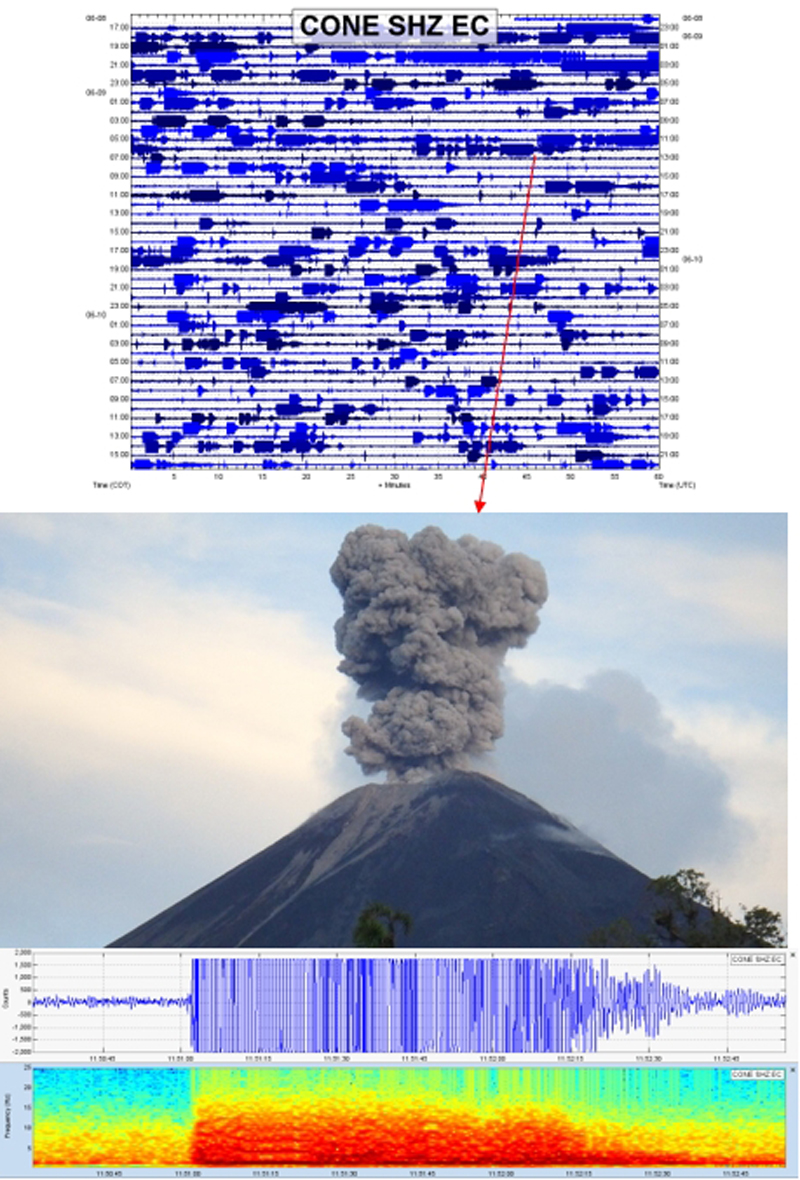 |
Figure 58. Photo showing Reventador erupting on 9 June 2016, along with the coincident seismic and spectral signals from the eruption. The 2-km-high plume was dense with ash. View from the SW flank. Photo by G. Viracucha, courtesy of IG (Actividad superficial del Volcan el Reventador, 24 Junio 2016). |
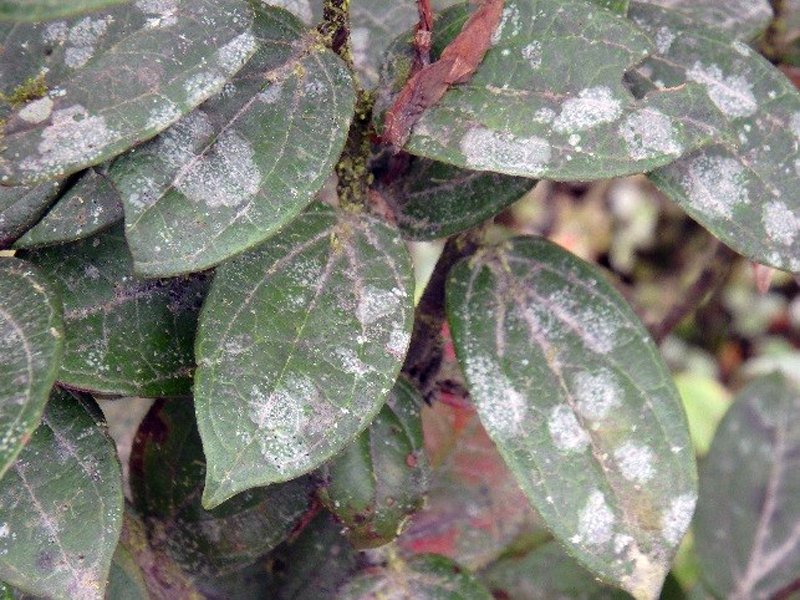 |
Figure 59. Vegetation covered with fine gray ash inside the summit caldera at Reventador during 8-10 June 2016. Photo by G. Viracucha, courtesy of IG-EPN (Actividad superficial del Volcan el Reventador, 24 Junio 2016). |
The weather during June 2016 prevented visual observations of activity during 17 days of the month. Even so, IG reported nine observations of incandescent blocks travelling 800-1,500 m down most of the flanks, and five observations of ash emissions, most of them rising only a few hundred meters above the summit. The Washington VAAC reported an ash emission at 6.7 km altitude (3.5 km above the summit) visible in clear satellite imagery on 5 June. It was drifting W about 75 km from the summit. They also noted a small emission of possible ash at 4.9 km altitude drifting W the next day. IG reported a plume on 10 June at 1,500 m above the summit drifting NW.
Persistent activity during July and August 2016 included 14 and 13 reports of ash emissions, respectively, and 6 and 7 reports of incandescent blocks from the summit. The ash emissions ranged from 300-800 m above the summit in July and 100-1,000 m above the summit during August. The incandescent blocks traveled down all the flanks at various times to distances up to 1,000 m from the summit. The Washington VAAC reported that satellite imagery on 16 July showed a possible ash cloud centered 30 km W of the summit at 4.6 km altitude. On 8 August they observed an ash emission in multi-spectral imagery moving WNW extending about 35 km from the summit at 6.1 km altitude. Another plume the next day was picked up in multi-spectral imagery at 5.2 km altitude the same distance from the summit.
Activity generating incandescent blocks down the flanks increased during September 2016, and was reported on 19 days. Most reports indicated blocks travelling 1,000 m down several different flanks. Larger events during 19-20 September sent blocks 2,000-2,200 m down the SW and SE flanks. Ash emissions were reported ten times by IG during the month, with plume heights ranging from 200 to 1,200 m above the summit. The Washington VAAC only reported a single ash emission rising to 4.3 km altitude and drifting SE on 8 September. Two pyroclastic flows traveled down the SE flank; on 14 September one traveled 1,800 m, and on 19 September one traveled 1,500 m.
During October 2016, there were 10 ash emission events and 14 incandescent block events; during November, there were 18 ash events and 11 incandescent block events. Ash plume heights above the crater during October were all under 1,000 m, but several rose as high as 2 km during 12-17 November. The Washington VAAC reported an ash emission at 3.9 km altitude on 20 October moving WNW about 25 km from the summit. They also observed a hotpot in satellite imagery the same day. On 31 October, they observed two diffuse ash emissions extending 30 km NW from the summit at 5.8 km altitude. A lava flow extended 300 m down the SE flank on 26 November.
Ash emissions were reported by IG on 20 days during December, the most for this reporting period. Plume heights ranged from 400 to 2,000 m above the summit crater, usually drifting W or NW. Incandescent blocks were only reported four times. Except for 13 December when they traveled 1,500 m down the SSW flank, they traveled 800 m down various flanks. The ash emission reported by the Washington VAAC on 9 December was moving SW near 6.1 km altitude. Other VAAC reports during December indicated only puffs of gas with minor volcanic ash noted in the webcam. Pyroclastic flows were reported on 9 and 26 December.
Geological Summary. Volcán El Reventador is the most frequently active of a chain of Ecuadorian volcanoes in the Cordillera Real, well east of the principal volcanic axis. The forested, dominantly andesitic stratovolcano has 4-km-wide avalanche scarp open to the E formed by edifice collapse. A young, unvegetated, cone rises from the amphitheater floor to a height comparable to the rim. It has been the source of numerous lava flows as well as explosive eruptions visible from Quito, about 90 km ESE. Frequent lahars in this region of heavy rainfall have left extensive deposits on the scarp slope. The largest recorded eruption took place in 2002, producing a 17-km-high eruption column, pyroclastic flows that traveled up to 8 km, and lava flows from summit and flank vents.
Information Contacts: Instituto Geofísico (IG), Escuela Politécnica Nacional, Casilla 17-01-2759, Quito, Ecuador (URL: http://www.igepn.edu.ec/); Washington Volcanic Ash Advisory Center (VAAC), Satellite Analysis Branch (SAB), NOAA/NESDIS OSPO, NOAA Science Center Room 401, 5200 Auth Rd, Camp Springs, MD 20746, USA (URL: www.ospo.noaa.gov/Products/atmosphere/vaac, archive at: http://www.ssd.noaa.gov/VAAC/archive.html); MIROVA (Middle InfraRed Observation of Volcanic Activity), a collaborative project between the Universities of Turin and Florence (Italy) supported by the Centre for Volcanic Risk of the Italian Civil Protection Department (URL: http://www.mirovaweb.it/); NASA Goddard Space Flight Center (NASA/GSFC), Global Sulfur Dioxide Monitoring Page, Atmospheric Chemistry and Dynamics Laboratory, 8800 Greenbelt Road, Goddard, Maryland, USA (URL: http://so2.gsfc.nasa.gov/index.html).